Embed Size (px)
Citation preview
Annual Pay Gap Survey
Pay Gap betweenCEOs and Workers inCanadian Industry,
2014
By Pushpa Kumari
January 2015
Economic Policy Dialogue
About the AuthorPushpa Kumari is a Senior Economist at Economic Policy Dialogue. She is an M A,M Phil, Ph D in Economics. Having Research and teaching experience of more than adecade, she has many publications to her credit.
………………………………………………………………………………………………………
Economic Policy DialogueEconomic Policy Dialogue (EPD) is a Toronto-based independent research organizationthat brings forth the economic policy issues which affect the people, society, business,and environment at national and international level; and also, seeks to put forward thepolicy alternatives through constructive dialogue.
www.epdonline.org
………………………………………………………………………………………………………
DisclaimerViews expressed in this study are of the author only and do not necessarily reflect theopinion of the organization for which this study has been undertaken.
………………………………………………………………………………………………………
© 2015 Economic Policy Dialogue
Reproduction in whole or in part without written permission from the organization isstrictly prohibited.
ii
IndexExecutive Summary of Annual Pay Gap Survey 2014……………………….…….......1 – 2
Introduction.………………………………………………………………………..………..3 – 4
Part 1: Some Observations on CEO Compensation in 2013.…..……………………..4 – 5
Part 2: Pay Gap between CEOs and other Employees in entire Canadian Industry,2013………………………………………………………………………………………….6 – 7
Part 3: Pay Gap between CEOs and Other Employees in various Sectors of CanadianIndustry, 2013…………………………………….........................................................8 – 13
Methodology...................................................................................................................14
Endnotes and Sources..………………………………………………………......................15
List of TablesTable 1: Distribution of (Top Companies’) Total CEO Compensation into Major IndustrialSectors, 2013………………………………………………………………………….…….…..5
Table 2: Pay Averages and Ratios in Canadian Industry, 2007-2013……………...…..…6
Table 3: Sectoral Ranks in Ascending Order, 2013……………..……………………...…11
Table 4: Sectoral Pay Averages and Ratios, 2013………………………………………...12
List of GraphsGraph 1: Percentage Distribution of (Top Companies’) Total CEO Compensation intoMajor Industrial Sectors, 2013......……………………………………………………..……...5
Graph 2: Comparison between Average Annual Pays of a CEO (of Top Companies) andother Employees, 2013……………………………………………………………….………...7
Graph 3: Ratio between Average Annual Pays of a CEO (of Top Companies) and otherEmployees, 2013……………………………………………………………………..…………7
Graph 4: Ratio between Average Annual Pays of a CEO (of Top Companies) and otherEmployees in various Industrial Sectors, 2013……………….…………..………………..13
Pay Gap between CEOs and Workers in Canadian Industry, 2014 EPD Page 1
Executive Summary of Annual Pay Gap Survey 2014
Pay gap survey of 2014 reports the pay gap between CEOs of the top 100 companies
and workers in the Canadian industry as a whole and also in its various sectors during
the fiscal year of 2013. Some of the main points of the 2014 survey are given below:
100 top public companies of 2013 had 102 CEOs; Gerald W. Schwartz of Onex
Corporation was the highest compensation earning CEO ($87,917,026), and V. Prem
Watsa of Fairfax Financial Holdings Ltd. the lowest ($623,820).
These all 102 CEOs received a total compensation pool of $759,037,285 in 2013 which
had increased by about 13 per cent from that of last year.
CEOs of three sectors – Oil & Gas, Materials, and Finance – had grip on the
compensation pool who took away about 54 per cent share of it; however CEOs of all
other nine sectors shared remaining about 46 per cent.
A CEO of these top corporations bagged an average annual compensation of about
$7.4 million, whereas a typical Canadian industry employee earned an average annual
pay of about $47 thousand and an hourly-paid employee about $36 thousand in 2013.
Thus, a CEO earned 157 times than a typical employee and 206 times than an hourly-
paid employee.
For sectoral part, 26 sectors are considered for this year’s survey. Out of all these
sectors, an employee (salaried-&-hourly) and also an hourly employee received the
lowest average annual pay in the Food Service sector (salaried-&-hourly: $17,335;
hourly $14,928); unfortunately these pays decreased from their last year’s level.
Average industrial employees’ (salaried-&-hourly) pay was highest in the Oil and Gas
sector ($119,828), and hourly pay was highest in the Oil & Gas- Support services
($93,970).
Sectoral CEO-employee (salaried-&-hourly) pay gap was analyzed for all 26 industrial
sectors, whereas CEO-hourly employee pay gap for 18 industrial sectors. With respect
to the CEO-employee (salaried-&-hourly) pay ratio: top three sectors with their pay
ratios were Other Financial Investment and Related Activities (350), Retail- General
Pay Gap between CEOs and Workers in Canadian Industry, 2014 EPD Page 2
Stores (257), and Manufacturing- Transport Equipment (212); and three sectors at the
bottom of this pay ratio were Oil & Gas- Support services (26), Forestry and Logging
(39) and Utilities (47). As regards to the CEO-hourly employee pay ratio: top three
sectors were Banking (312) Communication & Media (255), and Manufacturing-
Transport Equipment (233); and three sectors at the bottom were Oil & Gas- Support
services (26), Forestry and Logging (53) and Manufacturing- Wood Product (68).
Where 35% sectors of those given 26 sectors had higher than the national average
CEO-employee pay ratio (157), and 33% sectors of the given 18 sectors had higher
than the national average CEO-hourly employee pay ratio (206). On the other hand,
35% sectors had less than half the national average (<78.5) CEO-employee pay ratio,
and 33% sectors had less than half of the national average CEO-hourly employee pay
ratio (<103).
The most representative case of higher pay gap in 2013 is found to be the Banking
sector as CEO compensation was high across the sector and employees’ pay low.
Some other in the similar lineage are Retail- General Stores, Retail- Food & Beverage
Stores, Professional, scientific and technical services, and Insurance & Related
Activities.
Higher pay ratio is considered a bad sign for any society as it reveals greater pay
differences between CEOs and other employees. However, those cases are really
worse where besides higher pay ratios sectors have also very low employees’ pays, this
year for example: Retail- General Stores, Food Services, and Retail- Food & Beverage
Stores.

Pay Gap between CEOs and Workers in Canadian Industry, 2014 EPD Page 3
Pay Gap between CEOs and Workers inCanadian Industry, 2014
IntroductionA serious discussion has once again been accelerated to revisit the capitalism. As
alongside unprecedented economic prosperity, it has generated self-destroying
outcomes too, like inequality, common goods tragedy, economic crises and social
discontent. Reforming capitalism is also on the discussion and in that direction different
terminologies have been emerging, for example, sustainable capitalism, inclusive
capitalism, conscious capitalism, and moral capitalism.
Going by definition (as suggested by capitalism.org): “Capitalism is a social system
based on the principle of individual rights. Politically, it is the system of laissez-faire(freedom).... Economically, when such freedom is applied to the sphere of production its
result is the free-market.” Obviously, system based on (unlimited or self-regulated)
individual rights, freedom and free market will produce outcomes what self-interest will
dictate. However, self-interest may not always be in sync with larger economic, social,
political, ecological, national, and global interests. Therefore, any system as a whole to
be sustainable would require some limitations; limiting principles will be driven by what
lay the system at risk. Here human greed, egocentrism, recklessness, shortsightedness,
animal spirits etc seem to be at the root causing present day widespread sense of
economic, ecological, social, political crises. Let’s see how ongoing efforts of reviewing
and reforming capitalism handle these root causes.
Pay gap between CEOs and workers, the subject matter of present survey, apparently
looks like a miniscule part of a very large problem. But CEOs being at the center of
modern corporations’ structure-conduct-performance construct, their compensation
issue is integral part of their decision making.
Annual survey 2014 presented here reports pay gap between CEOs and workers in the
Canadian industry as a whole and also in its different sectors during the financial year of
Pay Gap between CEOs and Workers in Canadian Industry, 2014 EPD Page 4
2013. Sectoral level exercise is its uniqueness and, thus, differentiates this work from
other pay gap surveys.
First part will put some observations on the CEO compensation in 2013. Second part
will portray absolute and relative gaps between average annual compensation of a CEO
and average annual earning of a worker for overall Canadian industry. In the third part,
pay gap between CEOs and workers in the various sectors of Canadian industry will be
presented. Methodology and sources of data will be detailed at the end.
Annual compensation of top 100 corporations’ CEOs represents here the pays of
Canadian Industry’s CEOs. And average annual earnings of employees represent the
pays of industry workers. Two types of employees are considered in the survey: one, all
employees that cover salaried and hourly employees; and two, a sub-category of the
former, i.e. hourly employee.
Part 1: Some Observations on CEO Compensation in 2013Pay gap survey obtains CEOs’ compensation from the Globe and Mail 100 top
corporations’ CEOs list. List of 2014 documented compensation of 102 CEOs of 100 top
corporations. Two companies – IGM Financial and Power Corporation of Canada – had
two CEOs each; these companies consistently have two CEOs each since the
beginning of our pay gap work in 2010.
Top three CEOs as per their compensation were: Gerald W. Schwartz of Onex
Corporation topped having earned $87,917,026, Nadir Mohamed of Rogers
Communications Inc. being second with $26,769,973, and Michael M. Wilson of Agrium
Inc. third with $23,818,740.
These 102 CEOs received a total compensation pool of $759,037,285 in 2013. Total
compensation amount increased by about 13 per cent from that in 2012 when all the 98
CEOs received a total compensation pool of $673,763,184. Year 2013 saw the largest
increase in the cumulative compensation pool since 2008 (Table 2, column 4), factors
like better economy and number of CEOs in the list might have been responsible.
To see the sectoral distribution of total compensation pool, all the 102 corporations were
divided into 12 major sectors and presented here in the Table 1 and Graph 1. Three
Pay Gap between CEOs and Workers in Canadian Industry, 2014 EPD Page 5
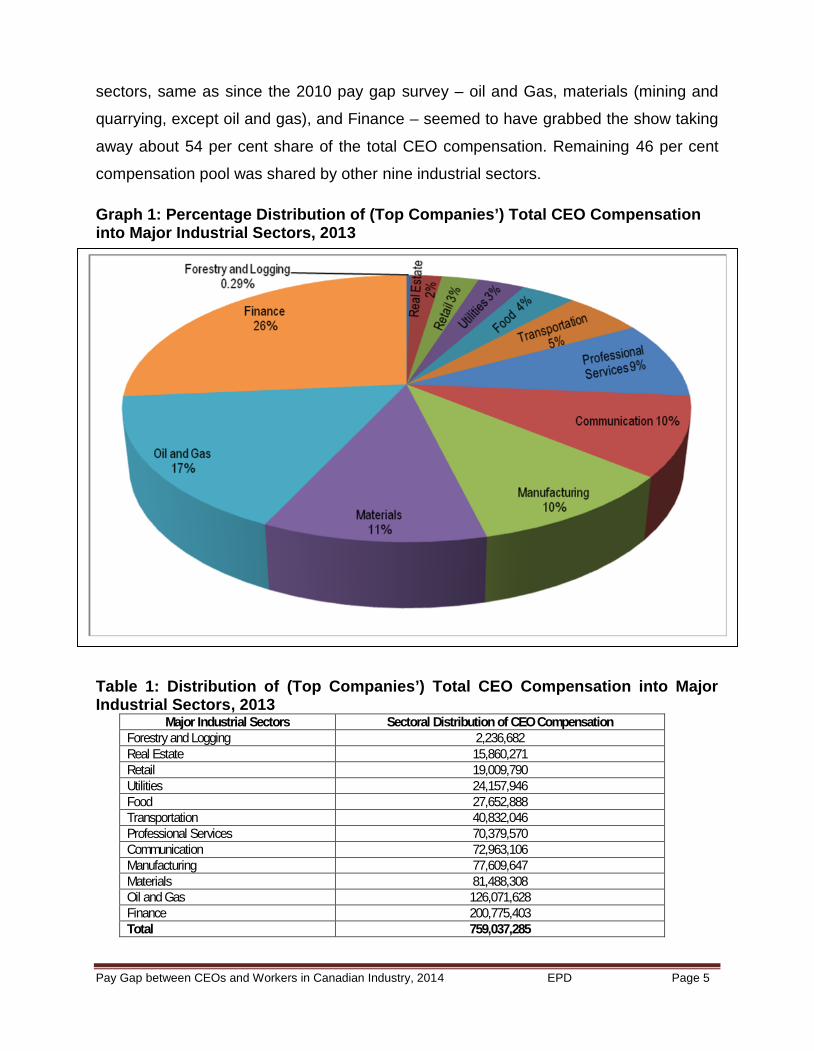
sectors, same as since the 2010 pay gap survey – oil and Gas, materials (mining and
quarrying, except oil and gas), and Finance – seemed to have grabbed the show taking
away about 54 per cent share of the total CEO compensation. Remaining 46 per cent
compensation pool was shared by other nine industrial sectors.
Graph 1: Percentage Distribution of (Top Companies’) Total CEO Compensationinto Major Industrial Sectors, 2013
Table 1: Distribution of (Top Companies’) Total CEO Compensation into MajorIndustrial Sectors, 2013
Major Industrial Sectors Sectoral Distribution of CEO CompensationForestry and Logging 2,236,682Real Estate 15,860,271Retail 19,009,790Utilities 24,157,946Food 27,652,888Transportation 40,832,046Professional Services 70,379,570Communication 72,963,106Manufacturing 77,609,647Materials 81,488,308Oil and Gas 126,071,628Finance 200,775,403Total 759,037,285
Pay Gap between CEOs and Workers in Canadian Industry, 2014 EPD Page 6
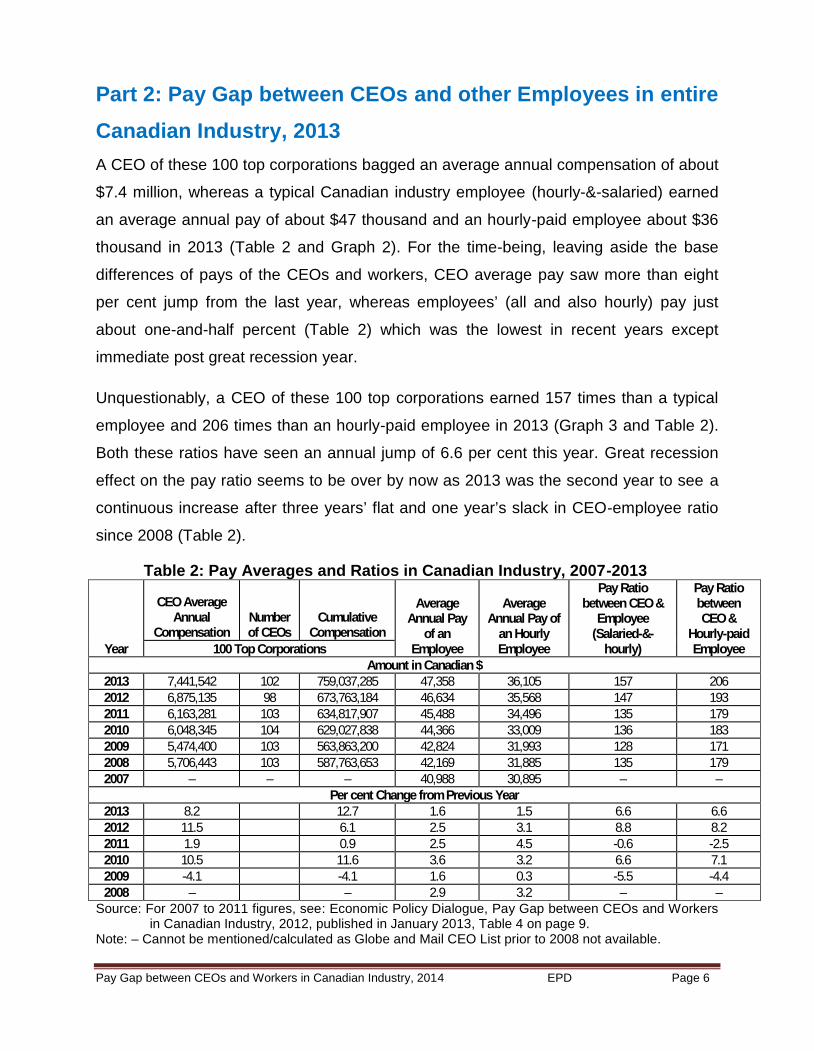
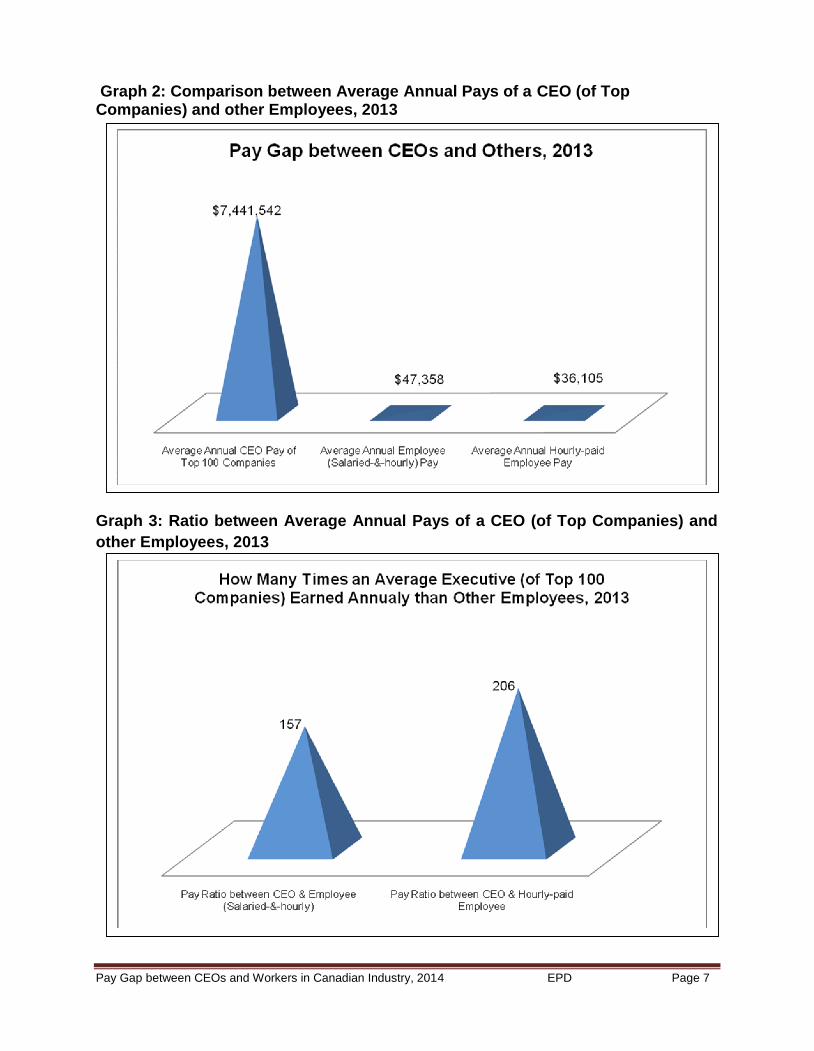
Part 2: Pay Gap between CEOs and other Employees in entireCanadian Industry, 2013A CEO of these 100 top corporations bagged an average annual compensation of about
$7.4 million, whereas a typical Canadian industry employee (hourly-&-salaried) earned
an average annual pay of about $47 thousand and an hourly-paid employee about $36
thousand in 2013 (Table 2 and Graph 2). For the time-being, leaving aside the base
differences of pays of the CEOs and workers, CEO average pay saw more than eight
per cent jump from the last year, whereas employees’ (all and also hourly) pay just
about one-and-half percent (Table 2) which was the lowest in recent years except
immediate post great recession year.
Unquestionably, a CEO of these 100 top corporations earned 157 times than a typical
employee and 206 times than an hourly-paid employee in 2013 (Graph 3 and Table 2).
Both these ratios have seen an annual jump of 6.6 per cent this year. Great recession
effect on the pay ratio seems to be over by now as 2013 was the second year to see a
continuous increase after three years’ flat and one year’s slack in CEO-employee ratio
since 2008 (Table 2).
Table 2: Pay Averages and Ratios in Canadian Industry, 2007-2013
Year
CEO AverageAnnual
CompensationNumberof CEOs
CumulativeCompensation
AverageAnnual Pay
of anEmployee
AverageAnnual Pay of
an HourlyEmployee
Pay Ratiobetween CEO &
Employee(Salaried-&-
hourly)
Pay RatiobetweenCEO &
Hourly-paidEmployee100 Top Corporations
Amount in Canadian $2013 7,441,542 102 759,037,285 47,358 36,105 157 2062012 6,875,135 98 673,763,184 46,634 35,568 147 1932011 6,163,281 103 634,817,907 45,488 34,496 135 1792010 6,048,345 104 629,027,838 44,366 33,009 136 1832009 5,474,400 103 563,863,200 42,824 31,993 128 1712008 5,706,443 103 587,763,653 42,169 31,885 135 1792007 – – – 40,988 30,895 – –
Per cent Change from Previous Year2013 8.2 12.7 1.6 1.5 6.6 6.62012 11.5 6.1 2.5 3.1 8.8 8.22011 1.9 0.9 2.5 4.5 -0.6 -2.52010 10.5 11.6 3.6 3.2 6.6 7.12009 -4.1 -4.1 1.6 0.3 -5.5 -4.42008 – – 2.9 3.2 – –
Source: For 2007 to 2011 figures, see: Economic Policy Dialogue, Pay Gap between CEOs and Workersin Canadian Industry, 2012, published in January 2013, Table 4 on page 9.
Note: – Cannot be mentioned/calculated as Globe and Mail CEO List prior to 2008 not available.
Pay Gap between CEOs and Workers in Canadian Industry, 2014 EPD Page 7
Graph 2: Comparison between Average Annual Pays of a CEO (of TopCompanies) and other Employees, 2013
Graph 3: Ratio between Average Annual Pays of a CEO (of Top Companies) andother Employees, 2013
Pay Gap between CEOs and Workers in Canadian Industry, 2014 EPD Page 8
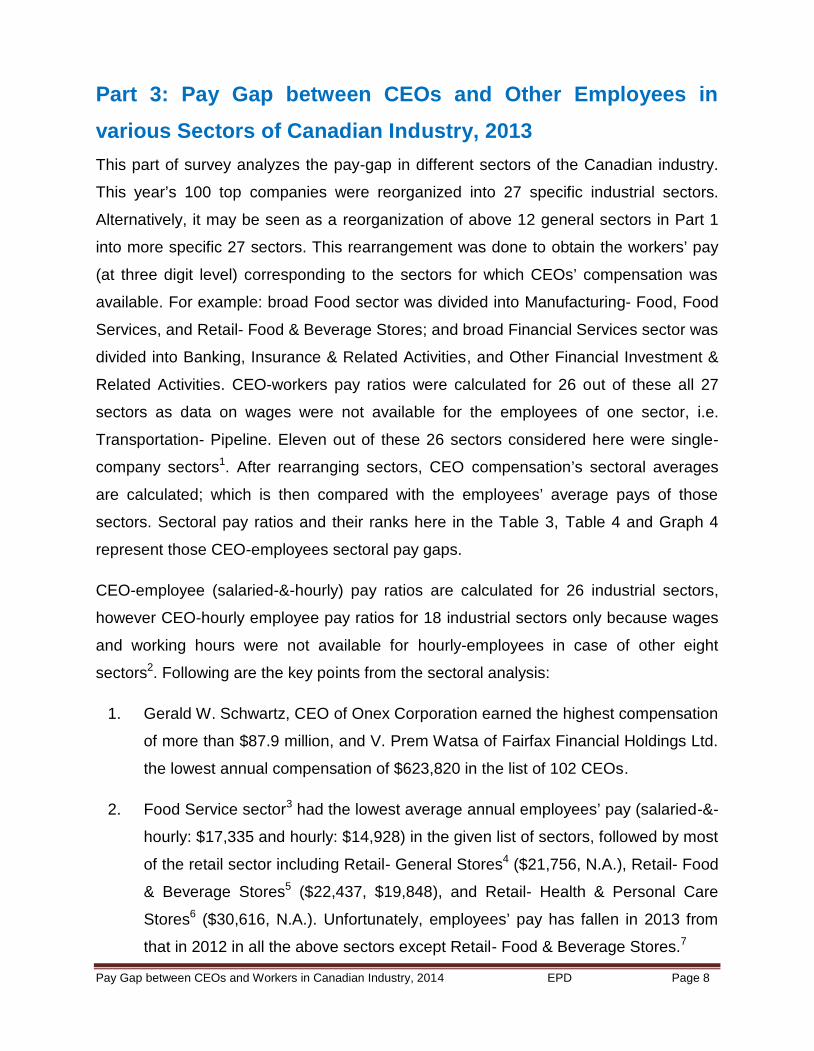
Part 3: Pay Gap between CEOs and Other Employees invarious Sectors of Canadian Industry, 2013This part of survey analyzes the pay-gap in different sectors of the Canadian industry.
This year’s 100 top companies were reorganized into 27 specific industrial sectors.
Alternatively, it may be seen as a reorganization of above 12 general sectors in Part 1
into more specific 27 sectors. This rearrangement was done to obtain the workers’ pay
(at three digit level) corresponding to the sectors for which CEOs’ compensation was
available. For example: broad Food sector was divided into Manufacturing- Food, Food
Services, and Retail- Food & Beverage Stores; and broad Financial Services sector was
divided into Banking, Insurance & Related Activities, and Other Financial Investment &
Related Activities. CEO-workers pay ratios were calculated for 26 out of these all 27
sectors as data on wages were not available for the employees of one sector, i.e.
Transportation- Pipeline. Eleven out of these 26 sectors considered here were single-
company sectors1. After rearranging sectors, CEO compensation’s sectoral averages
are calculated; which is then compared with the employees’ average pays of those
sectors. Sectoral pay ratios and their ranks here in the Table 3, Table 4 and Graph 4
represent those CEO-employees sectoral pay gaps.
CEO-employee (salaried-&-hourly) pay ratios are calculated for 26 industrial sectors,
however CEO-hourly employee pay ratios for 18 industrial sectors only because wages
and working hours were not available for hourly-employees in case of other eight
sectors2. Following are the key points from the sectoral analysis:
1. Gerald W. Schwartz, CEO of Onex Corporation earned the highest compensation
of more than $87.9 million, and V. Prem Watsa of Fairfax Financial Holdings Ltd.
the lowest annual compensation of $623,820 in the list of 102 CEOs.
2. Food Service sector3 had the lowest average annual employees’ pay (salaried-&-
hourly: $17,335 and hourly: $14,928) in the given list of sectors, followed by most
of the retail sector including Retail- General Stores4 ($21,756, N.A.), Retail- Food
& Beverage Stores5 ($22,437, $19,848), and Retail- Health & Personal Care
Stores6 ($30,616, N.A.). Unfortunately, employees’ pay has fallen in 2013 from
that in 2012 in all the above sectors except Retail- Food & Beverage Stores.7
Pay Gap between CEOs and Workers in Canadian Industry, 2014 EPD Page 9
3. Oil and Gas8 had the highest average annual employees’ pay (salaried-&-hourly:
$119,829, hourly: N.A.) in the given list of sectors, followed by Oil & Gas-
Support services9 ($93,058, $93,970), Utilities10 ($85,908, N.A.), Precious
Metals11,12 ($83,930, $74,029), and Real Estate- Engineering & Construction13
($79,095, 75,950). Strangely, hourly pay was greater than employees’ pay for the
Oil & Gas- Support services sector (NAIC 213) in 2013.
4. With respect to the CEO-employee (salaried-&-hourly) pay ratio, out of 26
sectors, Other Financial Investment and Related Activities had the highest pay
ratio of 350, and Oil & Gas- Support services the lowest of 26. As regards to the
CEO-hourly employee pay ratio, in all the 18 industrial sectors for which hourly
data were available, Banking had the highest pay ratio of 312 and the same as
above Oil & Gas- Support services had the lowest pay ratio of 26.
5. Total nine sectors out of given 26 sectors (i.e. 35%) had higher than the national
average CEO-employee (salaried-&-hourly) pay ratio of 157, these are: Other
Financial Investment and Related Activities (350), Retail- General Stores (257),
Manufacturing- Transportation Equipment (212), Communications & Media (208),
Banking (204), Food Services (198), Retail- Food & Beverage Stores (187),
Transportation and Warehousing (172), and Manufacturing- Chemical (164). With
respect to the CEO-hourly employee pay ratio, 6 sectors out of given total 18
sectors (i.e. 33%) have higher than the national average ratio of 206: Banking
(312), Communications & Media (255), Manufacturing- Transportation Equipment
(233), Food Services (230), Manufacturing- Chemical (213), and Retail- Food &
Beverage Stores (211).
6. Sectors with less than half the national average pay ratio were also categorized
to find out which sectors had lower pay ratio. As regards to the CEO-employee
(salaried-&-hourly) pay ratio, 9 sectors (i.e. 35%) had less than half the national
average (<78.5): Oil & Gas- Support services (26), Forestry and Logging (39),
Utilities (47), Oil and Gas (54), Transportation- Air (55), Manufacturing- Wood
Product (62), Real Estate- Engineering & Construction (71), Retail- Health &
Personal Care Stores (72), Real Estate (78). Regarding CEO-hourly employee
Pay Gap between CEOs and Workers in Canadian Industry, 2014 EPD Page 10
pay ratio, 6 sectors (i.e. 33%) had less than half of the national average ratio
(<103): Oil & Gas- Support services (26), Forestry and Logging (53),
Manufacturing- Wood Product (68), Real Estate- Engineering & Construction
(74), Manufacturing- Food (96), and Precious Metals (92).
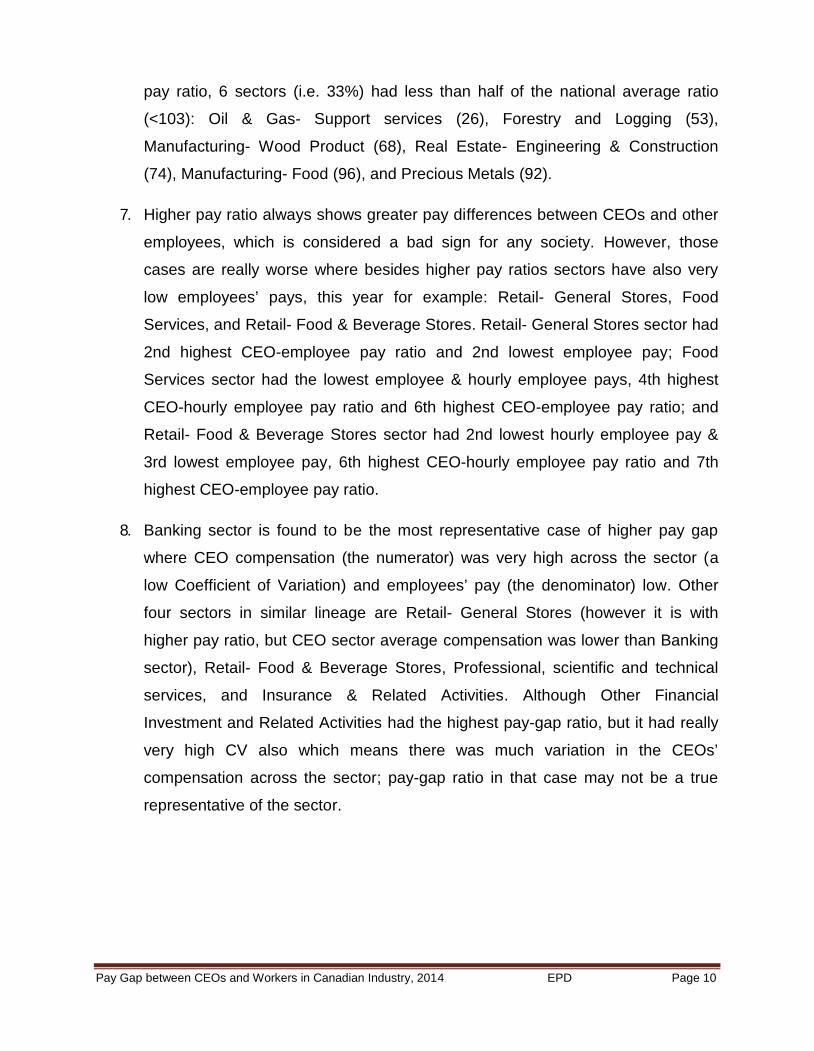
7. Higher pay ratio always shows greater pay differences between CEOs and other
employees, which is considered a bad sign for any society. However, those
cases are really worse where besides higher pay ratios sectors have also very
low employees’ pays, this year for example: Retail- General Stores, Food
Services, and Retail- Food & Beverage Stores. Retail- General Stores sector had
2nd highest CEO-employee pay ratio and 2nd lowest employee pay; Food
Services sector had the lowest employee & hourly employee pays, 4th highest
CEO-hourly employee pay ratio and 6th highest CEO-employee pay ratio; and
Retail- Food & Beverage Stores sector had 2nd lowest hourly employee pay &
3rd lowest employee pay, 6th highest CEO-hourly employee pay ratio and 7th
highest CEO-employee pay ratio.
8. Banking sector is found to be the most representative case of higher pay gap
where CEO compensation (the numerator) was very high across the sector (a
low Coefficient of Variation) and employees’ pay (the denominator) low. Other
four sectors in similar lineage are Retail- General Stores (however it is with
higher pay ratio, but CEO sector average compensation was lower than Banking
sector), Retail- Food & Beverage Stores, Professional, scientific and technical
services, and Insurance & Related Activities. Although Other Financial
Investment and Related Activities had the highest pay-gap ratio, but it had really
very high CV also which means there was much variation in the CEOs’
compensation across the sector; pay-gap ratio in that case may not be a true
representative of the sector.
Pay Gap between CEOs and Workers in Canadian Industry, 2014 EPD Page 11
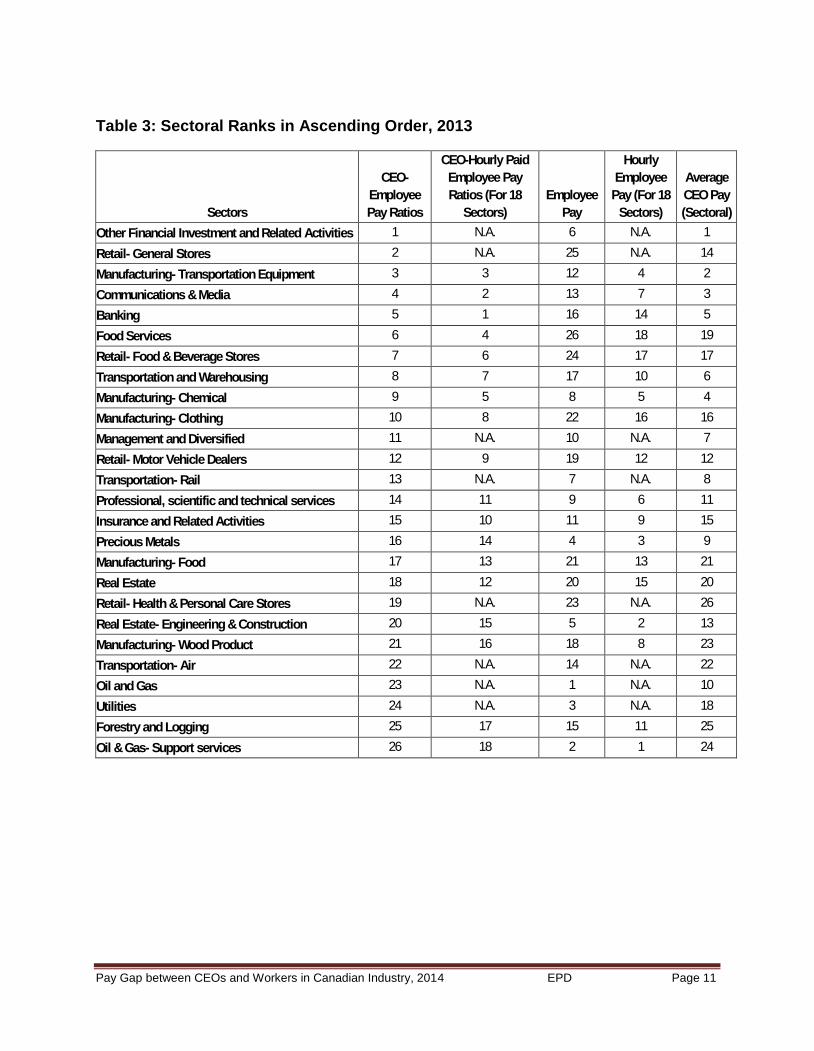
Table 3: Sectoral Ranks in Ascending Order, 2013
Sectors
CEO-EmployeePay Ratios
CEO-Hourly PaidEmployee PayRatios (For 18
Sectors)Employee
Pay
HourlyEmployee
Pay (For 18Sectors)
AverageCEO Pay(Sectoral)
Other Financial Investment and Related Activities 1 N.A. 6 N.A. 1Retail- General Stores 2 N.A. 25 N.A. 14Manufacturing- Transportation Equipment 3 3 12 4 2Communications & Media 4 2 13 7 3Banking 5 1 16 14 5Food Services 6 4 26 18 19Retail- Food & Beverage Stores 7 6 24 17 17Transportation and Warehousing 8 7 17 10 6Manufacturing- Chemical 9 5 8 5 4Manufacturing- Clothing 10 8 22 16 16Management and Diversified 11 N.A. 10 N.A. 7Retail- Motor Vehicle Dealers 12 9 19 12 12Transportation- Rail 13 N.A. 7 N.A. 8Professional, scientific and technical services 14 11 9 6 11Insurance and Related Activities 15 10 11 9 15Precious Metals 16 14 4 3 9Manufacturing- Food 17 13 21 13 21Real Estate 18 12 20 15 20Retail- Health & Personal Care Stores 19 N.A. 23 N.A. 26Real Estate- Engineering & Construction 20 15 5 2 13Manufacturing- Wood Product 21 16 18 8 23Transportation- Air 22 N.A. 14 N.A. 22Oil and Gas 23 N.A. 1 N.A. 10Utilities 24 N.A. 3 N.A. 18Forestry and Logging 25 17 15 11 25Oil & Gas- Support services 26 18 2 1 24

Pay Gap between CEOs and Workers in Canadian Industry, 2014 EPD Page 12
Table 4: Sectoral Pay Averages and Ratios, 2013
Sectors
CEO Pay -Sectoral
Average ($)
CEO Pay –Coefficientof Variation
(CV)
EmployeePay -
SectoralAverage ($)
HourlyEmployee
Pay -Sectoral
Average ($)
AveragePay RatiobetweenCEO &
Employee
Average PayRatio betweenCEO & Hourly
PaidEmployee
Other Financial Investmentand Related Activities 24,800,296 1.70 70,799 N.A. 350 N.A.Retail- General Stores 5,583,970 0.47 21,756 N.A. 257 N.A.Manufacturing- TransportationEquipment 12,872,940 0.73 60,823 55,195 212 233Communications & Media 12,160,518 0.64 58,530 47,620 208 255Banking 10,468,050 0.20 51,271 33,581 204 312Food Services 3,434,060 – 17,335 14,928 198 230Retail- Food & BeverageStores 4,186,626 0.56 22,437 19,848 187 211Transportation andWarehousing 8,700,009 – 50,464 43,809 172 199Manufacturing- Chemical 10,968,503 0.78 66,914 51,441 164 213Manufacturing- Clothing 4,991,054 – 32,919 25,749 152 194Management and Diversified 8,066,265 0.28 65,065 N.A. 124 N.A.Retail- Motor Vehicle Dealers 5,641,322 – 48,215 38,172 117 148Transportation- Rail 7,717,998 0.09 70,443 N.A. 110 N.A.Professional, scientific andtechnical services 6,352,419 0.65 66,251 50,737 96 125Insurance and RelatedActivities 5,537,988 0.75 61,139 43,847 91 126Precious Metals 6,790,692 0.46 83,930 74,029 81 92Manufacturing- Food 3,285,700 – 41,297 34,081 80 96Real Estate 3,410,227 0.51 43,508 28,551 78 119Retail- Health & Personal CareStores 2,200,528 – 30,616 N.A. 72 N.A.Real Estate- Engineering &Construction 5,629,590 – 79,095 75,950 71 74Manufacturing- Wood Product 2,998,700 – 48,732 44,129 62 68Transportation- Air 3,175,601 – 57,455 N.A. 55 N.A.Oil and Gas 6,507,314 0.58 119,829 N.A. 54 N.A.Utilities 4,026,324 0.41 85,908 N.A. 47 N.A.Forestry and Logging 2,236,682 – 56,957 42,421 39 53Oil & Gas- Support services 2,432,670 – 93,058 93,970 26 26Transportation- Pipeline 4,506,813 0.20 N.A. N.A. N.A. N.A.Notes:
N.A. Not Available– Cannot be calculated as these are single-company sectors. For the list, see ‘Note number 2’ ofthe Graph 4.
Pay Gap between CEOs and Workers in Canadian Industry, 2014 EPD Page 13
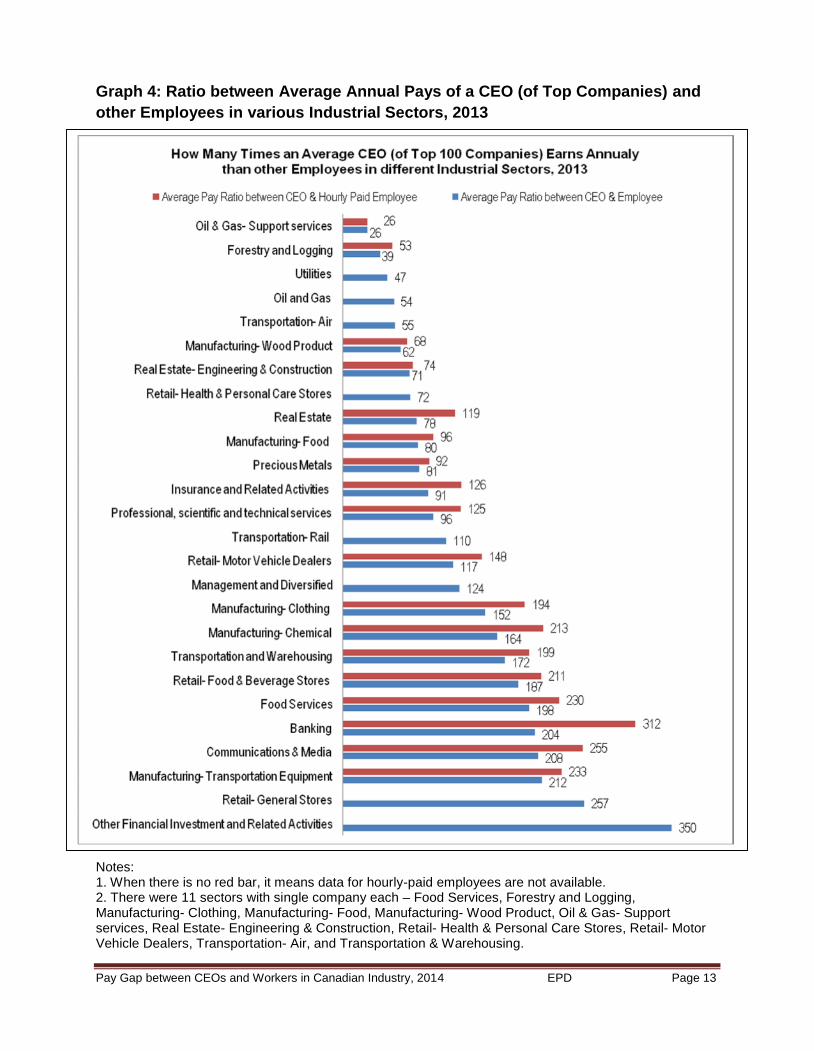
Graph 4: Ratio between Average Annual Pays of a CEO (of Top Companies) andother Employees in various Industrial Sectors, 2013
Notes:1. When there is no red bar, it means data for hourly-paid employees are not available.2. There were 11 sectors with single company each – Food Services, Forestry and Logging,Manufacturing- Clothing, Manufacturing- Food, Manufacturing- Wood Product, Oil & Gas- Supportservices, Real Estate- Engineering & Construction, Retail- Health & Personal Care Stores, Retail- MotorVehicle Dealers, Transportation- Air, and Transportation & Warehousing.
Pay Gap between CEOs and Workers in Canadian Industry, 2014 EPD Page 14
Methodology
Data Sources: Pay gap survey relies on two data sources: Globe and Mail list on
executive compensation and Statistics Canada resources. The former “Executive
compensation: Canada's 100 top-paid CEOs”14 had a table on the ranking of
compensation in fiscal 2013 for CEOs from the 100 largest public companies (by market
capitalization) in Canada’s benchmark S&P/TSX composite index as of Dec. 31, 2013.
CEOs’ total compensation figures include salary, bonus, stock awards, option awards,
pension value, and all other compensation. Three summary tables15 of the Statistics
Canada were used to calculate the pays of workers: industry-wise average weekly
earnings for (hourly-&-salaried) employees, industry-wise average hourly earnings for
hourly employees, and industry-wise average weekly hours for hourly employees.
Another source ‘North American Industry Classification System (NAICS) 2007 –
Canada’ published by Statistics Canada was used to determine the industry
classification16. Three digit level industry classifications were used; when three digit data
was not available, two digit data were relied on (only one such instance, i.e.
‘Transportation and Warehousing’).
Process: For the sectoral CEO and employee pay ratios’ computation, companies were
arranged into more specific 27 sectors on the basis of their type of activity. This
arrangement was done in order to obtain the employees’ wages and working hours (at
three digit level industrial classification) corresponding to the sectors for which CEOs’
compensation was available. For example, Financial Services sector was divided into
Banking, Insurance & Related Activities, and Other Financial Investment & Related
Activities. After rearranging the industrial sectors, data on employees’ wages and
working hours were collected so as to get annual pays of the employees. Two types of
workers were considered in the survey: all employees who comprised of salaried and
hourly employees; and a sub-category of the former, i.e. hourly employees. To calculate
employees’ average annual earnings, weekly earnings were multiplied by 52 weeks
[(weekly earnings)*(52)]. In case of hourly-paid employees, work hours and hourly
earnings were given; therefore, to arrive at average annual earnings, hourly earnings
were multiplied by weekly hours and 52 weeks [(hourly earnings)*(weekly hours)*(52)].
These annual pays were used to calculate the respective pay ratios.

Pay Gap between CEOs and Workers in Canadian Industry, 2014 EPD Page 15
Endnotes and Sources
1 Food Services, Forestry and Logging, Manufacturing- Clothing, Manufacturing- Food, Manufacturing-Wood Product, Oil & Gas- Support services, Real Estate- Engineering & Construction, Retail- Health &Personal Care Stores, Retail- Motor Vehicle Dealers, Transportation- Air, and Transportation &Warehousing.2 These were: Management and Diversified, Oil and Gas, Other Financial Investment and RelatedActivities, Retail- General Stores, Retail- Health & Personal Care Stores, Transportation- Air,Transportation- Rail, Utilities.3 Like, Tim Hortons Inc.4 Like, Canadian Tire Corp. Ltd., and Dollarama Inc.5 Like, Empire Co. Ltd., and Loblaw Companies Limited.6 Like, Jean Coutu Group Inc.7 See: Economic Policy Dialogue, Pay Gap between CEOs and Workers in Canadian Industry, 2013,published in January 2014, Table 3.8 Like, ARC Resources Ltd., and Encana Corporation9 Like, Keyera Corp.10 Like, Canadian Utilities Ltd., and TransAlta Corp.11 Like, Barrick Gold Corporation, and Goldcorp Inc.12 This comes under ‘Mining and Quarrying (except Oil and Gas)’ sector at three digit level.13 Like, SNC-Lavalin Group Inc.14 Globe and Mail. Executive compensation 2014. 5 Sep. 2014. “Executive compensation: Canada's 100top-paid CEOs”. Accessed on 13 Dec. 2013.<www.theglobeandmail.com/report-on-business/careers/management/executive-compensation/executive-compensation-2014/article18721871/>15 Following are the Sources of these three summary tables:
Statistics Canada. “Earnings, average hourly for hourly paid employees, by industry”. SummaryTables. Accessed in 2014. <www.statcan.gc.ca/tables-tableaux/sum-som/l01/cst01/labr74a-eng.htm>.
---. “Earnings, average weekly, by industry”. Summary Tables. Accessed in 2014.<www.statcan.gc.ca/tables-tableaux/sum-som/l01/cst01/labr73a-eng.htm>.
---. “Weekly hours of hourly paid employees, average, by industry”. Summary Tables. Accessedin 2014. <www.statcan.gc.ca/tables-tableaux/sum-som/l01/cst01/labr81a-eng.htm>.16 Statistics Canada. “North American Industry Classification System (NAICS) 2007 – Canada”. 2007.Accessed in 2014. <www.statcan.gc.ca/subjects-sujets/standard-norme/naics-scian/2007/list-liste-eng.htm>.
![WORKERS’ COMPENSATION APPEALS BOARD …...WORKERS’ COMPENSATION APPEALS BOARD DIRECTORY 1 Laughlin, Falbo, Levy, &MoresiLLP ANAHEIM WORKERS’ COMPENSATION APPEALS BOARD [AHM]](https://img.pdfslide.tips/doc/110x75/5eaa700449f5fa538c64e567/workersa-compensation-appeals-board-workersa-compensation-appeals-board.jpg)