Embed Size (px)
DESCRIPTION
A review of financial warning signs for nonprofit organizations and how to obtain this information from IRS Form 990.
Citation preview

PredictingNonprofitCrisis&Death
Russell James, J.D., Ph.D., Texas Tech University
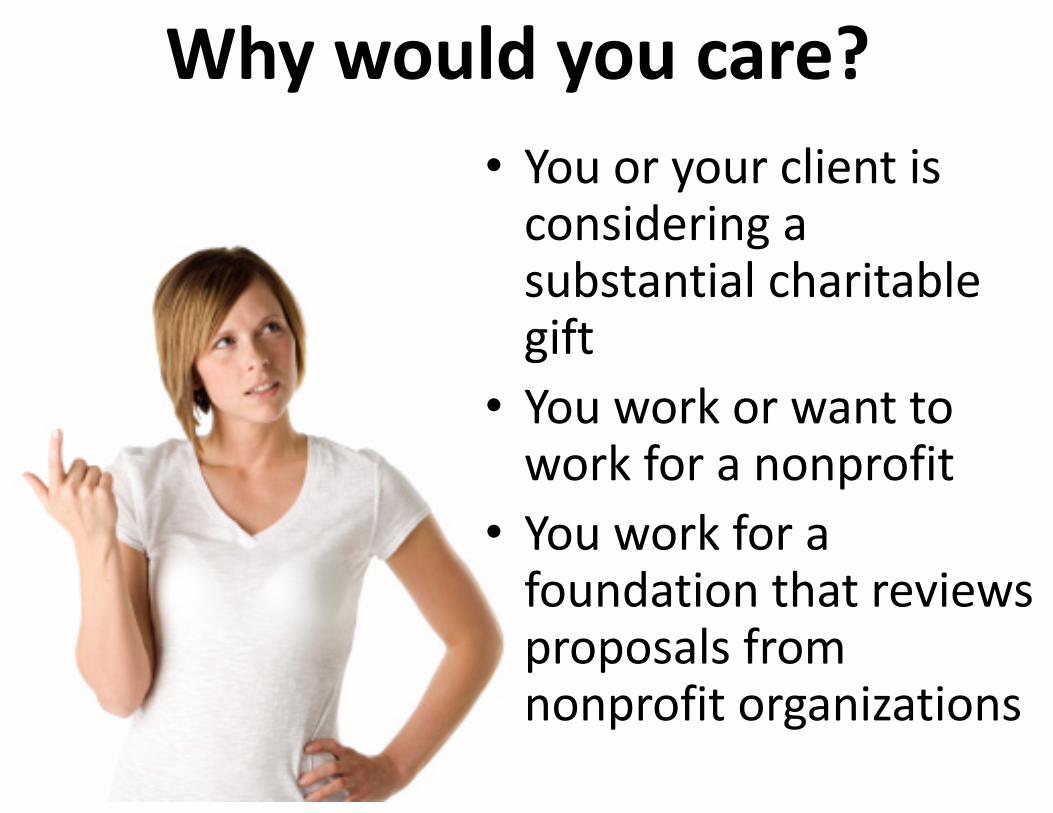
Why would you care?• You or your client is considering a substantial charitable gift
• You work or want to work for a nonprofit
• You work for a foundation that reviews proposals from nonprofit organizations

The tools for evaluating the stability of a non‐profit are similar to the tools for evaluating a for‐profit, with some variations

Similar to other companies we examine
• Income and income trends
• Expenditure and expenditure trends
• Net income and net income trends
• Asset/debt and Asset/debt trends
• Cash and cash trends
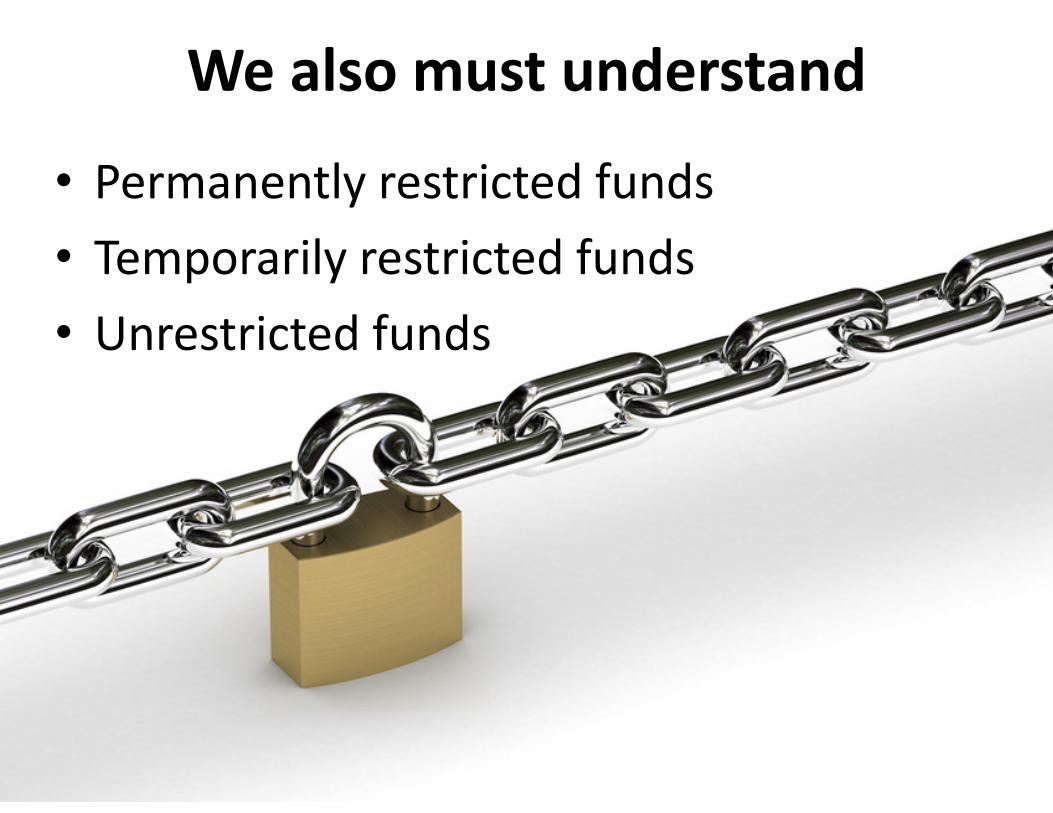
We also must understand
• Permanently restricted funds• Temporarily restricted funds• Unrestricted funds
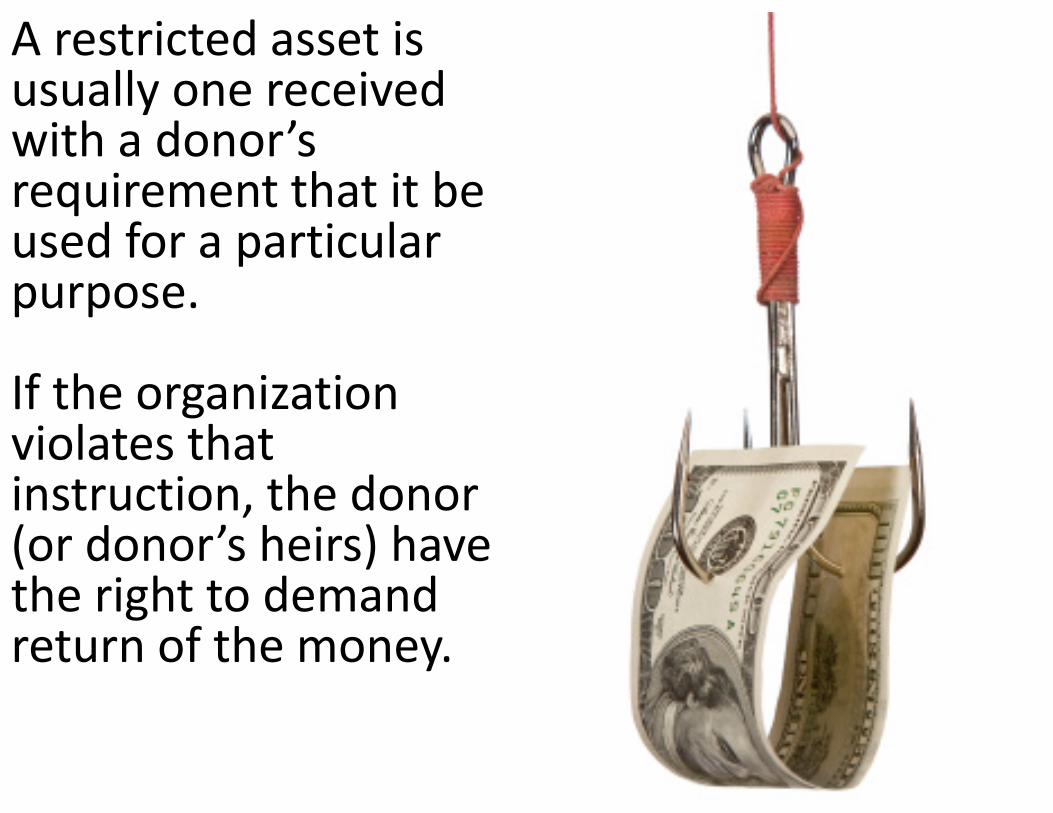
A restricted asset is usually one received with a donor’s requirement that it be used for a particular purpose.
If the organization violates that instruction, the donor (or donor’s heirs) have the right to demand return of the money.
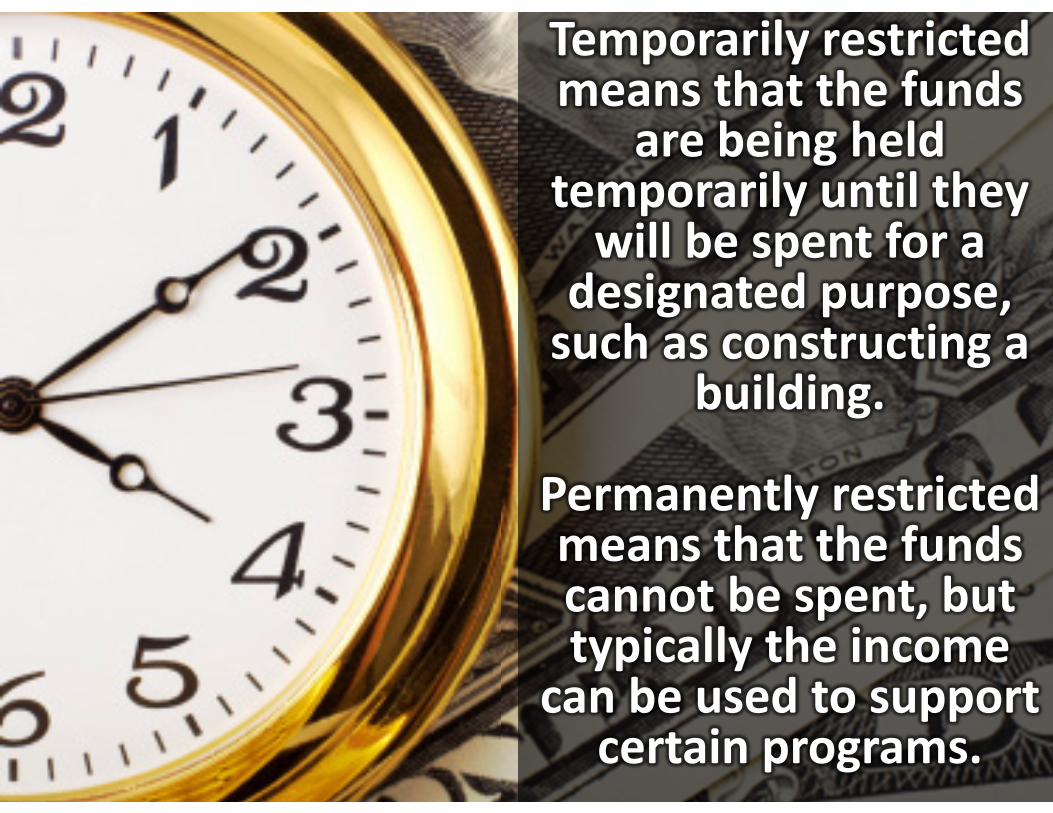
Temporarily restricted means that the funds
are being held temporarily until they will be spent for a
designated purpose, such as constructing a
building.
Permanently restricted means that the funds cannot be spent, but typically the income
can be used to support certain programs.
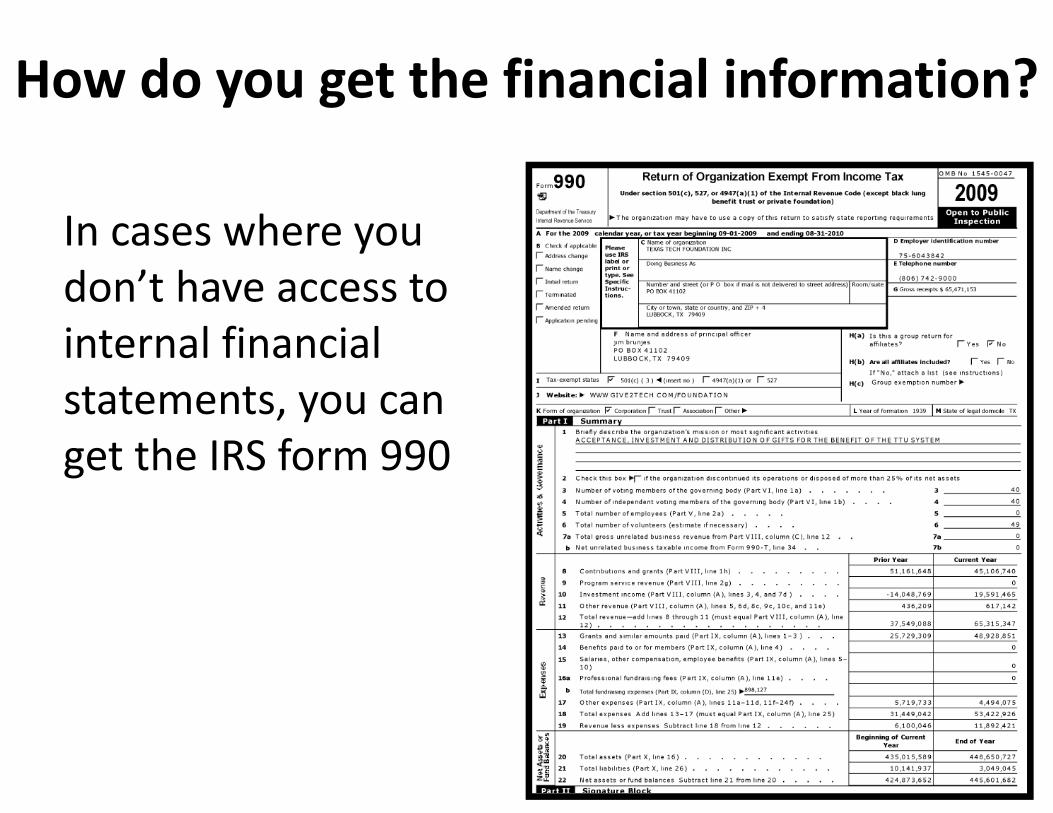
How do you get the financial information?
In cases where you don’t have access to internal financial statements, you can get the IRS form 990
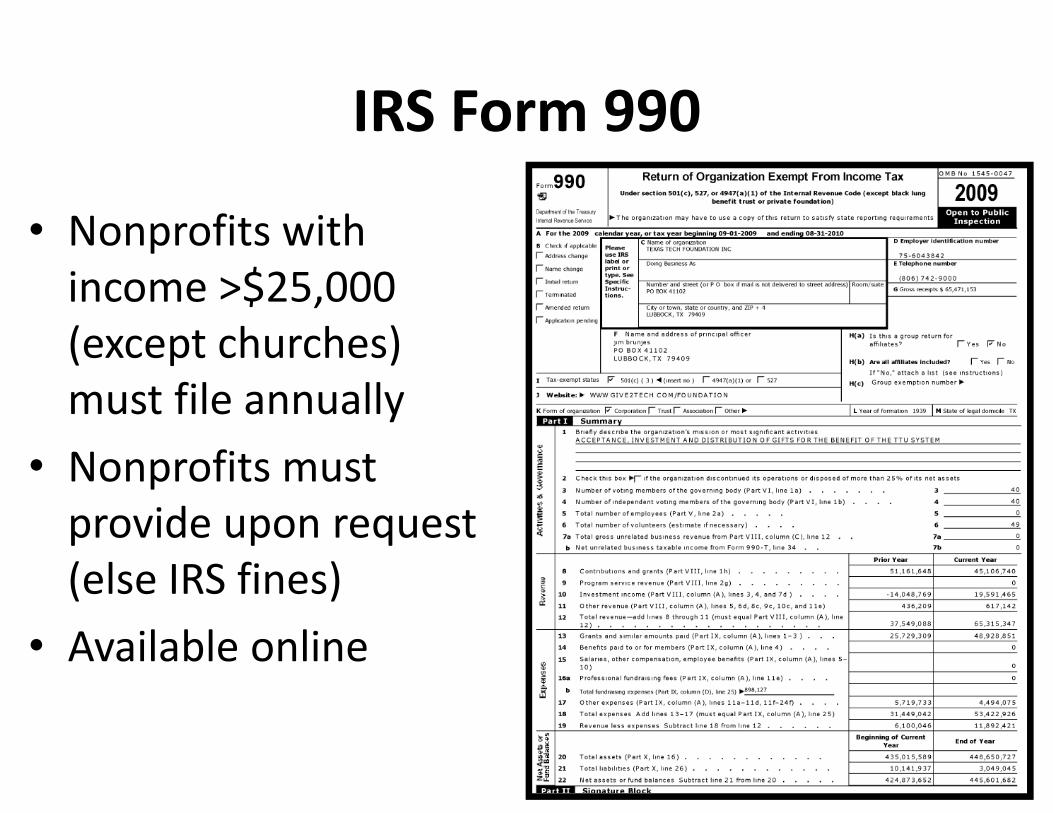
IRS Form 990
• Nonprofits with income >$25,000 (except churches) must file annually
• Nonprofits must provide upon request (else IRS fines)
• Available online
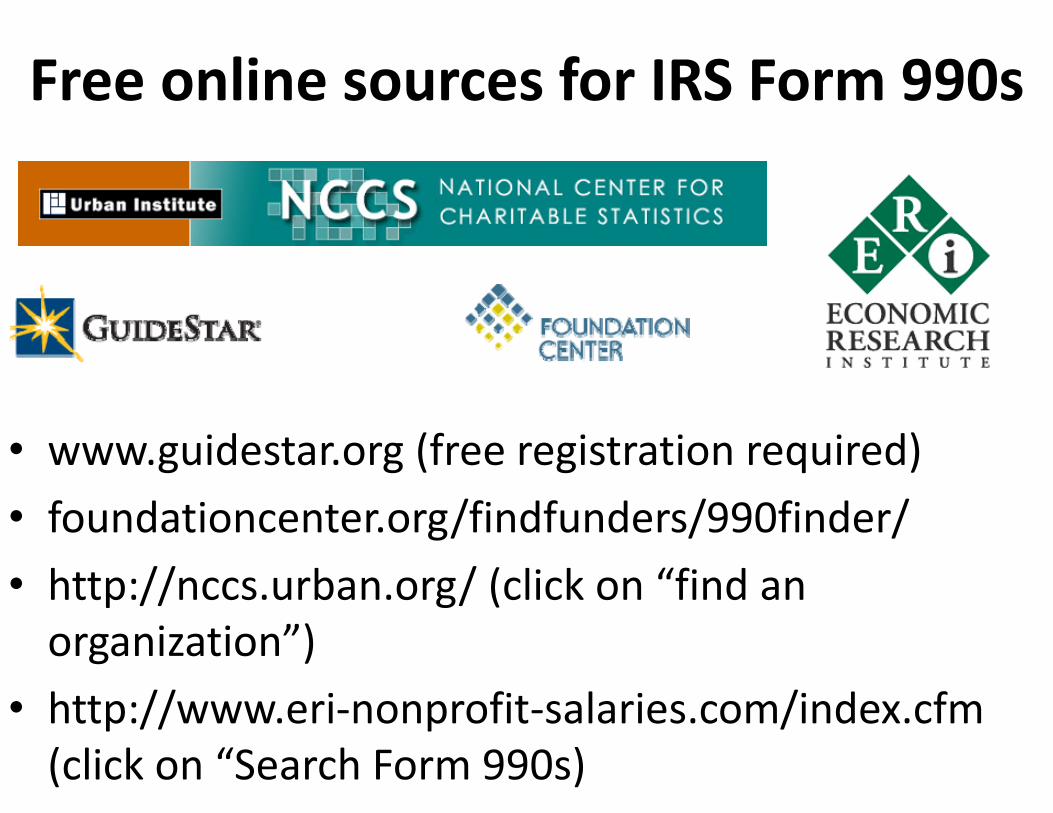
• www.guidestar.org (free registration required)• foundationcenter.org/findfunders/990finder/• http://nccs.urban.org/ (click on “find an organization”)
• http://www.eri‐nonprofit‐salaries.com/index.cfm (click on “Search Form 990s)
Free online sources for IRS Form 990s

Historical 990s990 forms before 2001 are generally not available online
You can request these from the IRS using the form at http://www.irs.gov/pub/irs‐pdf/f4506a.pdf

Let’s pick a nonprofit organization and learn about it

Finding the 990 Form
For this example we will use:foundationcenter.org/findfunders/990finder/
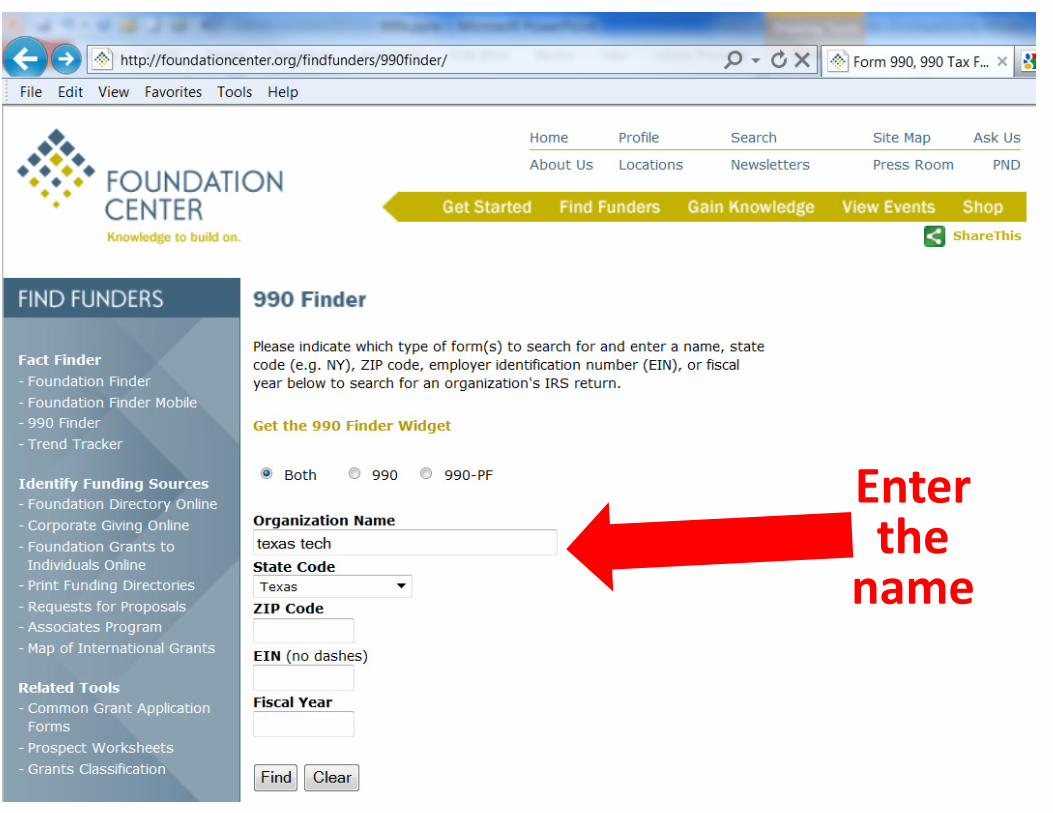
Enter the name
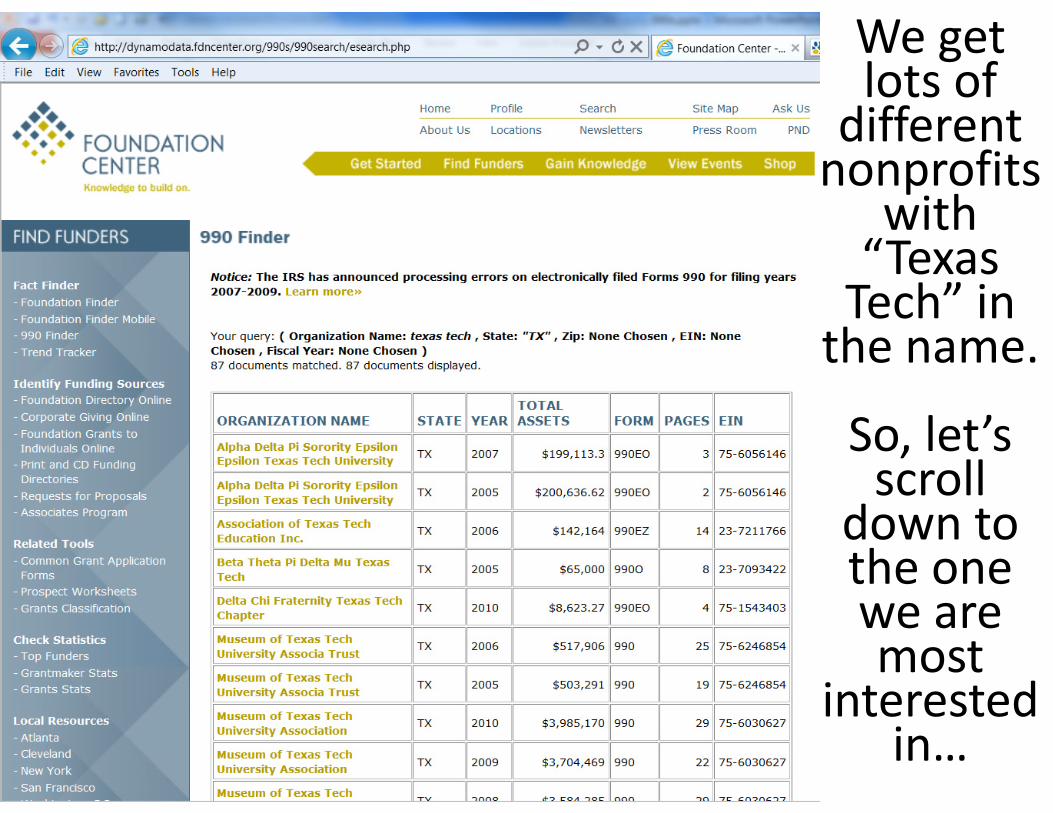
We get lots of different nonprofits
with “Texas Tech” in the name.
So, let’s scroll
down to the one we are most
interested in…
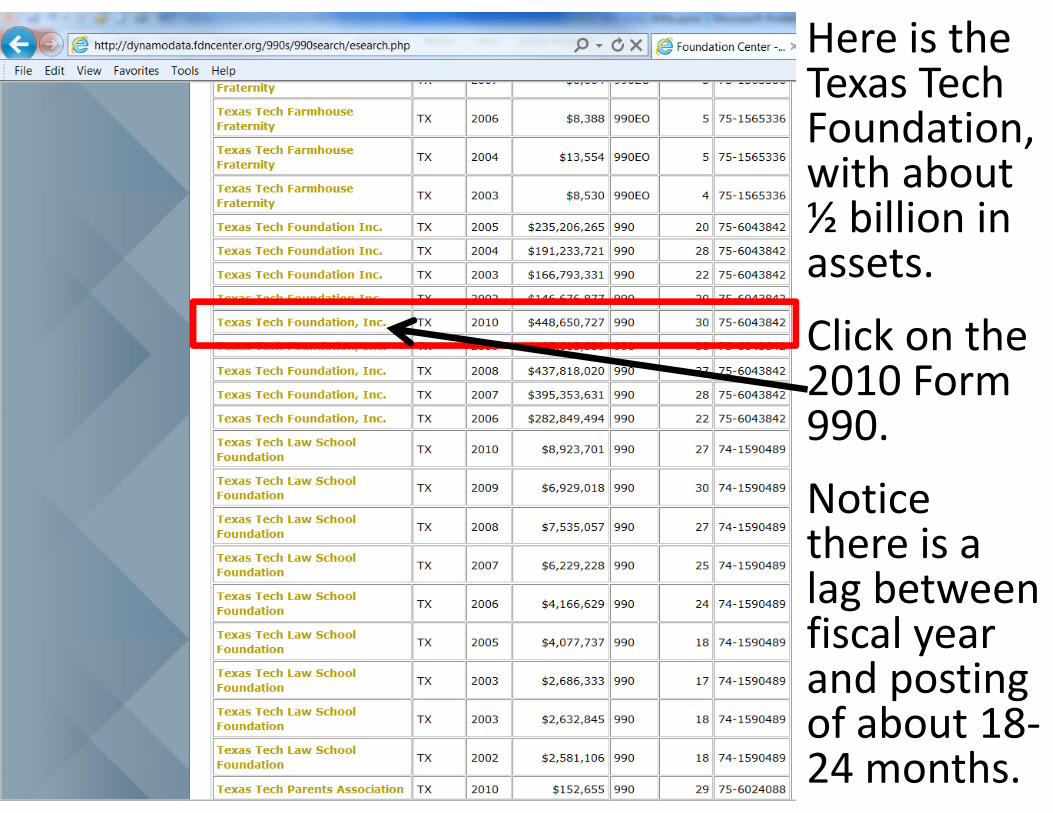
Here is the Texas Tech Foundation, with about ½ billion in assets. Click on the 2010 Form 990.Notice there is a lag between fiscal year and posting of about 18‐24 months.
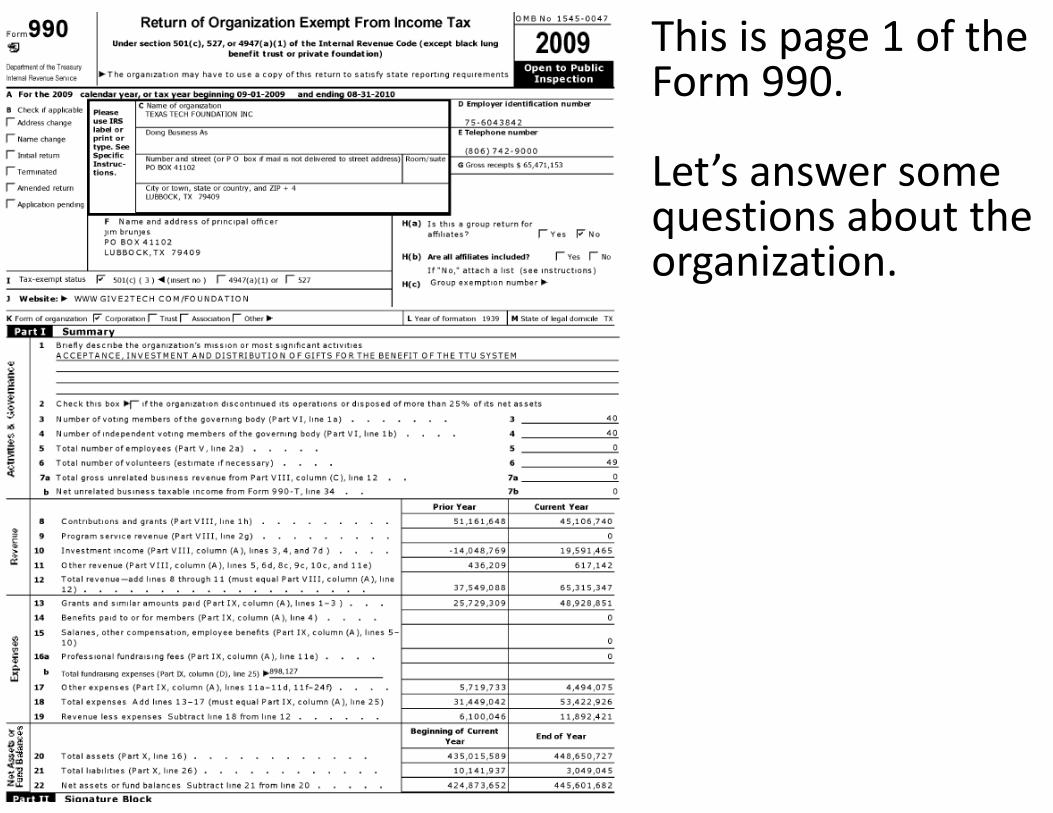
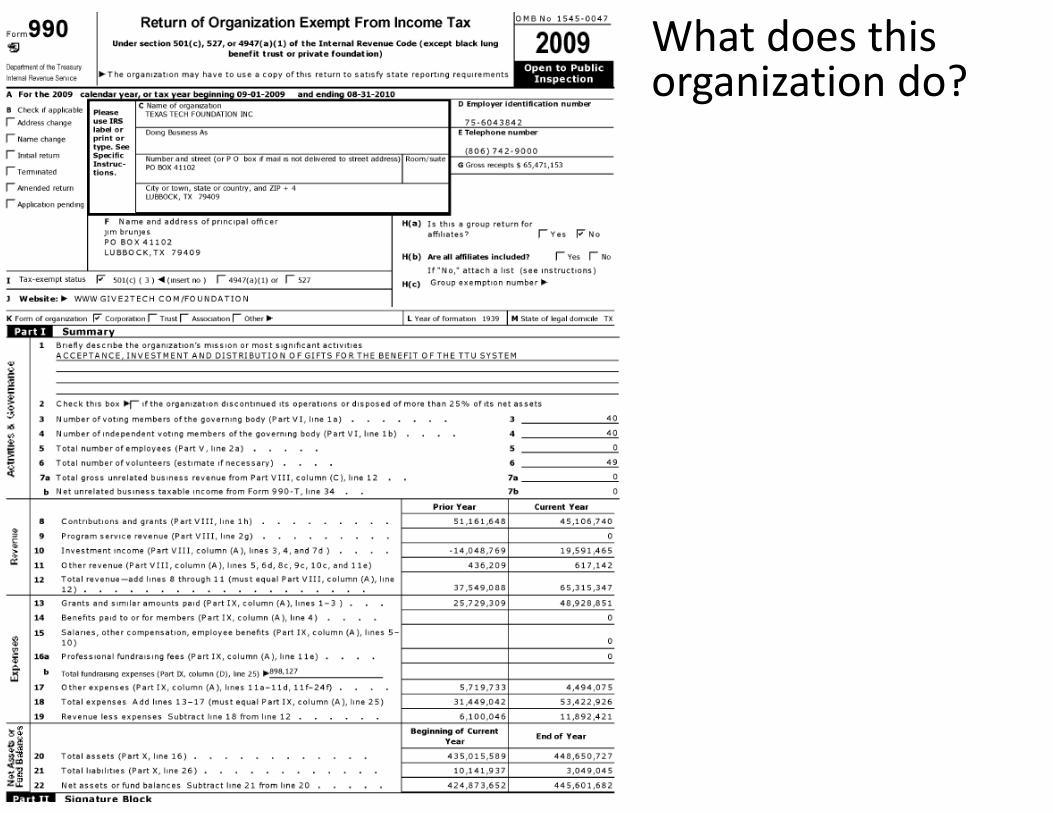
This is page 1 of the Form 990.
Let’s answer some questions about the organization.
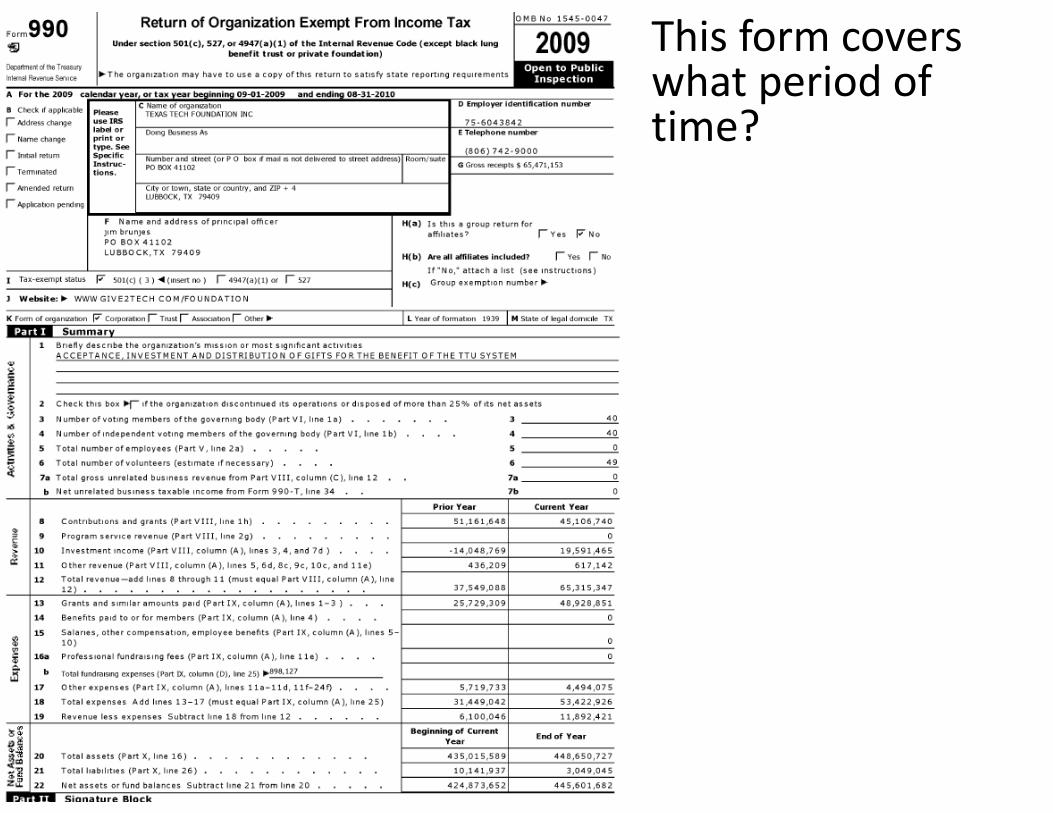
This form covers what period of time?
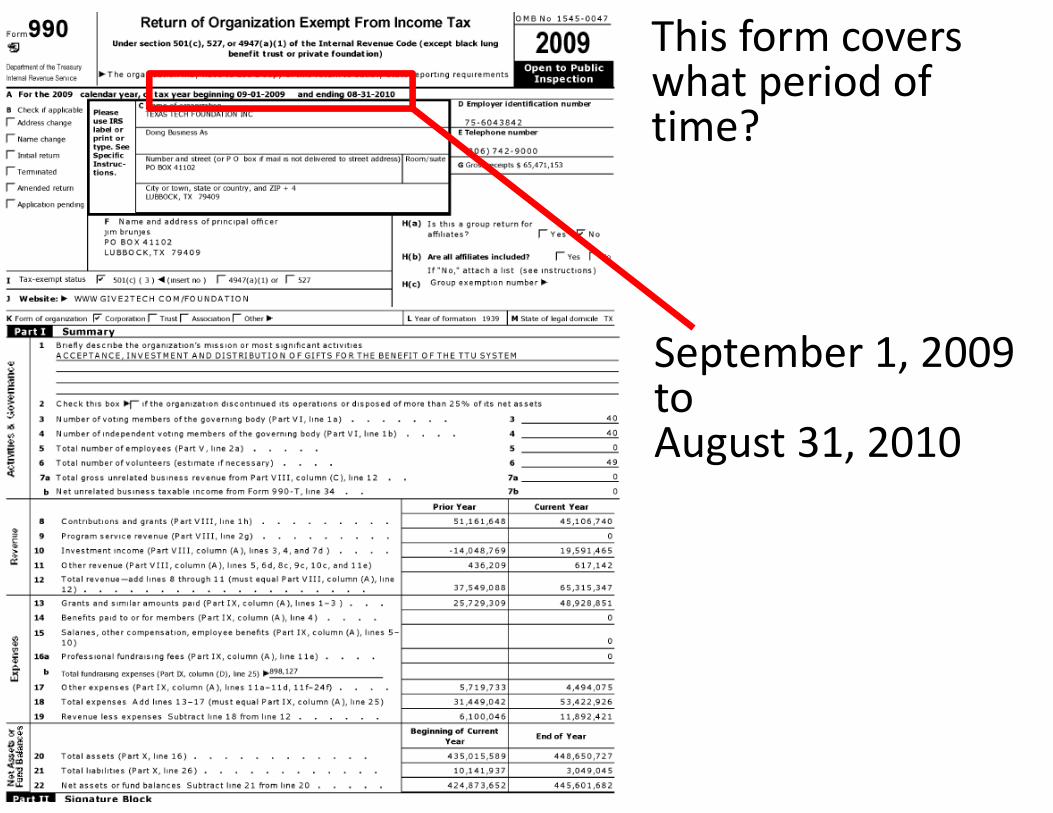
This form covers what period of time?
September 1, 2009toAugust 31, 2010
What does this organization do?
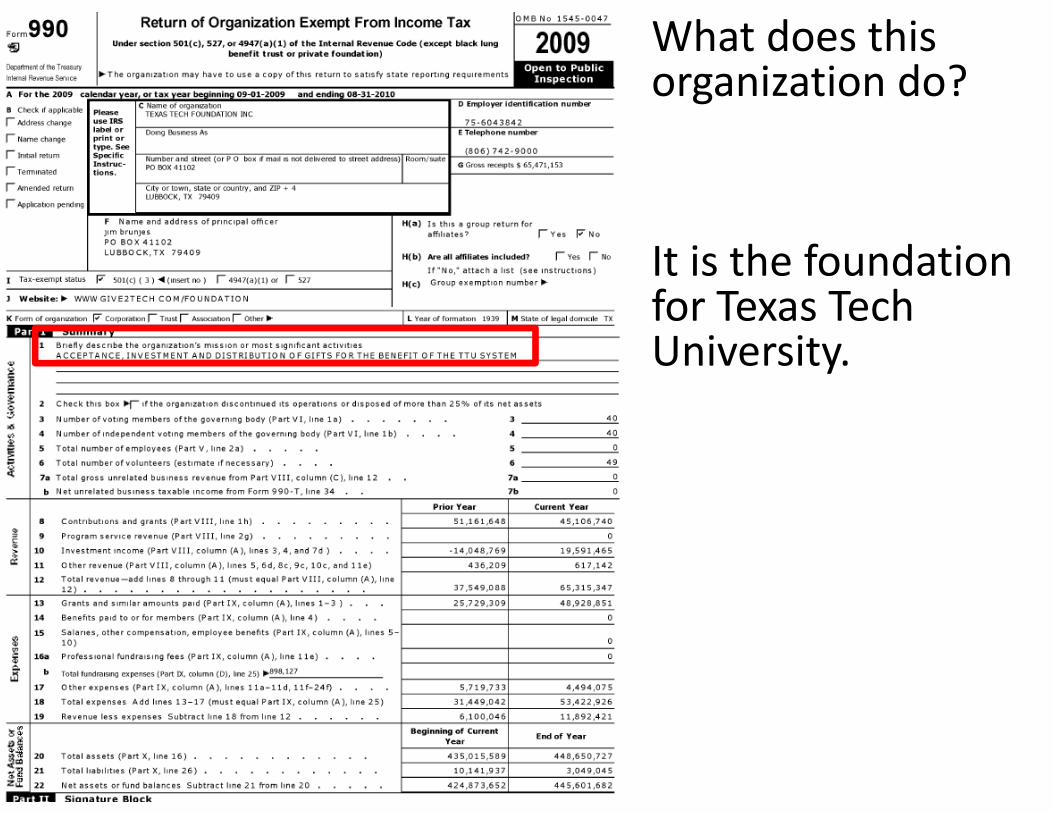
What does this organization do?
It is the foundation for Texas Tech University.
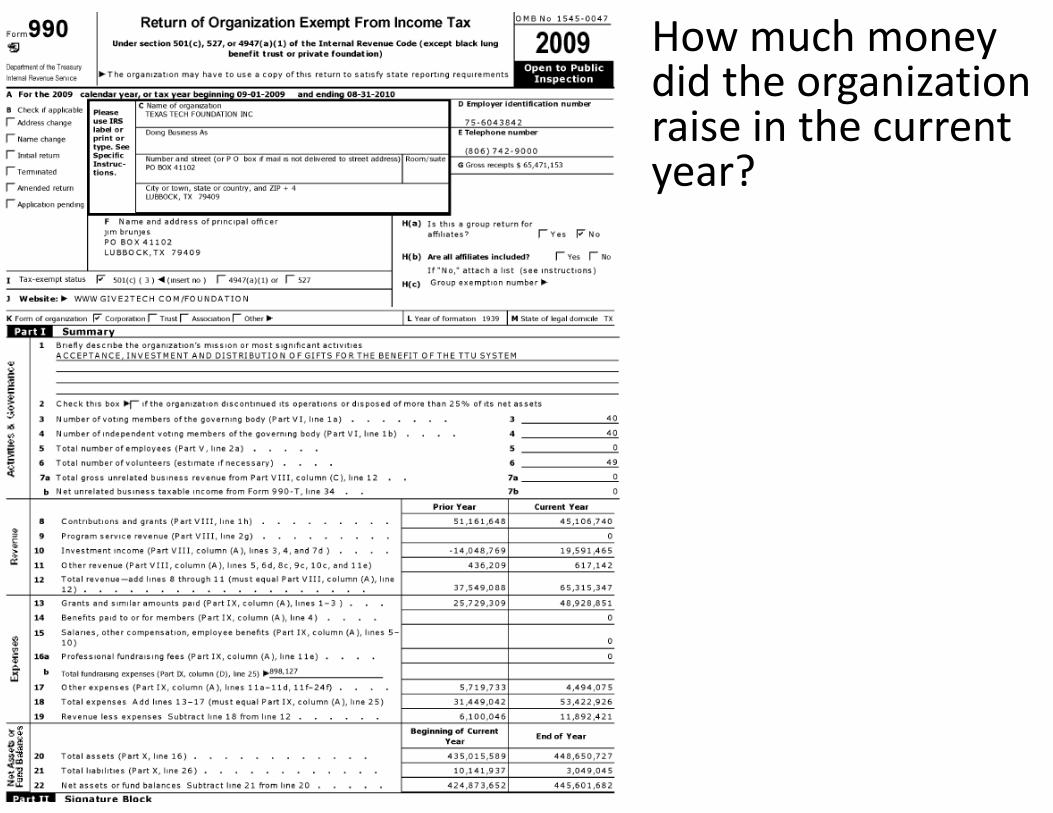
How much money did the organization raise in the current year?
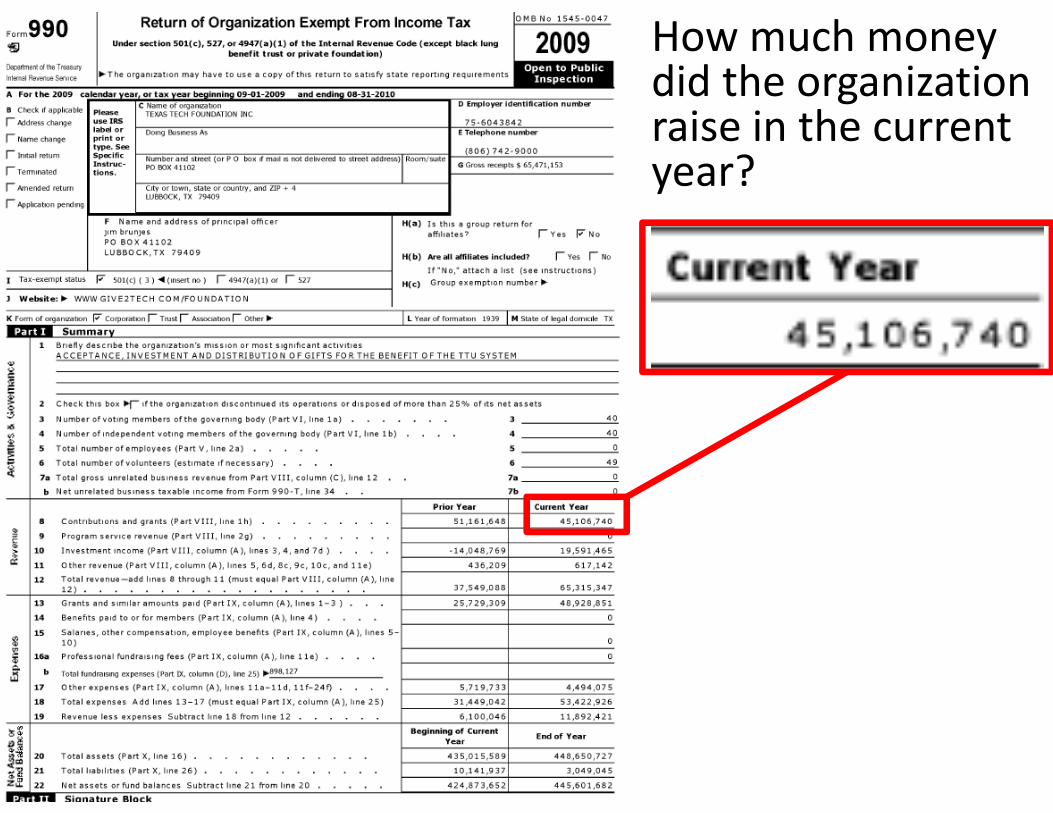
How much money did the organization raise in the current year?
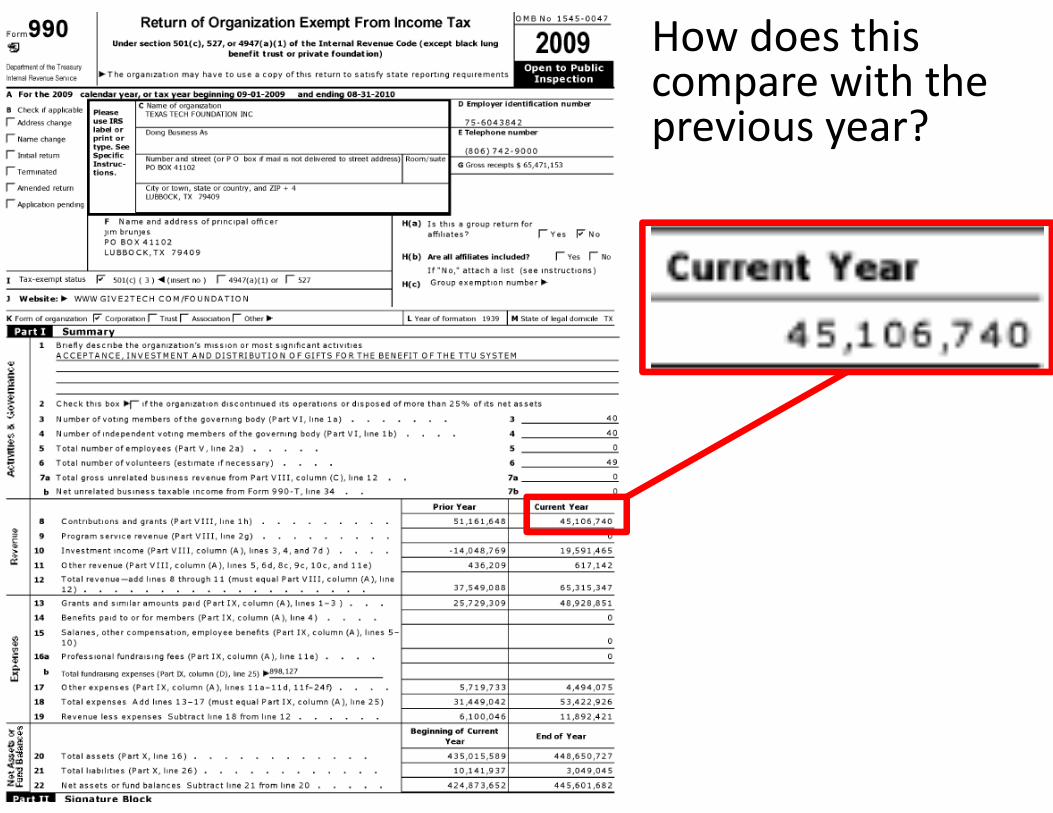
How does this compare with the previous year?
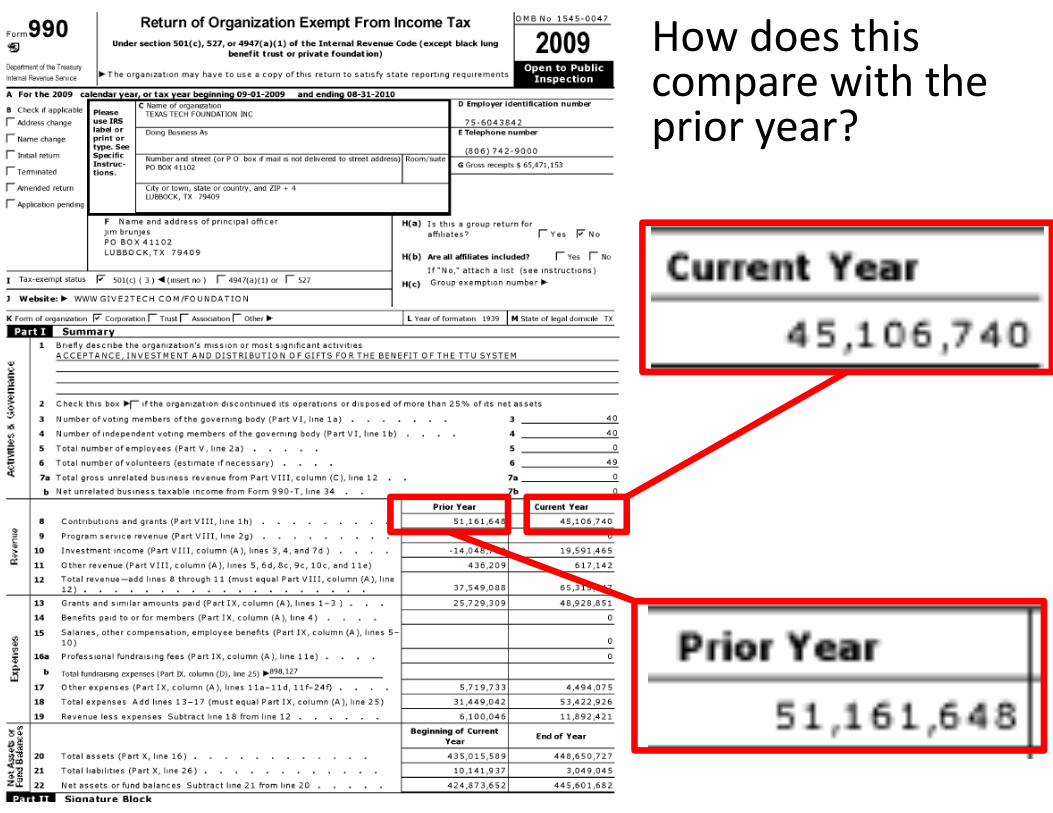
How does this compare with the prior year?
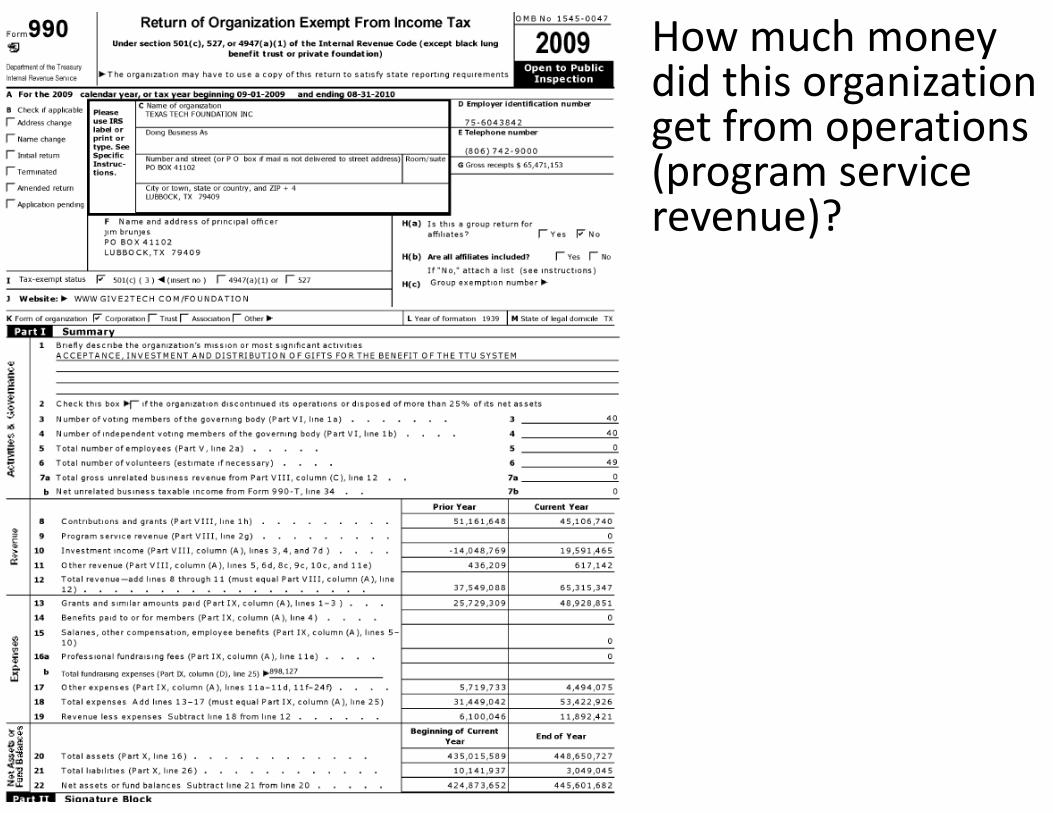
How much money did this organization get from operations (program service revenue)?
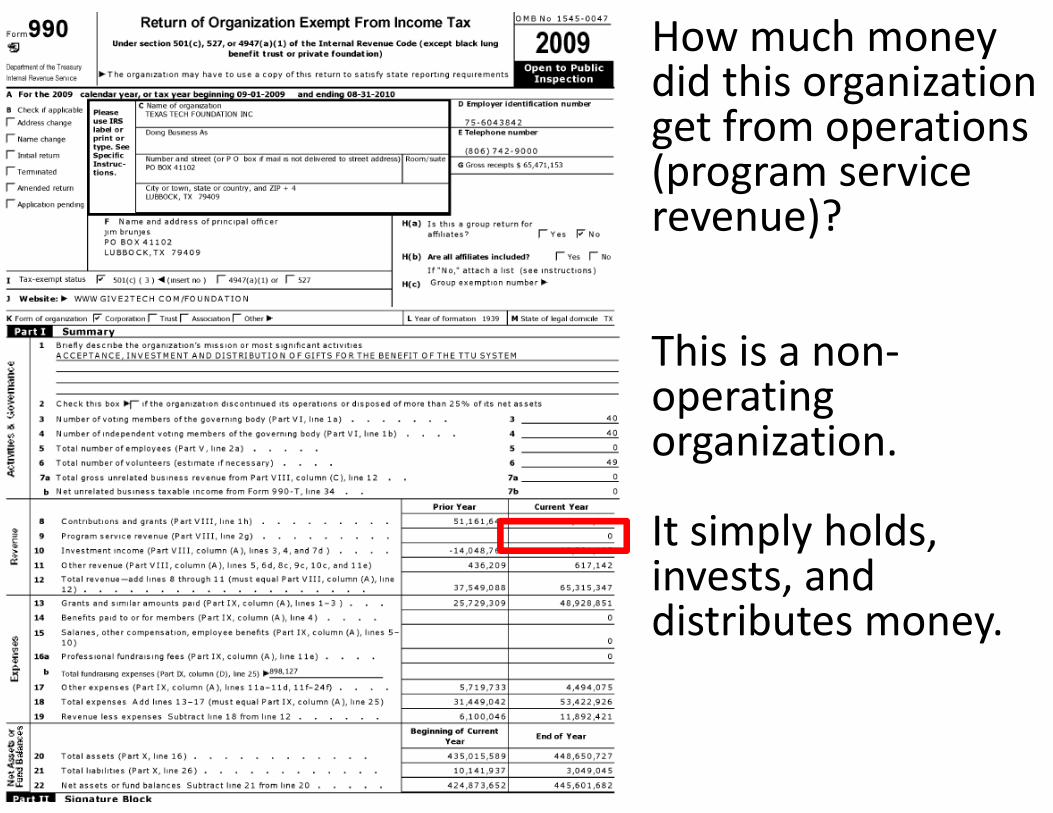
How much money did this organization get from operations (program service revenue)?
This is a non‐operating organization.
It simply holds, invests, and distributes money.
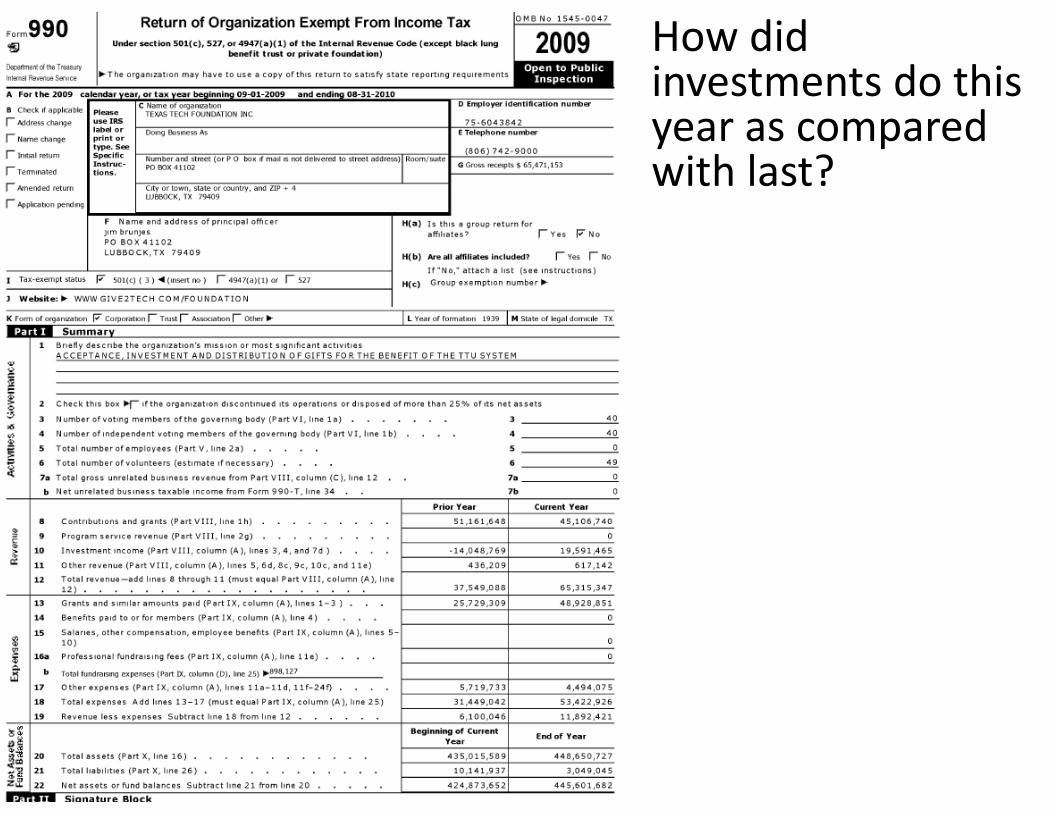
How did investments do this year as compared with last?
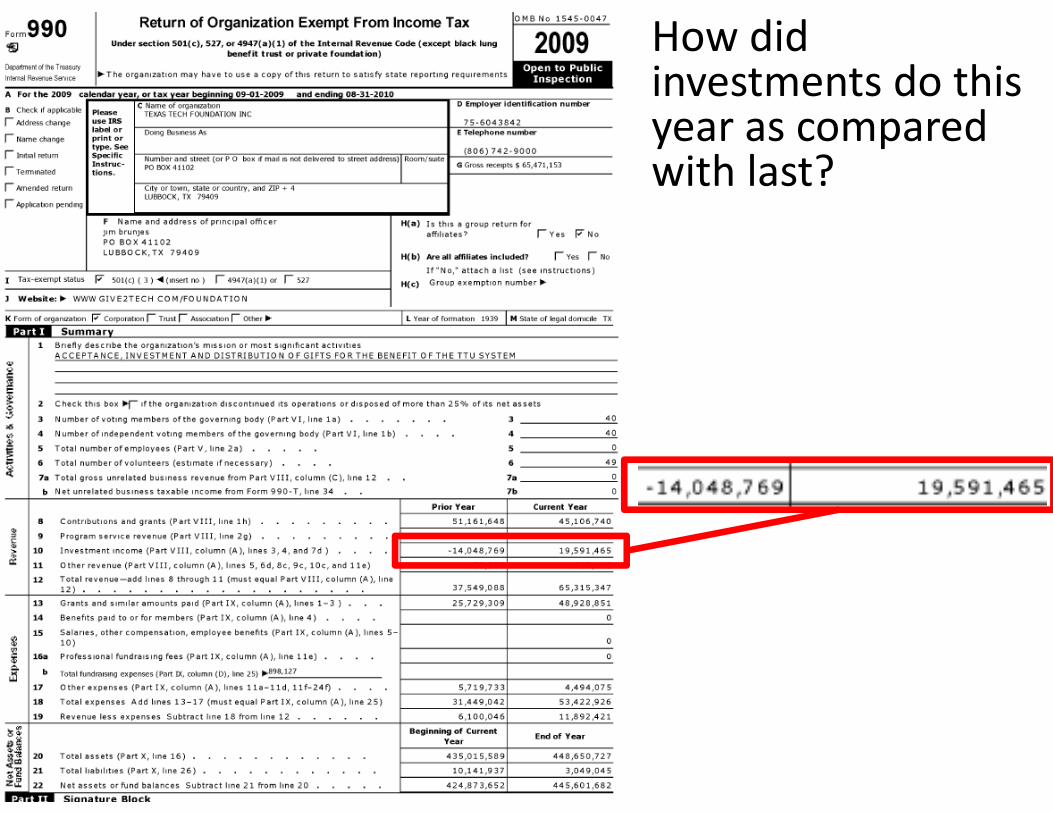
How did investments do this year as compared with last?
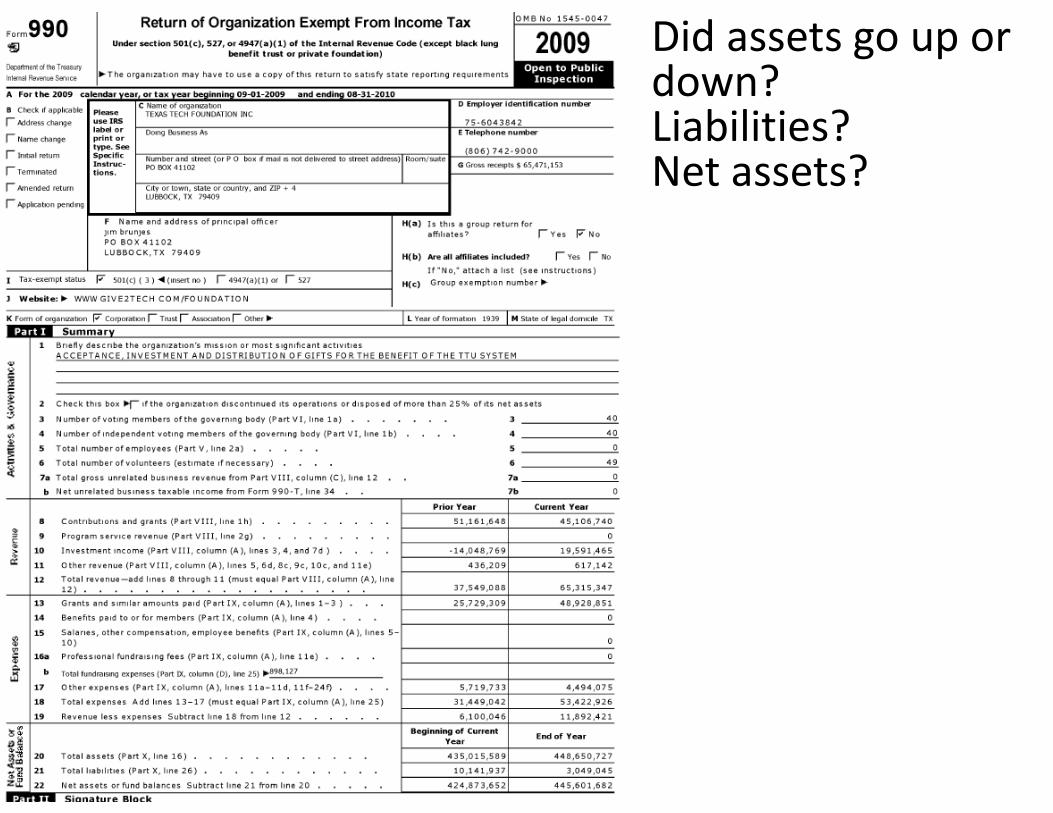
Did assets go up or down? Liabilities? Net assets?
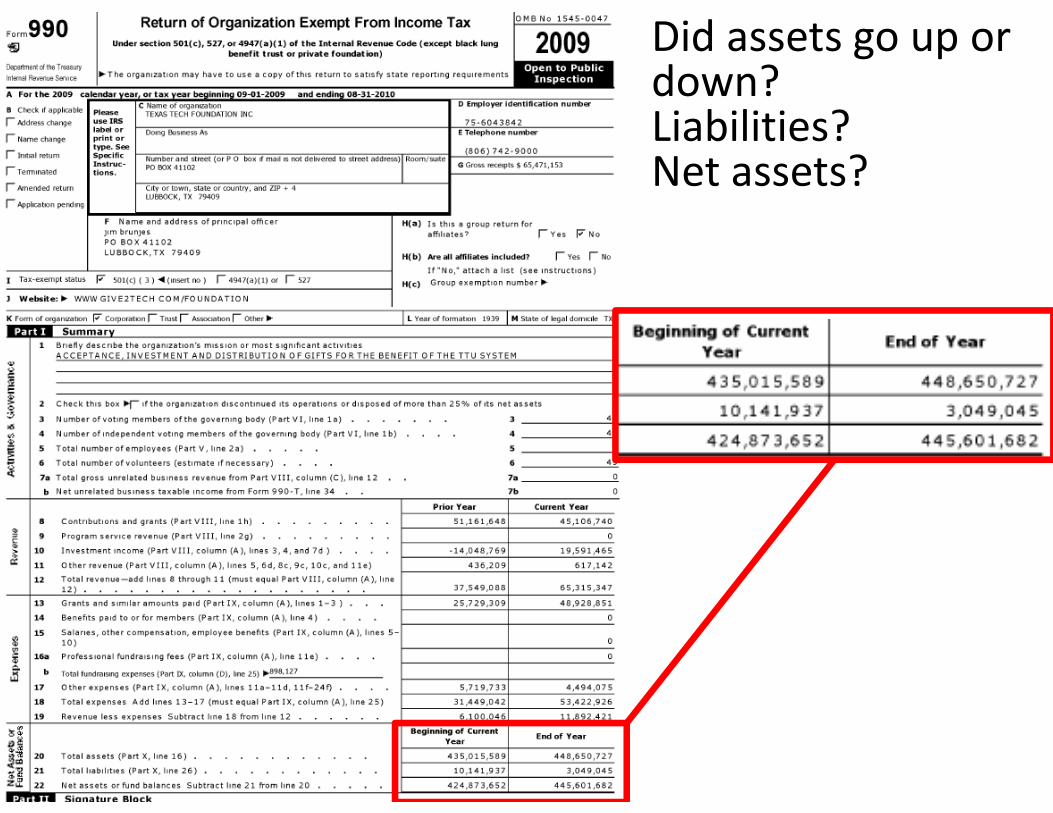
Did assets go up or down? Liabilities? Net assets?
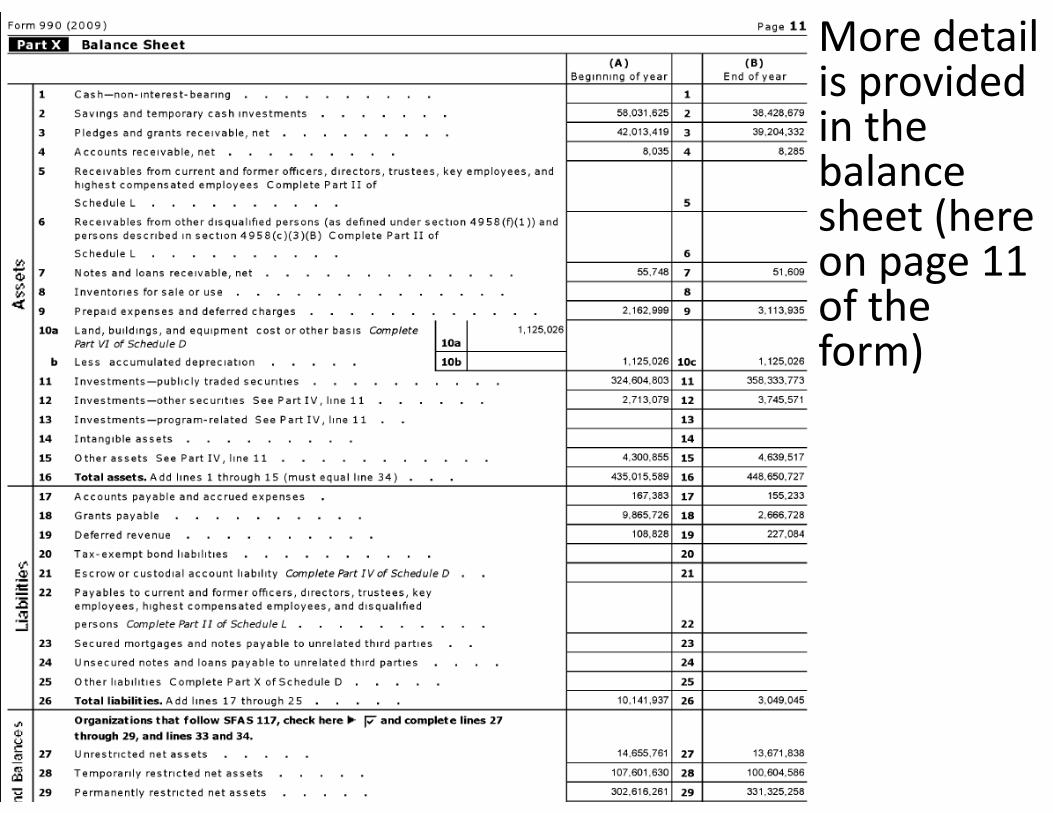
More detail is provided in the balance sheet (here on page 11 of the form)
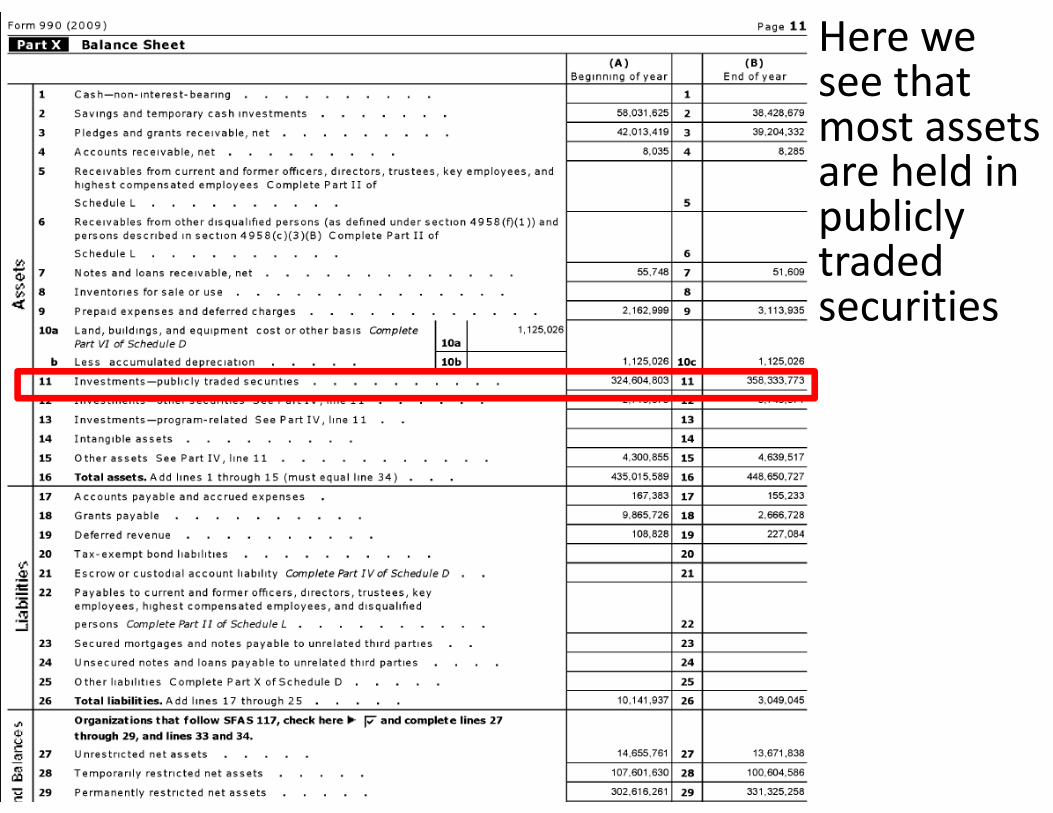
Here we see that most assets are held in publicly traded securities
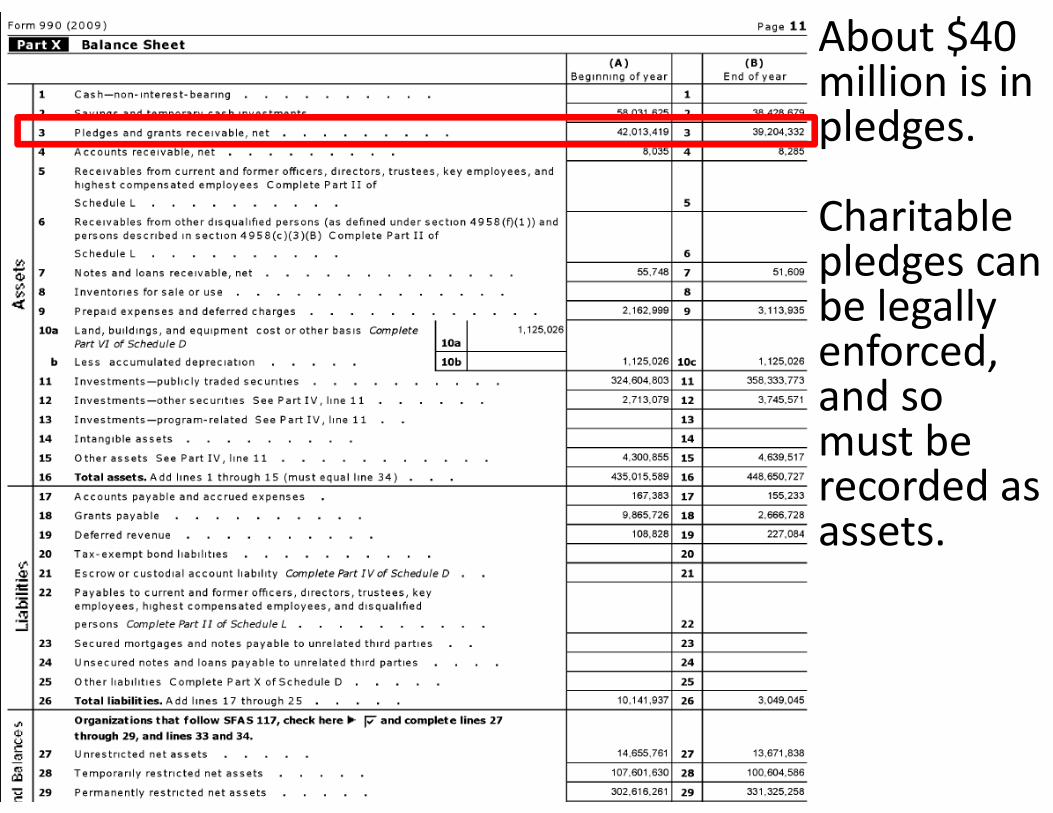
About $40 million is in pledges.
Charitable pledges can be legally enforced, and so must be recorded as assets.
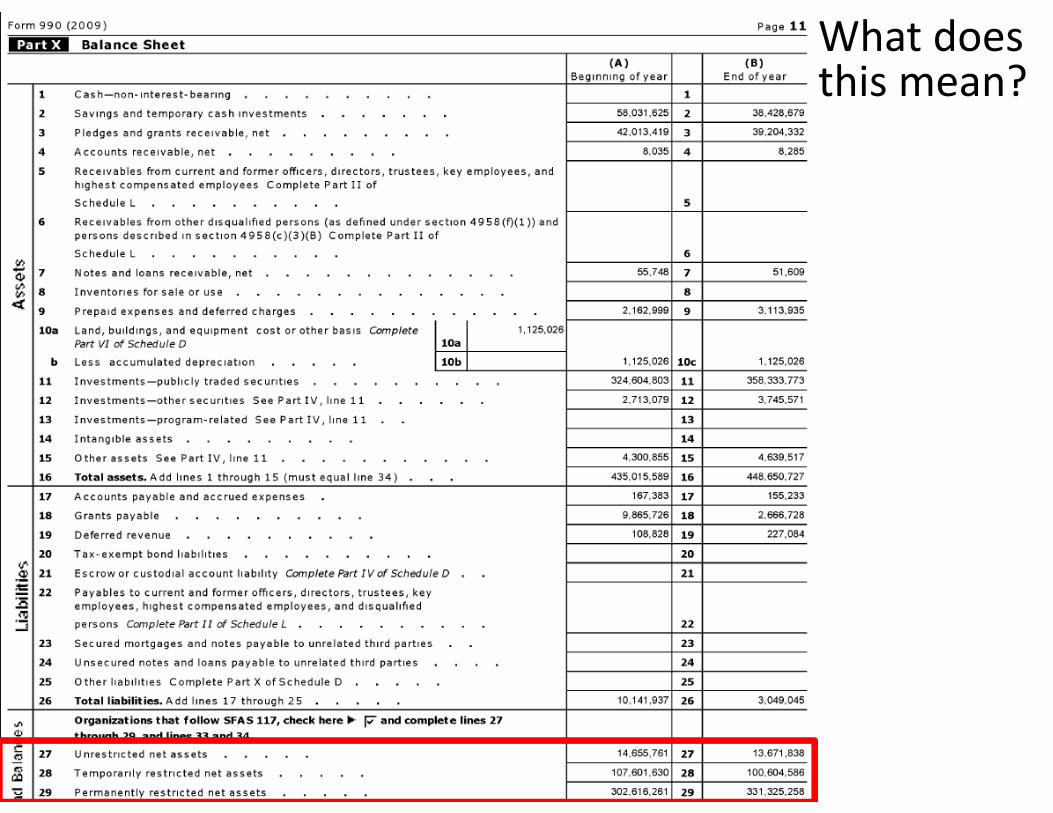
What does this mean?
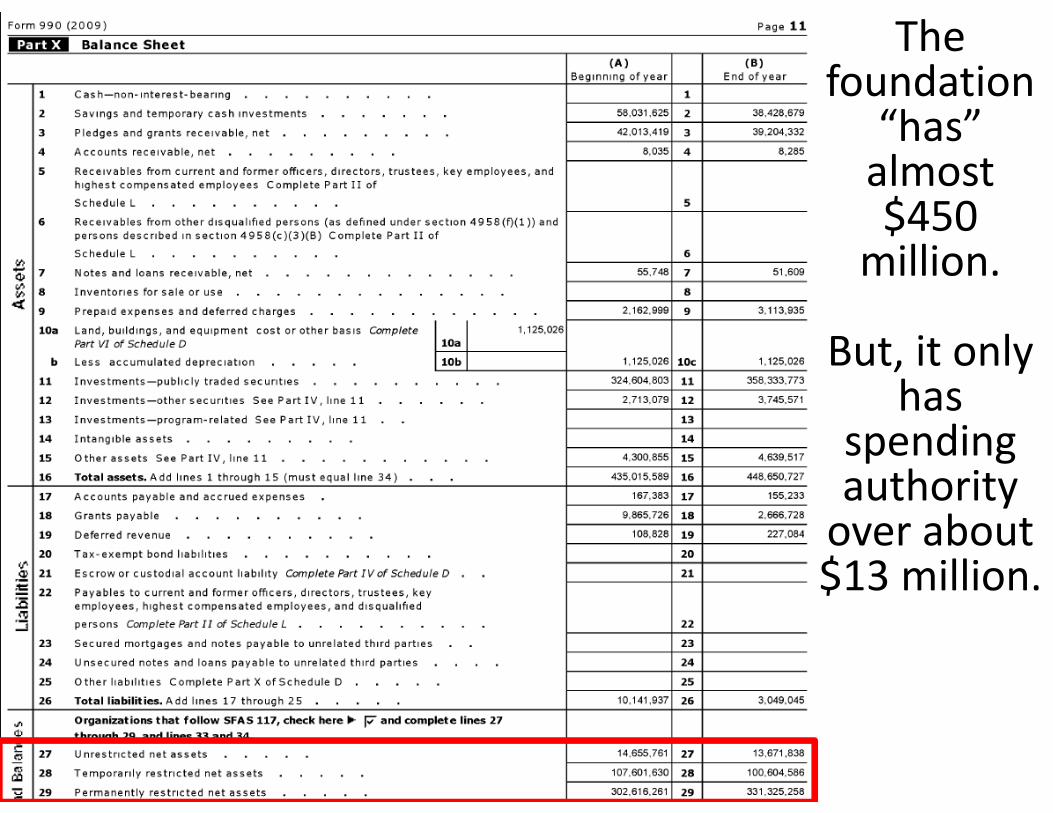
The foundation
“has” almost $450 million.
But, it only has
spending authority over about$13 million.

How can you tell if an organization is dying?
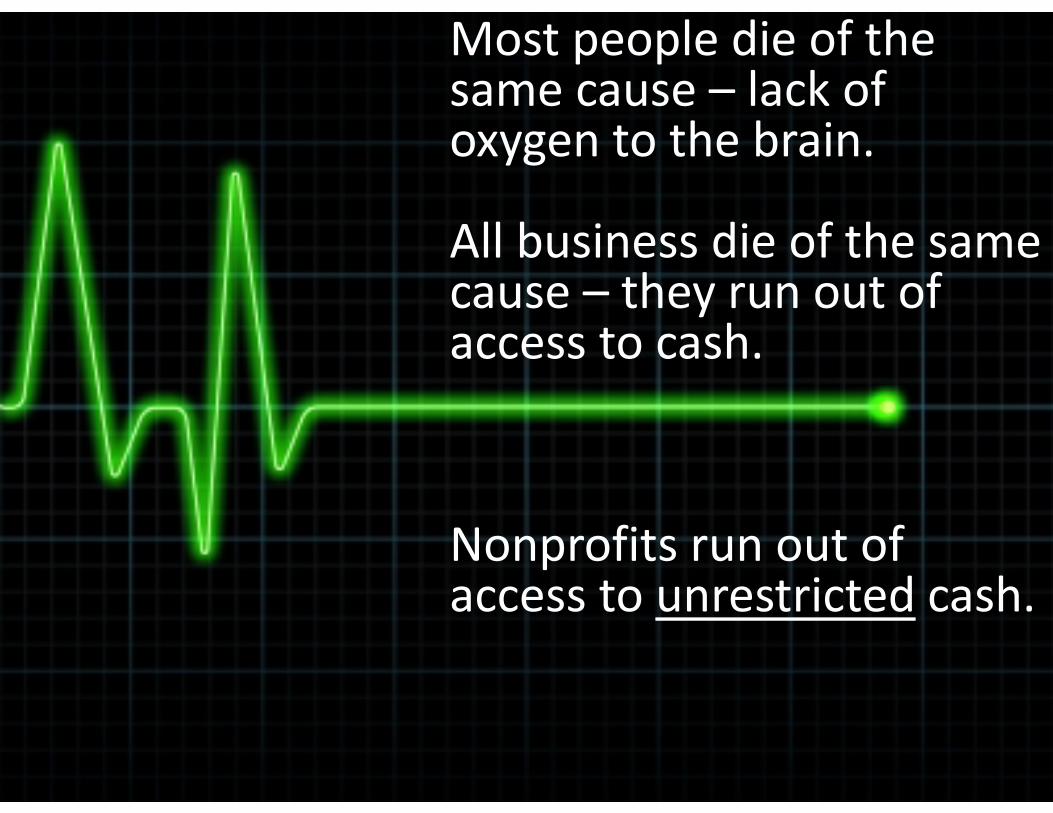
Most people die of the same cause – lack of oxygen to the brain.
All business die of the same cause – they run out of access to cash.
Nonprofits run out of access to unrestricted cash.

Profit is opinion. Cash is reality.
Many assets are difficult to value, e.g., some real estate, “good will”, future income streams, pledges, special purpose entities, etc.
Before its collapse, Enron had great “profits” (using hard‐to‐value assets) but little cash.
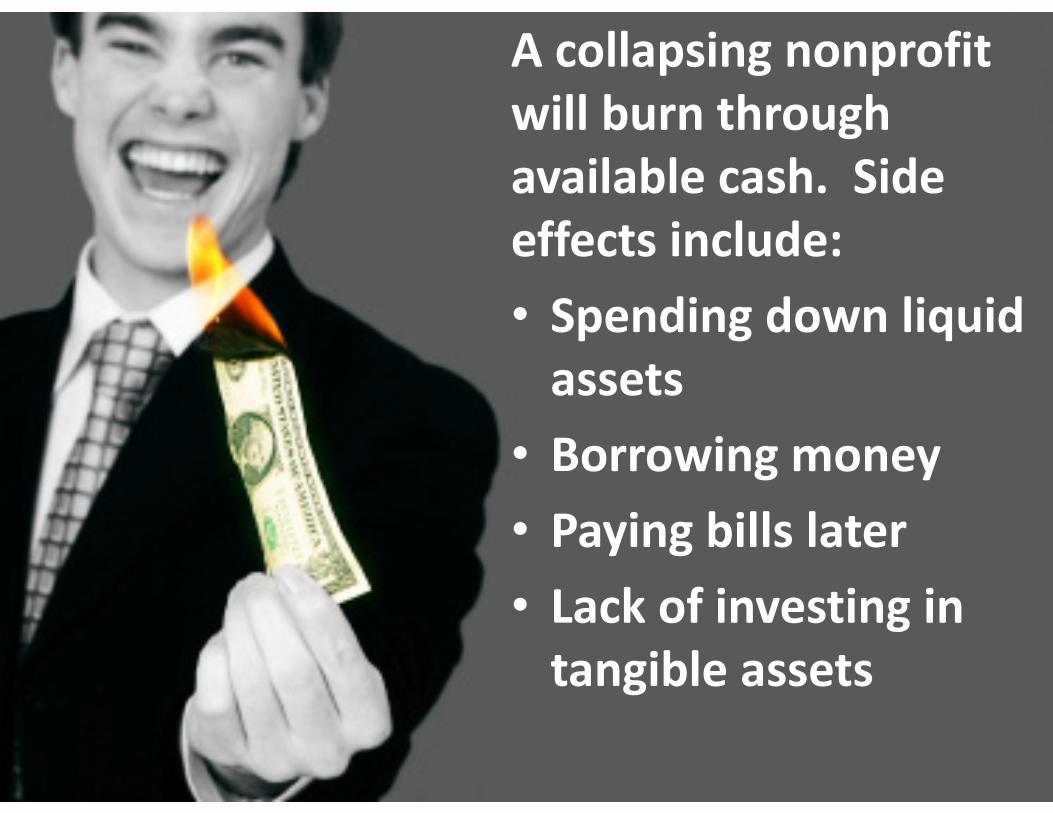
A collapsing nonprofit will burn through available cash. Side effects include:• Spending down liquid assets
• Borrowing money• Paying bills later• Lack of investing in tangible assets
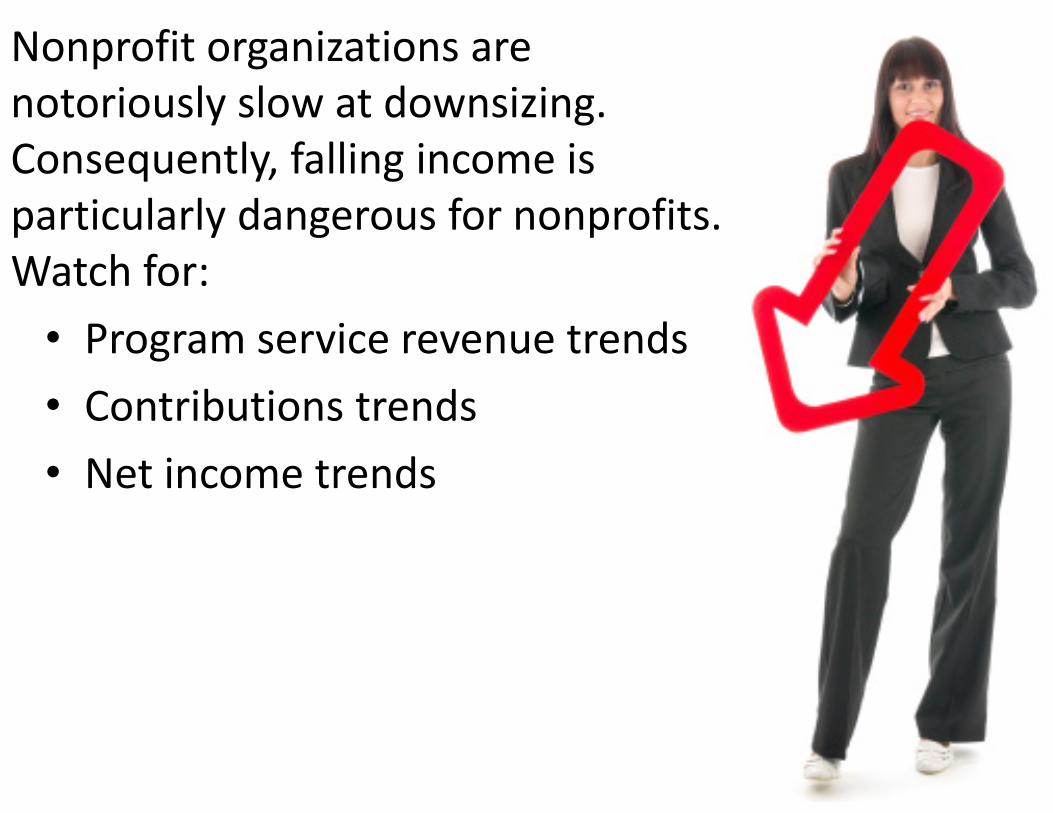
Nonprofit organizations are notoriously slow at downsizing. Consequently, falling income is particularly dangerous for nonprofits. Watch for:
• Program service revenue trends• Contributions trends• Net income trends
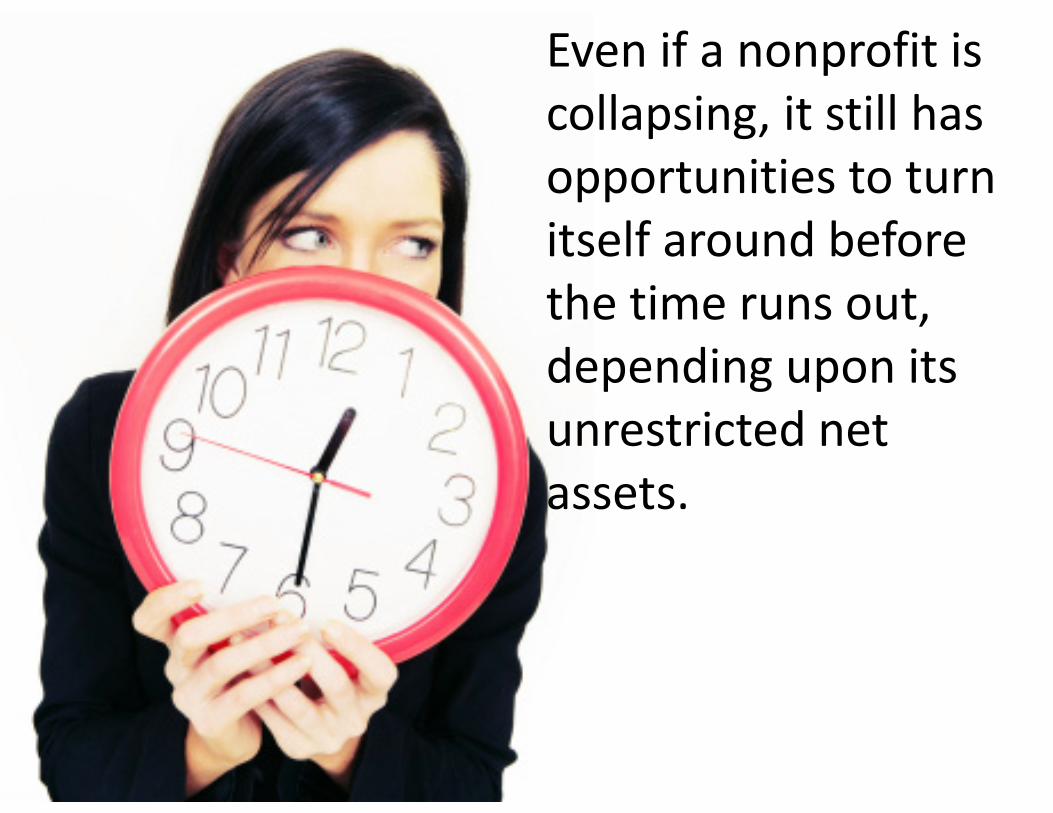
Even if a nonprofit is collapsing, it still has opportunities to turn itself around before the time runs out, depending upon its unrestricted net assets.

A rare, but extremely concerning, sign is the use of accounting gimmicks to present a stronger balance sheet, ex:• Assets or income improving not from cash but from hard‐to‐value forms
• Avoiding foreclosure through sale and leaseback, showing profit from deed‐in‐lieu of foreclosure, showing gift income from debt forgiveness due to collection concerns

Research on predicting nonprofit financial distress
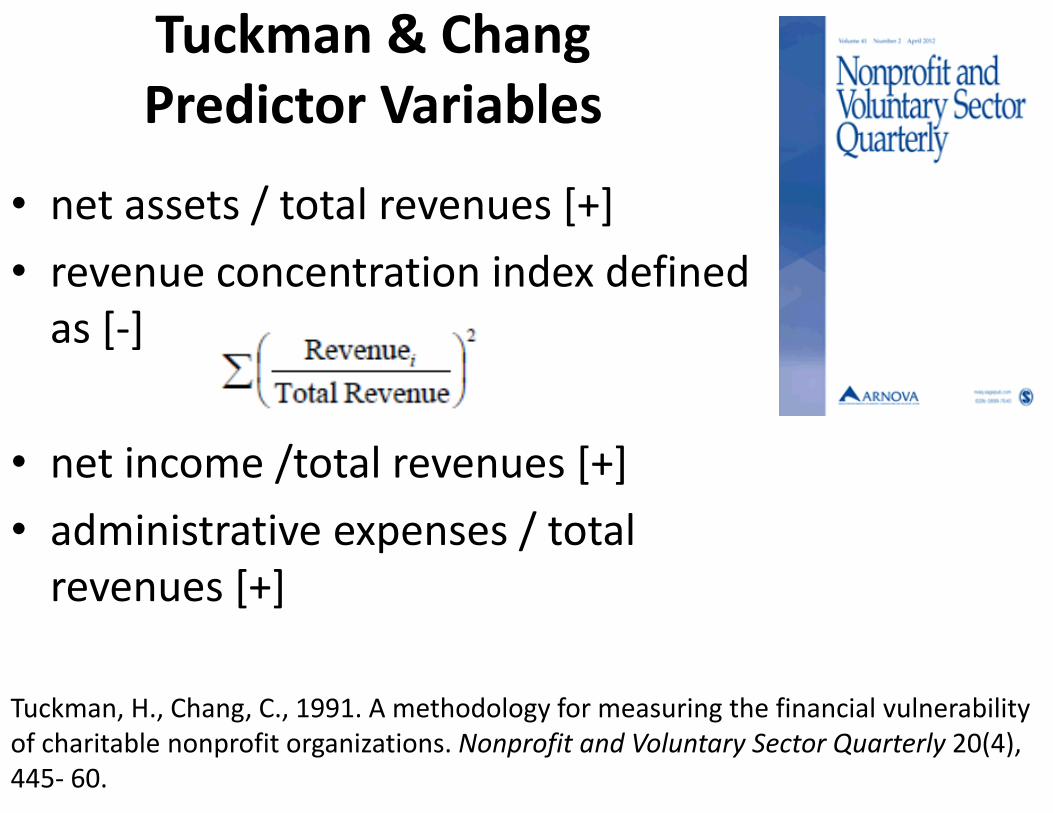
• net assets / total revenues [+]• revenue concentration index defined as [‐]
• net income /total revenues [+]• administrative expenses / total revenues [+]
Tuckman & Chang Predictor Variables
Tuckman, H., Chang, C., 1991. A methodology for measuring the financial vulnerability of charitable nonprofit organizations. Nonprofit and Voluntary Sector Quarterly 20(4), 445‐ 60.
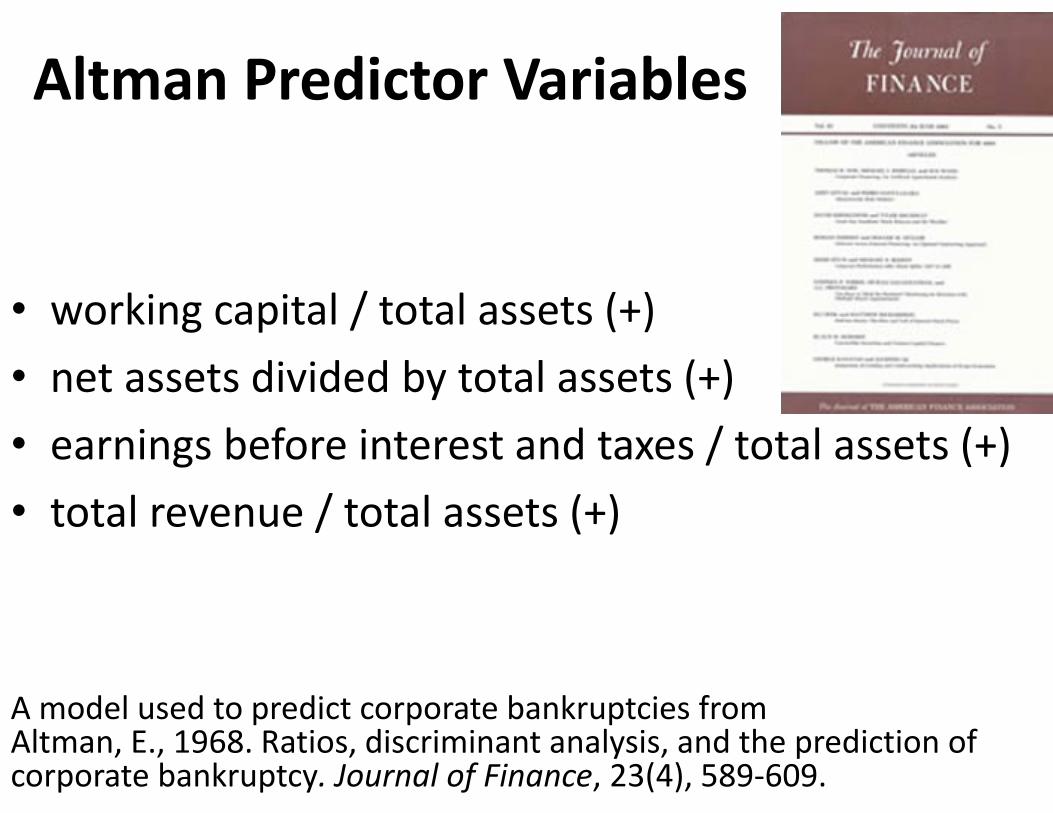
Altman Predictor Variables
• working capital / total assets (+)• net assets divided by total assets (+)• earnings before interest and taxes / total assets (+)• total revenue / total assets (+)
A model used to predict corporate bankruptcies from Altman, E., 1968. Ratios, discriminant analysis, and the prediction of corporate bankruptcy. Journal of Finance, 23(4), 589‐609.
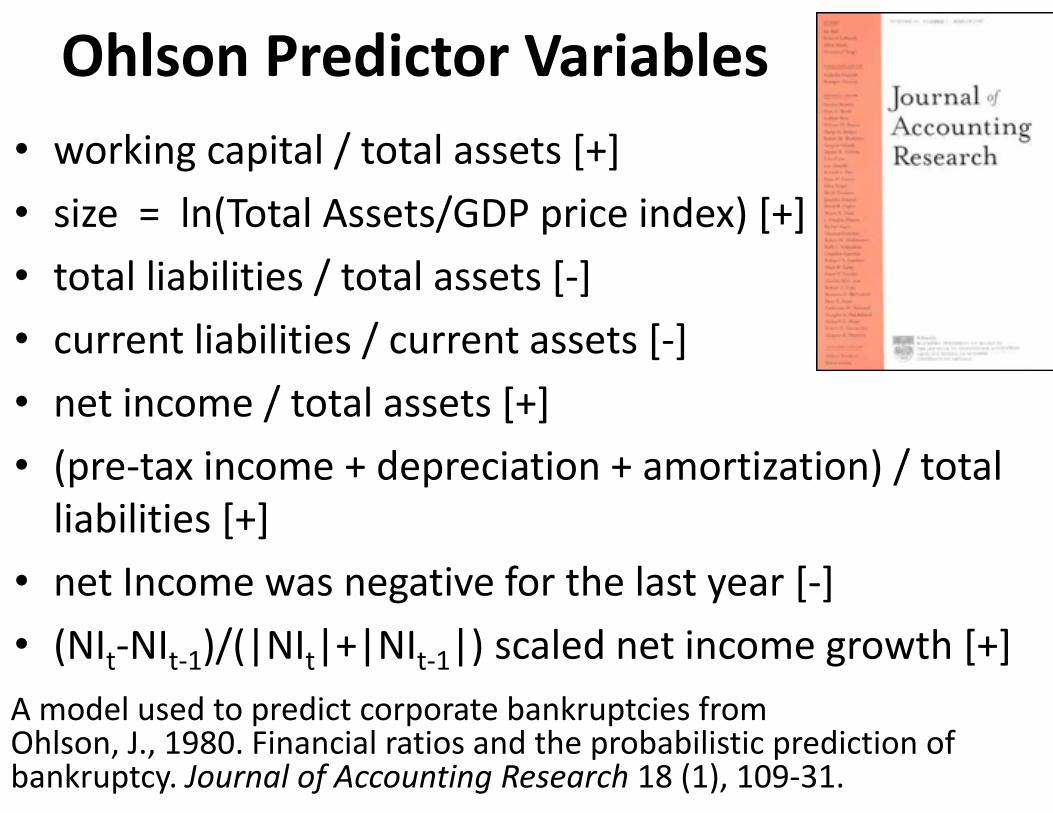
Ohlson Predictor Variables• working capital / total assets [+]• size = ln(Total Assets/GDP price index) [+]• total liabilities / total assets [‐]• current liabilities / current assets [‐]• net income / total assets [+]• (pre‐tax income + depreciation + amortization) / total liabilities [+]
• net Income was negative for the last year [‐]• (NIt‐NIt‐1)/(|NIt|+|NIt‐1|) scaled net income growth [+]A model used to predict corporate bankruptcies from Ohlson, J., 1980. Financial ratios and the probabilistic prediction of bankruptcy. Journal of Accounting Research 18 (1), 109‐31.

What is the best predictor?
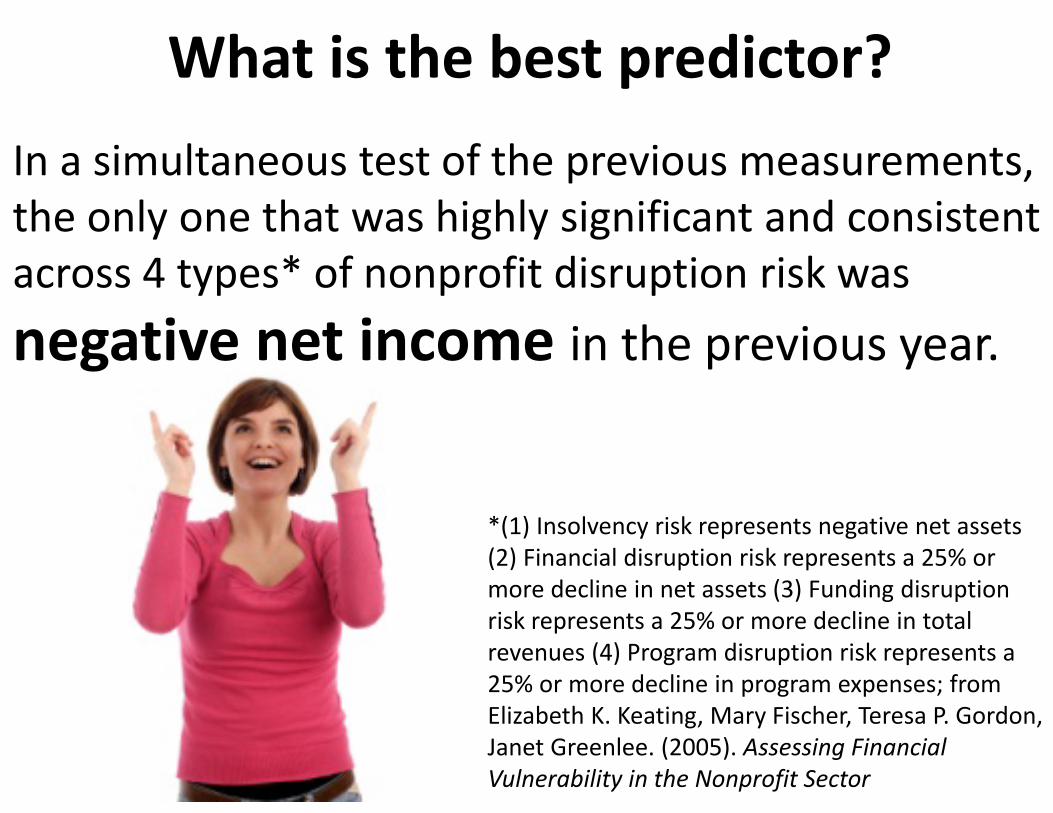
In a simultaneous test of the previous measurements, the only one that was highly significant and consistent across 4 types* of nonprofit disruption risk was negative net income in the previous year.
*(1) Insolvency risk represents negative net assets (2) Financial disruption risk represents a 25% or more decline in net assets (3) Funding disruption risk represents a 25% or more decline in total revenues (4) Program disruption risk represents a 25% or more decline in program expenses; from Elizabeth K. Keating, Mary Fischer, Teresa P. Gordon, Janet Greenlee. (2005). Assessing Financial Vulnerability in the Nonprofit Sector
What is the best predictor?
In a simultaneous test of the previous measurements, the only one that was highly significant and consistent across 4 types* of nonprofit disruption risk was negative net income in the previous year.
What is the best predictor?

Let’s look at a small college that closed in 2008. What early trends were cause for concern?
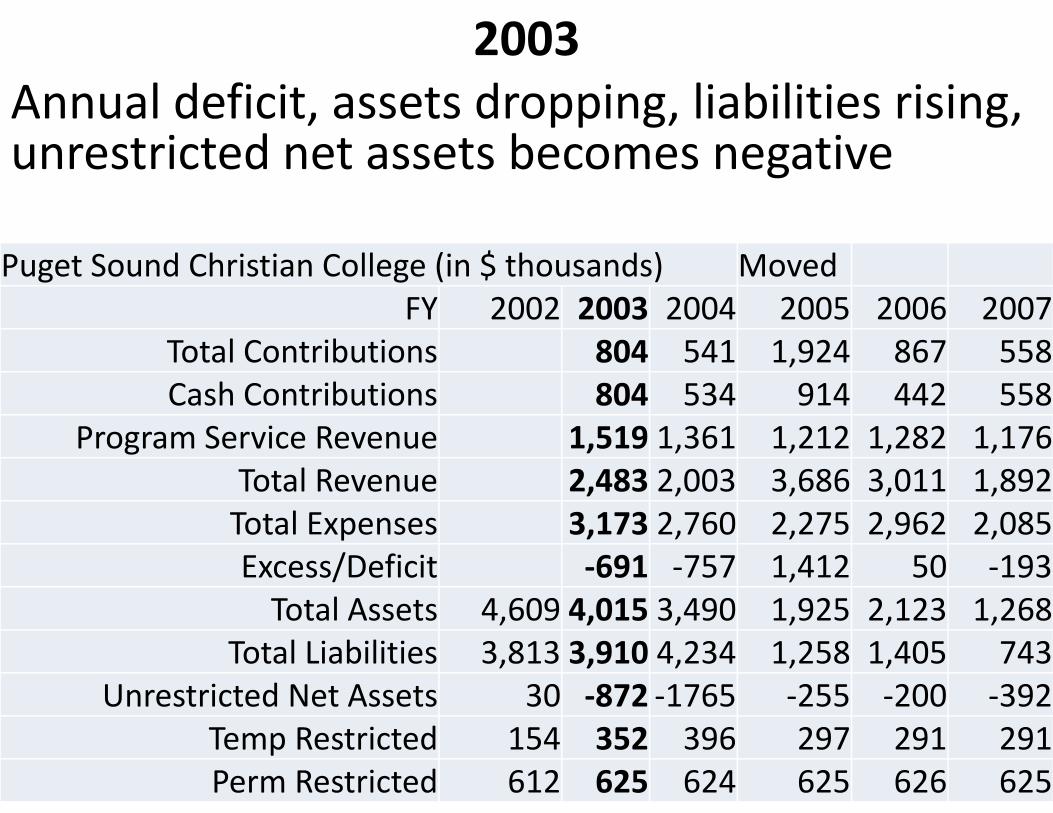
Puget Sound Christian College (in $ thousands) MovedFY 2002 2003 2004 2005 2006 2007
Total Contributions 804 541 1,924 867 558Cash Contributions 804 534 914 442 558
Program Service Revenue 1,519 1,361 1,212 1,282 1,176Total Revenue 2,483 2,003 3,686 3,011 1,892Total Expenses 3,173 2,760 2,275 2,962 2,085Excess/Deficit ‐691 ‐757 1,412 50 ‐193Total Assets 4,609 4,015 3,490 1,925 2,123 1,268
Total Liabilities 3,813 3,910 4,234 1,258 1,405 743Unrestricted Net Assets 30 ‐872 ‐1765 ‐255 ‐200 ‐392
Temp Restricted 154 352 396 297 291 291Perm Restricted 612 625 624 625 626 625
2003Annual deficit, assets dropping, liabilities rising, unrestricted net assets becomes negative
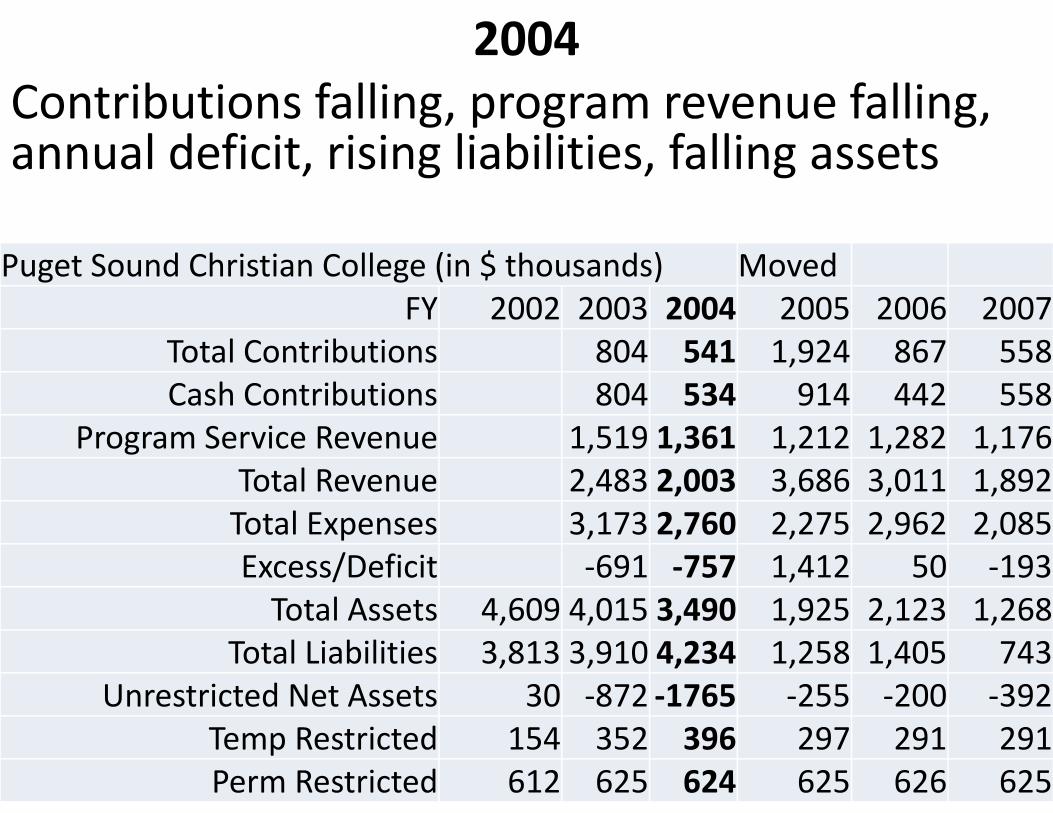
2004Contributions falling, program revenue falling, annual deficit, rising liabilities, falling assets
Puget Sound Christian College (in $ thousands) MovedFY 2002 2003 2004 2005 2006 2007
Total Contributions 804 541 1,924 867 558Cash Contributions 804 534 914 442 558
Program Service Revenue 1,519 1,361 1,212 1,282 1,176Total Revenue 2,483 2,003 3,686 3,011 1,892Total Expenses 3,173 2,760 2,275 2,962 2,085Excess/Deficit ‐691 ‐757 1,412 50 ‐193Total Assets 4,609 4,015 3,490 1,925 2,123 1,268
Total Liabilities 3,813 3,910 4,234 1,258 1,405 743Unrestricted Net Assets 30 ‐872 ‐1765 ‐255 ‐200 ‐392
Temp Restricted 154 352 396 297 291 291Perm Restricted 612 625 624 625 626 625
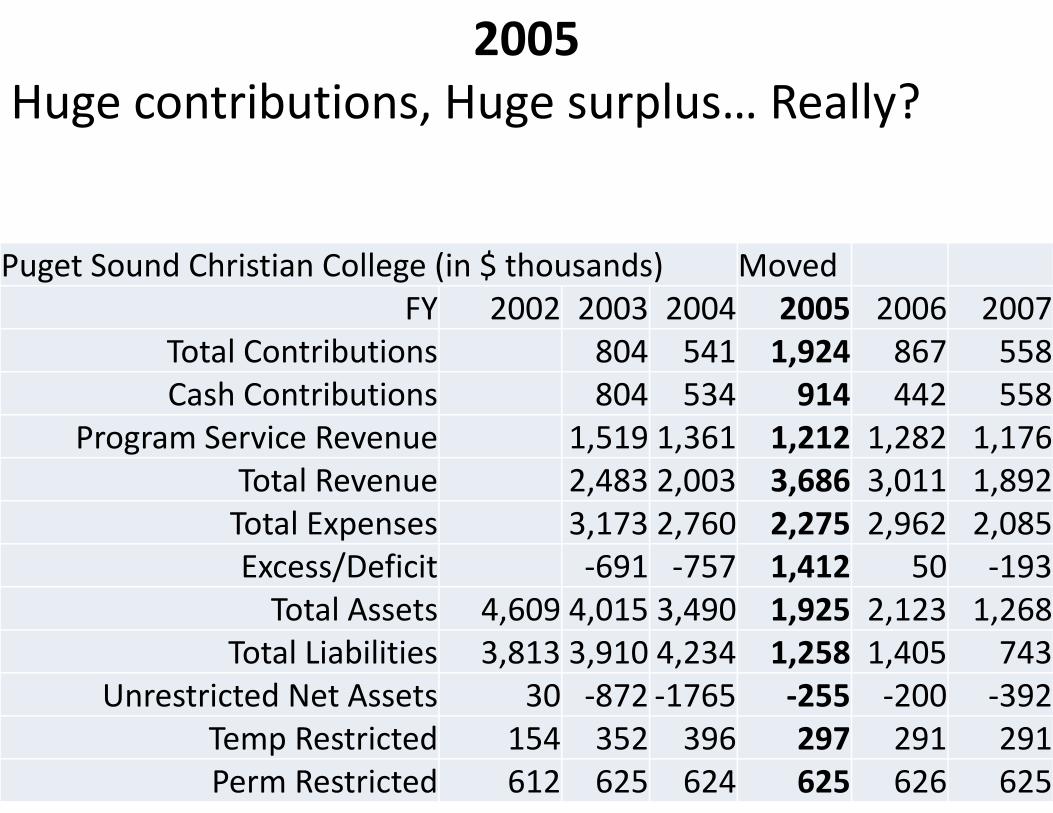
2005Huge contributions, Huge surplus… Really?
Puget Sound Christian College (in $ thousands) MovedFY 2002 2003 2004 2005 2006 2007
Total Contributions 804 541 1,924 867 558Cash Contributions 804 534 914 442 558
Program Service Revenue 1,519 1,361 1,212 1,282 1,176Total Revenue 2,483 2,003 3,686 3,011 1,892Total Expenses 3,173 2,760 2,275 2,962 2,085Excess/Deficit ‐691 ‐757 1,412 50 ‐193Total Assets 4,609 4,015 3,490 1,925 2,123 1,268
Total Liabilities 3,813 3,910 4,234 1,258 1,405 743Unrestricted Net Assets 30 ‐872 ‐1765 ‐255 ‐200 ‐392
Temp Restricted 154 352 396 297 291 291Perm Restricted 612 625 624 625 626 625
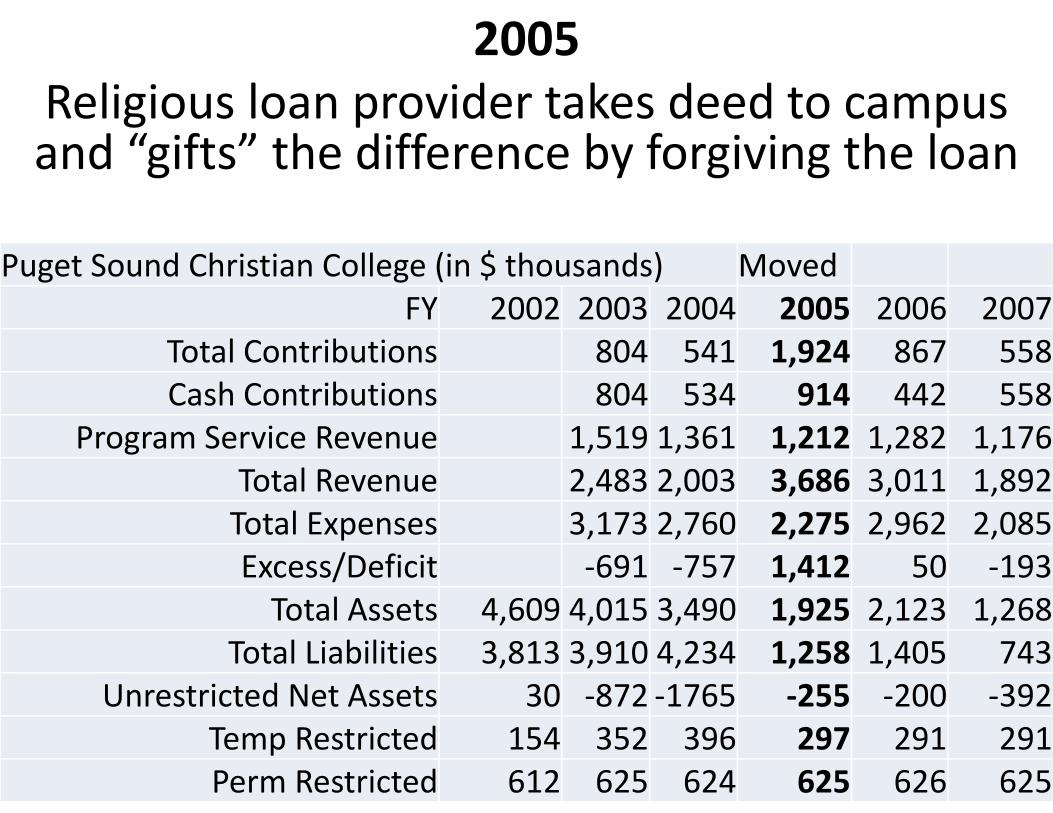
2005 Religious loan provider takes deed to campus and “gifts” the difference by forgiving the loan
Puget Sound Christian College (in $ thousands) MovedFY 2002 2003 2004 2005 2006 2007
Total Contributions 804 541 1,924 867 558Cash Contributions 804 534 914 442 558
Program Service Revenue 1,519 1,361 1,212 1,282 1,176Total Revenue 2,483 2,003 3,686 3,011 1,892Total Expenses 3,173 2,760 2,275 2,962 2,085Excess/Deficit ‐691 ‐757 1,412 50 ‐193Total Assets 4,609 4,015 3,490 1,925 2,123 1,268
Total Liabilities 3,813 3,910 4,234 1,258 1,405 743Unrestricted Net Assets 30 ‐872 ‐1765 ‐255 ‐200 ‐392
Temp Restricted 154 352 396 297 291 291Perm Restricted 612 625 624 625 626 625
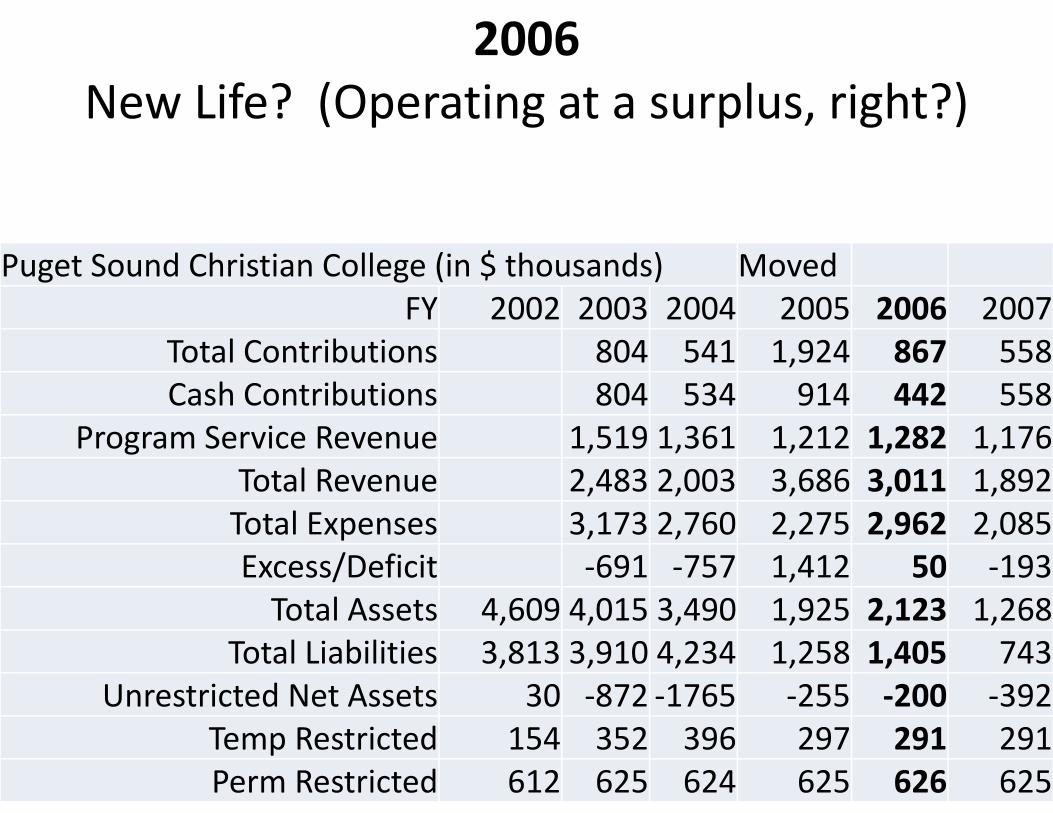
2006New Life? (Operating at a surplus, right?)
Puget Sound Christian College (in $ thousands) MovedFY 2002 2003 2004 2005 2006 2007
Total Contributions 804 541 1,924 867 558Cash Contributions 804 534 914 442 558
Program Service Revenue 1,519 1,361 1,212 1,282 1,176Total Revenue 2,483 2,003 3,686 3,011 1,892Total Expenses 3,173 2,760 2,275 2,962 2,085Excess/Deficit ‐691 ‐757 1,412 50 ‐193Total Assets 4,609 4,015 3,490 1,925 2,123 1,268
Total Liabilities 3,813 3,910 4,234 1,258 1,405 743Unrestricted Net Assets 30 ‐872 ‐1765 ‐255 ‐200 ‐392
Temp Restricted 154 352 396 297 291 291Perm Restricted 612 625 624 625 626 625
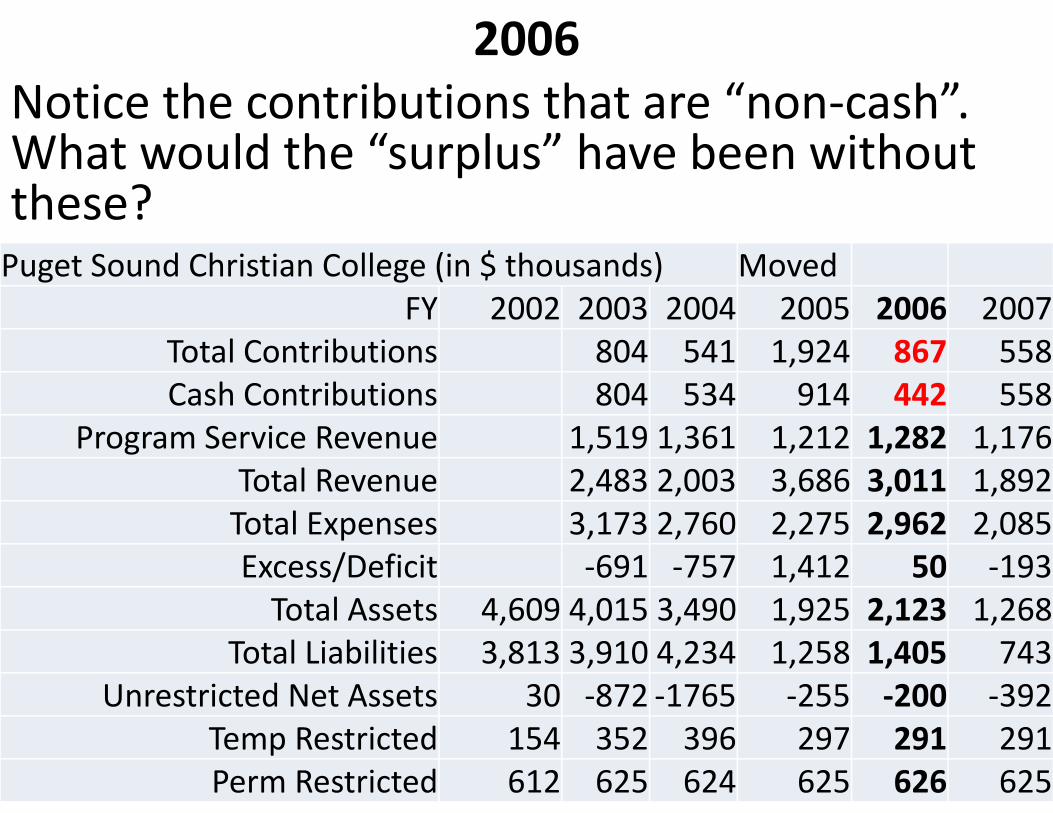
2006Notice the contributions that are “non‐cash”. What would the “surplus” have been without these?Puget Sound Christian College (in $ thousands) Moved
FY 2002 2003 2004 2005 2006 2007Total Contributions 804 541 1,924 867 558Cash Contributions 804 534 914 442 558
Program Service Revenue 1,519 1,361 1,212 1,282 1,176Total Revenue 2,483 2,003 3,686 3,011 1,892Total Expenses 3,173 2,760 2,275 2,962 2,085Excess/Deficit ‐691 ‐757 1,412 50 ‐193Total Assets 4,609 4,015 3,490 1,925 2,123 1,268
Total Liabilities 3,813 3,910 4,234 1,258 1,405 743Unrestricted Net Assets 30 ‐872 ‐1765 ‐255 ‐200 ‐392
Temp Restricted 154 352 396 297 291 291Perm Restricted 612 625 624 625 626 625
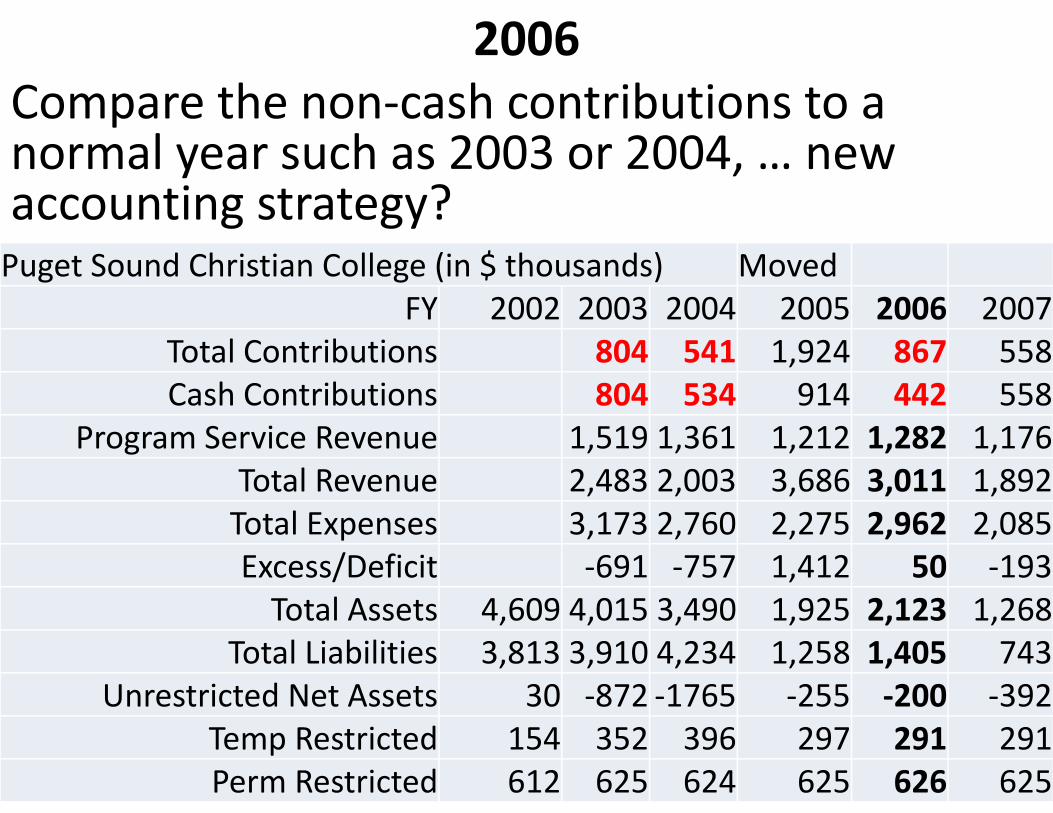
2006Compare the non‐cash contributions to a normal year such as 2003 or 2004, … new accounting strategy?Puget Sound Christian College (in $ thousands) Moved
FY 2002 2003 2004 2005 2006 2007Total Contributions 804 541 1,924 867 558Cash Contributions 804 534 914 442 558
Program Service Revenue 1,519 1,361 1,212 1,282 1,176Total Revenue 2,483 2,003 3,686 3,011 1,892Total Expenses 3,173 2,760 2,275 2,962 2,085Excess/Deficit ‐691 ‐757 1,412 50 ‐193Total Assets 4,609 4,015 3,490 1,925 2,123 1,268
Total Liabilities 3,813 3,910 4,234 1,258 1,405 743Unrestricted Net Assets 30 ‐872 ‐1765 ‐255 ‐200 ‐392
Temp Restricted 154 352 396 297 291 291Perm Restricted 612 625 624 625 626 625
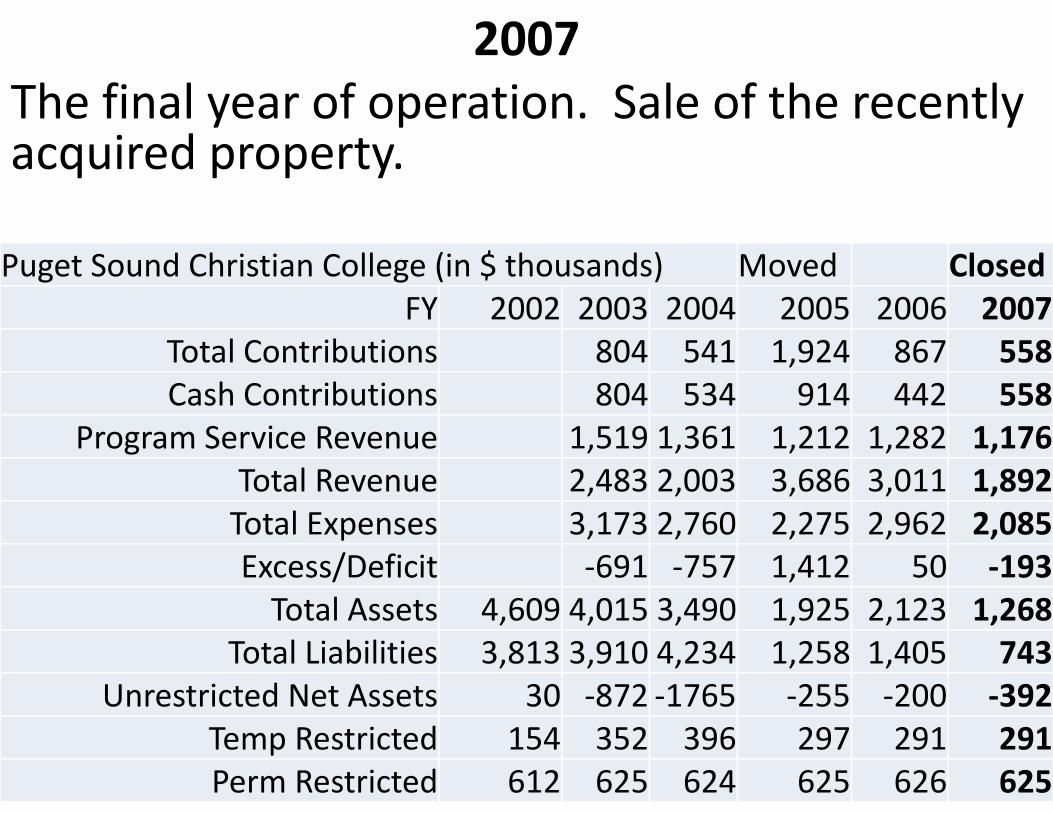
2007The final year of operation. Sale of the recently acquired property.
Puget Sound Christian College (in $ thousands) Moved ClosedFY 2002 2003 2004 2005 2006 2007
Total Contributions 804 541 1,924 867 558Cash Contributions 804 534 914 442 558
Program Service Revenue 1,519 1,361 1,212 1,282 1,176Total Revenue 2,483 2,003 3,686 3,011 1,892Total Expenses 3,173 2,760 2,275 2,962 2,085Excess/Deficit ‐691 ‐757 1,412 50 ‐193Total Assets 4,609 4,015 3,490 1,925 2,123 1,268
Total Liabilities 3,813 3,910 4,234 1,258 1,405 743Unrestricted Net Assets 30 ‐872 ‐1765 ‐255 ‐200 ‐392
Temp Restricted 154 352 396 297 291 291Perm Restricted 612 625 624 625 626 625
Once a nonprofit institution hits negative unrestricted assets, the time for a turnaround is relatively short
But a turnaround is still possible.
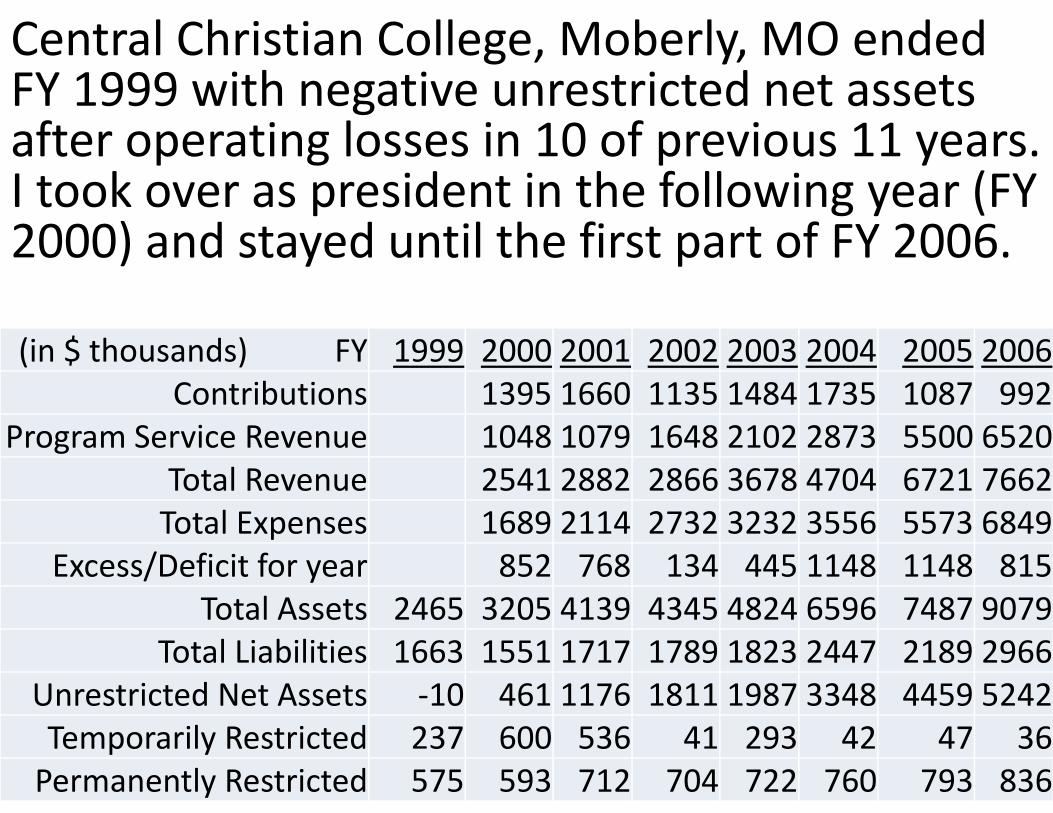
(in $ thousands) FY 1999 2000 2001 2002 2003 2004 2005 2006Contributions 1395 1660 1135 1484 1735 1087 992
Program Service Revenue 1048 1079 1648 2102 2873 5500 6520Total Revenue 2541 2882 2866 3678 4704 6721 7662Total Expenses 1689 2114 2732 3232 3556 5573 6849
Excess/Deficit for year 852 768 134 445 1148 1148 815Total Assets 2465 3205 4139 4345 4824 6596 7487 9079
Total Liabilities 1663 1551 1717 1789 1823 2447 2189 2966Unrestricted Net Assets ‐10 461 1176 1811 1987 3348 4459 5242Temporarily Restricted 237 600 536 41 293 42 47 36Permanently Restricted 575 593 712 704 722 760 793 836
Central Christian College, Moberly, MO ended FY 1999 with negative unrestricted net assets after operating losses in 10 of previous 11 years. I took over as president in the following year (FY 2000) and stayed until the first part of FY 2006.

How financially stable are most nonprofit organizations?
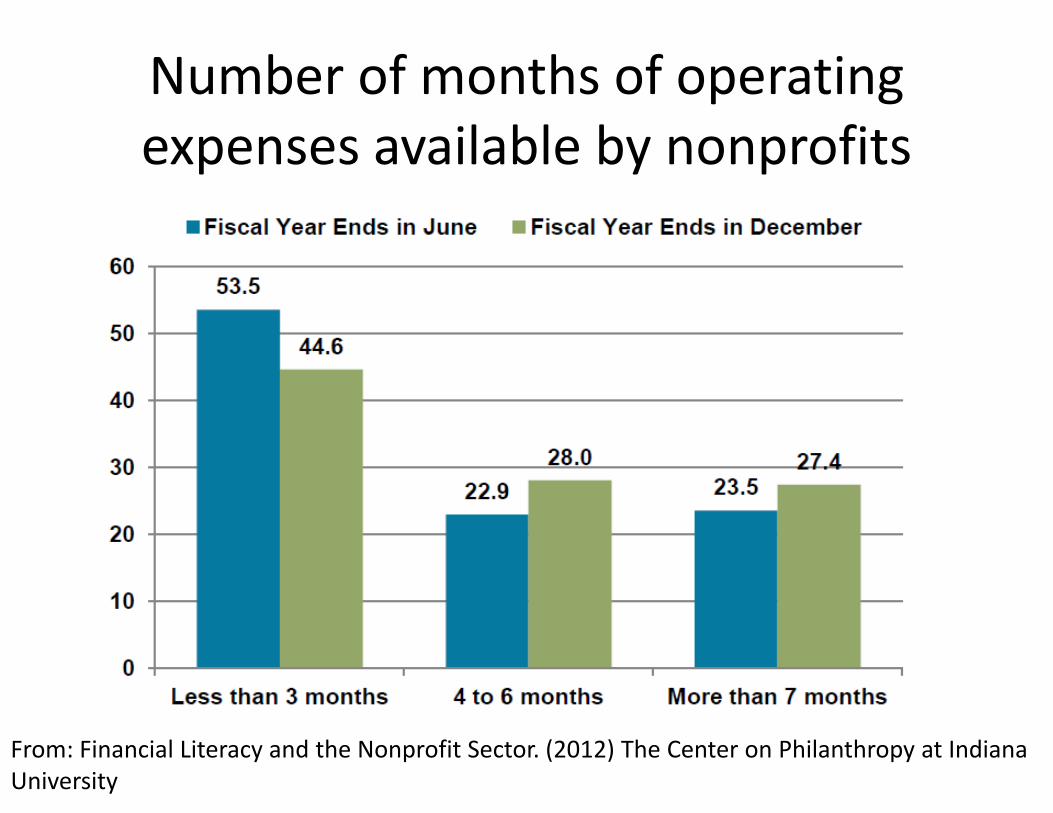
Number of months of operating expenses available by nonprofits
From: Financial Literacy and the Nonprofit Sector. (2012) The Center on Philanthropy at Indiana University
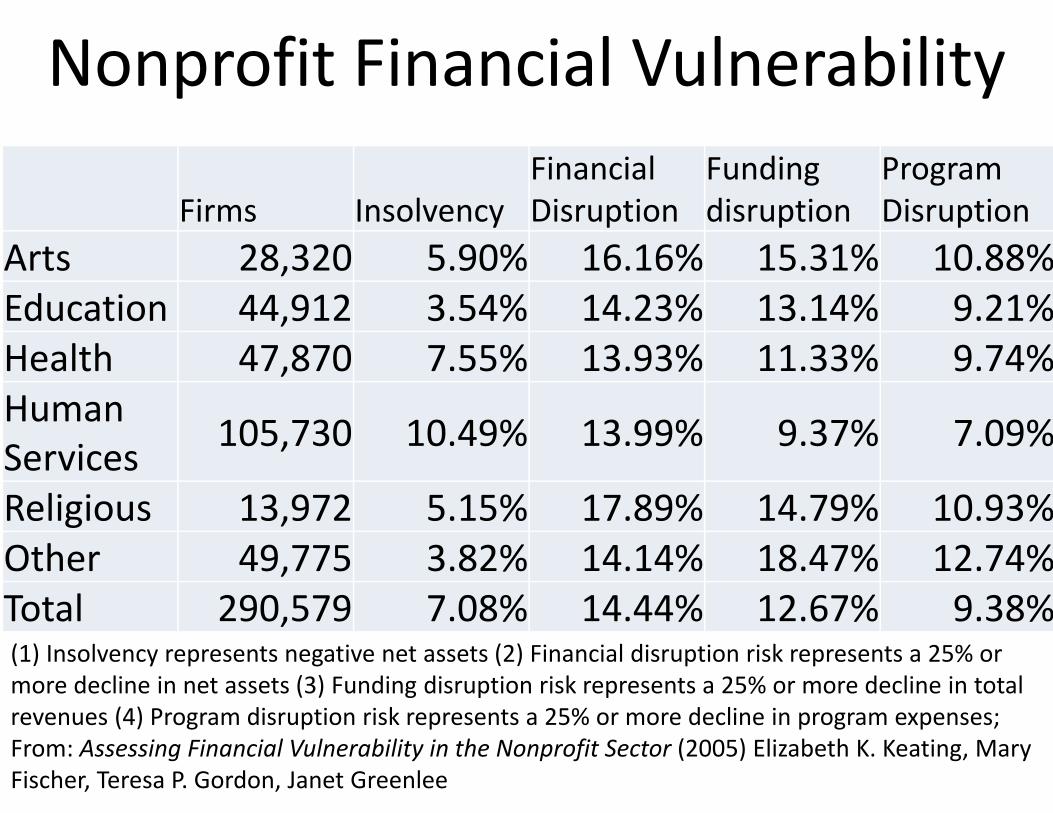
Firms InsolvencyFinancial Disruption
Funding disruption
Program Disruption
Arts 28,320 5.90% 16.16% 15.31% 10.88%Education 44,912 3.54% 14.23% 13.14% 9.21%Health 47,870 7.55% 13.93% 11.33% 9.74%Human Services 105,730 10.49% 13.99% 9.37% 7.09%
Religious 13,972 5.15% 17.89% 14.79% 10.93%Other 49,775 3.82% 14.14% 18.47% 12.74%Total 290,579 7.08% 14.44% 12.67% 9.38%(1) Insolvency represents negative net assets (2) Financial disruption risk represents a 25% or more decline in net assets (3) Funding disruption risk represents a 25% or more decline in total revenues (4) Program disruption risk represents a 25% or more decline in program expenses; From: Assessing Financial Vulnerability in the Nonprofit Sector (2005) Elizabeth K. Keating, Mary Fischer, Teresa P. Gordon, Janet Greenlee
Nonprofit Financial Vulnerability
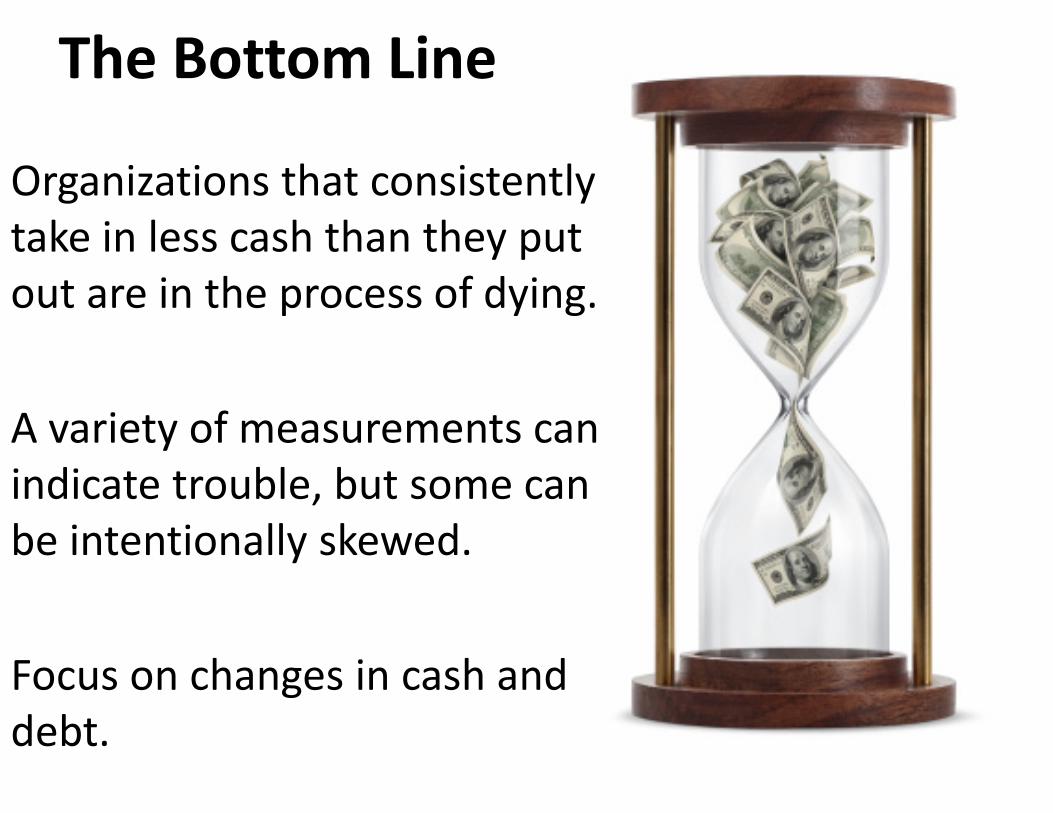
Organizations that consistently take in less cash than they put out are in the process of dying.
A variety of measurements can indicate trouble, but some can be intentionally skewed.
Focus on changes in cash and debt.
The Bottom Line

This slide set is from the curriculum for the Graduate Certificate in Charitable Financial Planning at Texas Tech University, home to the nation’s largest graduate program in personal financial planning.
To find out more about the online Graduate Certificate in Charitable Financial Planning go to www.EncourageGenerosity.com
To find out more about the M.S. or Ph.D. in personal financial planning at Texas Tech University, go to www.depts.ttu.edu/pfp/
Graduate Studies in Charitable Financial Planningat Texas Tech University
About the Author
Russell James, J.D., Ph.D., CFP® is an Associate Professor and the Director of Graduate Studies in Charitable Planning in the Departmentof Personal Financial Planning at Texas Tech University. He graduated, cum laude, from the University of Missouri School of Law where he was a member of the Missouri Law Review. While in law school he received the United Missouri Bank Award for Most Outstanding Work in Gift and Estate Taxation and Planning and the American Jurisprudence Award for Most Outstanding Work in Federal Income Taxation. After graduation, he worked as the Director of Planned Giving for Central Christian College, Moberly, Missouri for six years and also built a successful law practice limited to estate and gift planning. He later served as president of the college for more than five years, where he had direct and supervisory responsibility for all fundraising. Dr. James received his Ph.D. in Consumer & Family Economics from the University of Missouri where his dissertation was on the topic of charitable giving. Dr. James has over 100 publications in print or in press in academic journals, conference proceedings, professional periodicals, and books. He has been quoted in a variety of news outlets including The Wall Street Journal, The New York Times, U.S. News & World Reports, Associate Press, and USA Today.
Me (about 5 years ago)
At Giving Korea 2010. I didn’t notice until later the projector was shining on my head (inter‐cultural height problems).
Lecturing in Germany. 75 extra students showed up. I thought it was for me until I found out there was free beer afterwards.