Embed Size (px)
Citation preview

Start hacking finance data with Python
driller@patraqushePyConJP 2016
September 22, 2016

About me
driller
@patraqushe
derivative trader
1.5 year
2
Agenda
Are you still exhausted from Excel?
Don’t be afraid of time series data
Using Jupyter Notebook
3
Why Python for Finance?
Analyzing data with simple code Substantial libraries(especially Deep leaning)pandasJupyter NotebookCooperating with:
Scraping, crawlingWeb frame workInfrastructure
4
Why Python in my case
Developed trading tools using ExcelAdding new functions and changing rules of exchange became
gradually more difficultPython is the most manageable(in my opinion)Pandas is similar to ExcelDrastically cheaper using Jupyter Notebooks
5
Are you still exhausted from Excel?~ Migrate from Excel to Python to improve productivity ~
6
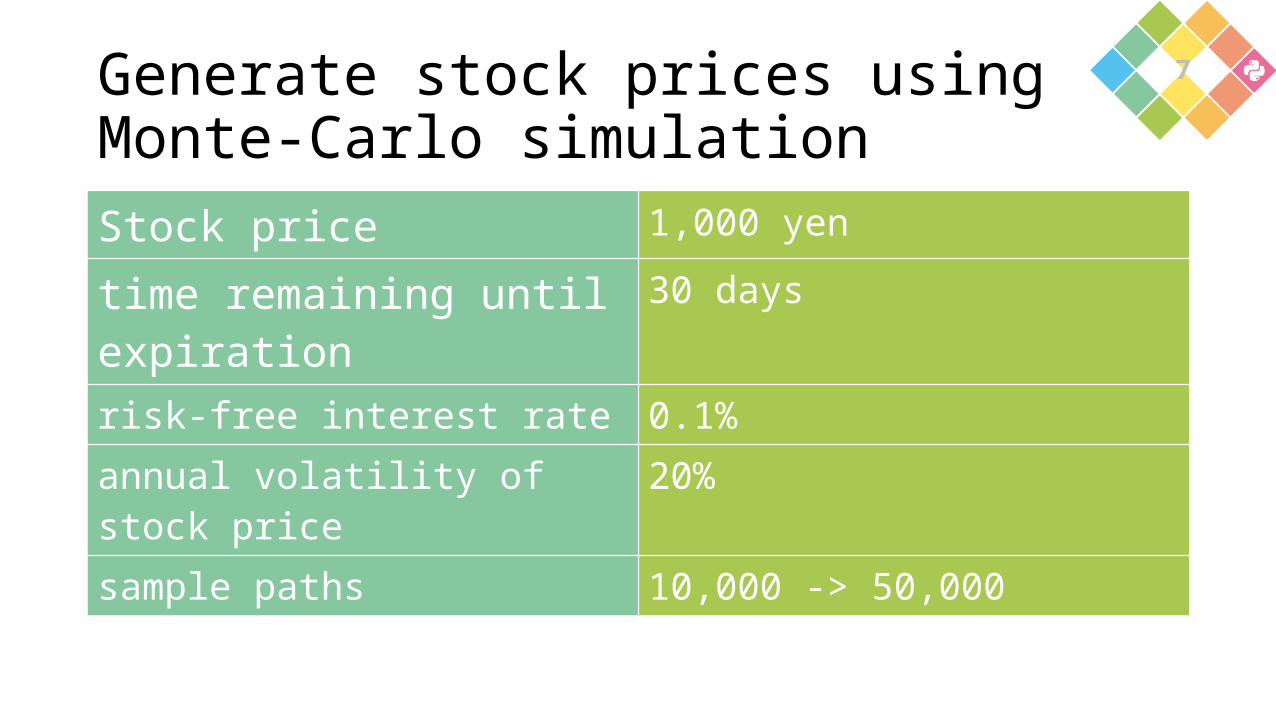
Generate stock prices using Monte-Carlo simulationStock price 1,000 yentime remaining until expiration
30 days
risk-free interest rate 0.1%annual volatility of stock price 20%sample paths 10,000 -> 50,000
7
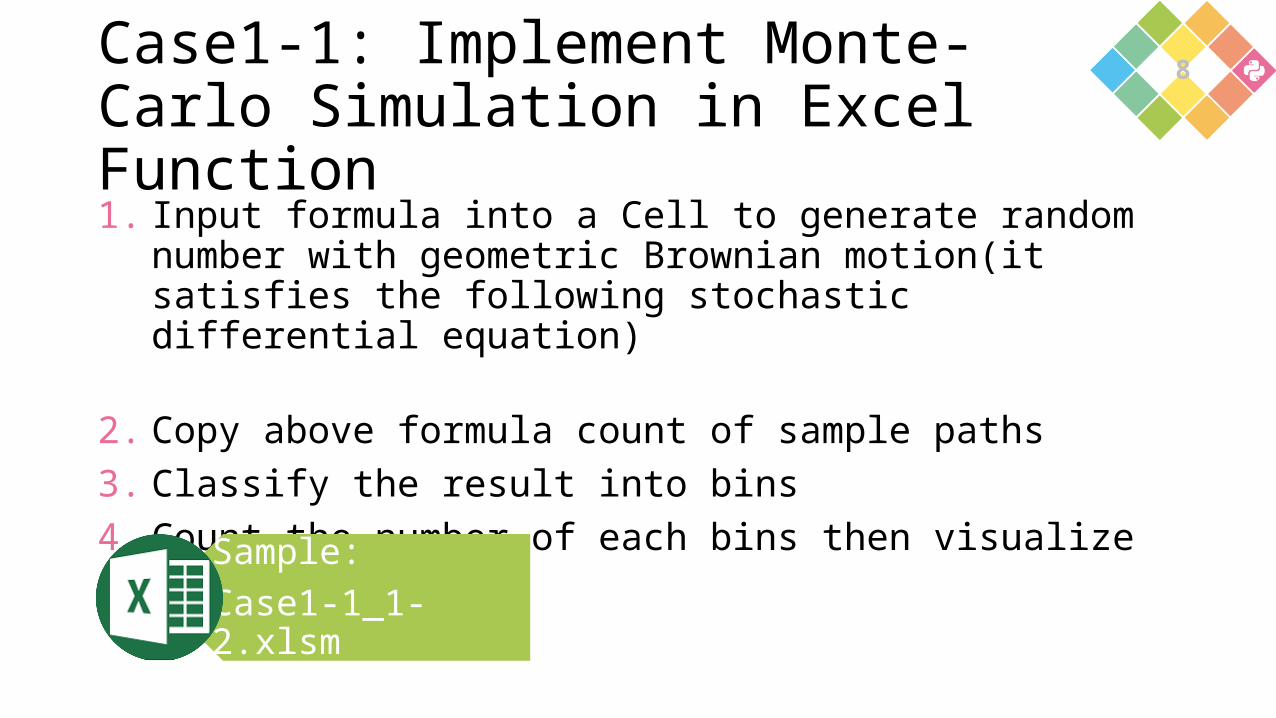
Case1-1: Implement Monte-Carlo Simulation in Excel Function1. Input formula into a Cell to generate random number with
geometric Brownian motion(it satisfies the following stochastic differential equation)
2. Copy above formula count of sample paths3. Classify the result into bins4. Count the number of each bins then visualize
Sample:Case1-1_1-2.xlsm
8
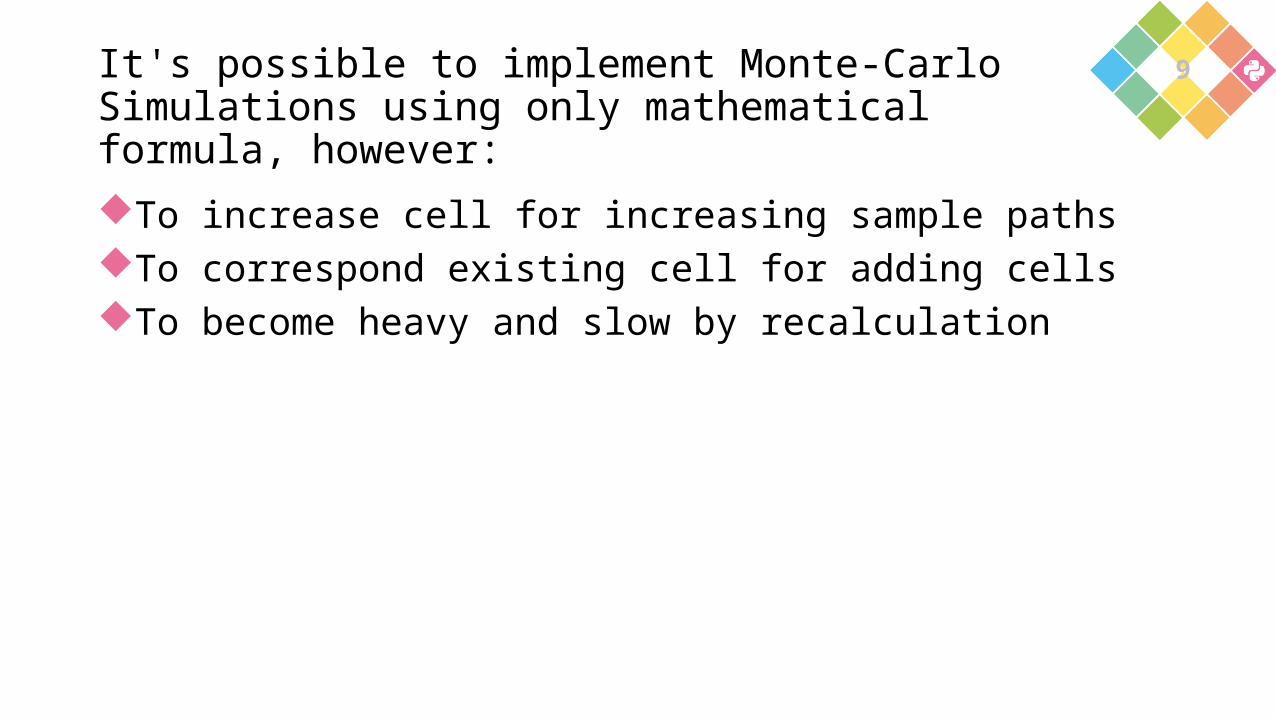
It's possible to implement Monte-Carlo Simulations using only mathematical formula, however:
To increase cell for increasing sample pathsTo correspond existing cell for adding cellsTo become heavy and slow by recalculation
9
Case1-2: Implement Monte-Carlo Simulation in VBAVery long code(especially histogram)When changing the layout of an Excel sheet, you have to change all
the addresses of related cells(can handle by "name manager" partially)
Very slow
10
Sample:Case1-1_1-2.xlsm
Case1-3: Implement Monte-Carlo Simulation in PythonVery short code(especially histogram)No need to consider data storageFaster than VBA
Sample:Case1-3.ipynb
11
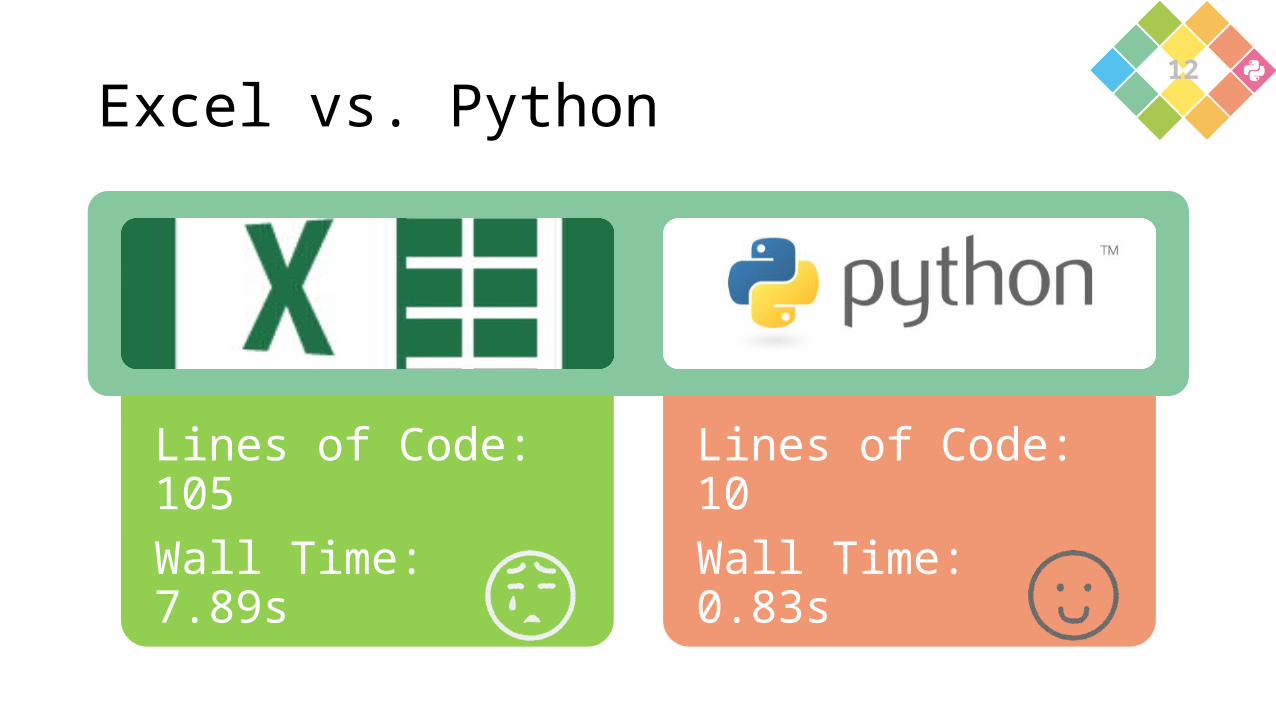
Excel vs. Python
Lines of Code: 105 Wall Time: 7.89sMore complex
Lines of Code: 10Wall Time: 0.83sMore simple
12
Though, Excel has the advantage of…
Easy to input Easy to create a templateA huge number of users(high data compatibility)
13
Python packages to work with Excel files
xlrdxlwtXlsxWriterxlutilsopenpyxlxlwingsExcelPython
14
There are many packages, but…
pandas.read_excel() will almost always be what I wantUse other packages for the operation that pandas cannot do
Write data to an opened fileOperate Cell Draw graphs…
15

Case1-4: Relationship Economic indicator and exchange rate and stock priceOpen Economic indicator & Stock price Excel file @ vdata.nikkei.com
through pandas Economic indicator
Real Gross Domestic ProductDiffusion Index
Currency Pair : USD/JPYStock: Nikkei Index
Visualize by seaborn
Sample:Case1-4.ipynb
16
Case 1-5: Relationship ETF/J-REIT purchases and stock pricesOpen Excel files @ boj.or.jp through pandasLoad TSE REIT index and stock Indices price data from k-db site
Stock IndicesTOPIXJPX400Nikkei225
Visualize relationship using seaborn
Sample:Case1-5.ipynb
17
Use xlwings
Read/Write open Excel filesSupports Numpy and pandas data typesCall Python script from ExcelWrite Excel User Defined Functions(UDF) in PythonUse openpyxl for Cell & Chart operation
18
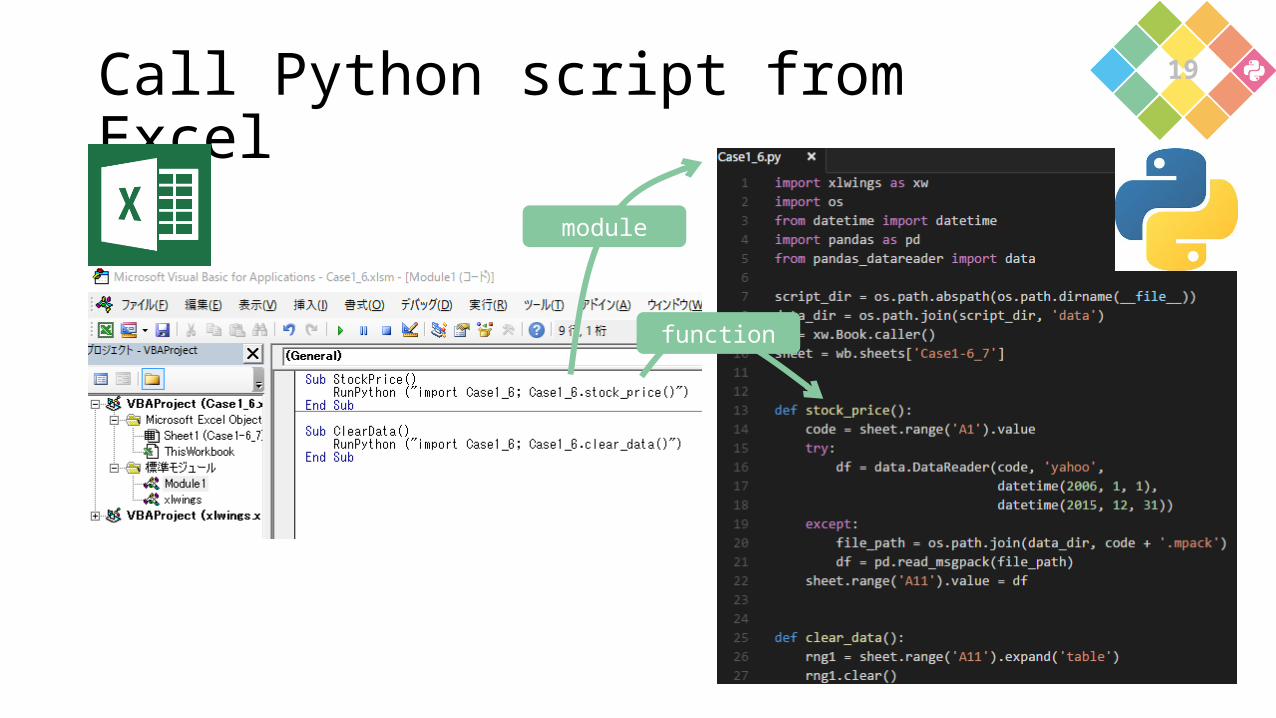
Call Python script from Excel
module
function
19
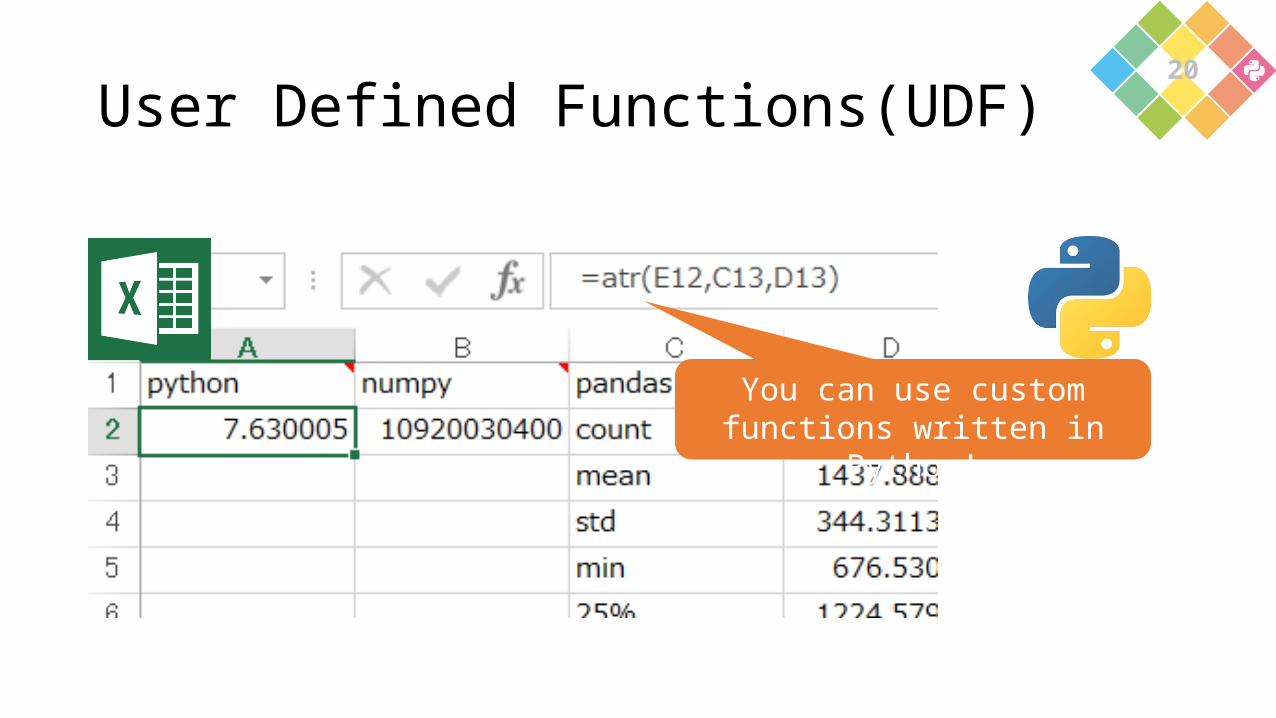
User Defined Functions(UDF)
You can use custom functions written in Python!
20
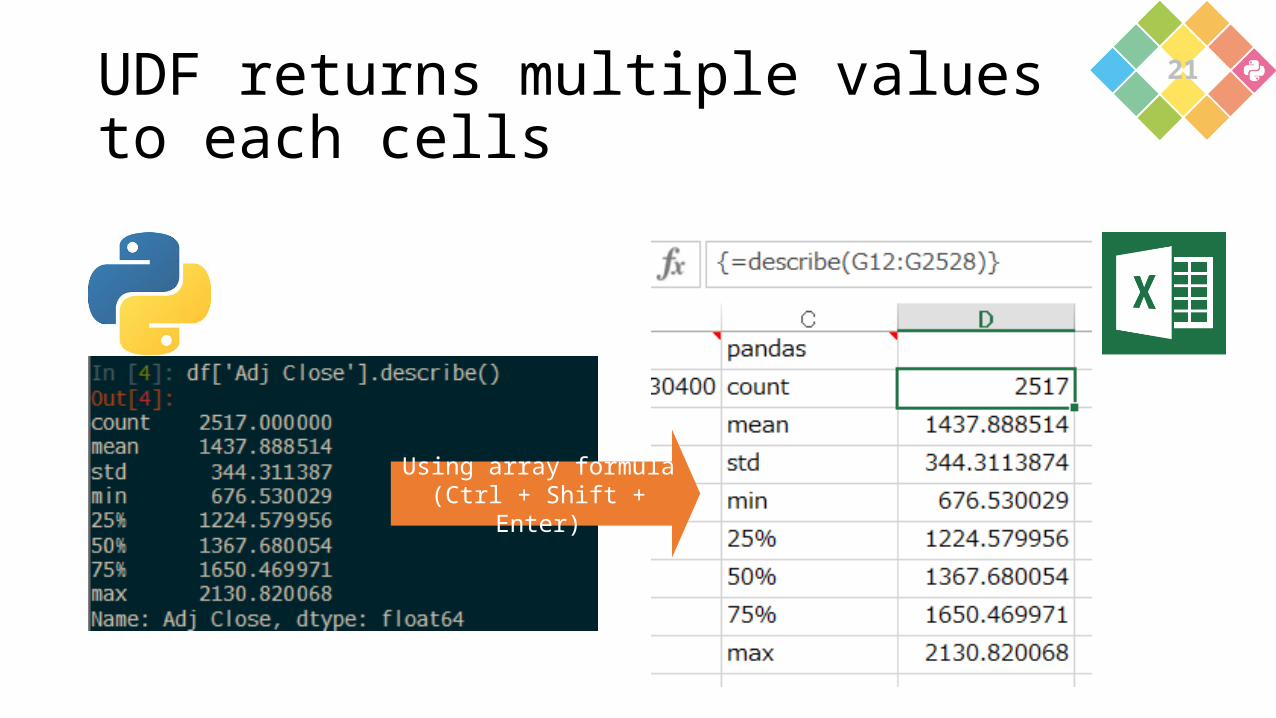
UDF returns multiple values to each cells
Using array formula(Ctrl + Shift + Enter)
21
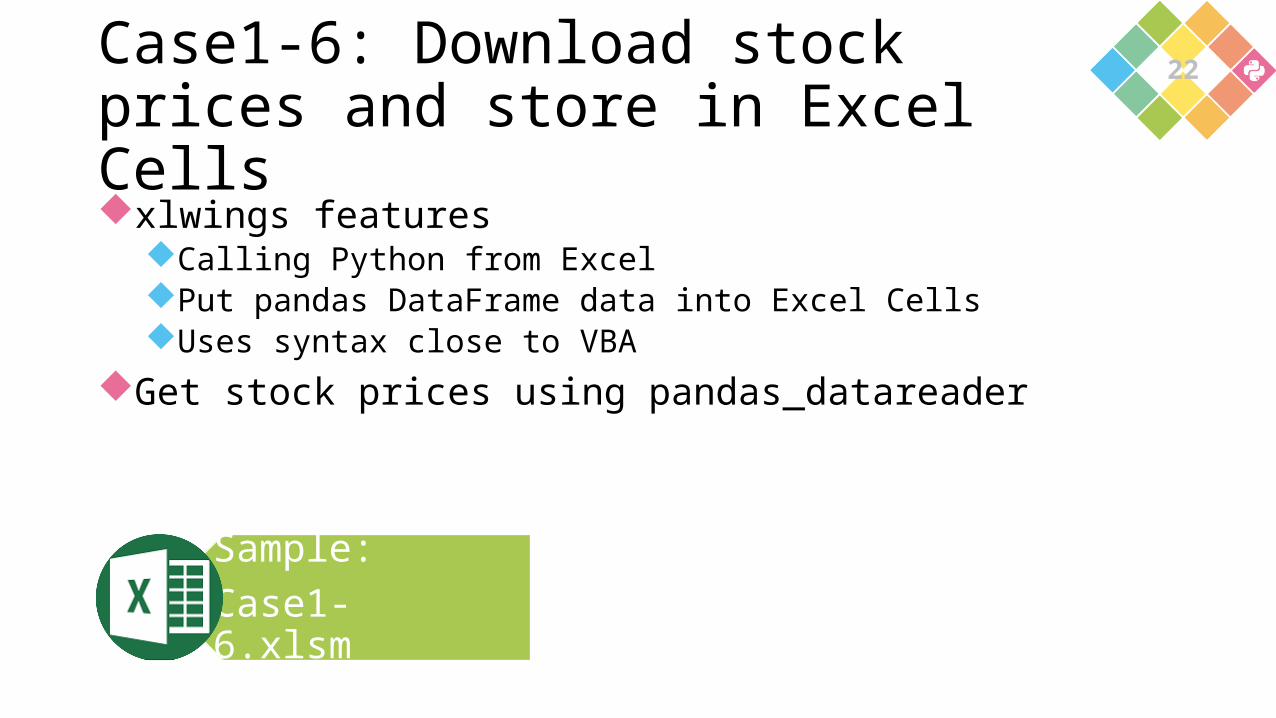
Case1-6: Download stock prices and store in Excel Cellsxlwings features
Calling Python from ExcelPut pandas DataFrame data into Excel CellsUses syntax close to VBA
Get stock prices using pandas_datareader
22
Sample:Case1-6.xlsm
Case 1-7: Create User Defined Functions using Python, and use it in ExcelWindows onlyInstall add-inCall function written in Python like an Excel function Fetch Excel Range(multiple Cells) as array data(pandas or Numpy) in
UDF functionInput multiple return values into Excel Range(multiple Cells)
23
Sample:Case1-7.xlsm

Don’t be afraid of time series data~ Get used to pandas~
24
Why pandas?Wes McKinney built pandas during his tenure at AQR(a quantitative investment
management firm)Enable all these things in one place
Data structures with labeled axes supporting automatic or explicit data alignment Integrated time series functionalityOne data structure to handle both time series and non-time series dataArithmetic operations and reductionsFlexible handling of missing dataMerge and other relational operations found in popular database databases(SQL based,
for example)Pandas is developed by financial specialists, so it is well suited to analyse
financial data
25

Case2-1: Use DatetimeIndex
pandas.date_range is very useful to create continuous dataAdvantage of DatetimeIndex :
Specify various types when selecting a locationdatetime.date, datetime.datetime, datetime.time, str, int and so on…
Able to parse most known formats(similar to parsing by dateutil.parser)Allows slicing into year, month, etcHandles missing values
Sample:Case2-1_2.ipynb
26
Case2-2: Create OHLC data and covert time rangeNot that easy to create OHLCConvert time-series data into frequencies using the .resample()
method .resample() performs resampling operations during frequency
conversionDaily, Weekly, 30minute, 1hour, Quarter, etc
There are tips to convert between different OHLC data representations
Sample:Case2-1_2.ipynb
27
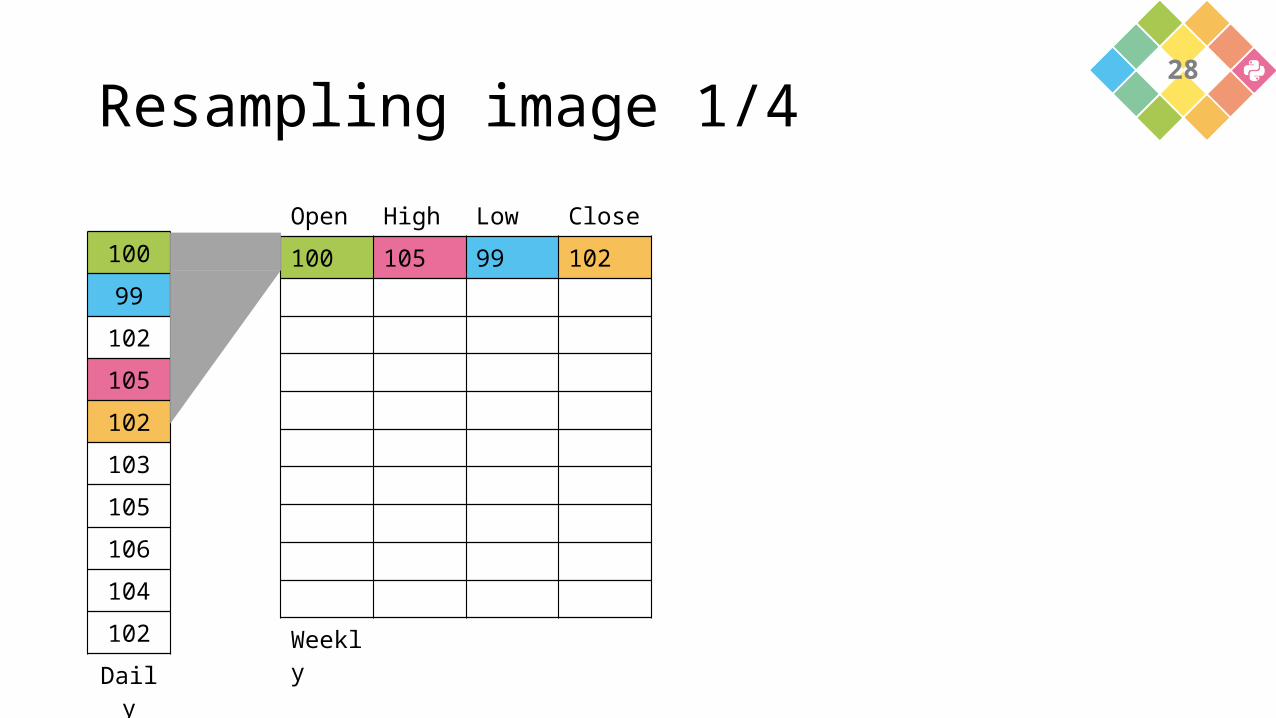
Resampling image 1/4
10099
102105102103105106104102
Daily
Open High Low Close100 105 99 102
Weekly
28
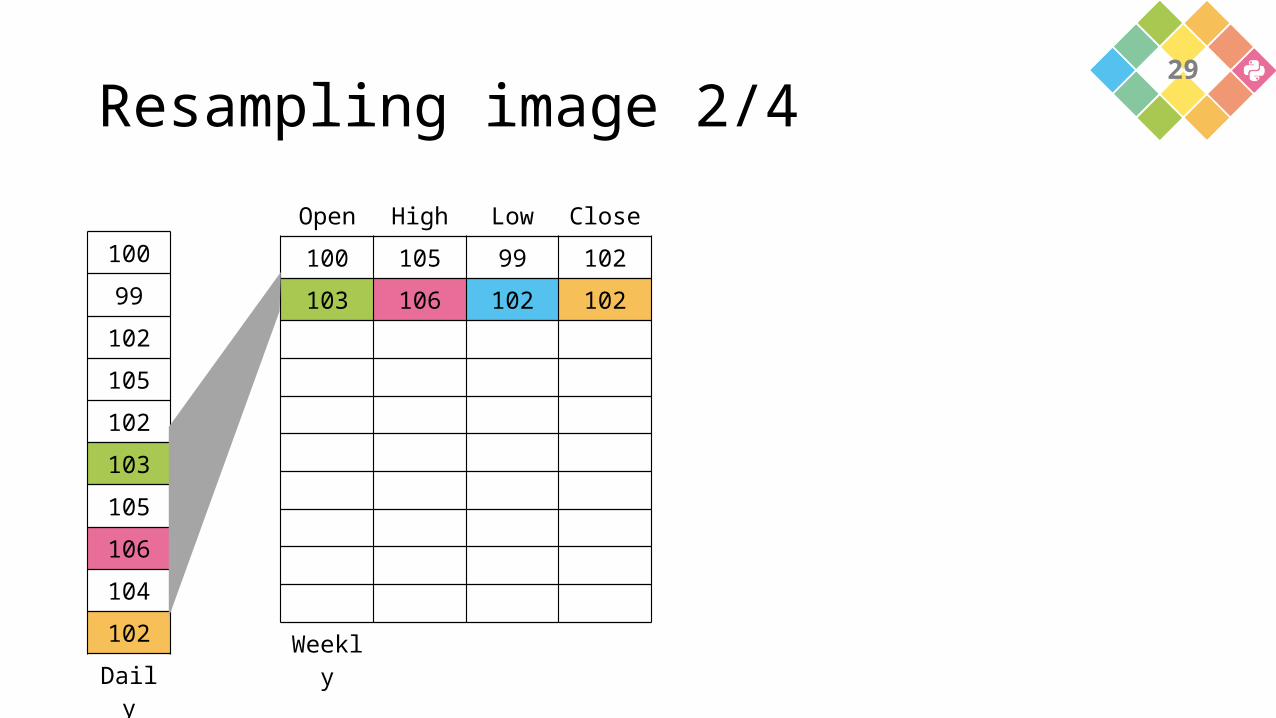
Resampling image 2/4
10099
102105102103105106104102
Daily
Open High Low Close100 105 99 102103 106 102 102
Weekly
29
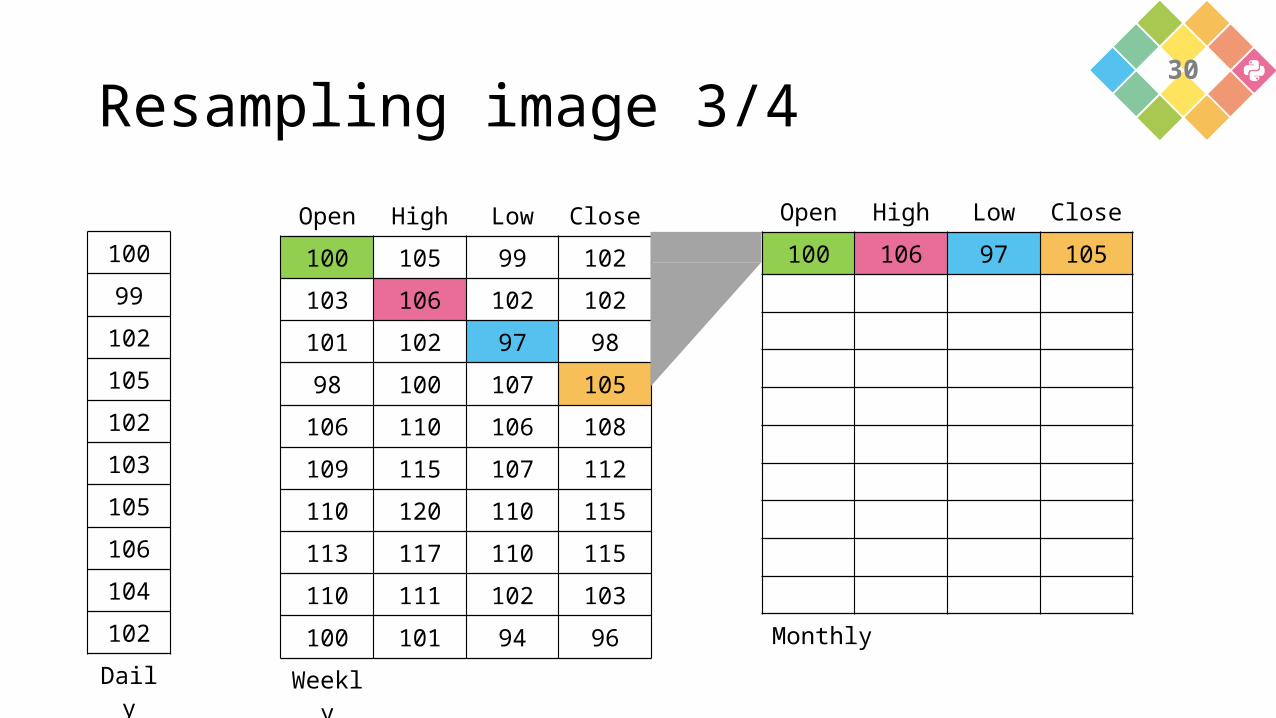
Resampling image 3/4
10099
102105102103105106104102
Daily
Open High Low Close100 105 99 102103 106 102 102101 102 97 9898 100 107 105
106 110 106 108109 115 107 112110 120 110 115113 117 110 115110 111 102 103100 101 94 96
Weekly
Open High Low Close100 106 97 105
Monthly
30
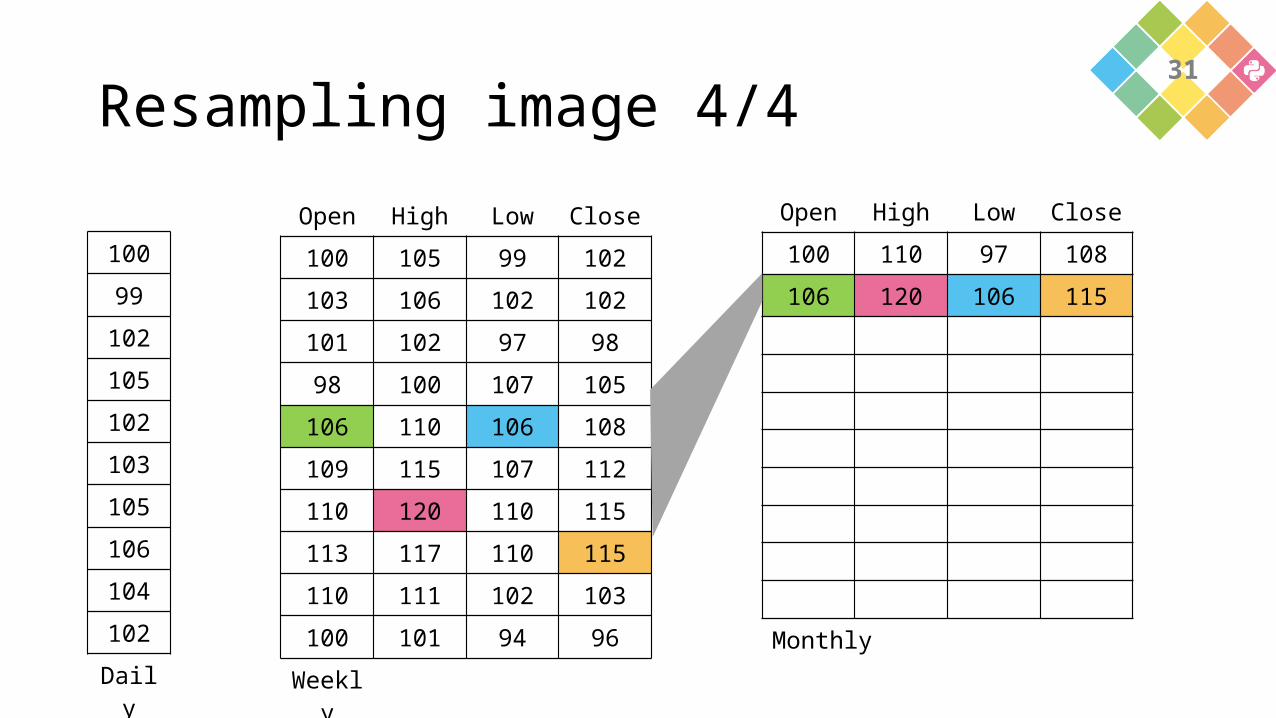
Resampling image 4/4
10099
102105102103105106104102
Daily
Open High Low Close100 105 99 102103 106 102 102101 102 97 9898 100 107 105
106 110 106 108109 115 107 112110 120 110 115113 117 110 115110 111 102 103100 101 94 96
Weekly
Open High Low Close100 110 97 108106 120 106 115
Monthly
31
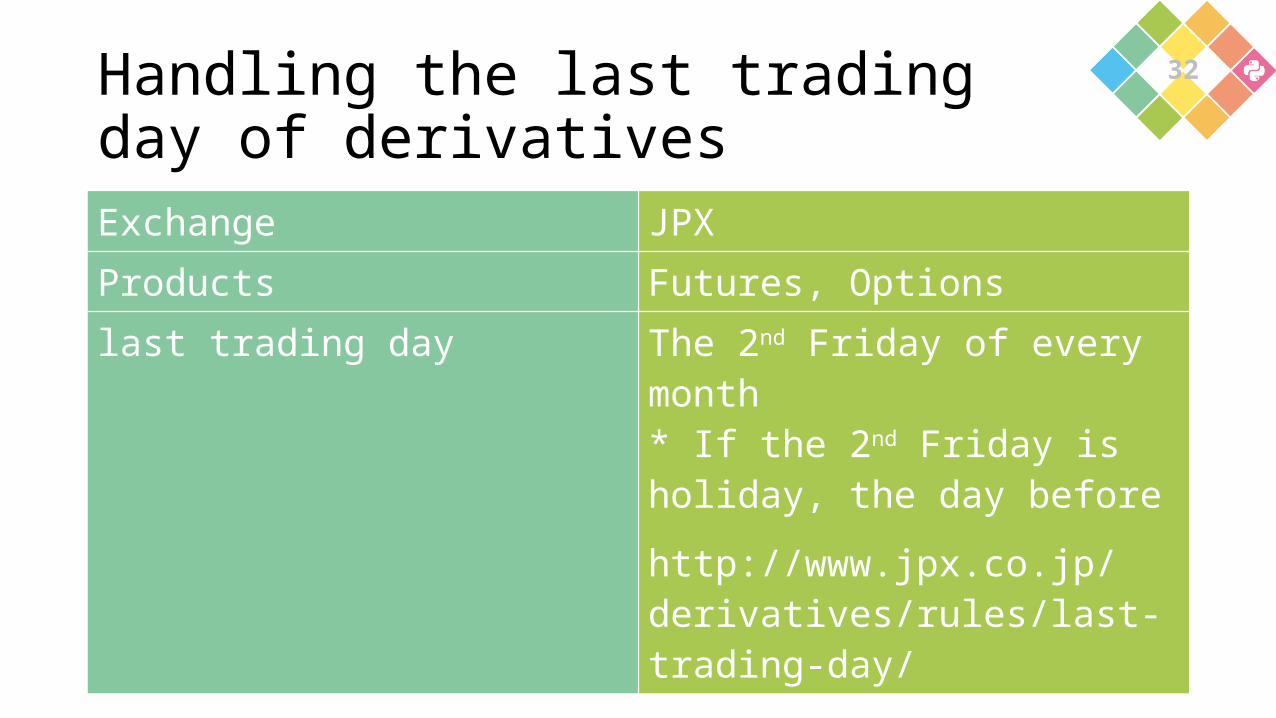
Handling the last trading day of derivativesExchange JPXProducts Futures, Optionslast trading day The 2nd Friday of every month
* If the 2nd Friday is holiday, the day beforehttp://www.jpx.co.jp/derivatives/rules/last-trading-day/
32
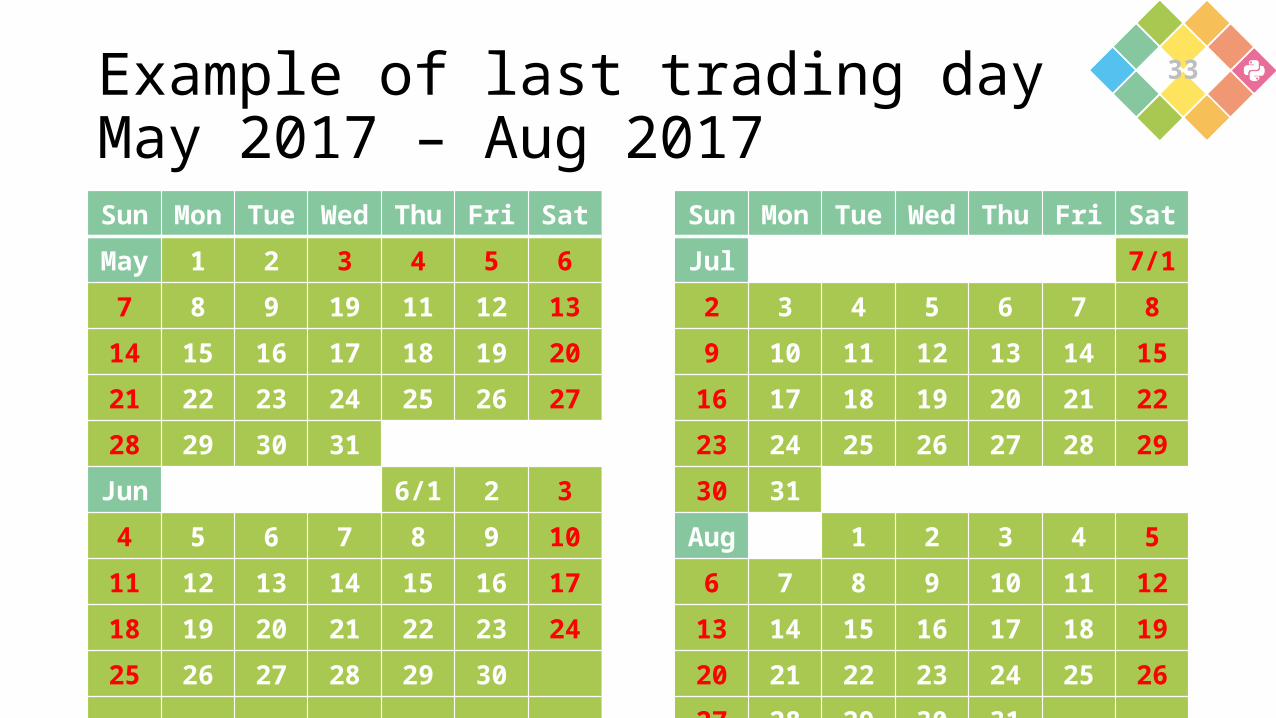
Example of last trading dayMay 2017 – Aug 2017Sun Mon Tue Wed Thu Fri Sat Sun Mon Tue Wed Thu Fri SatMay 1 2 3 4 5 6 Jul 7/17 8 9 19 11 12 13 2 3 4 5 6 7 814 15 16 17 18 19 20 9 10 11 12 13 14 1521 22 23 24 25 26 27 16 17 18 19 20 21 2228 29 30 31 23 24 25 26 27 28 29Jun 6/1 2 3 30 314 5 6 7 8 9 10 Aug 1 2 3 4 511 12 13 14 15 16 17 6 7 8 9 10 11 1218 19 20 21 22 23 24 13 14 15 16 17 18 1925 26 27 28 29 30 20 21 22 23 24 25 26
27 28 29 30 31
33
Sun Mon Tue Wed Thu Fri Sat Sun Mon Tue Wed Thu Fri SatMay 1 2 3 4 5 6 Jul 7/17 8 9 19 11 12 13 2 3 4 5 6 7 814 15 16 17 18 19 20 9 10 11 12 13 14 1521 22 23 24 25 26 27 16 17 18 19 20 21 2228 29 30 31 23 24 25 26 27 28 29Jun 6/1 2 3 30 314 5 6 7 8 9 10 Aug 1 2 3 4 511 12 13 14 15 16 17 6 7 8 9 10 11 1218 19 20 21 22 23 24 13 14 15 16 17 18 1925 26 27 28 29 30 20 21 22 23 24 25 26
27 28 29 30 31
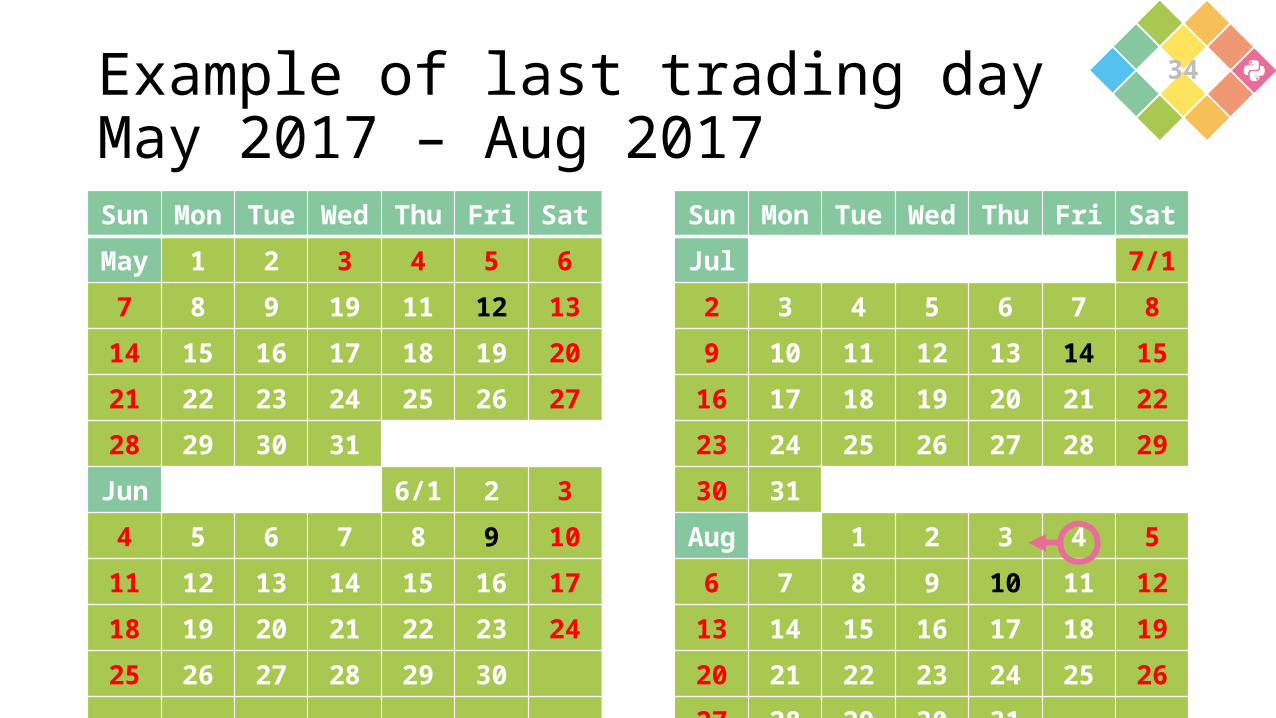
Example of last trading dayMay 2017 – Aug 2017
34
Sun Mon Tue Wed Thu Fri Sat Sun Mon Tue Wed Thu Fri SatMay 1 2 3 4 5 6 Jul 7/17 8 9 19 11 12 13 2 3 4 5 6 7 814 15 16 17 18 19 20 9 10 11 12 13 14 1521 22 23 24 25 26 27 16 17 18 19 20 21 2228 29 30 31 23 24 25 26 27 28 29Jun 6/1 2 3 30 314 5 6 7 8 9 10 Aug 1 2 3 4 511 12 13 14 15 16 17 6 7 8 9 10 11 1218 19 20 21 22 23 24 13 14 15 16 17 18 1925 26 27 28 29 30 20 21 22 23 24 25 26
27 28 29 30 31
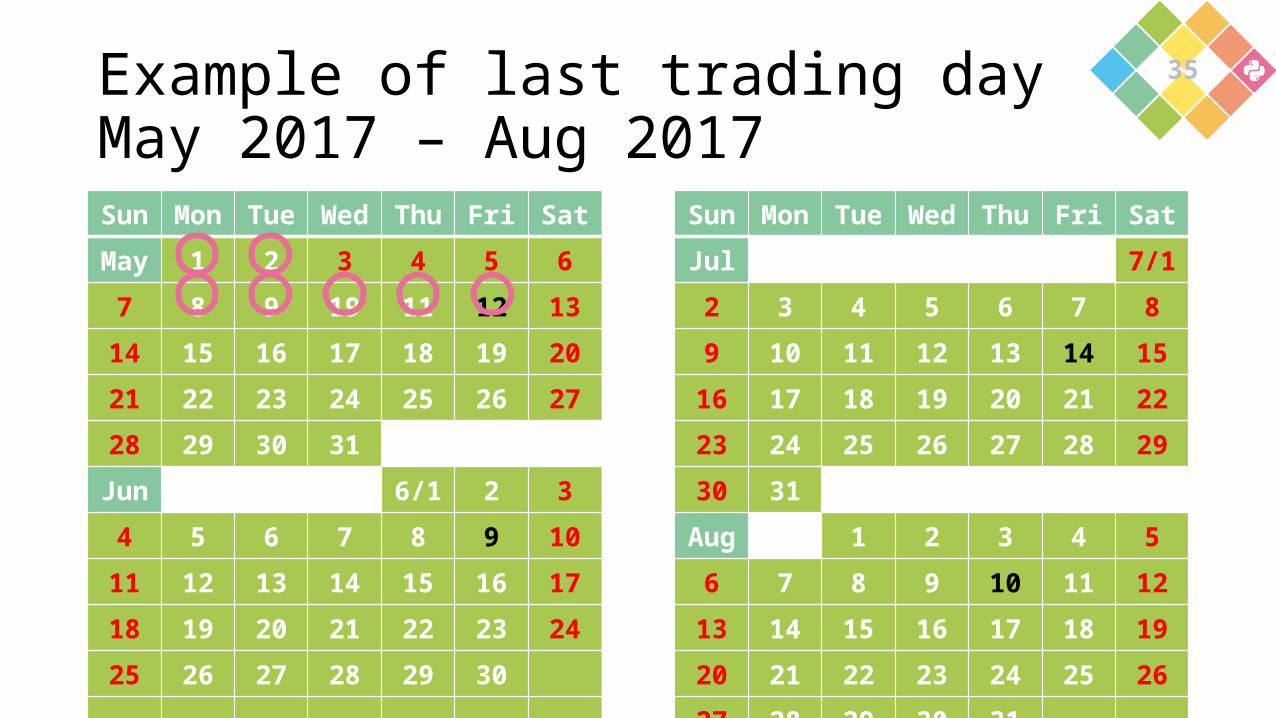
Example of last trading dayMay 2017 – Aug 2017
35

Issues
Be aware of holidaysPicking the 2nd friday
36
Dealing with Japanese public holidays
pandas.tseries.holiday only supports US holidays(as of Sep 22nd, 2016)
It's possible ot create your own holiday rules by inheriting AbstractHolidayCalendar, but...
Does not solve holidays such as Spring/Autumn EquinoxInstead, use CustomBusinessDay to implement individual holidaysImplement Japanese holidays in pandas using existing calendar data
37
Case2-3: Compute the last trading day using the CustomBusinessDay classImport holiday data from YAML fileSelect the 2nd friday of evey month using
pandas.date_range(feq='WOM-2FRI')Skip holidays using the CustomBusinessDay class
Sample:Case2-3.ipynb
38

Using Jupyter Notebook~ Don’t miss useful functions ~
Case3-1: Create own magic command
Search stock price using "line magic", and output it to IPython.display.Iframe
Paste data in various formats into notebook cells using "cell magic" , and convert it into a pandas DataFrame
Save frequently used commands to a file and re-use them using %load_ext
Sample:Case3-1.ipynb
40
Case3-2: ipywidgets is the easiest way to create a UIEasy to implement a UI using the ipywidgets.interact decoratorAutomatically creates UI controls for function arguments
bool: check box Int: slider
Creates interactive visualization of moving averages and Bollinger-Bands
Sample:Case3-2.ipynb
41
Useful Nbextensions
Best installed using jupyter_contrib_nbextensions https://github.com/ipython-contrib/jupyter_contrib_nbextensions* Of course, it is possible to install Nbextention individually
Easy to enable/disable indiviudal extensions using the Nbextensions edit menu
Create your own extensions using Javascript
42
Today’s summary
Python >>> Excel
Suitable for handling time series data
Easy to create commands and UI
43
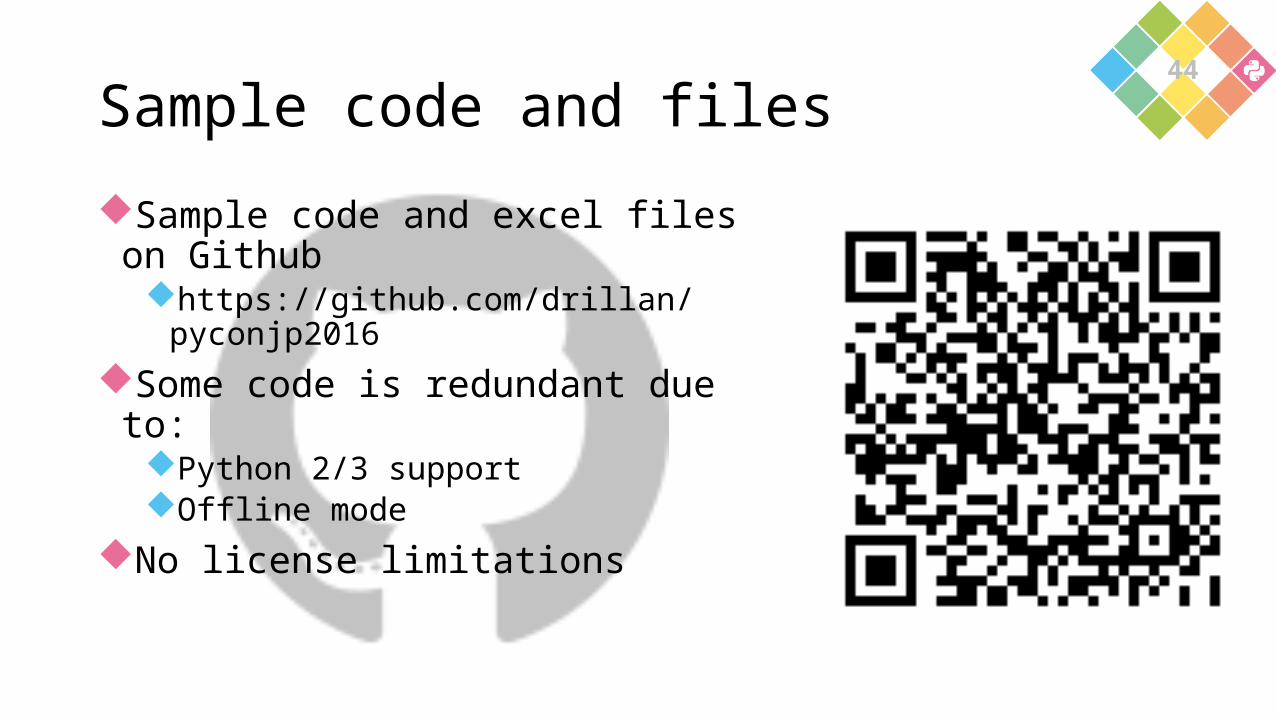
Sample code and files
Sample code and excel files on Githubhttps://github.com/drillan/pyconjp2016
Some code is redundant due to:Python 2/3 supportOffline mode
No license limitations
44

Thank youSee you next year?
45