Embed Size (px)
Citation preview
11OCTOBER 2016
SCIENCE & TECHNOLOGY
OCTOBER 2016 For updated information, please visit www.ibef.org
22OCTOBER 2016 For updated information, please visit www.ibef.org
Executive Summary……………..…………..3
Advantage India………………………..…….4
Market Overview and Trends………..……...6
Porter Five Forces Analysis..……………...12
Growth Drivers………………………………14
Opportunities……………………….……….25
Success Stories…………………….………31
Useful Information………………….………34
SCIENCE & TECHNOLOGY
OCTOBER 2016
33OCTOBER 2016
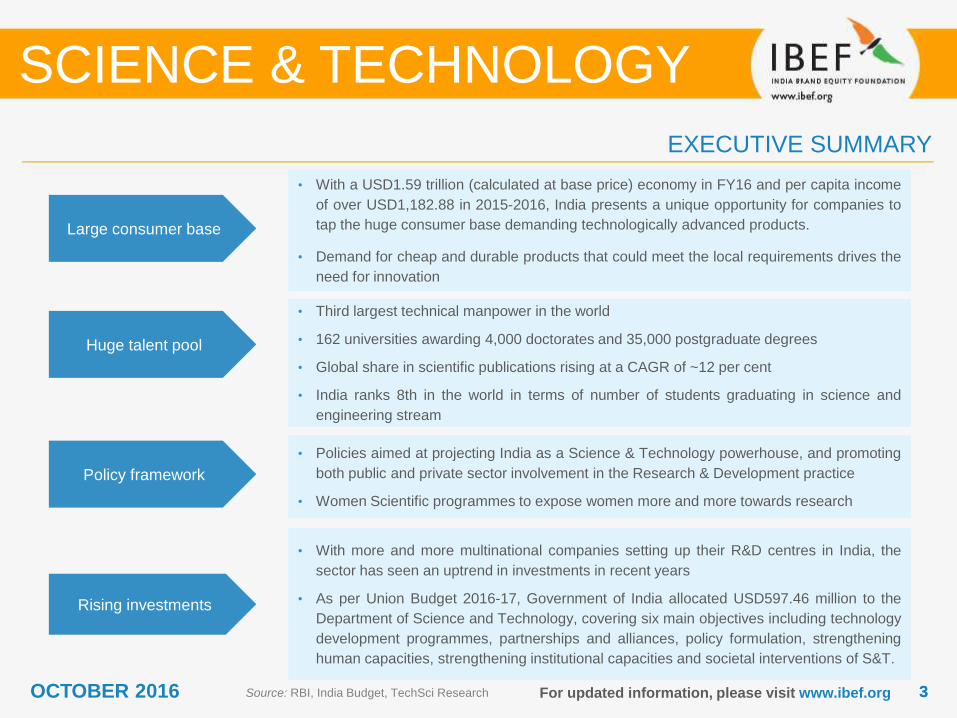
• Third largest technical manpower in the world
• 162 universities awarding 4,000 doctorates and 35,000 postgraduate degrees
• Global share in scientific publications rising at a CAGR of ~12 per cent
• India ranks 8th in the world in terms of number of students graduating in science and
engineering stream
• Policies aimed at projecting India as a Science & Technology powerhouse, and promoting
both public and private sector involvement in the Research & Development practice
• Women Scientific programmes to expose women more and more towards research
• With more and more multinational companies setting up their R&D centres in India, the
sector has seen an uptrend in investments in recent years
• As per Union Budget 2016-17, Government of India allocated USD597.46 million to the
Department of Science and Technology, covering six main objectives including technology
development programmes, partnerships and alliances, policy formulation, strengthening
human capacities, strengthening institutional capacities and societal interventions of S&T.
• With a USD1.59 trillion (calculated at base price) economy in FY16 and per capita income
of over USD1,182.88 in 2015-2016, India presents a unique opportunity for companies to
tap the huge consumer base demanding technologically advanced products.
• Demand for cheap and durable products that could meet the local requirements drives the
need for innovation
For updated information, please visit www.ibef.org
EXECUTIVE SUMMARY
Source: RBI, India Budget, TechSci Research
SCIENCE & TECHNOLOGY
Large consumer base
Huge talent pool
Policy framework
Rising investments

ADVANTAGE INDIA
SCIENCE & TECHNOLOGY
55OCTOBER 2016 For updated information, please visit www.ibef.org
ADVANTAGE INDIA
Source: Department of Science & Technology, IBEF, FICCI, TechSci Research
SCIENCE & TECHNOLOGY
Advantage
India
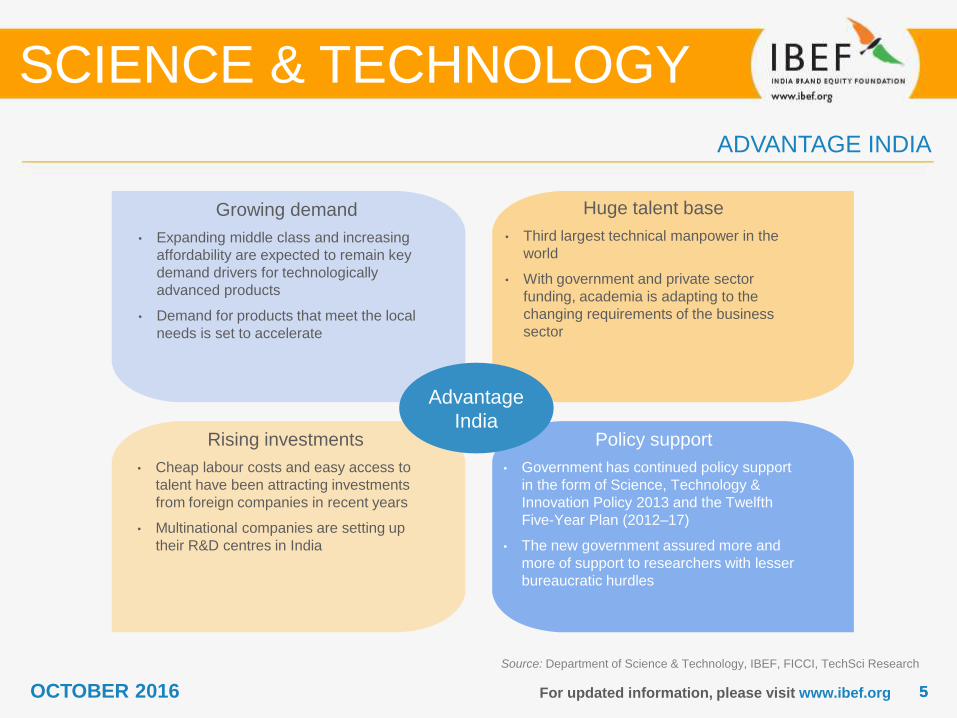
Growing demand
• Expanding middle class and increasing
affordability are expected to remain key
demand drivers for technologically
advanced products
• Demand for products that meet the local
needs is set to accelerate
Rising investments
• Cheap labour costs and easy access to
talent have been attracting investments
from foreign companies in recent years
• Multinational companies are setting up
their R&D centres in India
Policy support
• Government has continued policy support
in the form of Science, Technology &
Innovation Policy 2013 and the Twelfth
Five-Year Plan (2012–17)
• The new government assured more and
more of support to researchers with lesser
bureaucratic hurdles
Huge talent base
• Third largest technical manpower in the
world
• With government and private sector
funding, academia is adapting to the
changing requirements of the business
sector

MARKET OVERVIEW & TRENDS
SCIENCE & TECHNOLOGY
77OCTOBER 2016
2003
For updated information, please visit www.ibef.org
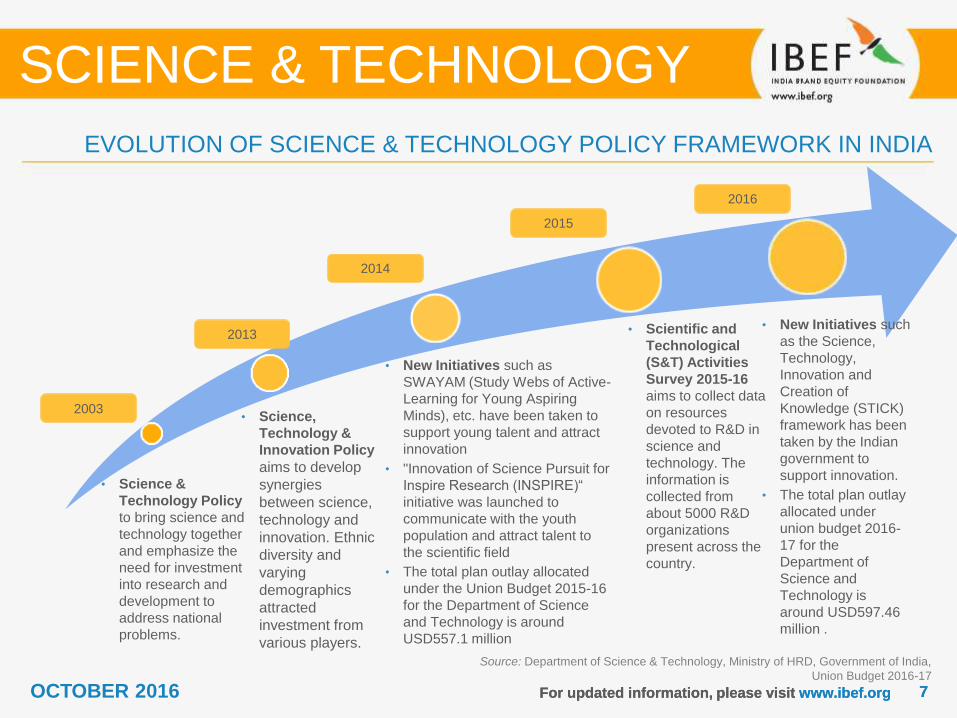
EVOLUTION OF SCIENCE & TECHNOLOGY POLICY FRAMEWORK IN INDIA
SCIENCE & TECHNOLOGY
For updated information, please visit www.ibef.org
Source: Department of Science & Technology, Ministry of HRD, Government of India,
Union Budget 2016-17
• New Initiatives such as
SWAYAM (Study Webs of Active-
Learning for Young Aspiring
Minds), etc. have been taken to
support young talent and attract
innovation
• "Innovation of Science Pursuit for
Inspire Research (INSPIRE)“
initiative was launched to
communicate with the youth
population and attract talent to
the scientific field
• The total plan outlay allocated
under the Union Budget 2015-16
for the Department of Science
and Technology is around
USD557.1 million
2013
2014
2015
2016
• Science &
Technology Policy
to bring science and
technology together
and emphasize the
need for investment
into research and
development to
address national
problems.
• Science,
Technology &
Innovation Policy
aims to develop
synergies
between science,
technology and
innovation. Ethnic
diversity and
varying
demographics
attracted
investment from
various players.
• Scientific and
Technological
(S&T) Activities
Survey 2015-16
aims to collect data
on resources
devoted to R&D in
science and
technology. The
information is
collected from
about 5000 R&D
organizations
present across the
country.
• New Initiatives such
as the Science,
Technology,
Innovation and
Creation of
Knowledge (STICK)
framework has been
taken by the Indian
government to
support innovation.
• The total plan outlay
allocated under
union budget 2016-
17 for the
Department of
Science and
Technology is
around USD597.46
million .
88OCTOBER 2016 For updated information, please visit www.ibef.org
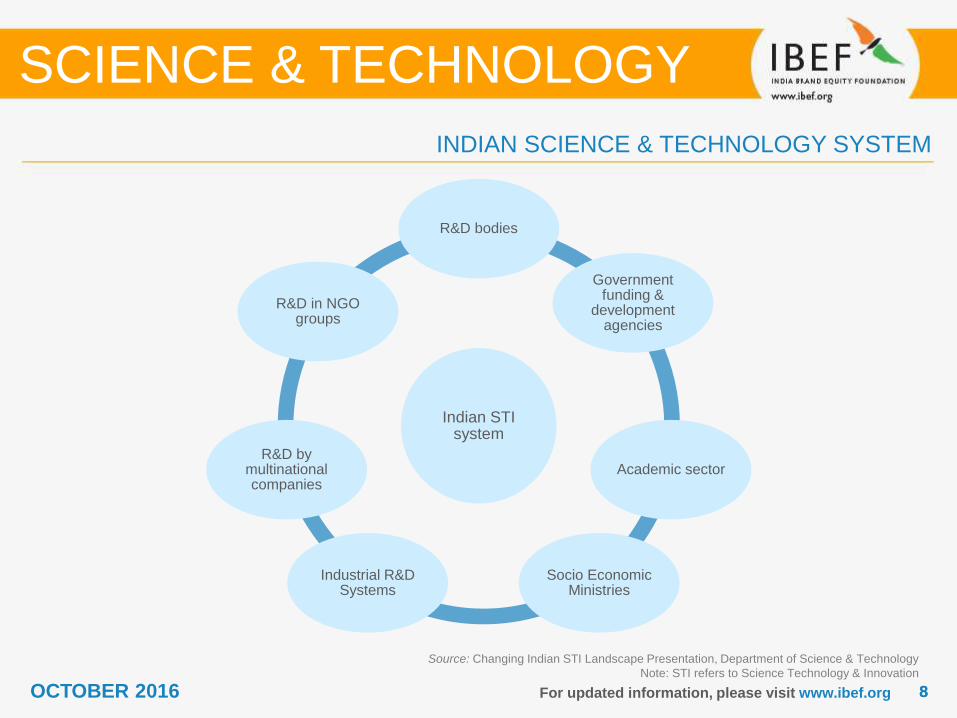
INDIAN SCIENCE & TECHNOLOGY SYSTEM
Source: Changing Indian STI Landscape Presentation, Department of Science & Technology
Note: STI refers to Science Technology & Innovation
SCIENCE & TECHNOLOGY
Indian STI system
R&D bodies
Government funding &
development agencies
Academic sector
Socio Economic Ministries
Industrial R&D Systems
R&D by multinational companies
R&D in NGO groups
99OCTOBER 2016 For updated information, please visit www.ibef.org
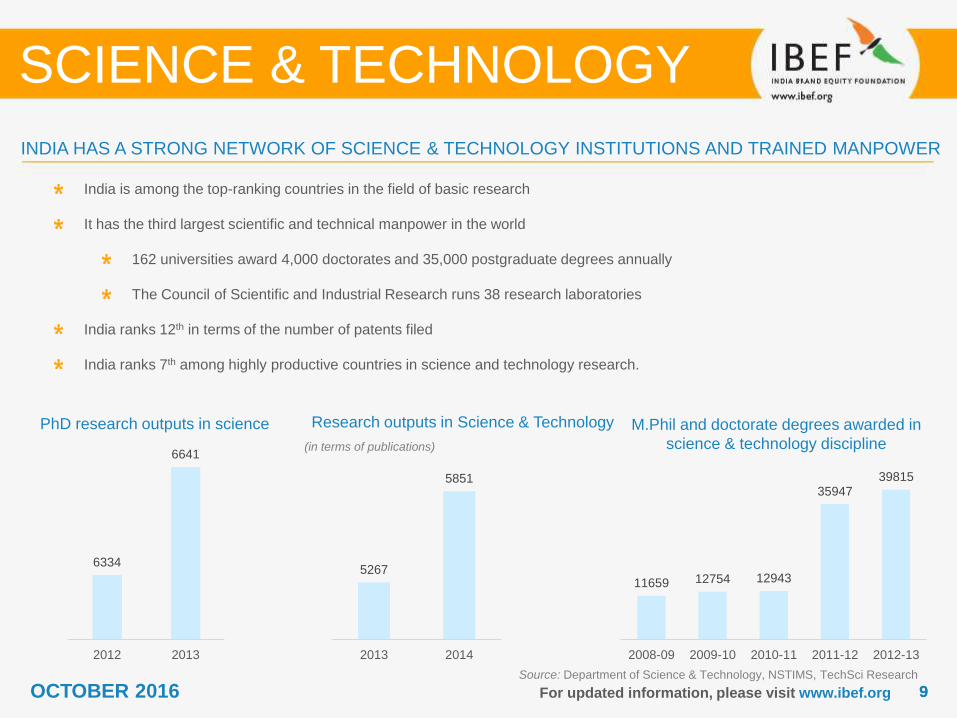
INDIA HAS A STRONG NETWORK OF SCIENCE & TECHNOLOGY INSTITUTIONS AND TRAINED MANPOWER
Source: Department of Science & Technology, NSTIMS, TechSci Research
India is among the top-ranking countries in the field of basic research
It has the third largest scientific and technical manpower in the world
162 universities award 4,000 doctorates and 35,000 postgraduate degrees annually
The Council of Scientific and Industrial Research runs 38 research laboratories
India ranks 12th in terms of the number of patents filed
India ranks 7th among highly productive countries in science and technology research.
SCIENCE & TECHNOLOGY
PhD research outputs in science M.Phil and doctorate degrees awarded in
science & technology discipline
6334
6641
2012 2013
Research outputs in Science & Technology
5267
5851
2013 2014
(in terms of publications)
11659 12754 12943
3594739815
2008-09 2009-10 2010-11 2011-12 2012-13
1010OCTOBER 2016
Source: Department of Science & Technology, NSTIMS, Business Standard, TechSci Research
Note: (1) Estimated Data; (2) - Data is as per latest data available
For updated information, please visit www.ibef.org
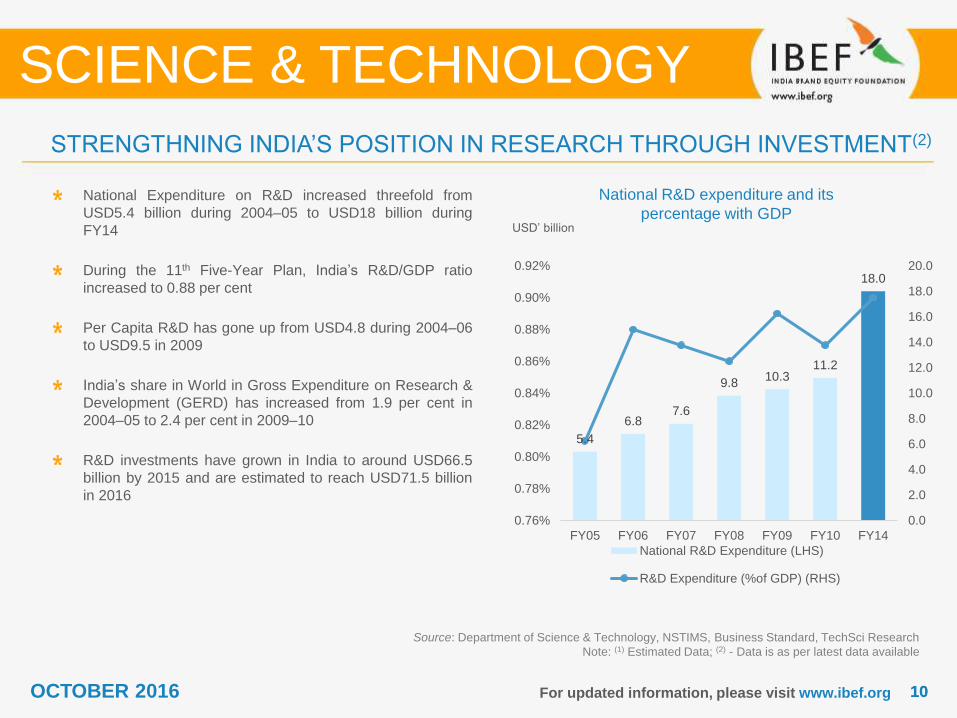
STRENGTHNING INDIA’S POSITION IN RESEARCH THROUGH INVESTMENT(2)
National Expenditure on R&D increased threefold from
USD5.4 billion during 2004–05 to USD18 billion during
FY14
During the 11th Five-Year Plan, India’s R&D/GDP ratio
increased to 0.88 per cent
Per Capita R&D has gone up from USD4.8 during 2004–06
to USD9.5 in 2009
India’s share in World in Gross Expenditure on Research &
Development (GERD) has increased from 1.9 per cent in
2004–05 to 2.4 per cent in 2009–10
R&D investments have grown in India to around USD66.5
billion by 2015 and are estimated to reach USD71.5 billion
in 2016
SCIENCE & TECHNOLOGY
USD’ billion
National R&D expenditure and its
percentage with GDP
5.4
6.87.6
9.810.3
11.2
18.0
0.0
2.0
4.0
6.0
8.0
10.0
12.0
14.0
16.0
18.0
20.0
FY05 FY06 FY07 FY08 FY09 FY10 FY14
0.76%
0.78%
0.80%
0.82%
0.84%
0.86%
0.88%
0.90%
0.92%
National R&D Expenditure (LHS)
R&D Expenditure (%of GDP) (RHS)
1111OCTOBER 2016
NUMBER OF PATENT APPLICATIONS GOING UP
Source: Office of Controller General of Patents, Design, Trade Marks and Geographical Indication, Intellectual Property India, TechSci Research
Note: Figures mentioned are as per latest data available
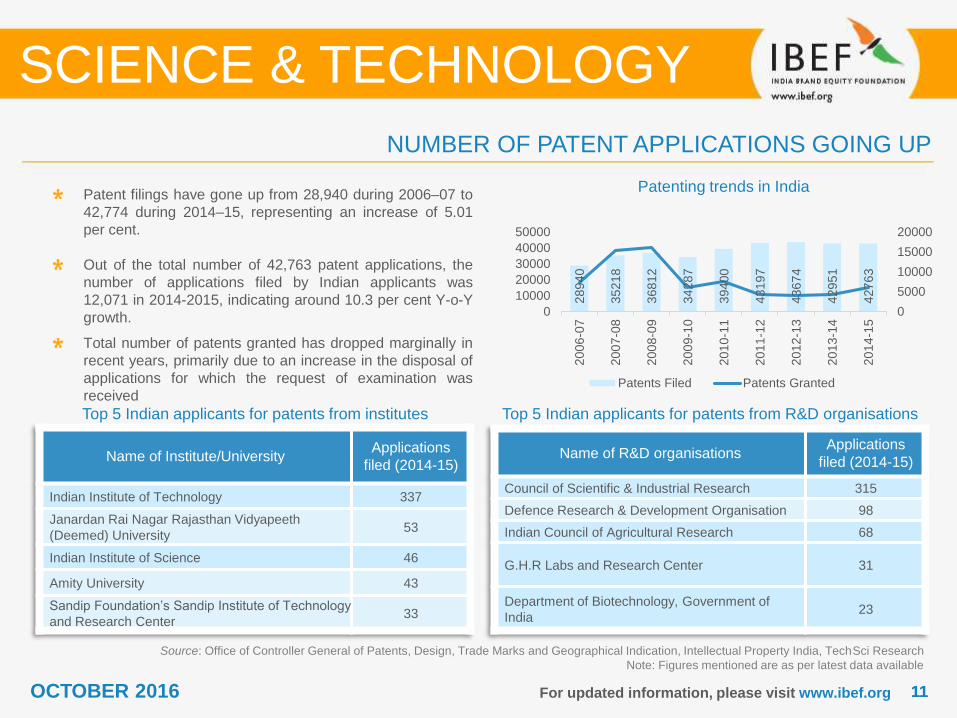
Patent filings have gone up from 28,940 during 2006–07 to
42,774 during 2014–15, representing an increase of 5.01
per cent.
Out of the total number of 42,763 patent applications, the
number of applications filed by Indian applicants was
12,071 in 2014-2015, indicating around 10.3 per cent Y-o-Y
growth.
Total number of patents granted has dropped marginally in
recent years, primarily due to an increase in the disposal of
applications for which the request of examination was
received
SCIENCE & TECHNOLOGY
Top 5 Indian applicants for patents from institutes Top 5 Indian applicants for patents from R&D organisations
Patenting trends in India
Name of R&D organisationsApplications
filed (2014-15)
Council of Scientific & Industrial Research 315
Defence Research & Development Organisation 98
Indian Council of Agricultural Research 68
G.H.R Labs and Research Center 31
Department of Biotechnology, Government of
India23
Name of Institute/UniversityApplications
filed (2014-15)
Indian Institute of Technology 337
Janardan Rai Nagar Rajasthan Vidyapeeth
(Deemed) University53
Indian Institute of Science 46
Amity University 43
Sandip Foundation’s Sandip Institute of Technology
and Research Center33
For updated information, please visit www.ibef.org
28
94
0
35
21
8
36
81
2
34
28
7
39
40
0
43
19
7
43
67
4
42951
42
76
3
0
5000
10000
15000
20000
2006
-07
2007
-08
2008
-09
20
09
-10
2010
-11
2011
-12
2012
-13
2013
-14
2014
-15
0
10000
20000
30000
40000
50000
Patents Filed Patents Granted

PORTER FIVE FORCES ANALYSIS
SCIENCE & TECHNOLOGY
1313OCTOBER 2016 For updated information, please visit www.ibef.org
PORTER FIVE FORCES ANALYSIS
SCIENCE & TECHNOLOGY
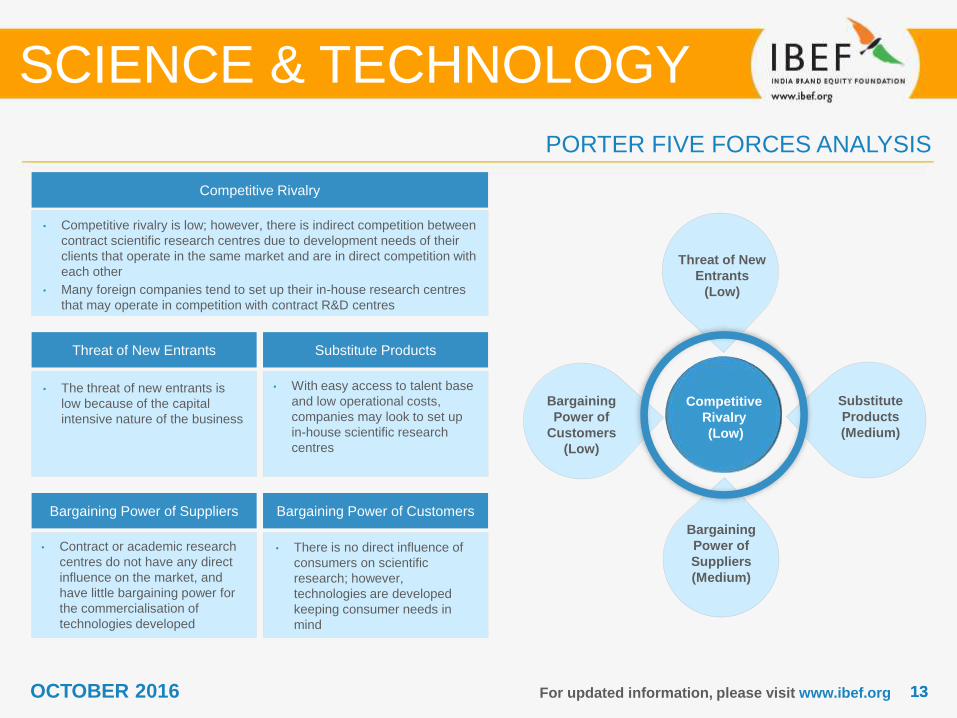
Competitive Rivalry
• Competitive rivalry is low; however, there is indirect competition between
contract scientific research centres due to development needs of their
clients that operate in the same market and are in direct competition with
each other
• Many foreign companies tend to set up their in-house research centres
that may operate in competition with contract R&D centres
Threat of New Entrants Substitute Products
Bargaining Power of Suppliers Bargaining Power of Customers
• The threat of new entrants is
low because of the capital
intensive nature of the business
• Contract or academic research
centres do not have any direct
influence on the market, and
have little bargaining power for
the commercialisation of
technologies developed
• There is no direct influence of
consumers on scientific
research; however,
technologies are developed
keeping consumer needs in
mind
• With easy access to talent base
and low operational costs,
companies may look to set up
in-house scientific research
centres
Competitive
Rivalry
(Low)
Threat of New
Entrants
(Low)
Substitute
Products
(Medium)
Bargaining
Power of
Customers
(Low)
Bargaining
Power of
Suppliers
(Medium)

GROWTH DRIVERS
SCIENCE & TECHNOLOGY
1515OCTOBER 2016
STRONG POLICY FRAMEWORK TO PROMOTE INDIA AS A R&D HUB
SCIENCE & TECHNOLOGY
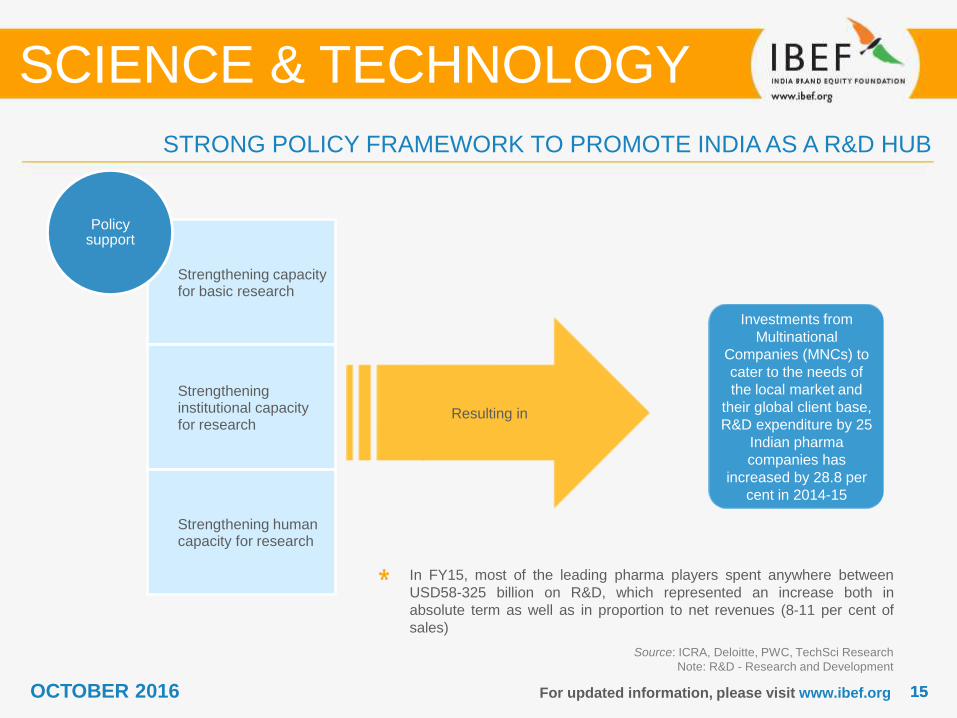
Resulting in
Investments from
Multinational
Companies (MNCs) to
cater to the needs of
the local market and
their global client base,
R&D expenditure by 25
Indian pharma
companies has
increased by 28.8 per
cent in 2014-15
Strengthening capacity for basic research
Strengthening institutional capacity for research
Strengthening human capacity for research
Policy support
For updated information, please visit www.ibef.org
In FY15, most of the leading pharma players spent anywhere between
USD58-325 billion on R&D, which represented an increase both in
absolute term as well as in proportion to net revenues (8-11 per cent of
sales)
Source: ICRA, Deloitte, PWC, TechSci Research
Note: R&D - Research and Development
1616OCTOBER 2016 For updated information, please visit www.ibef.org
STRENGTHENING HUMAN CAPACITIES FOR GROWTH
SCIENCE & TECHNOLOGY
Source: NSTMIS, Department of Science & Technology
Note: Pursuit for Inspired Research (INSPIRE)
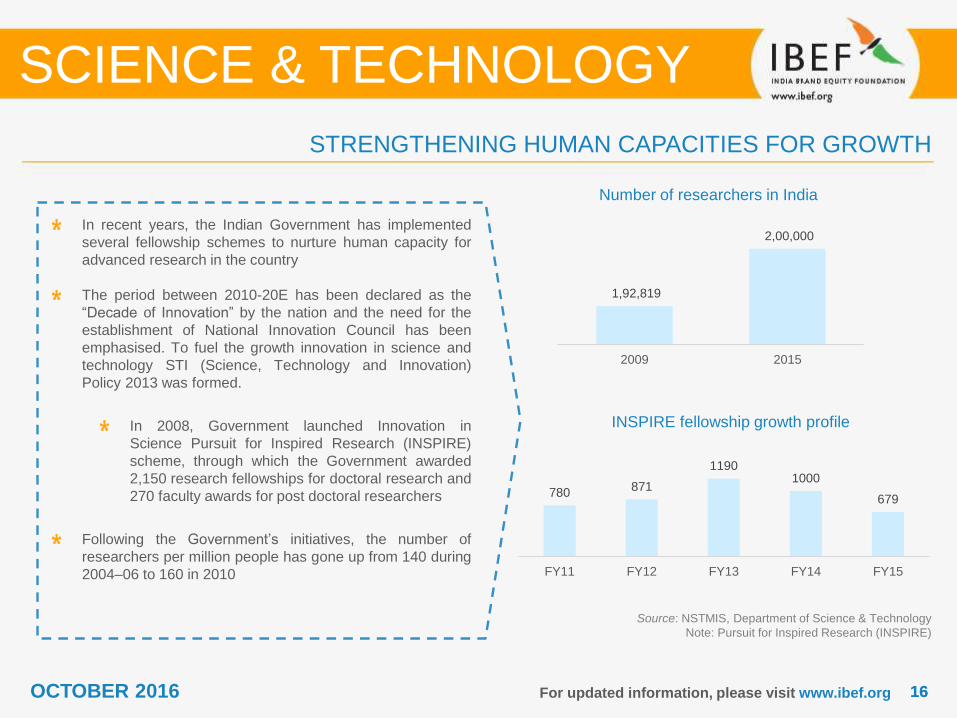
In recent years, the Indian Government has implemented
several fellowship schemes to nurture human capacity for
advanced research in the country
The period between 2010-20E has been declared as the
“Decade of Innovation” by the nation and the need for the
establishment of National Innovation Council has been
emphasised. To fuel the growth innovation in science and
technology STI (Science, Technology and Innovation)
Policy 2013 was formed.
In 2008, Government launched Innovation in
Science Pursuit for Inspired Research (INSPIRE)
scheme, through which the Government awarded
2,150 research fellowships for doctoral research and
270 faculty awards for post doctoral researchers
Following the Government’s initiatives, the number of
researchers per million people has gone up from 140 during
2004–06 to 160 in 2010
Number of researchers in India
1,92,819
2,00,000
2009 2015
INSPIRE fellowship growth profile
780871
11901000
679
FY11 FY12 FY13 FY14 FY15
1717OCTOBER 2016 For updated information, please visit www.ibef.org
LOCAL DEMAND ATTRACTING INVESTMENTS FROM MNCs … (1/2)
SCIENCE & TECHNOLOGY
Source: IMF, World Bank, India Budget, Government of India Press
Information Bureau Government of India, Ministry of Statistics and
Programme Implementation
Note: E- Estimates, F - Forecast
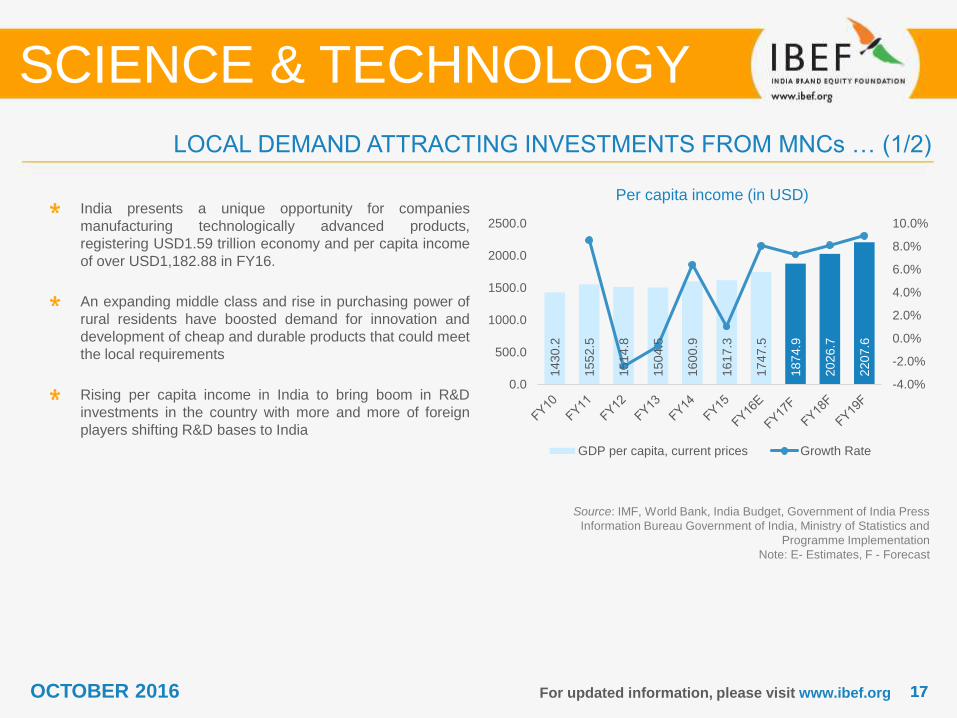
India presents a unique opportunity for companies
manufacturing technologically advanced products,
registering USD1.59 trillion economy and per capita income
of over USD1,182.88 in FY16.
An expanding middle class and rise in purchasing power of
rural residents have boosted demand for innovation and
development of cheap and durable products that could meet
the local requirements
Rising per capita income in India to bring boom in R&D
investments in the country with more and more of foreign
players shifting R&D bases to India
Per capita income (in USD)
14
30
.2
15
52
.5
15
14
.8
15
04
.5
16
00
.9
16
17
.3
17
47
.5
1874.9
20
26
.7
22
07
.6
-4.0%
-2.0%
0.0%
2.0%
4.0%
6.0%
8.0%
10.0%
0.0
500.0
1000.0
1500.0
2000.0
2500.0
GDP per capita, current prices Growth Rate
1818OCTOBER 2016 For updated information, please visit www.ibef.org
LOCAL DEMAND ATTRACTING INVESTMENTS FROM MNCs … (2/2)
SCIENCE & TECHNOLOGY
Source: FICCI, Department of Science & Technology, Zinnov, TechSci Research
Note: Figures mentioned are as per latest data available
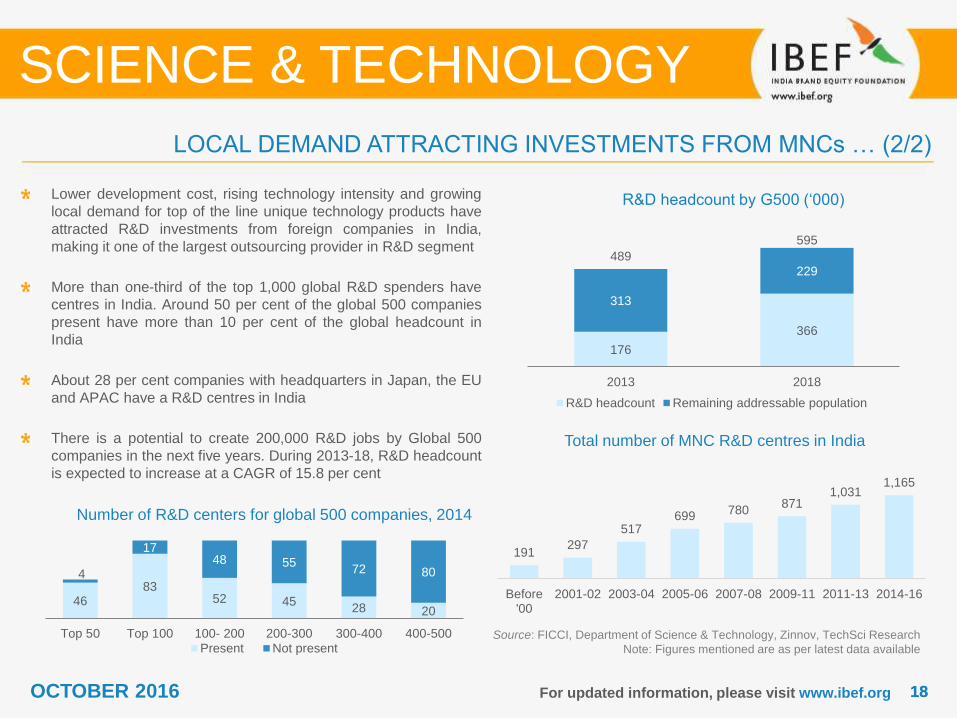
Lower development cost, rising technology intensity and growing
local demand for top of the line unique technology products have
attracted R&D investments from foreign companies in India,
making it one of the largest outsourcing provider in R&D segment
More than one-third of the top 1,000 global R&D spenders have
centres in India. Around 50 per cent of the global 500 companies
present have more than 10 per cent of the global headcount in
India
About 28 per cent companies with headquarters in Japan, the EU
and APAC have a R&D centres in India
There is a potential to create 200,000 R&D jobs by Global 500
companies in the next five years. During 2013-18, R&D headcount
is expected to increase at a CAGR of 15.8 per cent
Total number of MNC R&D centres in India
4683
52 4528 20
4
1748 55
72 80
Top 50 Top 100 100- 200 200-300 300-400 400-500Present Not present
Number of R&D centers for global 500 companies, 2014
176
366
313
229
489
595
2013 2018
R&D headcount Remaining addressable population
R&D headcount by G500 (‘000)
191297
517699 780
8711,031
1,165
Before'00
2001-02 2003-04 2005-06 2007-08 2009-11 2011-13 2014-16
1919OCTOBER 2016
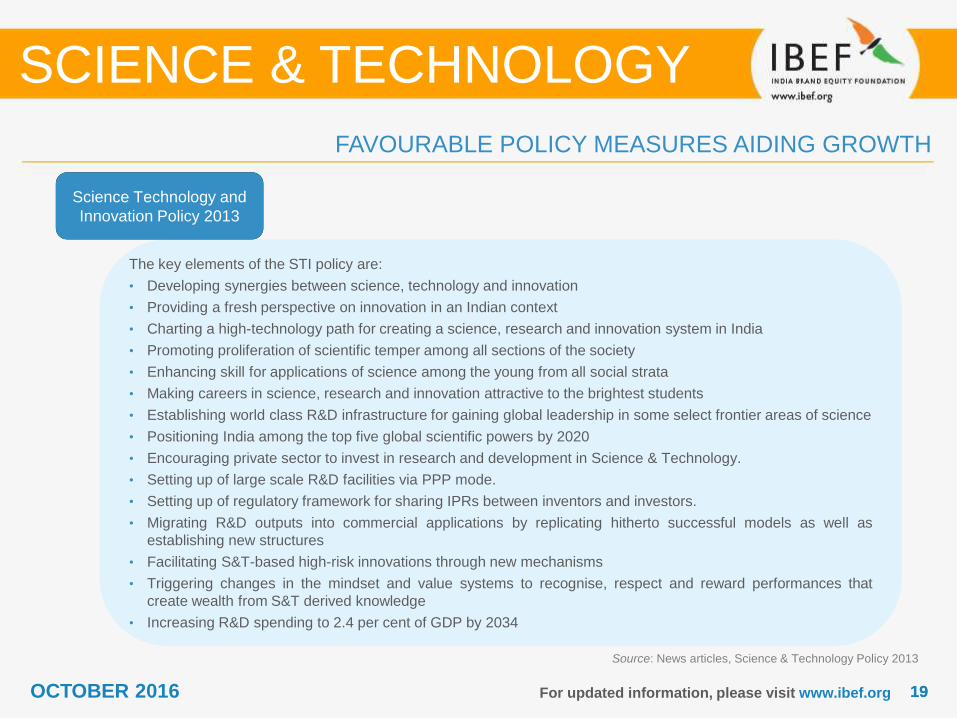
The key elements of the STI policy are:
• Developing synergies between science, technology and innovation
• Providing a fresh perspective on innovation in an Indian context
• Charting a high-technology path for creating a science, research and innovation system in India
• Promoting proliferation of scientific temper among all sections of the society
• Enhancing skill for applications of science among the young from all social strata
• Making careers in science, research and innovation attractive to the brightest students
• Establishing world class R&D infrastructure for gaining global leadership in some select frontier areas of science
• Positioning India among the top five global scientific powers by 2020
• Encouraging private sector to invest in research and development in Science & Technology.
• Setting up of large scale R&D facilities via PPP mode.
• Setting up of regulatory framework for sharing IPRs between inventors and investors.
• Migrating R&D outputs into commercial applications by replicating hitherto successful models as well as
establishing new structures
• Facilitating S&T-based high-risk innovations through new mechanisms
• Triggering changes in the mindset and value systems to recognise, respect and reward performances that
create wealth from S&T derived knowledge
• Increasing R&D spending to 2.4 per cent of GDP by 2034
For updated information, please visit www.ibef.org
FAVOURABLE POLICY MEASURES AIDING GROWTH
Science Technology and
Innovation Policy 2013
Source: News articles, Science & Technology Policy 2013
SCIENCE & TECHNOLOGY
2020OCTOBER 2016
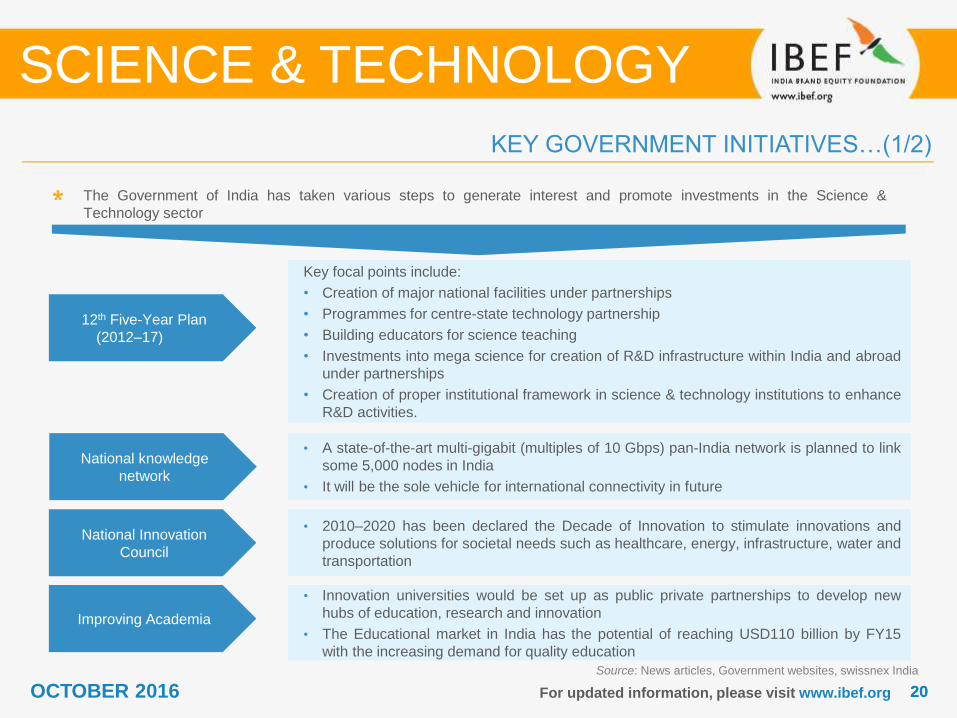
The Government of India has taken various steps to generate interest and promote investments in the Science &
Technology sector
For updated information, please visit www.ibef.org
KEY GOVERNMENT INITIATIVES…(1/2)
12th Five-Year Plan
(2012–17)
Key focal points include:
• Creation of major national facilities under partnerships
• Programmes for centre-state technology partnership
• Building educators for science teaching
• Investments into mega science for creation of R&D infrastructure within India and abroad
under partnerships
• Creation of proper institutional framework in science & technology institutions to enhance
R&D activities.
Source: News articles, Government websites, swissnex India
National knowledge
network
• A state-of-the-art multi-gigabit (multiples of 10 Gbps) pan-India network is planned to link
some 5,000 nodes in India
• It will be the sole vehicle for international connectivity in future
SCIENCE & TECHNOLOGY
National Innovation
Council
• 2010–2020 has been declared the Decade of Innovation to stimulate innovations and
produce solutions for societal needs such as healthcare, energy, infrastructure, water and
transportation
Improving Academia
• Innovation universities would be set up as public private partnerships to develop new
hubs of education, research and innovation
• The Educational market in India has the potential of reaching USD110 billion by FY15
with the increasing demand for quality education
2121OCTOBER 2016
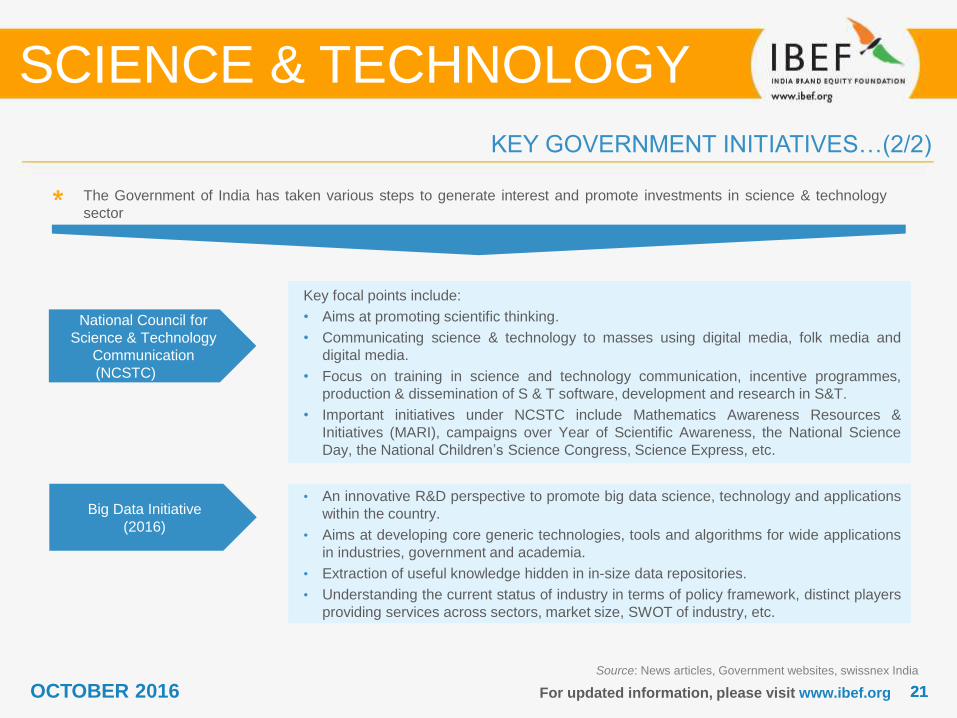
The Government of India has taken various steps to generate interest and promote investments in science & technology
sector
For updated information, please visit www.ibef.org
KEY GOVERNMENT INITIATIVES…(2/2)
National Council for
Science & Technology
Communication
(NCSTC)
Key focal points include:
• Aims at promoting scientific thinking.
• Communicating science & technology to masses using digital media, folk media and
digital media.
• Focus on training in science and technology communication, incentive programmes,
production & dissemination of S & T software, development and research in S&T.
• Important initiatives under NCSTC include Mathematics Awareness Resources &
Initiatives (MARI), campaigns over Year of Scientific Awareness, the National Science
Day, the National Children’s Science Congress, Science Express, etc.
Source: News articles, Government websites, swissnex India
Big Data Initiative
(2016)
• An innovative R&D perspective to promote big data science, technology and applications
within the country.
• Aims at developing core generic technologies, tools and algorithms for wide applications
in industries, government and academia.
• Extraction of useful knowledge hidden in in-size data repositories.
• Understanding the current status of industry in terms of policy framework, distinct players
providing services across sectors, market size, SWOT of industry, etc.
SCIENCE & TECHNOLOGY
2222OCTOBER 2016 For updated information, please visit www.ibef.org
INDIA AS CENTRE OF EXCELLENCE
SCIENCE & TECHNOLOGY
Source: swissnex India, NSTMIS
Note: (1)Centre of Excellence are identified using a threshold of minimum of 200
research papers in the top decile of global research (2014);
As per Latest Data available
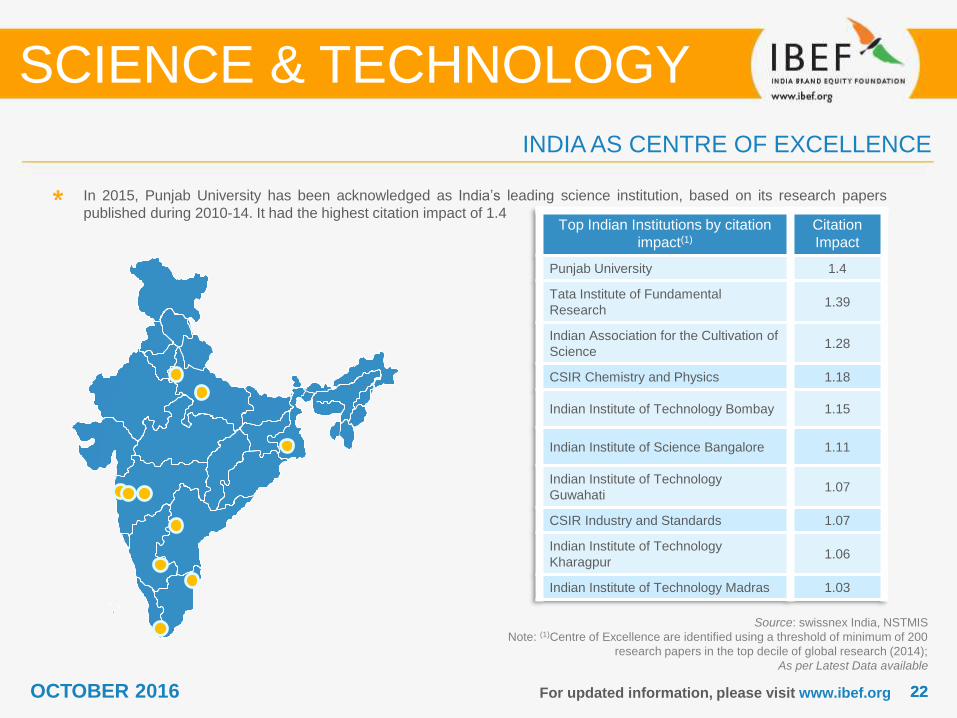
In 2015, Punjab University has been acknowledged as India’s leading science institution, based on its research papers
published during 2010-14. It had the highest citation impact of 1.4Top Indian Institutions by citation
impact(1)
Citation
Impact
Punjab University 1.4
Tata Institute of Fundamental
Research1.39
Indian Association for the Cultivation of
Science1.28
CSIR Chemistry and Physics 1.18
Indian Institute of Technology Bombay 1.15
Indian Institute of Science Bangalore 1.11
Indian Institute of Technology
Guwahati1.07
CSIR Industry and Standards 1.07
Indian Institute of Technology
Kharagpur1.06
Indian Institute of Technology Madras 1.03
2323OCTOBER 2016
ATTRACTING INVESTMENTS FROM PRIVATE SECTOR
SCIENCE & TECHNOLOGY
Source: Press Release, Department of Science & Technology, NSTMIS, TechSci Research
Notes: E denotes Estimated, (1) Data till 2010, (2) Data Till 2014, (3) Data Till 2016
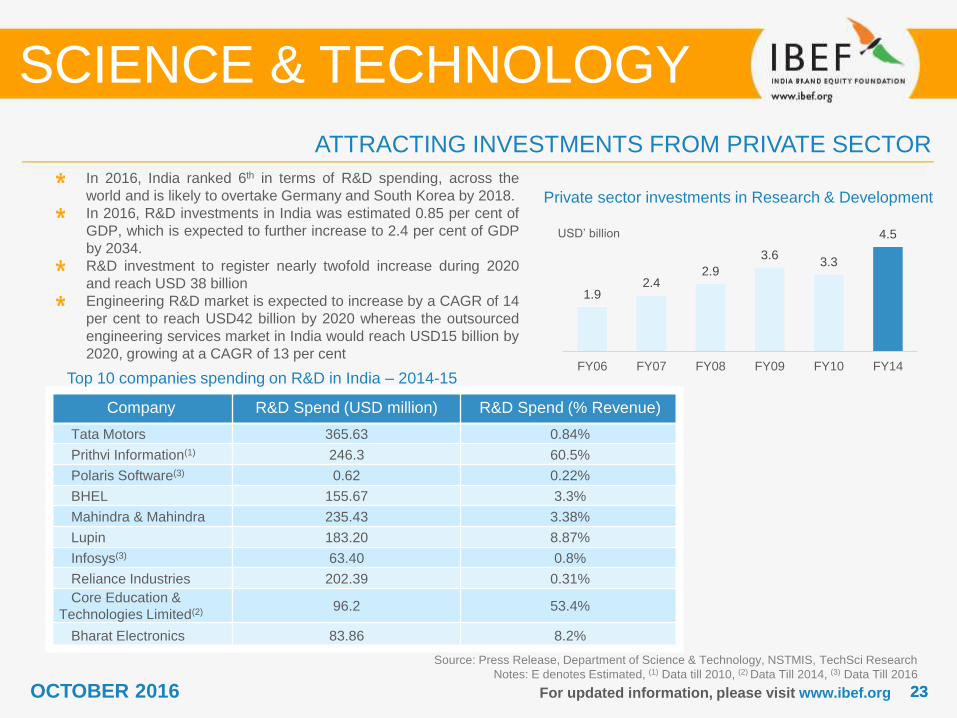
In 2016, India ranked 6th in terms of R&D spending, across the
world and is likely to overtake Germany and South Korea by 2018.
In 2016, R&D investments in India was estimated 0.85 per cent of
GDP, which is expected to further increase to 2.4 per cent of GDP
by 2034.
R&D investment to register nearly twofold increase during 2020
and reach USD 38 billion
Engineering R&D market is expected to increase by a CAGR of 14
per cent to reach USD42 billion by 2020 whereas the outsourced
engineering services market in India would reach USD15 billion by
2020, growing at a CAGR of 13 per cent
Company R&D Spend (USD million) R&D Spend (% Revenue)
Tata Motors 365.63 0.84%
Prithvi Information(1) 246.3 60.5%
Polaris Software(3) 0.62 0.22%
BHEL 155.67 3.3%
Mahindra & Mahindra 235.43 3.38%
Lupin 183.20 8.87%
Infosys(3) 63.40 0.8%
Reliance Industries 202.39 0.31%
Core Education &
Technologies Limited(2) 96.2 53.4%
Bharat Electronics 83.86 8.2%
Top 10 companies spending on R&D in India – 2014-15
USD’ billion
Private sector investments in Research & Development
For updated information, please visit www.ibef.org
1.92.4
2.9
3.63.3
4.5
FY06 FY07 FY08 FY09 FY10 FY14
2424OCTOBER 2016 For updated information, please visit www.ibef.org
ATTRACTING INVESTMENTS IN THE R&D SPACE
SCIENCE & TECHNOLOGY
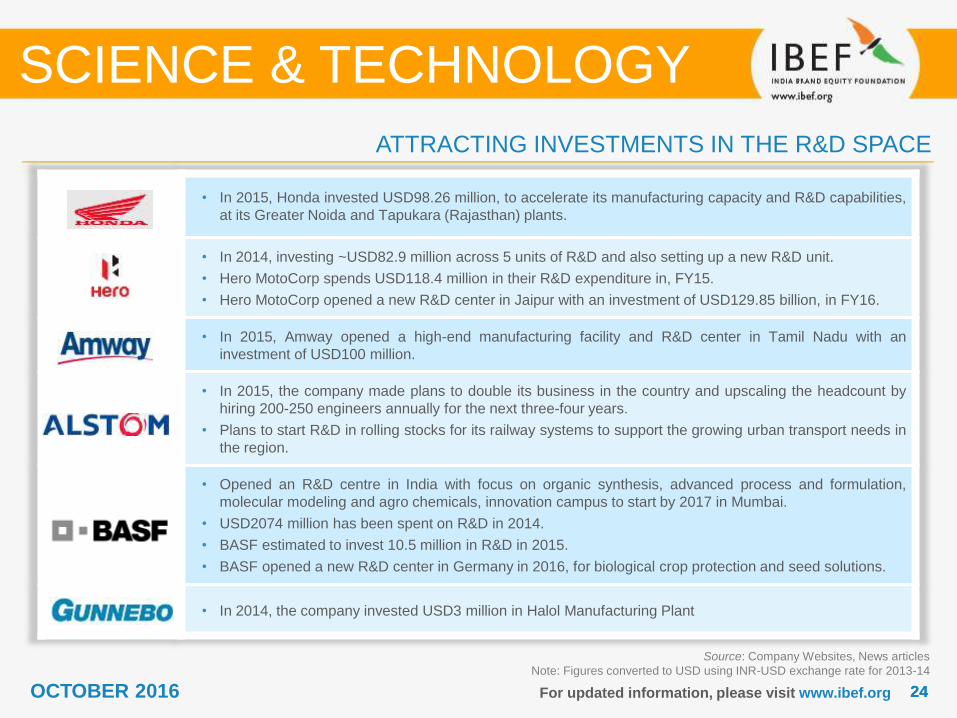
• In 2015, Honda invested USD98.26 million, to accelerate its manufacturing capacity and R&D capabilities,
at its Greater Noida and Tapukara (Rajasthan) plants.
• In 2014, investing ~USD82.9 million across 5 units of R&D and also setting up a new R&D unit.
• Hero MotoCorp spends USD118.4 million in their R&D expenditure in, FY15.
• Hero MotoCorp opened a new R&D center in Jaipur with an investment of USD129.85 billion, in FY16.
• In 2015, Amway opened a high-end manufacturing facility and R&D center in Tamil Nadu with an
investment of USD100 million.
• In 2015, the company made plans to double its business in the country and upscaling the headcount by
hiring 200-250 engineers annually for the next three-four years.
• Plans to start R&D in rolling stocks for its railway systems to support the growing urban transport needs in
the region.
• Opened an R&D centre in India with focus on organic synthesis, advanced process and formulation,
molecular modeling and agro chemicals, innovation campus to start by 2017 in Mumbai.
• USD2074 million has been spent on R&D in 2014.
• BASF estimated to invest 10.5 million in R&D in 2015.
• BASF opened a new R&D center in Germany in 2016, for biological crop protection and seed solutions.
• In 2014, the company invested USD3 million in Halol Manufacturing Plant
Source: Company Websites, News articles
Note: Figures converted to USD using INR-USD exchange rate for 2013-14

OPPORTUNITIES
SCIENCE & TECHNOLOGY
2626OCTOBER 2016
R&D OPPORTUNITIES IN VARIOUS SUB SECTORS IN INDIA
SCIENCE & TECHNOLOGY
ICT and wireless
technology
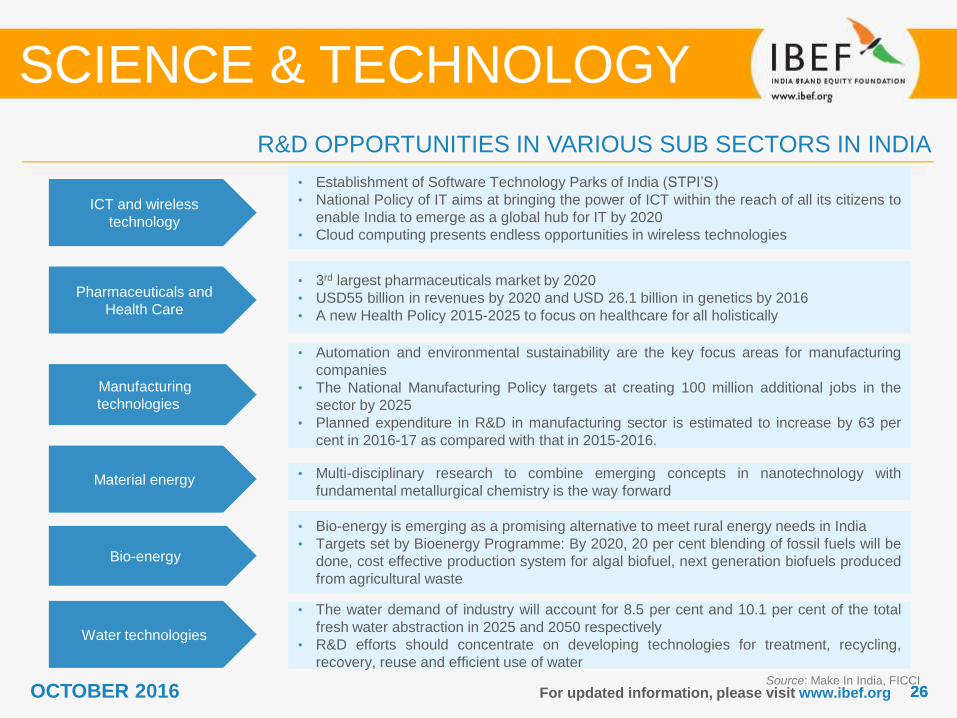
• Establishment of Software Technology Parks of India (STPI’S)
• National Policy of IT aims at bringing the power of ICT within the reach of all its citizens to
enable India to emerge as a global hub for IT by 2020
• Cloud computing presents endless opportunities in wireless technologies
Pharmaceuticals and
Health Care
• 3rd largest pharmaceuticals market by 2020
• USD55 billion in revenues by 2020 and USD 26.1 billion in genetics by 2016
• A new Health Policy 2015-2025 to focus on healthcare for all holistically
Water technologies
• The water demand of industry will account for 8.5 per cent and 10.1 per cent of the total
fresh water abstraction in 2025 and 2050 respectively
• R&D efforts should concentrate on developing technologies for treatment, recycling,
recovery, reuse and efficient use of water
Manufacturing
technologies
• Automation and environmental sustainability are the key focus areas for manufacturing
companies
• The National Manufacturing Policy targets at creating 100 million additional jobs in the
sector by 2025
• Planned expenditure in R&D in manufacturing sector is estimated to increase by 63 per
cent in 2016-17 as compared with that in 2015-2016.
Material energy • Multi-disciplinary research to combine emerging concepts in nanotechnology with
fundamental metallurgical chemistry is the way forward
Bio-energy
• Bio-energy is emerging as a promising alternative to meet rural energy needs in India
• Targets set by Bioenergy Programme: By 2020, 20 per cent blending of fossil fuels will be
done, cost effective production system for algal biofuel, next generation biofuels produced
from agricultural waste
Source: Make In India, FICCIFor updated information, please visit www.ibef.org
2727OCTOBER 2016 For updated information, please visit www.ibef.org
ICT EVOLVING IN INDIA AT AN UNPRECEDENTED RATE
SCIENCE & TECHNOLOGY
Source: News Releases, FICCI
Notes: ICT denotes Information & Communication Technology,
E denotes Estimated, F denoted Forecasted
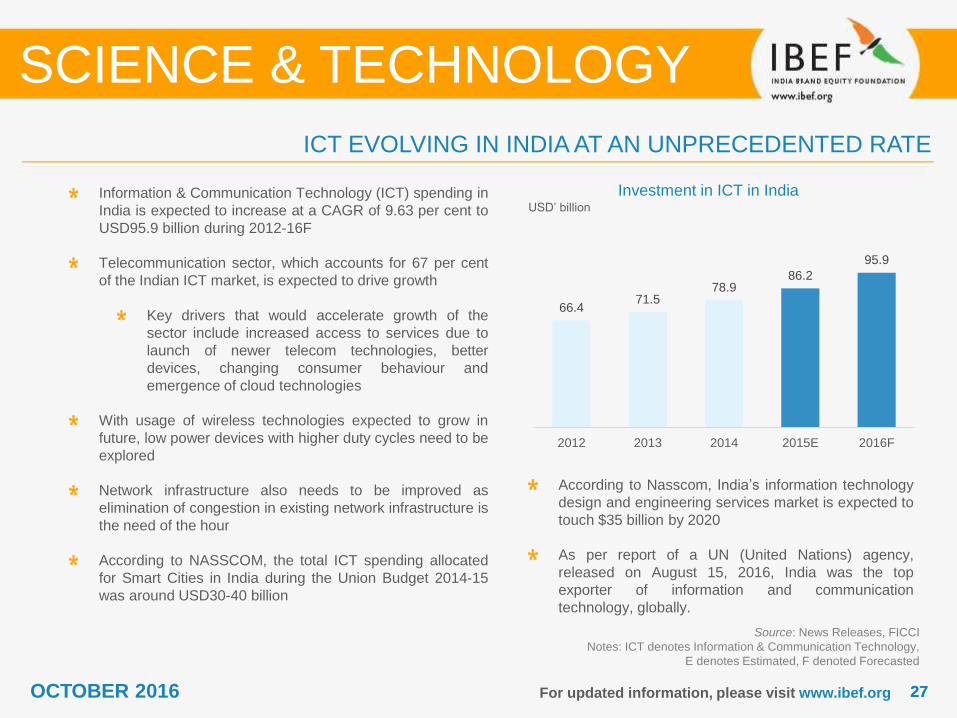
According to Nasscom, India’s information technology
design and engineering services market is expected to
touch $35 billion by 2020
As per report of a UN (United Nations) agency,
released on August 15, 2016, India was the top
exporter of information and communication
technology, globally.
USD’ billion
Investment in ICT in India
66.471.5
78.986.2
95.9
2012 2013 2014 2015E 2016F
Information & Communication Technology (ICT) spending in
India is expected to increase at a CAGR of 9.63 per cent to
USD95.9 billion during 2012-16F
Telecommunication sector, which accounts for 67 per cent
of the Indian ICT market, is expected to drive growth
Key drivers that would accelerate growth of the
sector include increased access to services due to
launch of newer telecom technologies, better
devices, changing consumer behaviour and
emergence of cloud technologies
With usage of wireless technologies expected to grow in
future, low power devices with higher duty cycles need to be
explored
Network infrastructure also needs to be improved as
elimination of congestion in existing network infrastructure is
the need of the hour
According to NASSCOM, the total ICT spending allocated
for Smart Cities in India during the Union Budget 2014-15
was around USD30-40 billion
2828OCTOBER 2016 For updated information, please visit www.ibef.org
RISING R&D ACTIVITIES IN THE INDIAN PHARMACEUTICAL SECTOR
SCIENCE & TECHNOLOGY
Source: Make in India, FICCI, Ministry of Chemicals & Fertilizers- Department
of Pharmaceuticals, TechSci Research
Note: F denotes Forecasted, (1): For FY15(2): up to Dec 2015, (3): up to March 2016
R&D - Research and Development
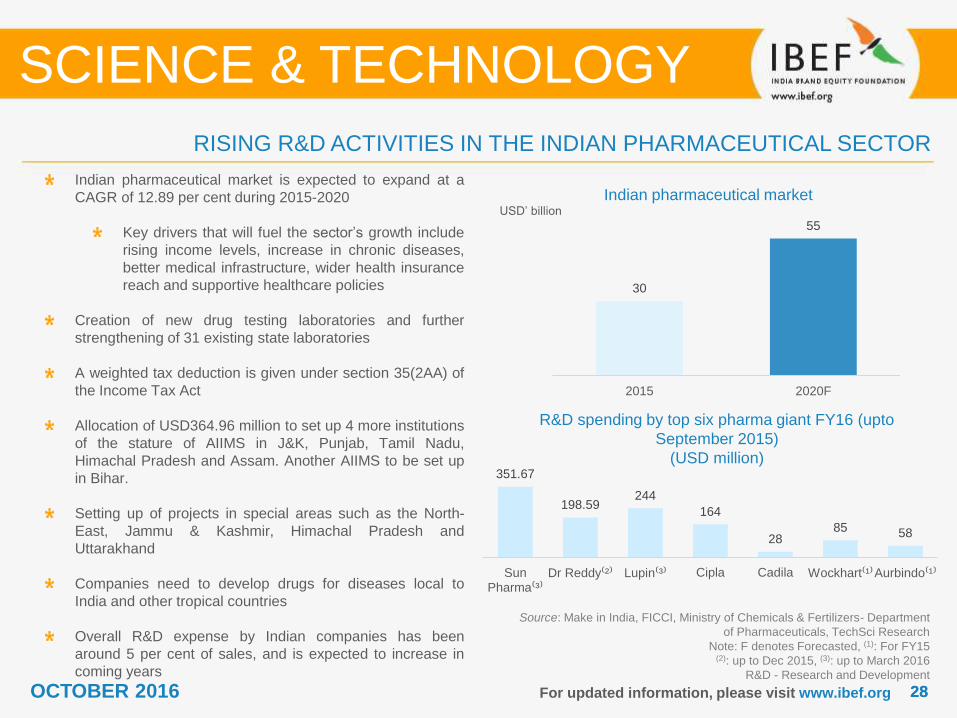
Indian pharmaceutical market is expected to expand at a
CAGR of 12.89 per cent during 2015-2020
Key drivers that will fuel the sector’s growth include
rising income levels, increase in chronic diseases,
better medical infrastructure, wider health insurance
reach and supportive healthcare policies
Creation of new drug testing laboratories and further
strengthening of 31 existing state laboratories
A weighted tax deduction is given under section 35(2AA) of
the Income Tax Act
Allocation of USD364.96 million to set up 4 more institutions
of the stature of AIIMS in J&K, Punjab, Tamil Nadu,
Himachal Pradesh and Assam. Another AIIMS to be set up
in Bihar.
Setting up of projects in special areas such as the North-
East, Jammu & Kashmir, Himachal Pradesh and
Uttarakhand
Companies need to develop drugs for diseases local to
India and other tropical countries
Overall R&D expense by Indian companies has been
around 5 per cent of sales, and is expected to increase in
coming years
Indian pharmaceutical marketUSD’ billion
30
55
2015 2020F
R&D spending by top six pharma giant FY16 (upto
September 2015)
(USD million)351.67
198.59244
164
2885 58
Sun Pharma⁽³⁾
Dr Reddy⁽²⁾ Lupin⁽³⁾ Cipla Cadila Wockhart⁽¹⁾Aurbindo⁽¹⁾
2929OCTOBER 2016 For updated information, please visit www.ibef.org
THE WAY FORWARD … (1/2)
SCIENCE & TECHNOLOGY
Source: Science, Technology & Innovation Policy
2013; Department of Science and Technology
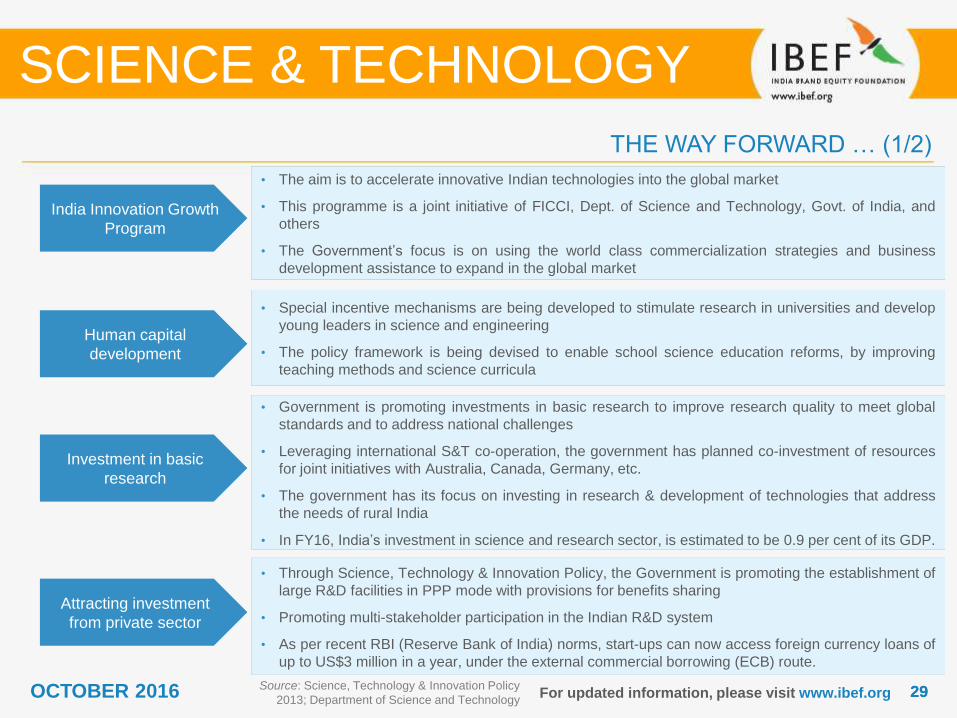
• The aim is to accelerate innovative Indian technologies into the global market
• This programme is a joint initiative of FICCI, Dept. of Science and Technology, Govt. of India, and
others
• The Government’s focus is on using the world class commercialization strategies and business
development assistance to expand in the global market
• Special incentive mechanisms are being developed to stimulate research in universities and develop
young leaders in science and engineering
• The policy framework is being devised to enable school science education reforms, by improving
teaching methods and science curricula
• Through Science, Technology & Innovation Policy, the Government is promoting the establishment of
large R&D facilities in PPP mode with provisions for benefits sharing
• Promoting multi-stakeholder participation in the Indian R&D system
• As per recent RBI (Reserve Bank of India) norms, start-ups can now access foreign currency loans of
up to US$3 million in a year, under the external commercial borrowing (ECB) route.
India Innovation Growth
Program
Human capital
development
Investment in basic
research
Attracting investment
from private sector
• Government is promoting investments in basic research to improve research quality to meet global
standards and to address national challenges
• Leveraging international S&T co-operation, the government has planned co-investment of resources
for joint initiatives with Australia, Canada, Germany, etc.
• The government has its focus on investing in research & development of technologies that address
the needs of rural India
• In FY16, India’s investment in science and research sector, is estimated to be 0.9 per cent of its GDP.
3030OCTOBER 2016 For updated information, please visit www.ibef.org
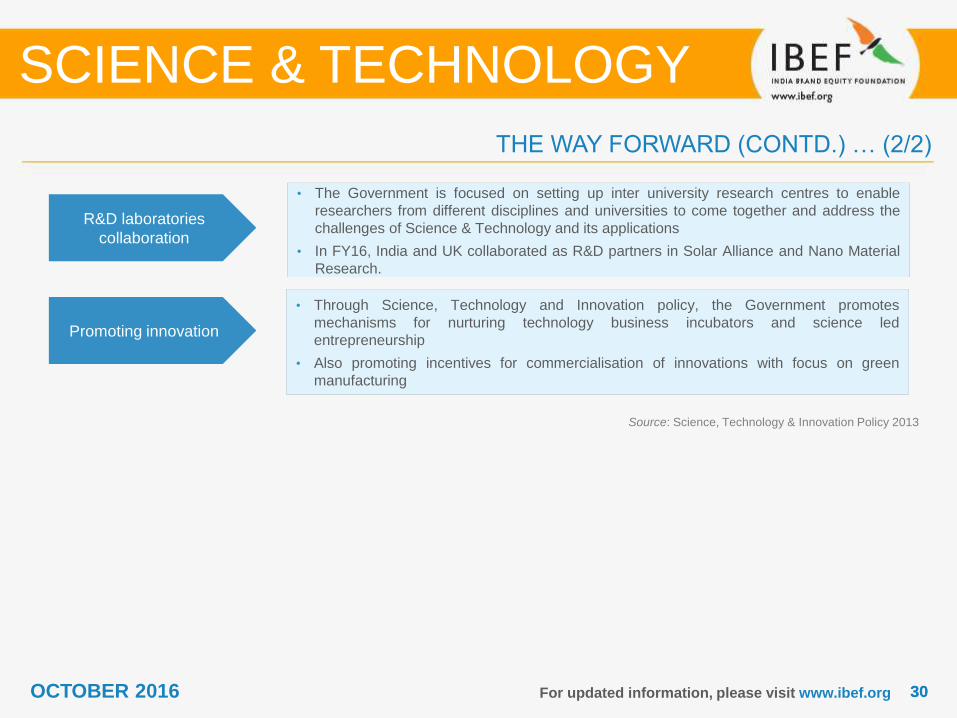
THE WAY FORWARD (CONTD.) … (2/2)
SCIENCE & TECHNOLOGY
Source: Science, Technology & Innovation Policy 2013
R&D laboratories
collaboration
Promoting innovation
• Through Science, Technology and Innovation policy, the Government promotes
mechanisms for nurturing technology business incubators and science led
entrepreneurship
• Also promoting incentives for commercialisation of innovations with focus on green
manufacturing
• The Government is focused on setting up inter university research centres to enable
researchers from different disciplines and universities to come together and address the
challenges of Science & Technology and its applications
• In FY16, India and UK collaborated as R&D partners in Solar Alliance and Nano Material
Research.

SUCCESS STORIES
SCIENCE & TECHNOLOGY
3232OCTOBER 2016
1966 1998 2005 2008 2014 2015 2016
For updated information, please visit www.ibef.org
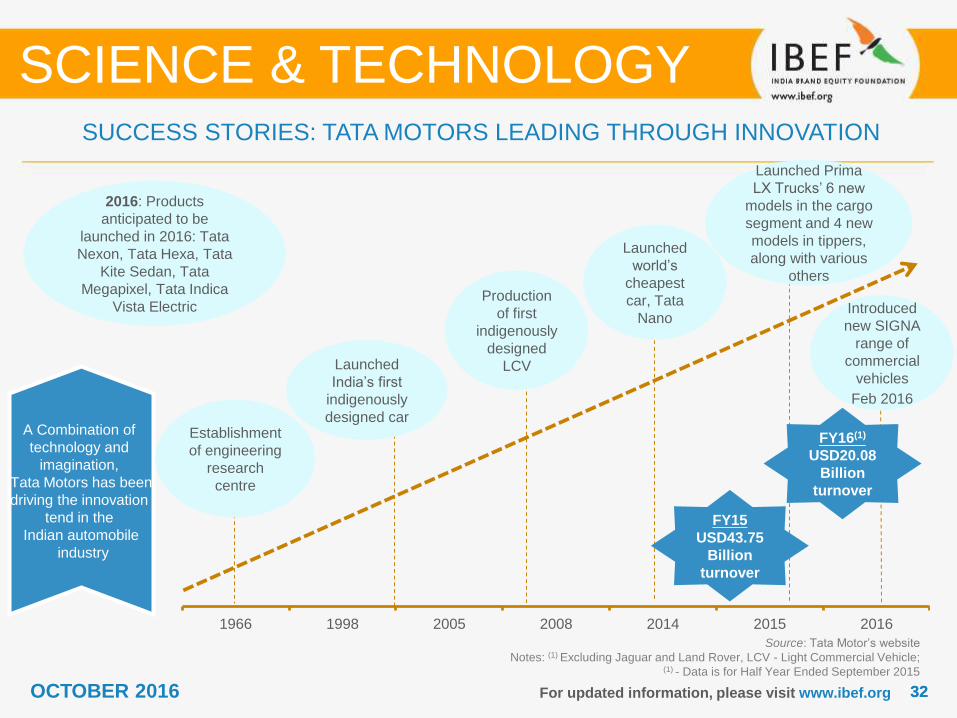
SUCCESS STORIES: TATA MOTORS LEADING THROUGH INNOVATION
SCIENCE & TECHNOLOGY
Source: Tata Motor’s website
Notes: (1) Excluding Jaguar and Land Rover, LCV - Light Commercial Vehicle; (1) - Data is for Half Year Ended September 2015
A Combination of
technology and
imagination,
Tata Motors has been
driving the innovation
tend in the
Indian automobile
industry
Production
of first
indigenously
designed
LCV
Establishment
of engineering
research
centre
Launched
India’s first
indigenously
designed car
Launched
world’s
cheapest
car, Tata
Nano
Launched Prima
LX Trucks’ 6 new
models in the cargo
segment and 4 new
models in tippers,
along with various
others
FY15
USD43.75
Billion
turnover
Introduced
new SIGNA
range of
commercial
vehicles
Feb 2016
FY16(1)
USD20.08
Billion
turnover
2016: Products
anticipated to be
launched in 2016: Tata
Nexon, Tata Hexa, Tata
Kite Sedan, Tata
Megapixel, Tata Indica
Vista Electric
3333OCTOBER 2016 For updated information, please visit www.ibef.org
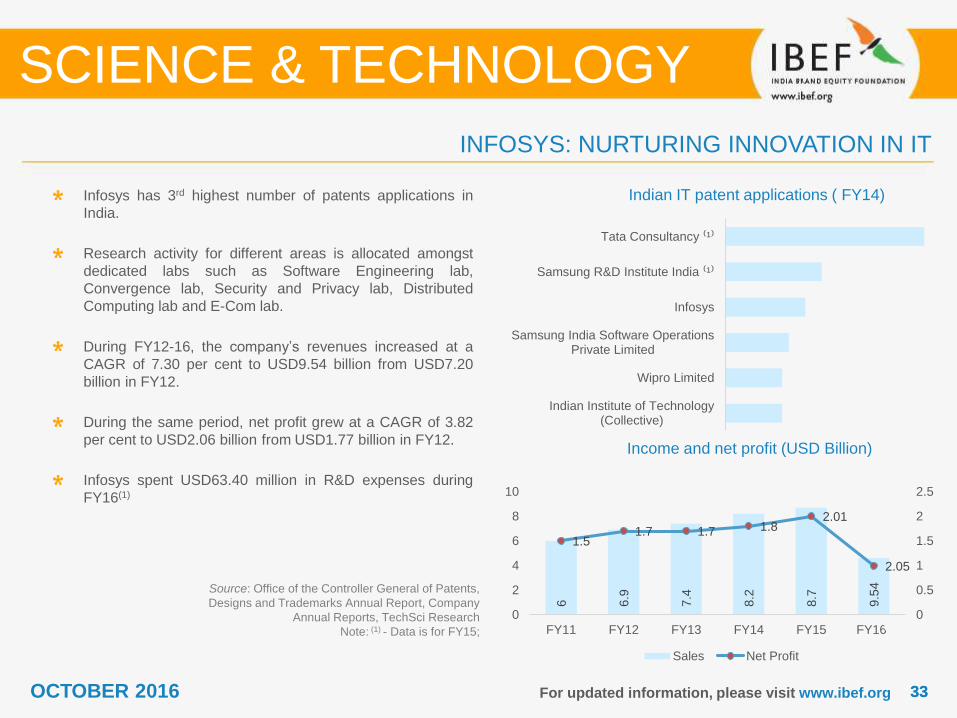
INFOSYS: NURTURING INNOVATION IN IT
Source: Office of the Controller General of Patents,
Designs and Trademarks Annual Report, Company
Annual Reports, TechSci Research
Note: (1) - Data is for FY15;
Indian IT patent applications ( FY14)Infosys has 3rd highest number of patents applications in
India.
Research activity for different areas is allocated amongst
dedicated labs such as Software Engineering lab,
Convergence lab, Security and Privacy lab, Distributed
Computing lab and E-Com lab.
During FY12-16, the company’s revenues increased at a
CAGR of 7.30 per cent to USD9.54 billion from USD7.20
billion in FY12.
During the same period, net profit grew at a CAGR of 3.82
per cent to USD2.06 billion from USD1.77 billion in FY12.
Infosys spent USD63.40 million in R&D expenses during
FY16(1)
Income and net profit (USD Billion)
SCIENCE & TECHNOLOGY
6 6.9
7.4
8.2
8.7
9.5
4
1.51.7 1.7 1.8
2.01
2.05
0
0.5
1
1.5
2
2.5
0
2
4
6
8
10
FY11 FY12 FY13 FY14 FY15 FY16*
Sales Net Profit
Indian Institute of Technology(Collective)
Wipro Limited
Samsung India Software OperationsPrivate Limited
Infosys
Samsung R&D Institute India ⁽¹⁾
Tata Consultancy ⁽¹⁾

USEFUL INFORMATION
SCIENCE & TECHNOLOGY
3535OCTOBER 2016 For updated information, please visit www.ibef.org
Department of Science & Technology
Technology Bhavan, New Mehrauli Road
New Delhi – 110016, India
Phone: 91 11 26567373, 26962819
Fax: 91 11 26864570, 26862418
E-mail: [email protected]
AUTONOMOUS & PROFESSIONAL BODIES … (1/2)
SCIENCE & TECHNOLOGY
Indian National Science Academy
Bahadur Shah Zafar Marg,
New Delhi – 110002, India
Phone: 91 11 23221931, 23221950
Fax: 91 11 23235648, 23231095
E-mail: [email protected]
Indian National Academy of Engineering
117 Nalanda House, IIT Campus,
Hauz Khas, New Delhi 110 016, India
Phone: 91 11 26582475, 26582635
Fax: 91 11 26856635
E-mail: [email protected]
3636OCTOBER 2016 For updated information, please visit www.ibef.org
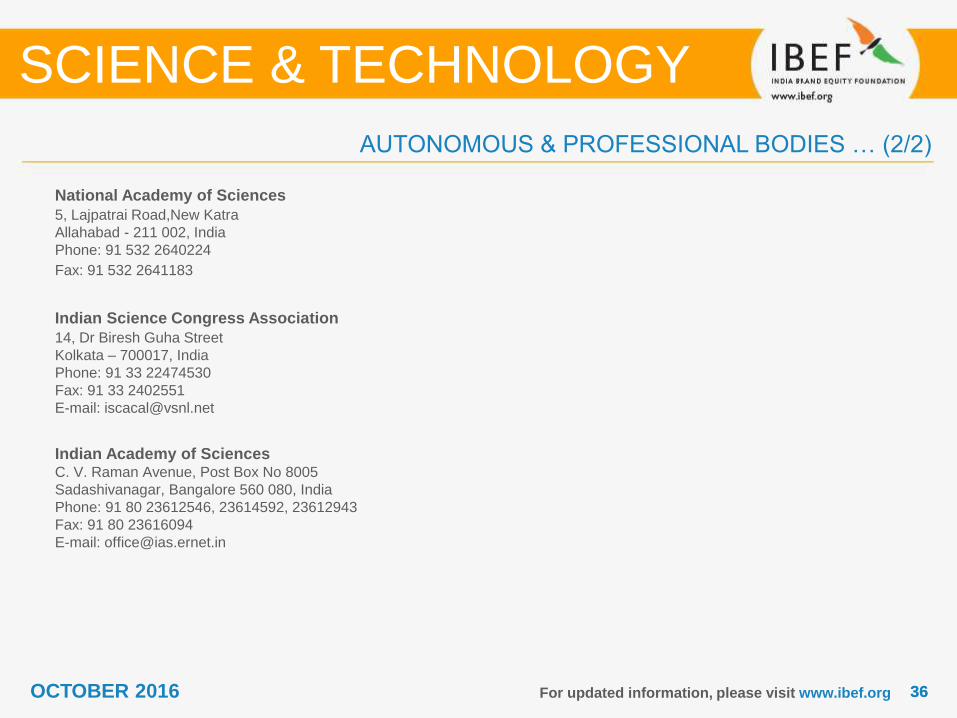
National Academy of Sciences
5, Lajpatrai Road,New Katra
Allahabad - 211 002, India
Phone: 91 532 2640224
Fax: 91 532 2641183
SCIENCE & TECHNOLOGY
Indian Science Congress Association
14, Dr Biresh Guha Street
Kolkata – 700017, India
Phone: 91 33 22474530
Fax: 91 33 2402551
E-mail: [email protected]
Indian Academy of SciencesC. V. Raman Avenue, Post Box No 8005
Sadashivanagar, Bangalore 560 080, India
Phone: 91 80 23612546, 23614592, 23612943
Fax: 91 80 23616094
E-mail: [email protected]
AUTONOMOUS & PROFESSIONAL BODIES … (2/2)
3737OCTOBER 2016 For updated information, please visit www.ibef.org
CAGR: Compound Annual Growth Rate
FDI: Foreign Direct Investment
FY: Indian Financial Year (April to March)
So FY12 implies April 2011 to March 2012
GOI: Government of India
MNC: Multinational Company
GERD: Gross Expenditure on Research & Development
STI: Science Technology & Innovation
Y-o-Y: Year on Year
INR: Indian Rupee
USD: US Dollar
LCV: Light Commercial Vehicle
PPP: Public Private Partnership
Wherever applicable, numbers have been rounded off to the nearest whole number
GLOSSARY
SCIENCE & TECHNOLOGY
3838OCTOBER 2016
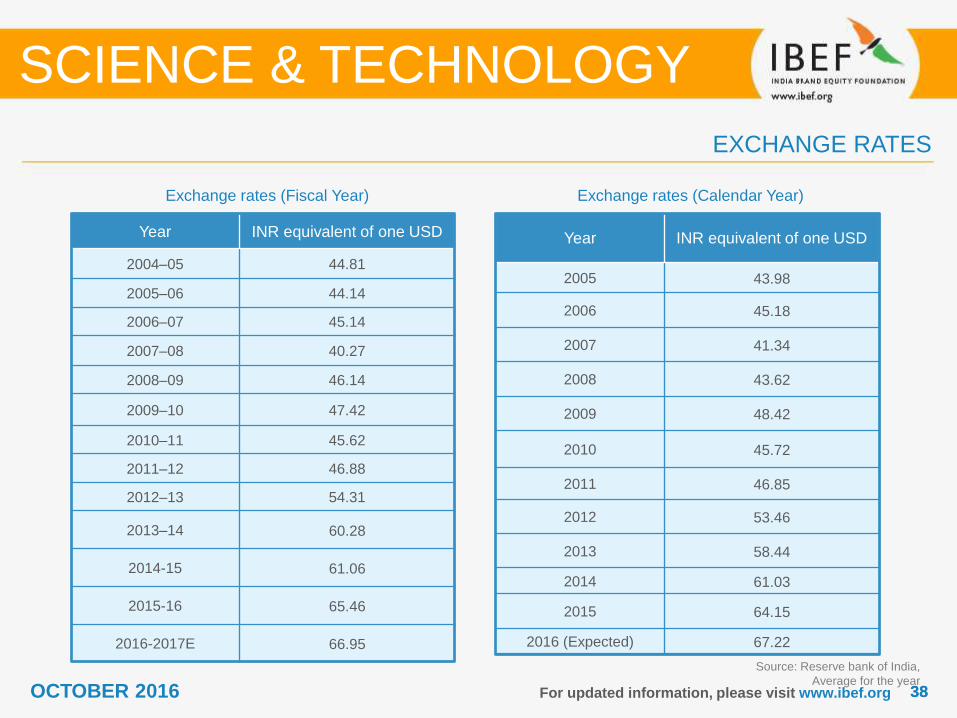
Exchange rates (Fiscal Year)
For updated information, please visit www.ibef.org
EXCHANGE RATES
Exchange rates (Calendar Year)
SCIENCE & TECHNOLOGY
Year INR equivalent of one USD
2004–05 44.81
2005–06 44.14
2006–07 45.14
2007–08 40.27
2008–09 46.14
2009–10 47.42
2010–11 45.62
2011–12 46.88
2012–13 54.31
2013–14 60.28
2014-15 61.06
2015-16 65.46
2016-2017E 66.95
Source: Reserve bank of India,
Average for the year
Year INR equivalent of one USD
2005 43.98
2006 45.18
2007 41.34
2008 43.62
2009 48.42
2010 45.72
2011 46.85
2012 53.46
2013 58.44
2014 61.03
2015 64.15
2016 (Expected) 67.22
3939OCTOBER 2016
India Brand Equity Foundation (“IBEF”) engaged TechSci to prepare this presentation and the same has been
prepared by TechSci in consultation with IBEF.
All rights reserved. All copyright in this presentation and related works is solely and exclusively owned by IBEF. The
same may not be reproduced, wholly or in part in any material form (including photocopying or storing it in any
medium by electronic means and whether or not transiently or incidentally to some other use of this presentation),
modified or in any manner communicated to any third party except with the written approval of IBEF.
This presentation is for information purposes only. While due care has been taken during the compilation of this
presentation to ensure that the information is accurate to the best of TechSci and IBEF’s knowledge and belief, the
content is not to be construed in any manner whatsoever as a substitute for professional advice.
TechSci and IBEF neither recommend nor endorse any specific products or services that may have been mentioned in
this presentation and nor do they assume any liability or responsibility for the outcome of decisions taken as a result of
any reliance placed on this presentation.
Neither TechSci nor IBEF shall be liable for any direct or indirect damages that may arise due to any act or omission
on the part of the user due to any reliance placed or guidance taken from any portion of this presentation.
For updated information, please visit www.ibef.org
DISCLAIMER
SCIENCE & TECHNOLOGY