Embed Size (px)
Citation preview

The impact of pension system reform
on projected old-age income: the case
of PolandElena Jarocinska
Anna Ruzik-Sierdzińska
Nr 482 (2016)
CASE Network Studies & Analyses
W A R S A W B I S H K E K K Y I V T B I L I S I C H I S I N A U M I N S K

Keywords:
pension benefits, inequality, replacement rates, microsimulation
JEL Codes:
H55, J26
© CASE – Center for Social and Economic Research, Warsaw, 2016
Graphic Design:
Katarzyna Godyń-Skoczylas | grafo-mania
EAN 9788371786365
Publisher:
CASE-Center for Social and Economic Research on behalf of CASE Network
al. Jana Pawla II 61, office 212, 01-031 Warsaw, Poland
tel.: +48 22 206 29 00, 828 61 33, fax: +48 22 206 29 01
e-mail: [email protected]
www.case-research.eu
Materials published here have a working paper character. They can be subject to further
publication. The views and opinions expressed here reflect the author(s) point of view and
are not necessarily shared by the European Commission or CASE Network, nor does the
study anticipate decisions taken by the European Commission.
This report was prepared within a research project entitled MOPACT, which received
funding from the European Union’s 7th Framework Programme for research, technological
development and demonstration under grant agreement no 320333.
25The CASE Network is a group of economic and social research centers in Poland, Kyrgyzstan, Ukraine, Georgia, Moldova, and
Belarus. Organizations in the network regularly conduct joint research and advisory projects. The research covers a wide spectrum
of economic and social issues, including economic effects of the European integration process, economic relations between
the EU and CIS, monetary policy and euro-accession, innovation and competitiveness, and labour markets and social policy.
The CASE Network consists of:
– CASE – Center for Social and Economic Research, Warsaw, est. 1991, www.case-research.eu
– CASE – Center for Social and Economic Research – Kyrgyzstan, est. 1998, www.case.jet.kg
– Center for Social and Economic Research - CASE Ukraine, est. 1999, www.case-ukraine.com.ua
– Foundation for Social and Economic Research CASE Moldova, est. 2003, www.case.com.md
– CASE Belarus - Center for Social and Economic Research Belarus, est. 2007, www.case-belarus.eu
– Center for Social and Economic Research CASE Georgia, est. 2011

3
Contents
The Authors . . . . . . . . . . . . . . . . . . . . . . . . . . . . . . . . . . . . . . . . . . . . . . . . . . 5
Abstract . . . . . . . . . . . . . . . . . . . . . . . . . . . . . . . . . . . . . . . . . . . . . . . . . . . . . 6
1. Introduction . . . . . . . . . . . . . . . . . . . . . . . . . . . . . . . . . . . . . . . . . . . . . . . 7
2. Overview of the Polish pension system . . . . . . . . . . . . . . . . . . . . . . . 10
3. Data and methods . . . . . . . . . . . . . . . . . . . . . . . . . . . . . . . . . . . . . . . . . 13Data and the sample . . . . . . . . . . . . . . . . . . . . . . . . . . . . . . . . . . . . . . . 13Earnings profiles . . . . . . . . . . . . . . . . . . . . . . . . . . . . . . . . . . . . . . . . . . . 14Pension benefits projections . . . . . . . . . . . . . . . . . . . . . . . . . . . . . . . . 15
4. Results . . . . . . . . . . . . . . . . . . . . . . . . . . . . . . . . . . . . . . . . . . . . . . . . . . . 16 Vulnerable groups . . . . . . . . . . . . . . . . . . . . . . . . . . . . . . . . . . . . . . . . . . 19
5. Sensitivity of results . . . . . . . . . . . . . . . . . . . . . . . . . . . . . . . . . . . . . . . 22
6. Conclusions and discussion . . . . . . . . . . . . . . . . . . . . . . . . . . . . . . . . . 24
References . . . . . . . . . . . . . . . . . . . . . . . . . . . . . . . . . . . . . . . . . . . . . . . . . . 25
Appendix: Pension benefit projections . . . . . . . . . . . . . . . . . . . . . . . . . . 28
4
CASE Network Studies & Analyses | No 482 (2016)
List of figures
Figure 1. Structure of household per capita income by income quartiles
for the age group 65–90 in 2012 . . . . . . . . . . . . . . . . . . . . . . . . . . . . . . . . . . . . . 8
Figure 2. The predicted age-earnings profiles for men aged 18–64
by education level, in euro . . . . . . . . . . . . . . . . . . . . . . . . . . . . . . . . . . . . . . . . . . 14
Figure 3. Distributions of predicted monthly pension benefits at 67,
baseline scenario whole sample and selected years, in euro . . . . . . . . . . . . . 16
List of tables
Table 1. Predictions of net monthly pension benefits at 67 in euro,
baseline scenario, 2036–2046 . . . . . . . . . . . . . . . . . . . . . . . . . . . . . . . . . . . . . . 17
Table 2. Descriptive statistics of individual replacement rates at 67,
baseline scenario . . . . . . . . . . . . . . . . . . . . . . . . . . . . . . . . . . . . . . . . . . . . . . . . . . 18
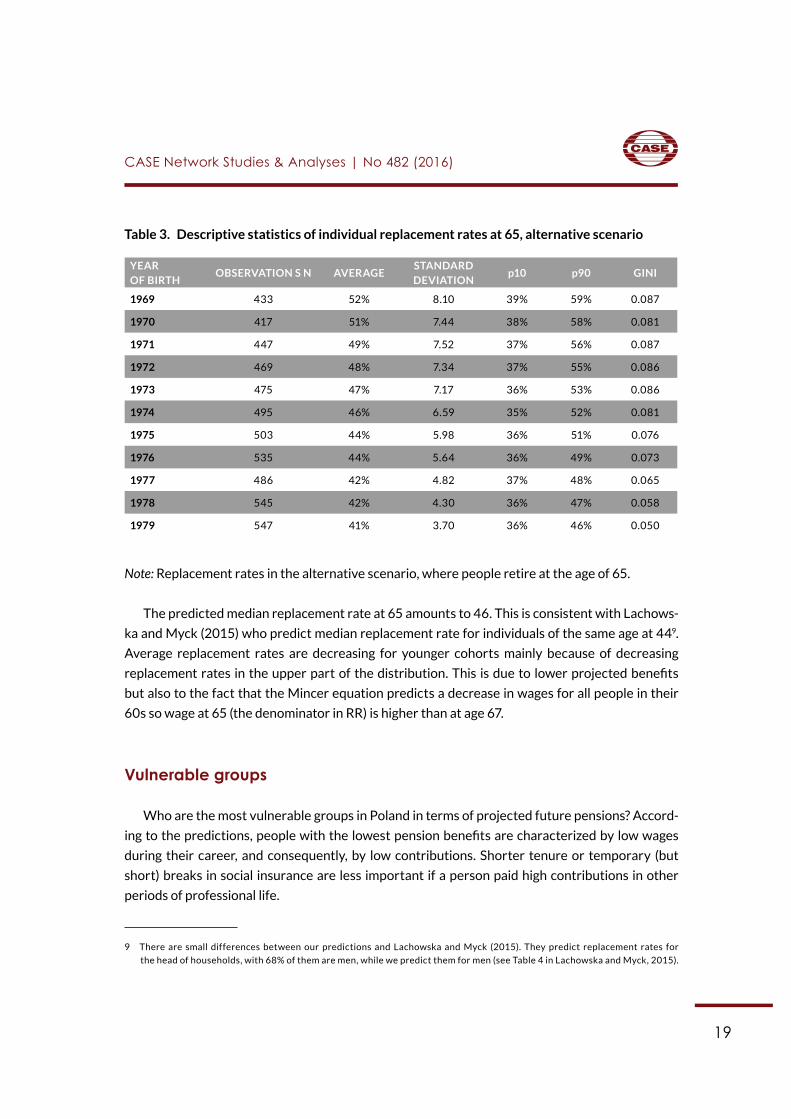
Table 3. Descriptive statistics of individual replacement rates at 65,
alternative scenario . . . . . . . . . . . . . . . . . . . . . . . . . . . . . . . . . . . . . . . . . . . . . . . 19
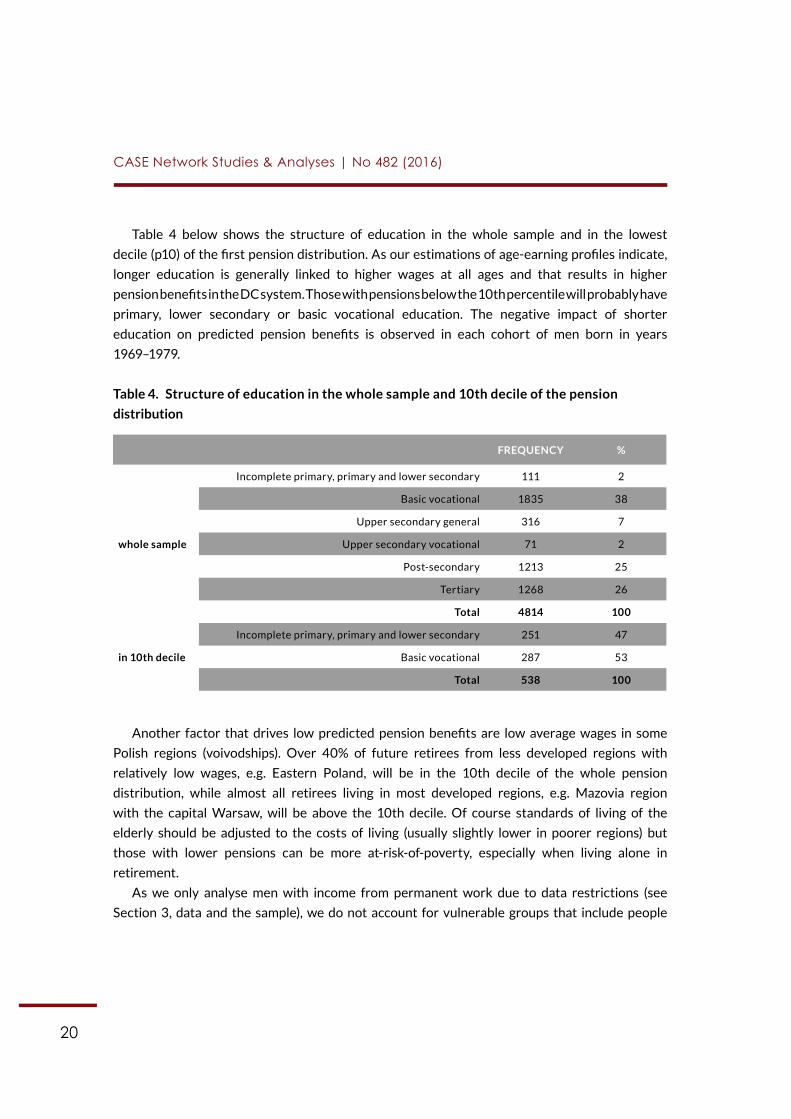
Table 4. Structure of education in the whole sample and 10th
decile of the pension distribution . . . . . . . . . . . . . . . . . . . . . . . . . . . . . . . . . . . 20
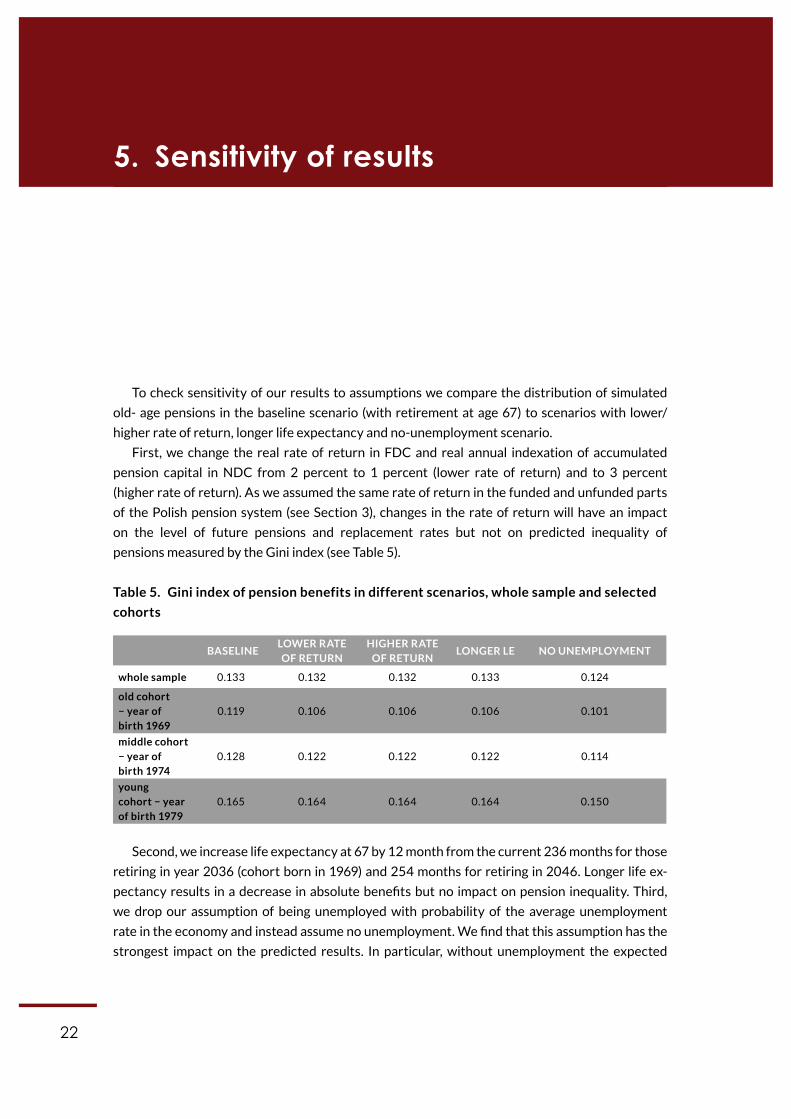
Table 5. Gini index of pension benefits in different scenarios,
whole sample and selected cohorts . . . . . . . . . . . . . . . . . . . . . . . . . . . . . . . . . . 22

5
Elena Jarocinska, PhD – CASE Fellow and researcher, holds a PhD in economics from
Universitat Pompeu Fabra, Barcelona. Her expertise includes pension economics, public policy,
fiscal federalism and regional policy. She has collaborated with the CASE Foundation since
1998. She has coordinated and participated in a number of projects on welfare issues for the
European Commission and other international organisations.
Anna Ruzik-Sierdzińska, PhD – CASE expert and author of publications in the field of pension
reform, ageing and elderly. She is assistant professor at the Institute of Labour and Social Studies
in Warsaw. Between 2002 and 2006, Mrs. Ruzik was a World Bank consultant. She cooperated
with CASE Foundation in various projects from the areas of social policy, pension systems and
labour market. From September 2002 until March 2003 she was a Marie Curie Fellow at the
Center for Economic Research (CentER) in Tilburg, NL.
The Authors
6
CASE Working Paper | No 1 (2015)
This paper analyses the distributional effects of the Polish old-age pension reform intro-
duced in 1999. Following a benchmark Mincer earnings equation, and using a newly developed
microsimulation model we project future pension benefits for males born in years 1969–1979.
We find that inequality of predicted first pension benefits measured by the Gini coefficient
increases from 0.119 to 0.165 for cohorts of men retiring between 2036 and 2046. The observed
increased inequality of pension benefits is due to the decreasing share of initial capital that is
based on a more generous DB formula in the total accumulated pension capital. At the same time,
inequality in replacements rates decreases due to a stronger link between contributions paid
through the entire working life and pension benefits.
Abstract
7
Most developed countries are expecting decreases in replacement rates (RR) as a result
of recent pension reforms (see OECD, 2013). Poland stands out among other countries
as it exhibits one of the largest drops in RR among the EU-27 in the years 2010–2050
of 35 percent for an average income earner with a 40 year career (EC, 2012) due to
a shift from the defined benefit (DB) to the defined contribution (DC) pension system.
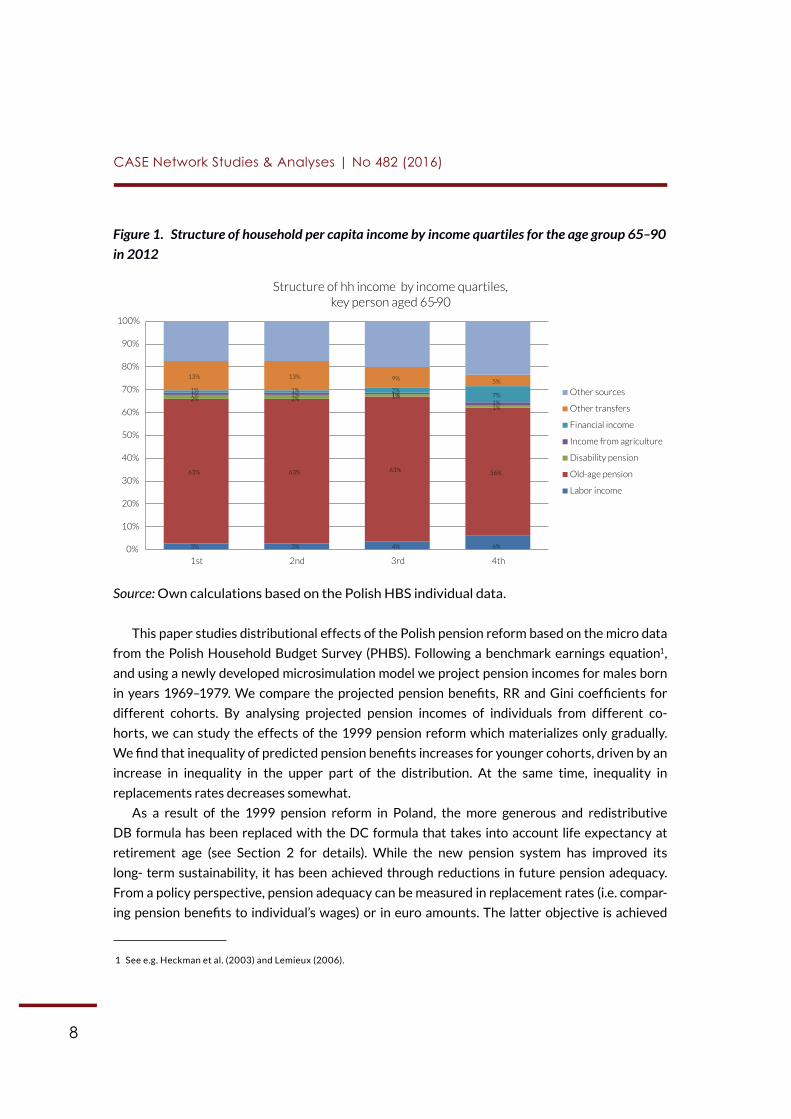
Today, old-age pension is an important source of income in elderly households in Poland
(see Figure 1). In order to maintain a similar standard of living after retirement, the
average individual will need to complement public pension benefits with private
pensions and other savings. According to the World Bank (2014) study, in Poland
currently working cohorts aged 20–50 should save additionally about 10 percent
of their annual earnings to guarantee them current replacement rates. Low-income
earners, persons with short tenure and other vulnerable groups might find it difficult to
save for retirement. Therefore, as standards of living of the elderly are likely to decrease,
policymakers require in-depth knowledge about the income distribution of current
and future retirees, so that they can target the most vulnerable in their social policies.
1. Introduction
8
CASE Network Studies & Analyses | No 482 (2016)
3% 3% 4% 6%
63% 63% 63% 56%
2% 2% 1%
1%
1% 1% 1%
1%
1% 1% 2%7%
13% 13% 9% 5%
0%
10%
20%
30%
40%
50%
60%
70%
80%
90%
100%
1st 2nd 3rd 4th
Structure of hh income by income quartiles, key person aged 65-90
Other sources
Other transfers
Financial income
Income from agriculture
Disability pension
Old-age pension
Labor income
Figure 1. Structure of household per capita income by income quartiles for the age group 65–90
in 2012
Source: Own calculations based on the Polish HBS individual data.
This paper studies distributional effects of the Polish pension reform based on the micro data
from the Polish Household Budget Survey (PHBS). Following a benchmark earnings equation1,
and using a newly developed microsimulation model we project pension incomes for males born
in years 1969–1979. We compare the projected pension benefits, RR and Gini coefficients for
different cohorts. By analysing projected pension incomes of individuals from different co-
horts, we can study the effects of the 1999 pension reform which materializes only gradually.
We find that inequality of predicted pension benefits increases for younger cohorts, driven by an
increase in inequality in the upper part of the distribution. At the same time, inequality in
replacements rates decreases somewhat.
As a result of the 1999 pension reform in Poland, the more generous and redistributive
DB formula has been replaced with the DC formula that takes into account life expectancy at
retirement age (see Section 2 for details). While the new pension system has improved its
long- term sustainability, it has been achieved through reductions in future pension adequacy.
From a policy perspective, pension adequacy can be measured in replacement rates (i.e. compar-
ing pension benefits to individual’s wages) or in euro amounts. The latter objective is achieved
1 See e.g. Heckman et al. (2003) and Lemieux (2006).
9
CASE Network Studies & Analyses | No 482 (2016)
in many countries through minimum income provisions which mainly aim at preventing old-age
poverty by securing a minimum, basic level of standard of living at retirement (EC, 2012). A shift
to DC formula results in a smaller inequality in terms of replacement rates given that DC formula
is more linked to individual contributions, but in a larger inequality in absolute pension amounts
because of a wider distribution of wages as compared to pension benefits. Several studies have
analysed the impact of pension systems on the income distribution of the elderly (see for exam-
ple, Knoef et al. 2012; van Vliet et al. 2012; Vork et al. 2015), and in particular studied groups of
retirees within age cohorts (see e.g. Ervik and Linden 2013 and OECD 2013). To our knowledge,
this paper is the first that analyses the distribution of future pension incomes of the Polish elderly
within cohorts i.e. intra-generational inequality. Previous studies on Poland that predict future
pension benefits do not investigate the whole income distribution. Most of the previous studies
predict future pension benefits for a hypothetical worker (e.g. Määttänen et al. 2014; EC 2012;
OECD 2013) or for year cohorts, with the latter focusing on the intergenerational differences
(see Jabłonowski and Müller 2013; Egert 2012; Leifels et al 2010). These studies find large drops
in projected RR, especially for people with career breaks and short careers as well as low earners.
Määttänen et al. (2014) also show that the impact of working longer on projected RR is stronger
than the estimated effect of an increase in life expectancy.
By contrast, Lachowska and Myck (2015) make predictions of pension benefits for house-
holds based on the micro data, but they do not study the distributional effects of pension re-
forms within the elderly cohorts. They focus instead on the crowd-out effects of public pen-
sion benefits on private savings. Another approach is to use the data on the distribution of
current pensioners by wage and tenure (Chloń- Domińczak and Strzelecki, 2013). They find
that under the current indexation rules the projected minimum pension guarantee would
only amount to 15 percent of the average wage (as compared to the current level of 22 per-
cent) which would increase the risk of poverty for future retirees.
The plan of the paper is as follows. In section 2 we briefly characterize the Polish pension sys-
tem. In section 3 we describe the data and empirical methods to project pension incomes and
replacement rates for individuals in selected cohorts. Section 4 describes the results, section 5
analyses sensitivity of results and the last section concludes.
10
CASE Working Paper | No 1 (2015)
In this Section we briefly describe the pension system for employees and the self- employed that is managed by the Social Insurance Institution (ZUS). There are three separate old-age pension schemes in Poland and ZUS pension system is the largest one. ZUS pension system covers vast majority of working population and retirees (around 80 percent)2. It was reformed
in 1999.
The reformed pension system for employees and the self-employed consists of three pillars:
1. The mandatory notional-accounts defined contribution (NDC) scheme. The notional rate of
return is defined as 100 percent of the growth of the wage bill (75% before 2004). At
retirement, the value of an individual notional pension account is converted into annuities
using unisex period life expectancy tables published annually by the Central Statistical Office.
2. The second pillar is a funded defined contribution (FDC) scheme. Contributions paid into the
second pillar are indexed with the rate of return on pension funds investments.
3. The third pillar consists of voluntary, private pension plans with rather weak tax incentives.
The first and second pillars are financed through individual contributions (19.52% of gross
wages) that originally (until 2014) were obligatory split between the 1st (12.2%) and the 2nd
(7.3%) pillars. The annual ceiling to these contributions is set at 30 times average monthly earn-
ings projected for a given year.
In 2013, a part of contributions paid into the second pillar was moved to the first pillar and
indexed by an average GDP growth from 5 years before indexation. Furthermore, the reform of
2013 established that the first pillar Social Insurance Institution (ZUS) will handle the pension
funds retirement plans, with the accumulated funds transferred incrementally 10 years before
the statutory retirement age.
In addition to mandatory pillars, it is possible to save for retirement voluntary in occupation-
al and individual pension plans. However, their role in old-age income provision is still marginal,
mainly due to weak tax incentives and penalties for early withdrawal of savings.
2 The other two are the pension scheme for farmers and the pension scheme for the armed forces, judges and prosecutors.
2. Overview of the Polish pension system

11
CASE Network Studies & Analyses | No 482 (2016)
The pension reform implemented in 1999 in Poland changed old-age pension formula from
the defined benefit (DB) to the defined contribution (DC). The effect of the reform depends
on the age of the insured. The old, DB pension scheme applies to people born before 1949 and
– in the transitory period until 2008 – to younger ones that did not choose the funded pillar
and fulfilled all requirements to retire under old rules before 2009. Initially, all insured born
after 31st December 1968 had their pension contributions split between two obligatory pillars:
NDC (managed by public Social Insurance Institution ZUS) and FDC (one of the open pension
funds managed by private entities). However, since 2013 it is possible to resign from paying
contributions to an open pension fund and transfer the whole amount to ZUS only.
The retirement age before the 1999 reform was 60 years for women and 65 years for
men with numerous possibilities of earlier retirement (usually at age 55/60). Since 2013 the
statutory retirement age has been increasing until in 2040 it reaches 67 years for both men
and women in order to increase future pension adequacy. However, the increase in statutory
retirement age is still being debated in public with the majority of Poles against the increase
to 673.
Partial pension benefits will still be possible for men with 40 years of contributions at age
65 and for women with 35 years of contributions at age 62.
Pension benefits in the old pension system were calculated according to the following formula:
Pension benefit = base amount * [0.24 + IB * (0.013 *CY + 0.007 * NCY)], where
• base amount equal to the average economy-wide wage at the time of calculating the first
pension,
• IB – individual base stands for the relation of wages from the 10 best years of work out of
the last 20 years before retirement to average wages in the economy in the same years
(additional restriction was IB ≤ 250%),
• CY – number of contributory years,
• NCY – number of non-contributory years, e.g. military service, studies, maternity leave
(additional restriction NCY ≤ 1/3*CY).
There were no additional deductions for early retirement or bonuses to make people post-
pone retirement. The old Polish pension system provided relatively higher replacement rates
for low earners and lower for high earners.
3 Results of public opinion polls (CBOS, 2012) show that in April 2012 79% of respondents were against an increase in male
retirement age and 86% against an increase in female retirement age.
12
CASE Network Studies & Analyses | No 482 (2016)
The new pension formula is:
Pension benefit = pension assets accumulated in 1st and 2nd pillars/ LE (retirement age),
where LE (retirement age) is the unisex life expectancy at the actual retirement age. Note
that Poland implicitly uses a discount rate of zero because the calculation is based on life
expectancy alone without any discounting4.
To illustrate the differences in the old and new pension system, we take a hypothetical men
with 25 CY and 5 NCY retiring at age 65, and earning average wage during his entire career.
Retiring under the old system formula he could expect replacement rate of around 60%.
According to the reformed formula, he would have replacement rate of around 30%, under the
assumption of annual real rate of return on pension assets of 1 percent or replacement rate
of 40% if the rate of return equals to 3 percent.
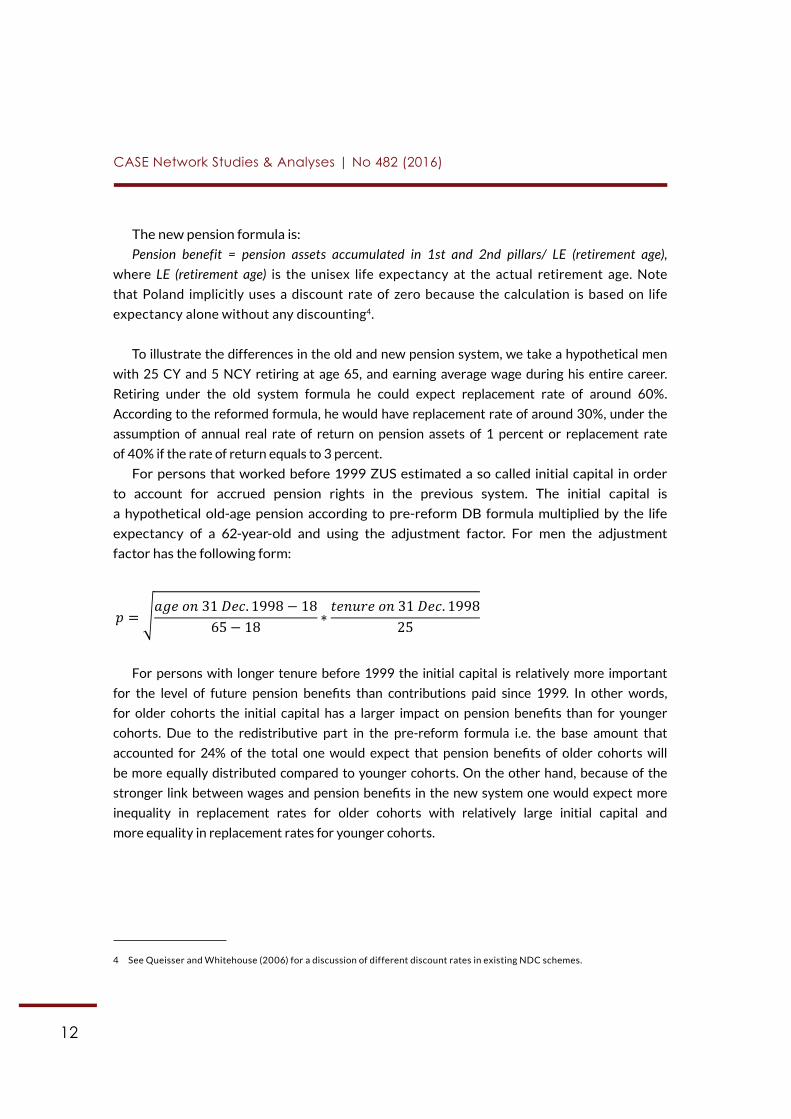
For persons that worked before 1999 ZUS estimated a so called initial capital in order
to account for accrued pension rights in the previous system. The initial capital is
a hypothetical old-age pension according to pre-reform DB formula multiplied by the life
expectancy of a 62-year-old and using the adjustment factor. For men the adjustment
factor has the following form:
For persons with longer tenure before 1999 the initial capital is relatively more important
for the level of future pension benefits than contributions paid since 1999. In other words,
for older cohorts the initial capital has a larger impact on pension benefits than for younger
cohorts. Due to the redistributive part in the pre-reform formula i.e. the base amount that
accounted for 24% of the total one would expect that pension benefits of older cohorts will
be more equally distributed compared to younger cohorts. On the other hand, because of the
stronger link between wages and pension benefits in the new system one would expect more
inequality in replacement rates for older cohorts with relatively large initial capital and
more equality in replacement rates for younger cohorts.
4 See Queisser and Whitehouse (2006) for a discussion of different discount rates in existing NDC schemes.
11
IB – individual base stands for the relation of wages from the 10 best years of work out of the last
20 years before retirement to average wages in the economy in the same years (additional
restriction was IB ≤ 250%),
CY – number of contributory years,
NCY – number of non-contributory years, e.g. military service, studies, maternity leave (additional
restriction NCY ≤ 1/3*CY).
There were no additional deductions for early retirement or bonuses to make people postpone
retirement. The old Polish pension system provided relatively higher replacement rates for low earners
and lower for high earners.
The new pension formula is:
Pension benefit = pension assets accumulated in 1st and 2nd pillars/ LE (retirement age),
where LE (retirement age) is the unisex life expectancy at the actual retirement age. Note that Poland
implicitly uses a discount rate of zero because the calculation is based on life expectancy alone without
any discounting4.
To illustrate the differences in the old and new pension system, we take a hypothetical men with 25 CY
and 5 NCY retiring at age 65, and earning average wage during his entire career. Retiring under the old
system formula he could expect replacement rate of around 60%. According to the reformed formula, he
would have replacement rate of around 30%, under the assumption of annual real rate of return on
pension assets of 1 percent or replacement rate of 40% if the rate of return equals to 3 percent.
For persons that worked before 1999 ZUS estimated a so called initial capital in order to account for
accrued pension rights in the previous system. The initial capital is a hypothetical old-age pension
according to pre-reform DB formula multiplied by the life expectancy of a 62-year-old and using the
adjustment factor. For men the adjustment factor has the following form:
𝑝𝑝 = √𝑎𝑎𝑎𝑎𝑎𝑎 𝑜𝑜𝑜𝑜 31 𝐷𝐷𝑎𝑎𝐷𝐷. 1998 − 1865 − 18 ∗ 𝑡𝑡𝑎𝑎𝑜𝑜𝑡𝑡𝑡𝑡𝑎𝑎 𝑜𝑜𝑜𝑜 31 𝐷𝐷𝑎𝑎𝐷𝐷. 1998
25
4 See Queisser and Whitehouse (2006) for a discussion of different discount rates in existing NDC schemes.

13
Data and the sample
The data comes from the Polish Household Budget Survey (PHBS) collected by the
Polish Central Statistical Office. The PHBS is an annual representative survey covering
in 2012 over 37 thousand Polish households and over 105 thousand individuals. We use the
most recent available data – the year 20125.
To project future pension benefits, we first need to make several assumptions. In PHBS
we have information on individual net monthly earnings, but we do not know how many hours
individuals work in a month. So, we limit our sample to employees that receive their income
from permanent jobs and assume that two individuals in a similar permanent job work the same
number of hours6. By restricting our sample to employees on permanent jobs we ensure that
our predictions of lifetime labour earnings would depend on individual characteristics and
not on the number of hours worked. However the existing heterogeneity in earnings is likely
to be underestimated. For temporary jobs there is more uncertainty as to the number of hours
worked. Moreover, temporary jobs can be in form of a civil contract that is exempted from the
social security contributions so income from these jobs does not contribute to future pensions.
There are 31963 individuals who received income from permanent employment in 2012.
In this version of the paper we limit our sample to males. We plan to incorporate females in the
future analysis, assuming that they participate in the labour market for a shorter time due to
career breaks for childcare or elderly care. We trim individual earnings below the 1st and
above the 99th percentile in order to reduce the influence of outliers and avoid the impact from
coding errors. The resulted regression sample consists of 16706 male individuals.
5 For earnings projections we would use panel data with at least several years of observations. But unfortunately, in PHBS panel
data is only available for two consequent years, e.g. 2011 and 2012, and only for half of the sample e.g. in 2012 we observe
individuals that we observed in 2011.
6 The corresponding variable in Polish is “Dochody z pracy najemnej stalej w kraju”.
3. Data and methods
14
CASE Network Studies & Analyses | No 482 (2016)
To assess the pension benefits and replacement rates of future retirees we have developed
a micro-simulation model7. Below we discuss the main assumptions and the steps used in this
paper.
Earnings profiles
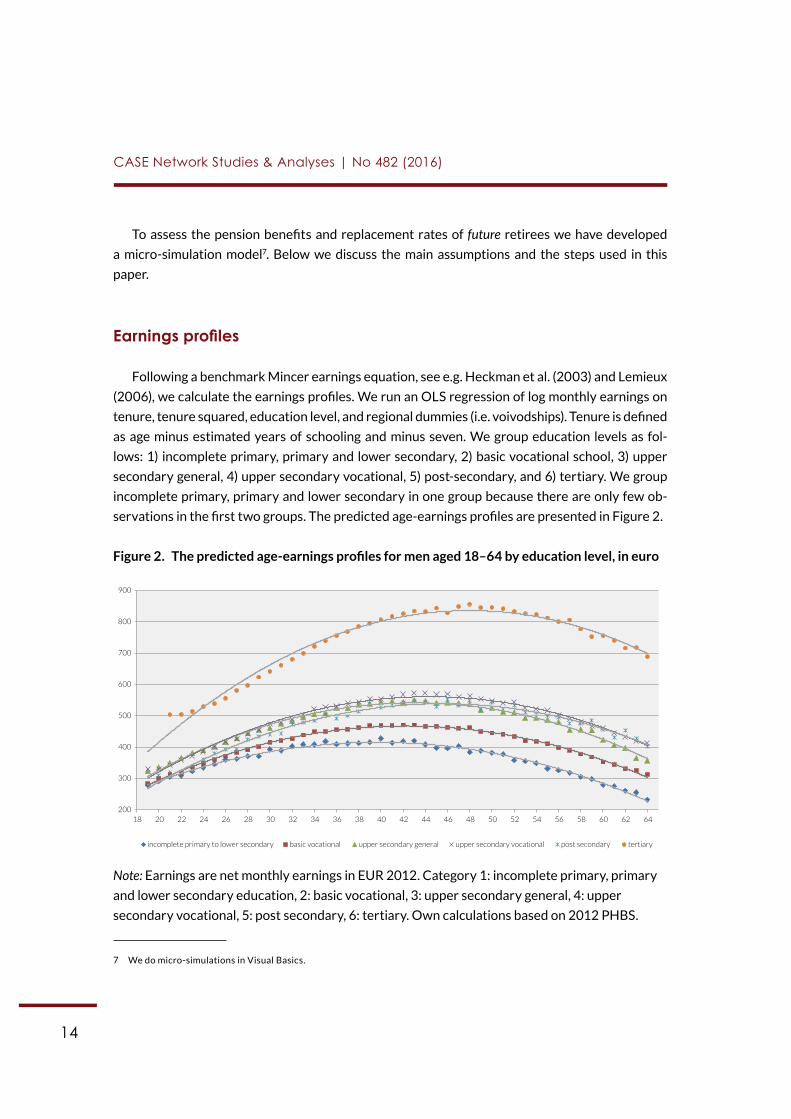
Following a benchmark Mincer earnings equation, see e.g. Heckman et al. (2003) and Lemieux
(2006), we calculate the earnings profiles. We run an OLS regression of log monthly earnings on
tenure, tenure squared, education level, and regional dummies (i.e. voivodships). Tenure is defined
as age minus estimated years of schooling and minus seven. We group education levels as fol-
lows: 1) incomplete primary, primary and lower secondary, 2) basic vocational school, 3) upper
secondary general, 4) upper secondary vocational, 5) post-secondary, and 6) tertiary. We group
incomplete primary, primary and lower secondary in one group because there are only few ob-
servations in the first two groups. The predicted age-earnings profiles are presented in Figure 2.
Figure 2. The predicted age-earnings profiles for men aged 18–64 by education level, in euro
Note: Earnings are net monthly earnings in EUR 2012. Category 1: incomplete primary, primary
and lower secondary education, 2: basic vocational, 3: upper secondary general, 4: upper
secondary vocational, 5: post secondary, 6: tertiary. Own calculations based on 2012 PHBS.
7 We do micro-simulations in Visual Basics.
200
300
400
500
600
700
800
900
18 20 22 24 26 28 30 32 34 36 38 40 42 44 46 48 50 52 54 56 58 60 62 64
incomplete primary to lower secondary basic vocational upper secondary general upper secondary vocational post secondary tertiary

15
CASE Network Studies & Analyses | No 482 (2016)
Pension benefits projections
We use the predicted earnings profiles to forecast earnings for male employees, given their
characteristics, from the age they were in 2012 until they retire at the age of 67. We assume
that, except for age, all the current characteristics, i.e. education level and region of living,
are fixed and the profile only changes with tenure. We also assume that they all live and
work until the statutory retirement age of 67. So we do not account for various mortality
or disability patterns among persons from the same cohort.
For earnings projections we limit our sample to males aged 33–43 in 2012 i.e. born between
1969 and 1979. A cohort born in 1969 is the first cohort covered entirely by the new system,
i.e. without any transitory rules allowing e.g. for early retirement on DB formula. Thus, we can
exclude individuals that may retire earlier. Another reason to limit our sample to individuals
in their mid-career is that wages are more stable during these and later years, thus making
our predictions more reliable. From the literature we know8 that there are large increases
in wages at the beginning of the career, but after that they change much less. In addition,
by this age people have stopped their formal education, so our assumption on fixed education
level is more plausible. We end up with 5353 male observations in our sample.
We discuss other assumptions for the baseline scenario in the Appendix. We check sensitivity
of results to main assumptions in Section 5. We also discuss an alternative scenario, where people
retire at the age of 65. By comparing the corresponding RR and Gini coefficients with the base-
line scenario we can study the effect of an increase in years worked on future pension incomes.
In addition, the alternative scenario is also realistic for Poland given that future governments
might decrease again the retirement age because of the public pressure.
8 See e.g. Lemieux (2006).
16
CASE Working Paper | No 1 (2015)
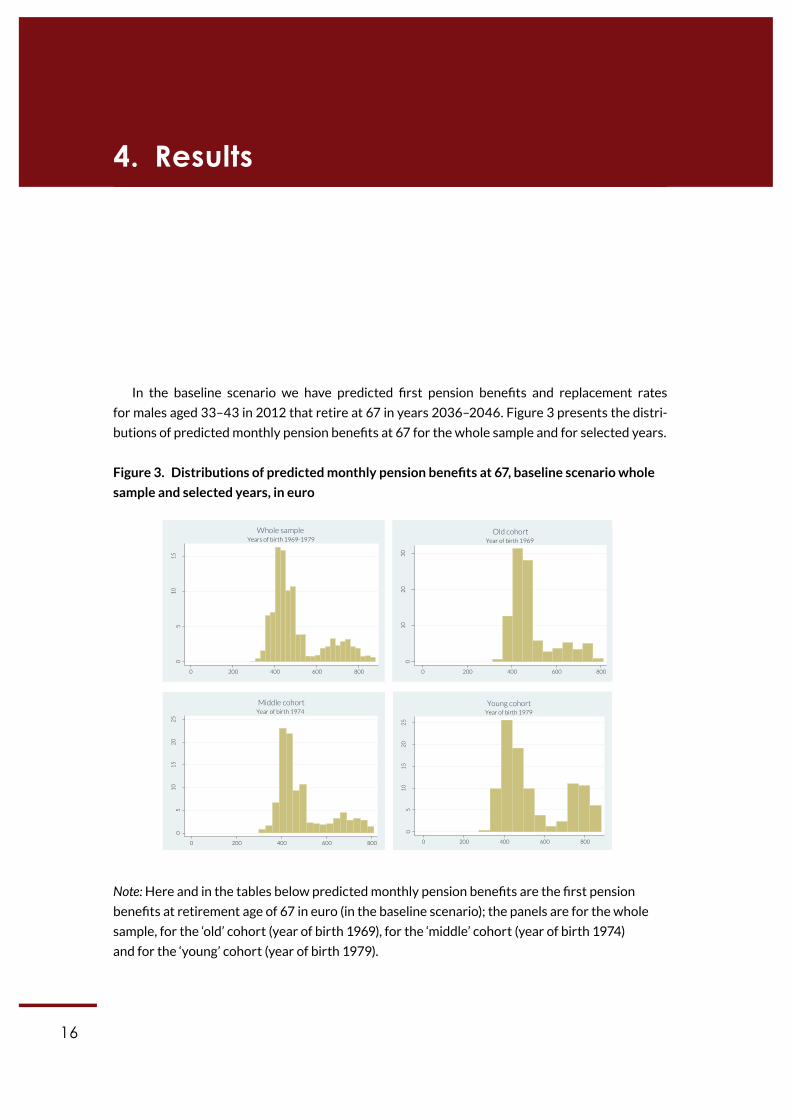
In the baseline scenario we have predicted first pension benefits and replacement rates
for males aged 33–43 in 2012 that retire at 67 in years 2036–2046. Figure 3 presents the distri-
butions of predicted monthly pension benefits at 67 for the whole sample and for selected years.
Figure 3. Distributions of predicted monthly pension benefits at 67, baseline scenario whole
sample and selected years, in euro
Note: Here and in the tables below predicted monthly pension benefits are the first pension
benefits at retirement age of 67 in euro (in the baseline scenario); the panels are for the whole
sample, for the ‘old’ cohort (year of birth 1969), for the ‘middle’ cohort (year of birth 1974)
and for the ‘young’ cohort (year of birth 1979).
4. Results
05
10
15
0 200 400 600 800
Years of birth 1969-1979
Whole sample
01
02
03
0
tn
ecre
P
0 200 400 600 800
Year of birth 1969
Old cohort
05
10
15
20
25
0 200 400 600 800
Year of birth 1974
Middle cohort
05
10
15
20
25
0 200 400 600 800
Year of birth 1979
Young cohort
05
10
15
0 200 400 600 800
Years of birth 1969-1979
Whole sample
01
02
03
0
tn
ecre
P
0 200 400 600 800
Year of birth 1969
Old cohort
05
10
15
20
25
0 200 400 600 800
Year of birth 1974
Middle cohort
05
10
15
20
25
0 200 400 600 800
Year of birth 1979
Young cohort
17
CASE Network Studies & Analyses | No 482 (2016)
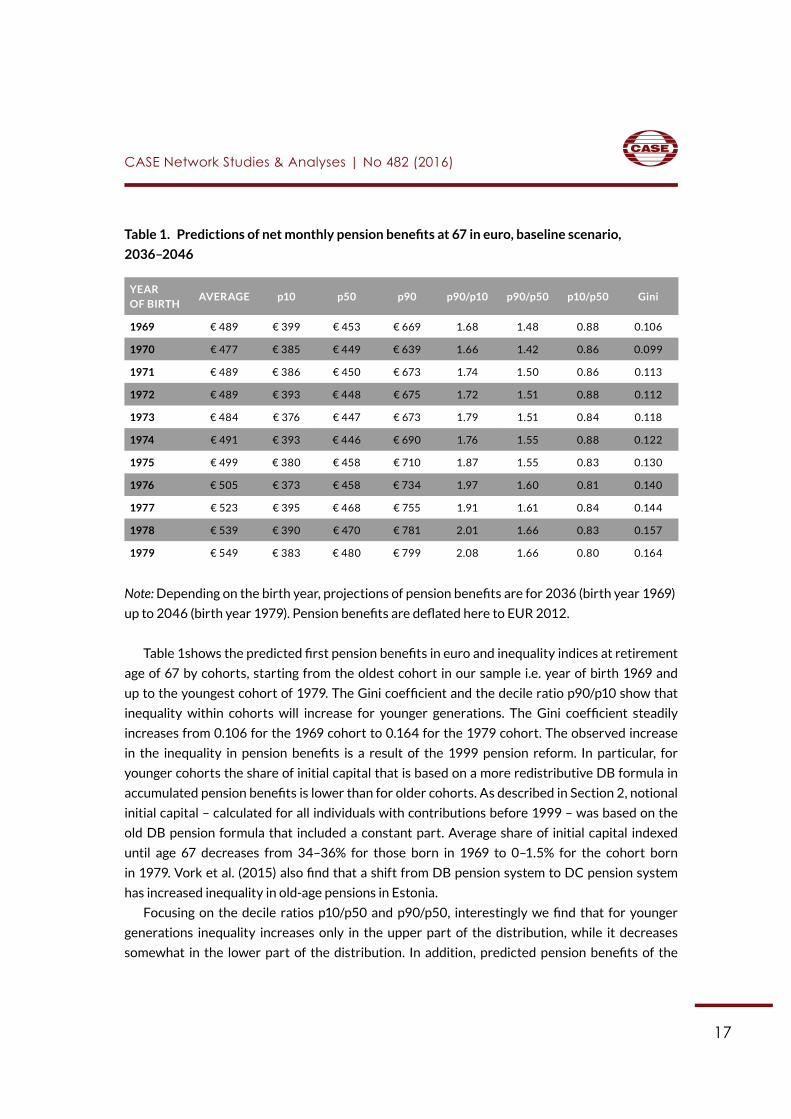
Table 1. Predictions of net monthly pension benefits at 67 in euro, baseline scenario,
2036–2046
Note: Depending on the birth year, projections of pension benefits are for 2036 (birth year 1969)
up to 2046 (birth year 1979). Pension benefits are deflated here to EUR 2012.
Table 1shows the predicted first pension benefits in euro and inequality indices at retirement
age of 67 by cohorts, starting from the oldest cohort in our sample i.e. year of birth 1969 and
up to the youngest cohort of 1979. The Gini coefficient and the decile ratio p90/p10 show that
inequality within cohorts will increase for younger generations. The Gini coefficient steadily
increases from 0.106 for the 1969 cohort to 0.164 for the 1979 cohort. The observed increase
in the inequality in pension benefits is a result of the 1999 pension reform. In particular, for
younger cohorts the share of initial capital that is based on a more redistributive DB formula in
accumulated pension benefits is lower than for older cohorts. As described in Section 2, notional
initial capital – calculated for all individuals with contributions before 1999 – was based on the
old DB pension formula that included a constant part. Average share of initial capital indexed
until age 67 decreases from 34–36% for those born in 1969 to 0–1.5% for the cohort born
in 1979. Vork et al. (2015) also find that a shift from DB pension system to DC pension system
has increased inequality in old-age pensions in Estonia.
Focusing on the decile ratios p10/p50 and p90/p50, interestingly we find that for younger
generations inequality increases only in the upper part of the distribution, while it decreases
somewhat in the lower part of the distribution. In addition, predicted pension benefits of the
YEAR OF BIRTH
AVERAGE p10 p50 p90 p90/p10 p90/p50 p10/p50 Gini
1969 € 489 € 399 € 453 € 669 1.68 1.48 0.88 0.106
1970 € 477 € 385 € 449 € 639 1.66 1.42 0.86 0.099
1971 € 489 € 386 € 450 € 673 1.74 1.50 0.86 0.113
1972 € 489 € 393 € 448 € 675 1.72 1.51 0.88 0.112
1973 € 484 € 376 € 447 € 673 1.79 1.51 0.84 0.118
1974 € 491 € 393 € 446 € 690 1.76 1.55 0.88 0.122
1975 € 499 € 380 € 458 € 710 1.87 1.55 0.83 0.130
1976 € 505 € 373 € 458 € 734 1.97 1.60 0.81 0.140
1977 € 523 € 395 € 468 € 755 1.91 1.61 0.84 0.144
1978 € 539 € 390 € 470 € 781 2.01 1.66 0.83 0.157
1979 € 549 € 383 € 480 € 799 2.08 1.66 0.80 0.164
18
CASE Network Studies & Analyses | No 482 (2016)
90th percentile are further away from the median of the distribution than the pension benefits
of the 10th percentile. P90/p50 equals to around 1.6 and ratio of 10th to 50th percentile is not
more than 0.8. From the policy perspective, increase in inequality only in the upper part of the
distribution as a result of the shift from DB to DC pension system is less worrying as it does not
contribute to relative poverty.
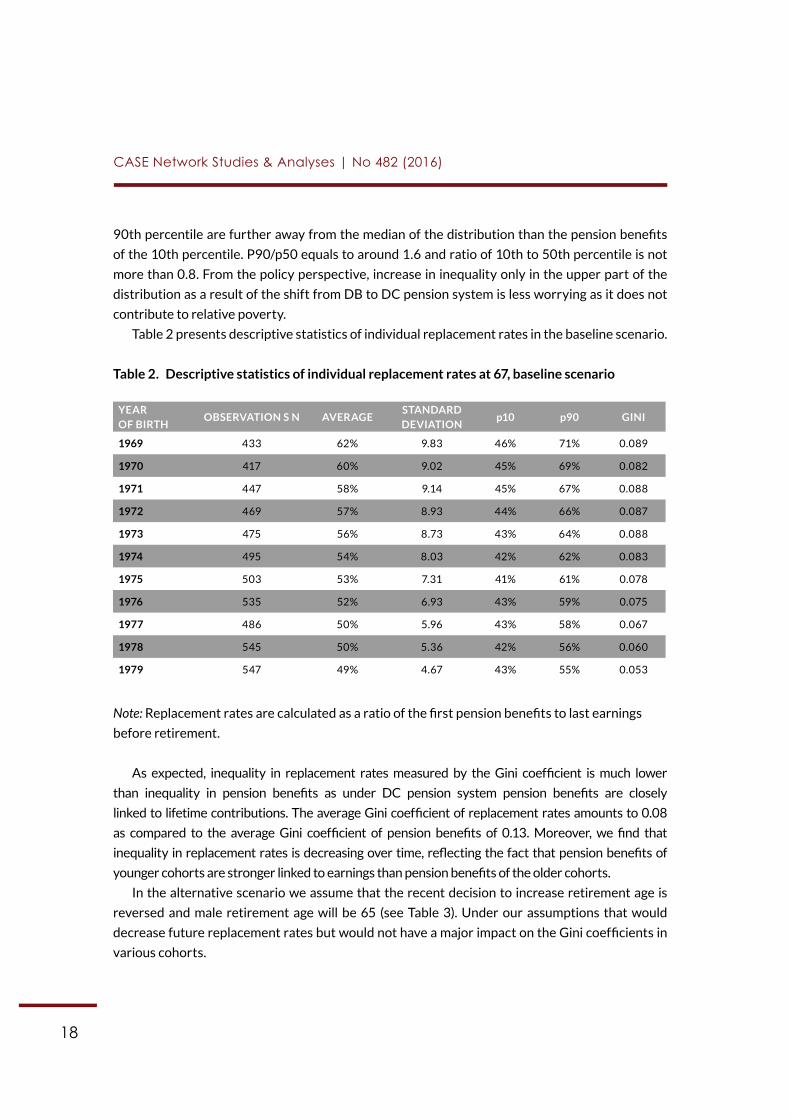
Table 2 presents descriptive statistics of individual replacement rates in the baseline scenario.
Table 2. Descriptive statistics of individual replacement rates at 67, baseline scenario
Note: Replacement rates are calculated as a ratio of the first pension benefits to last earnings
before retirement.
As expected, inequality in replacement rates measured by the Gini coefficient is much lower
than inequality in pension benefits as under DC pension system pension benefits are closely
linked to lifetime contributions. The average Gini coefficient of replacement rates amounts to 0.08
as compared to the average Gini coefficient of pension benefits of 0.13. Moreover, we find that
inequality in replacement rates is decreasing over time, reflecting the fact that pension benefits of
younger cohorts are stronger linked to earnings than pension benefits of the older cohorts.
In the alternative scenario we assume that the recent decision to increase retirement age is
reversed and male retirement age will be 65 (see Table 3). Under our assumptions that would
decrease future replacement rates but would not have a major impact on the Gini coefficients in
various cohorts.
YEAR OF BIRTH
OBSERVATION S N AVERAGESTANDARD DEVIATION
p10 p90 GINI
1969 433 62% 9.83 46% 71% 0.089
1970 417 60% 9.02 45% 69% 0.082
1971 447 58% 9.14 45% 67% 0.088
1972 469 57% 8.93 44% 66% 0.087
1973 475 56% 8.73 43% 64% 0.088
1974 495 54% 8.03 42% 62% 0.083
1975 503 53% 7.31 41% 61% 0.078
1976 535 52% 6.93 43% 59% 0.075
1977 486 50% 5.96 43% 58% 0.067
1978 545 50% 5.36 42% 56% 0.060
1979 547 49% 4.67 43% 55% 0.053
19
CASE Network Studies & Analyses | No 482 (2016)
Table 3. Descriptive statistics of individual replacement rates at 65, alternative scenario
Note: Replacement rates in the alternative scenario, where people retire at the age of 65.
The predicted median replacement rate at 65 amounts to 46. This is consistent with Lachows-
ka and Myck (2015) who predict median replacement rate for individuals of the same age at 449.
Average replacement rates are decreasing for younger cohorts mainly because of decreasing
replacement rates in the upper part of the distribution. This is due to lower projected benefits
but also to the fact that the Mincer equation predicts a decrease in wages for all people in their
60s so wage at 65 (the denominator in RR) is higher than at age 67.
Vulnerable groups
Who are the most vulnerable groups in Poland in terms of projected future pensions? Accord-
ing to the predictions, people with the lowest pension benefits are characterized by low wages
during their career, and consequently, by low contributions. Shorter tenure or temporary (but
short) breaks in social insurance are less important if a person paid high contributions in other
periods of professional life.
9 There are small differences between our predictions and Lachowska and Myck (2015). They predict replacement rates for
the head of households, with 68% of them are men, while we predict them for men (see Table 4 in Lachowska and Myck, 2015).
YEAR OF BIRTH
OBSERVATION S N AVERAGESTANDARD DEVIATION
p10 p90 GINI
1969 433 52% 8.10 39% 59% 0.087
1970 417 51% 7.44 38% 58% 0.081
1971 447 49% 7.52 37% 56% 0.087
1972 469 48% 7.34 37% 55% 0.086
1973 475 47% 7.17 36% 53% 0.086
1974 495 46% 6.59 35% 52% 0.081
1975 503 44% 5.98 36% 51% 0.076
1976 535 44% 5.64 36% 49% 0.073
1977 486 42% 4.82 37% 48% 0.065
1978 545 42% 4.30 36% 47% 0.058
1979 547 41% 3.70 36% 46% 0.050
20
CASE Network Studies & Analyses | No 482 (2016)
Table 4 below shows the structure of education in the whole sample and in the lowest
decile (p10) of the first pension distribution. As our estimations of age-earning profiles indicate,
longer education is generally linked to higher wages at all ages and that results in higher
pension benefits in the DC system. Those with pensions below the 10th percentile will probably have
primary, lower secondary or basic vocational education. The negative impact of shorter
education on predicted pension benefits is observed in each cohort of men born in years
1969–1979.
Table 4. Structure of education in the whole sample and 10th decile of the pension
distribution
Another factor that drives low predicted pension benefits are low average wages in some
Polish regions (voivodships). Over 40% of future retirees from less developed regions with
relatively low wages, e.g. Eastern Poland, will be in the 10th decile of the whole pension
distribution, while almost all retirees living in most developed regions, e.g. Mazovia region
with the capital Warsaw, will be above the 10th decile. Of course standards of living of the
elderly should be adjusted to the costs of living (usually slightly lower in poorer regions) but
those with lower pensions can be more at-risk-of-poverty, especially when living alone in
retirement.
As we only analyse men with income from permanent work due to data restrictions (see
Section 3, data and the sample), we do not account for vulnerable groups that include people
FREQUENCY %
whole sample
Incomplete primary, primary and lower secondary 111 2
Basic vocational 1835 38
Upper secondary general 316 7
Upper secondary vocational 71 2
Post-secondary 1213 25
Tertiary 1268 26
Total 4814 100
in 10th decile
Incomplete primary, primary and lower secondary 251 47
Basic vocational 287 53
Total 538 100
21
CASE Network Studies & Analyses | No 482 (2016)
on temporary work, short tenure and on contracts under civil law10. Previous studies for Poland
(see e.g. Chłoń-Domińczak and Strzelecki 2013) show that groups with short tenure and career
breaks will be at higher risk of falling below poverty line in retirement. Lewandowski et al. (2015)
estimate that pension benefits for workers on contracts under civil law can be lower by 17%
than in the case of standard employment contracts. Long periods on temporary contracts
would negatively influence adequacy of future pensions in the Polish DC pension system.
10 Contracts under civil law stipulate low or zero contributions.
22
CASE Working Paper | No 1 (2015)
To check sensitivity of our results to assumptions we compare the distribution of simulated
old- age pensions in the baseline scenario (with retirement at age 67) to scenarios with lower/
higher rate of return, longer life expectancy and no-unemployment scenario.
First, we change the real rate of return in FDC and real annual indexation of accumulated
pension capital in NDC from 2 percent to 1 percent (lower rate of return) and to 3 percent
(higher rate of return). As we assumed the same rate of return in the funded and unfunded parts
of the Polish pension system (see Section 3), changes in the rate of return will have an impact
on the level of future pensions and replacement rates but not on predicted inequality of
pensions measured by the Gini index (see Table 5).
Table 5. Gini index of pension benefits in different scenarios, whole sample and selected
cohorts
Second, we increase life expectancy at 67 by 12 month from the current 236 months for those
retiring in year 2036 (cohort born in 1969) and 254 months for retiring in 2046. Longer life ex-
pectancy results in a decrease in absolute benefits but no impact on pension inequality. Third,
we drop our assumption of being unemployed with probability of the average unemployment
rate in the economy and instead assume no unemployment. We find that this assumption has the
strongest impact on the predicted results. In particular, without unemployment the expected
5. Sensitivity of results
BASELINELOWER RATE OF RETURN
HIGHER RATE OF RETURN
LONGER LE NO UNEMPLOYMENT
whole sample 0.133 0.132 0.132 0.133 0.124
old cohort − year of birth 1969
0.119 0.106 0.106 0.106 0.101
middle cohort − year of birth 1974
0.128 0.122 0.122 0.122 0.114
young cohort − year of birth 1979
0.165 0.164 0.164 0.164 0.150

23
CASE Network Studies & Analyses | No 482 (2016)
inequality in pension benefits decreases substantially for the whole sample and for all cohorts
which is due to relatively longer contributory periods for lower educated individuals than in
the baseline scenario. Thus, unemployment in our simulation model contributes significantly
to the observed inequality in pension benefits.
24
CASE Working Paper | No 1 (2015)
This paper analyses the intragenerational distributional effects of the Polish pension reform.
As an old-age pension from the obligatory system is the most important source of income in
elderly households it is important to simulate distribution in both absolute levels of pensions
and replacement rates.
Apart from a projected decrease in pensions or replacement rate, predicted by many previous
studies, we found that inequality of predicted first pension benefits will increase within younger
cohorts as pension capital from accumulated contributions will have a higher share in pension
benefits and pension capital from the initial capital (based on a more generous old DB formula)
will be less important. On the other hand, inequality in replacements rates will decrease due to
a stronger link between contributions and pensions. The sensitivity analysis suggests that
unemployment in our simulation model contributes significantly to the observed inequality in
pension benefits.
When interpreting results one has to remember that we simulate pension benefits for a part
of the population, i.e. men retiring according to the post reform regulations. That means omitting
women with more career breaks and lower wages, as well as pensions of miners and armed servic-
es that retire according to more generous pension formulas. Adding these groups to the analysis
would probably increase intragenerational inequality.
Our results show that policy makers should try to identify potentially vulnerable groups of
people (i.e. with low expected future pensions) in every cohort and implement policies that allow
individuals for accumulating enough pension capital to have adequate pension income in future.
6. Conclusions and discussion

25
CBOS (2012). Nadal nieprzekonani – Polacy o podniesieniu wieku emerytalnego, in Polish,
com. BS/57/2012, Warsaw. http://www.cbos.pl/SPISKOM.POL/2012/K_057_12.PDF.
Chłoń-Domińczak, A. and P. Strzelecki (2013). The minimum pension as an instrument of
poverty protection in the defined contribution pension system – an example of Poland, Journal
of Pension Economics and Finance 12, 03, 326–350.
Égert, B (2013). The impact of changes in second pension pillars on public finances in Central and
Eastern Europe: The case of Poland, Economic Systems, Elsevier, vol. 37(3), pages 473–491.
Ervik, R. and Lindén, T.S. (ed.) (2013). The Making of Ageing Policy: Theory and Practice in Europe.
Edward Elgar Publishing.
European Commission (2012). Pension Adequacy in the European Union 2010–2050, Report
prepared jointly by the Directorate-General for Employment, Social Affairs and Inclusion of the
European Commission and the Social Protection Committee, European Union.
Heckman, J, Lochner, L., and P. Todd (2003). Fifty Years of Mincer Earnings Regressions, NBER
Working Paper No. 9732, NBER.
Jablonowski, J. and C. Muller (2013). 3 sides of 1 coin – Long- ‐term fiscal stability, adequacy and
intergeneraEonal redistribuEons of the reformed old- ‐age pension system in Poland, NBP
Working paper No. 145, Warsaw.
Knoef, M., Alessie, R. and A. Kalwij (2013). Changes in the Income DistribuEon of the Dutch Elder-ly between 1989 and 2020: a Dynamic MicrosimulaEon, The Review of Income and Wealth, vol. 59(3), pages 460–485, September 2013.
Lachowska, M. and M. Myck (2015). The Effect of Public Pension Wealth on Saving and
Expenditure, IZA Discussion Papers 8895, Institute for the Study of Labor (IZA).
References
26
CASE Network Studies & Analyses | No 482 (2016)
Leifels A., C. Müller and B. Raffelhüschen (2010). Mind the pension gap. On the relationship between future pensions and pre-retirement consumption in Poland, Working paper of the Study of the Research Center for Generational Contracts.
Lemieux, T. (2006). The “Mincer Equation” Thirty Years After Schooling, Experience, and Earn-
ings. In: Grossbard, S. (Ed.). Jacob Mincer A Pioneer of Modern Labor Economics, Springer
International Publishing AG.
Lewandowski, P., Stronski, K. and Keister R. (2015). “Labour market segmentation and pen-
sions in the Polish defined-contribution scheme,” IBS Working Papers 9/2015, Instytut Badan
Strukturalnych.
Määttänen N., Võrk A., Piirits M., Gal R., Jarocinska, E., Ruzik-Sierdzińska, A., and T. Nijman
(2014). The Impact of Living and Working Longer on Pension Income in Five European
Countries, Netspar Discussion paper DP 08/ 2014–036.
OECD (2013), Pensions at a Glance 2013, Paris: OECD.
Queisser, M. and E. Whitehouse (2006). Neutral or Fair? Actuarial concepts and pension-system
design, OECD Social, Employment and Migration Working Papers 40, OECD.
Van Vliet, O., Been, J., Caminada, K., and K. Goudswaard (2012). Pension Reform and Income
Inequality among Older People in 15 European Countries. International Journal of Social Welfare
21: S8–29.
Vork, A., Piirits, M., and E. Jõgi (2015). The impact of introducEon of funded pension scheme
on intrageneraEonal inequality in Estonia: a cohort based analysis, Praxis Center for Policy
Studies, Estonia, mimeo.World Bank (2014). Poland: Saving for Growth and Prosperous Aging,
Country Economic Memorandum, June.

27
Additional assumptions for the baseline scenario include:
• In the future individual real wages will grow at the rate of the average wage growth in the
economy. In the base scenario we assume 2% annual real average wage growth since 2014.
• For calculation of contributions, we also need information on individual earnings before
2012. Some men in our sample paid their contributions during 25 years. We assume that
previous individual earnings change according to estimated age-earnings profiles.
• Earnings in the PHBS are reported net of taxes and Social Security contributions.
We gross up the net earnings to include taxes and social security contributions. For that,
we assume that social security contributions rates and personal income tax rates in the
future are the same as in 2012.
• To take into account unemployment, we assume that every person is unemployed and
does not pay his contributions with the probability equal to the average unemploy-
ment rate from years 2005–2014 for men with the same education level as a man in the
sample. In this period average unemployment rates varied from 19.2 percent for the
shortest education (i.e. category 1: incomplete primary, primary and lower secondary
education) to 4.5 percent for tertiary education. Thus, we account for the average expected
unemployment by education in a business cycle but disregard persistence in unemploy-
ment. We assume that unemployment is a period without contributing to the pension
system11.
• We assume that every person in our sample starts working just after completing his/
her formal education. For older cohorts that worked before 1999 we need to estimate
the initial capital (see section 2). We calculate the initial capital according to the formula
discussed in section 2.
• The rate of return and indexation of funds in the accumulation phase and the benefit
formula are the same as in the current Polish pension system. As we do not know how
many people decided to stop paying contributions to open pension funds we assume
11 In Poland contributions are paid on unemployment benefits but less than 20 percent of the unemployed are entitled to such
benefits.
Appendix: Pension benefit projections

28
CASE Network Studies & Analyses | No 482 (2016)
that real annual indexation of accumulated pension capital in NDC pillar and the rate of
return in FDC will be the same and in the base scenario equal to 2%. For years 1999–2013
we take the actual indexation (see information on ZUS website).
• Future unisex life expectancy at age 67 was calculated on the basis of EUROPOP2010
projections of life expectancies at 65 (Eurostat database). That resulted in 0.73% growth
in LE at 67 every year starting from actual 201.1 months for 2014.
• For simplicity, we assume that people retire on 1st January of the year when they turn 67.
We do not allow for partial pension benefits at age 65.