Embed Size (px)
Citation preview

簡報製作範例
商業簡報網 / 韓明文
www.pook.com.tw

簡報文字製作範例

自發性等於盡可能有無止境的練習 -彼德.杜拉克

要達到完美境界,不是做到無法再
附加其他元素,而是沒有任何東西
可被刪除
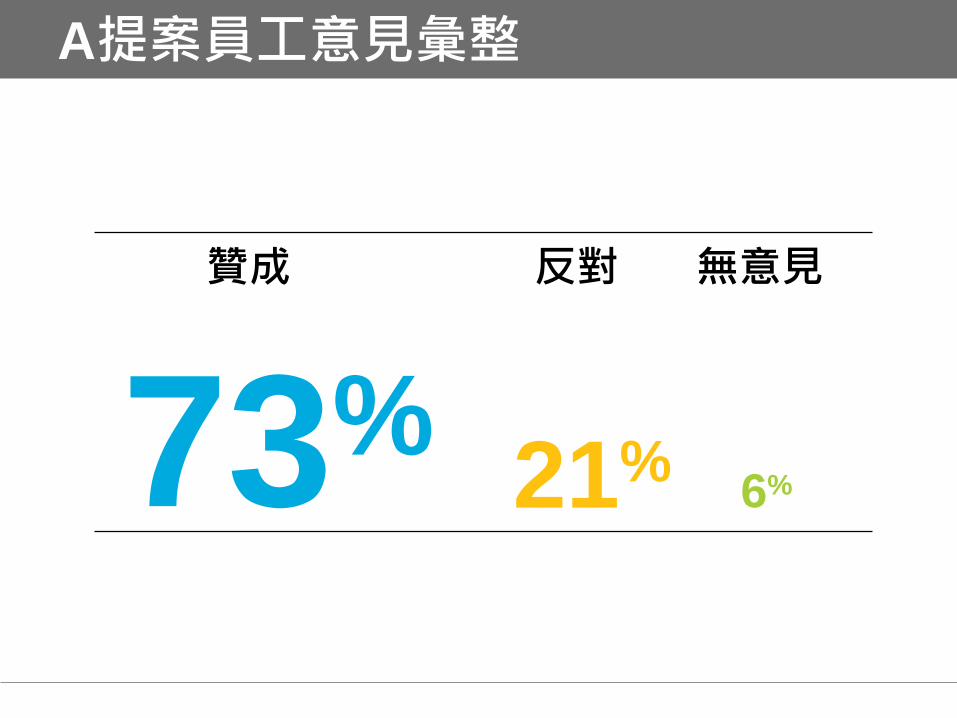
A提案員工意見彙整
73% 21%
6%
贊成 反對 無意見
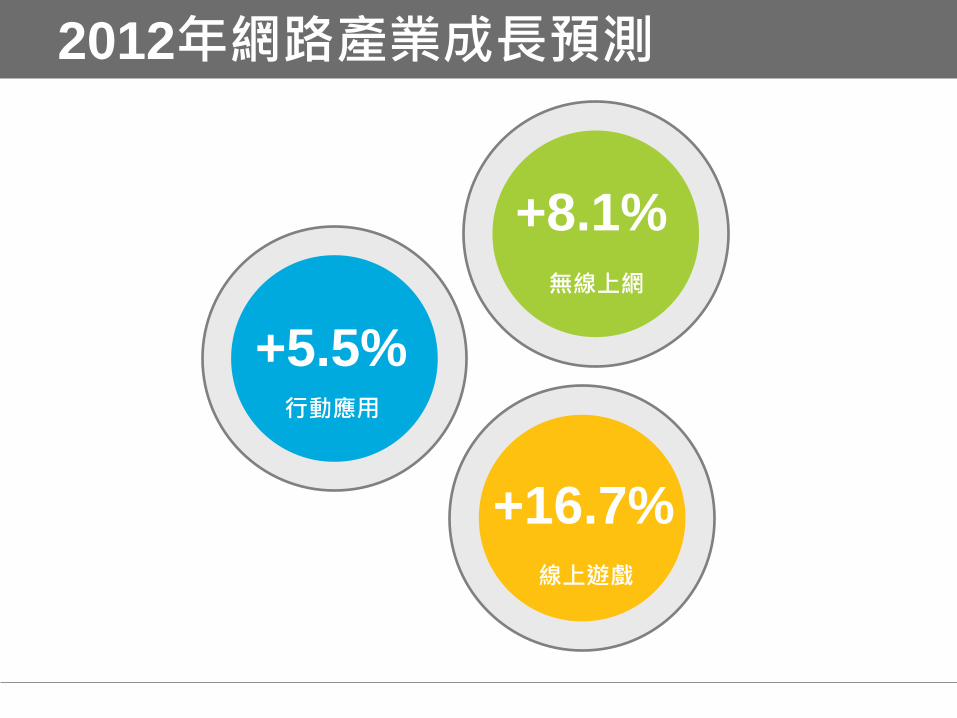
2012年網路產業成長預測
+5.5%
+8.1%
+16.7%
行動應用
無線上網
線上遊戲

圖解製作範例

團 隊 蛻 變 創 意

Plan Do
Action Check
管理的循環模式
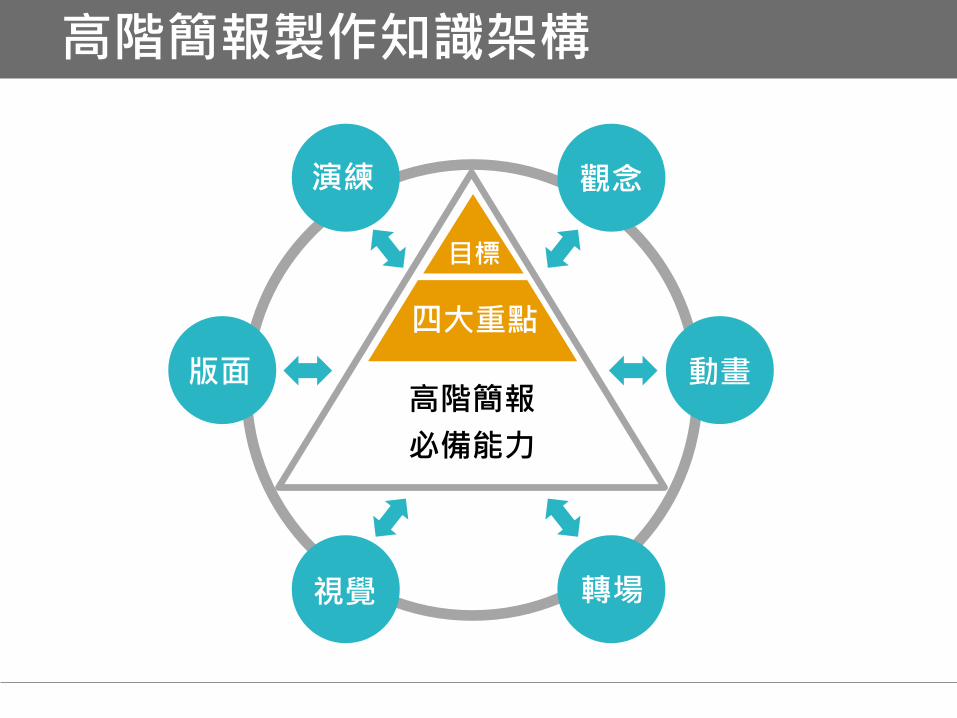
演練 觀念
視覺 轉場
版面 動畫
目標
四大重點
高階簡報
必備能力
高階簡報製作知識架構
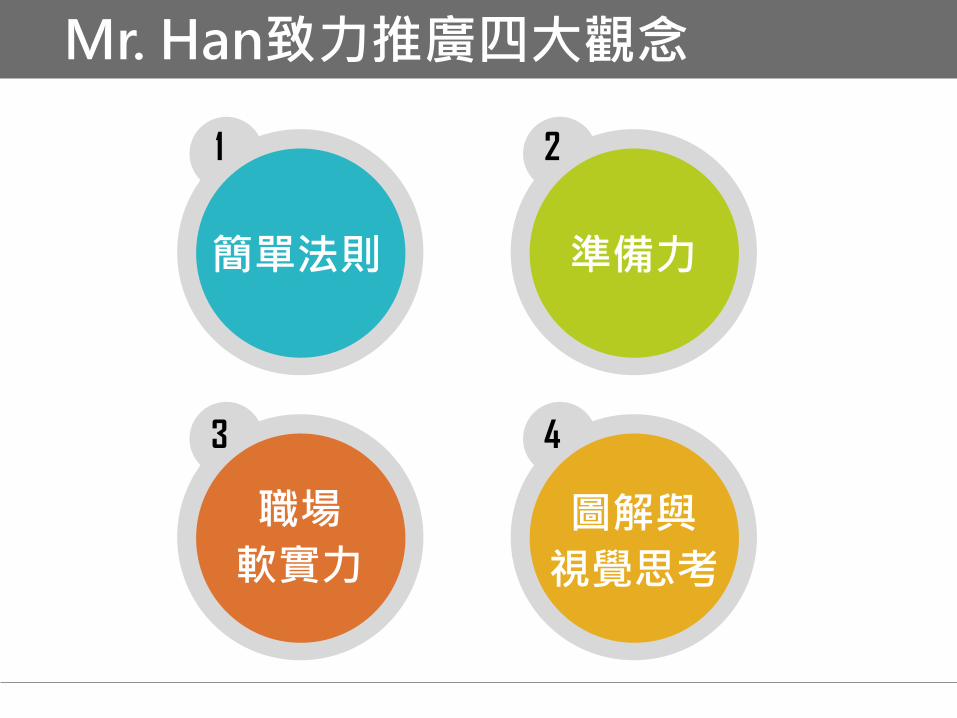
Mr. Han致力推廣四大觀念
1 2
3 4
簡單法則 準備力
職場
軟實力 圖解與
視覺思考
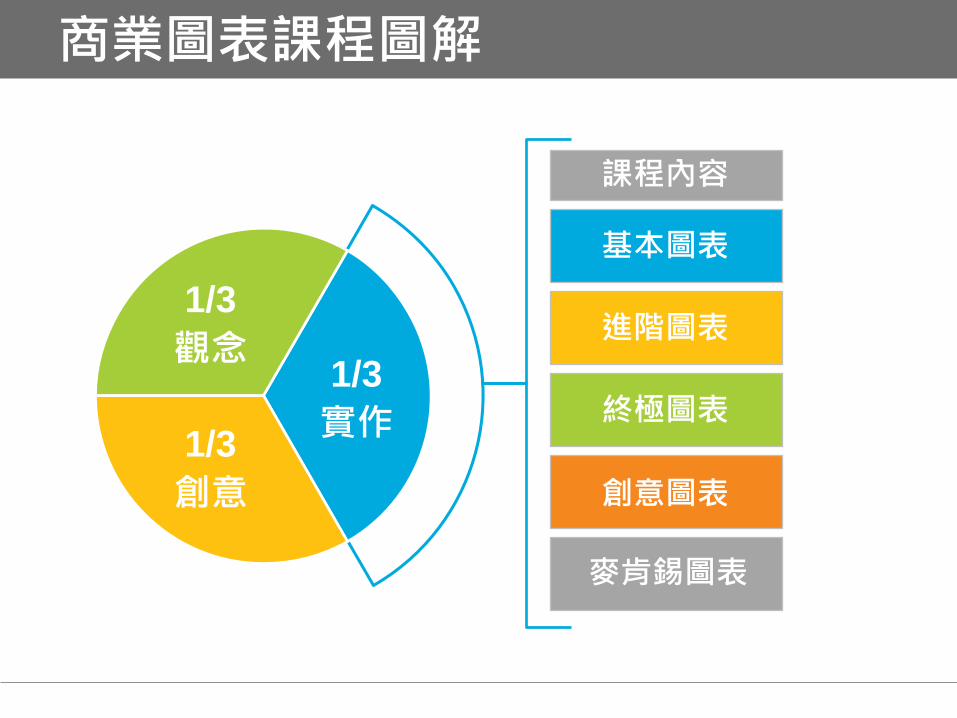
商業圖表課程圖解
1/3
實作
1/3
觀念
1/3
創意
課程內容
基本圖表
進階圖表
終極圖表
創意圖表
麥肯錫圖表

表格製作範例
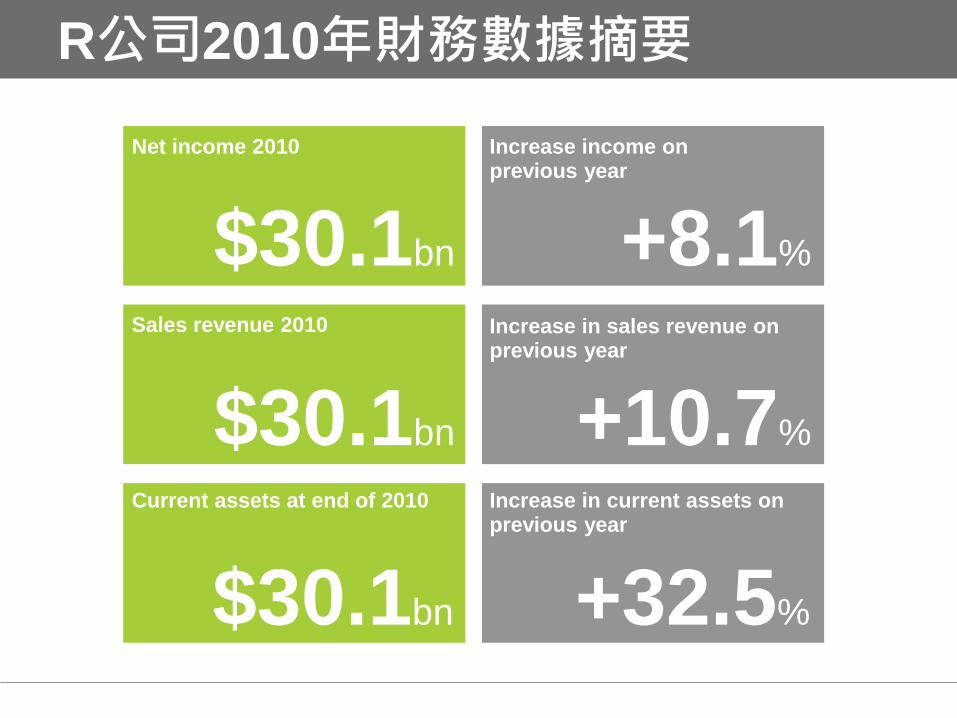
R公司2010年財務數據摘要
Net income 2010
$30.1bn
Sales revenue 2010
$30.1bn
Current assets at end of 2010
$30.1bn
Increase income on previous year
Increase in current assets on previous year
+8.1%
+10.7%
+32.5%
Increase in sales revenue on previous year
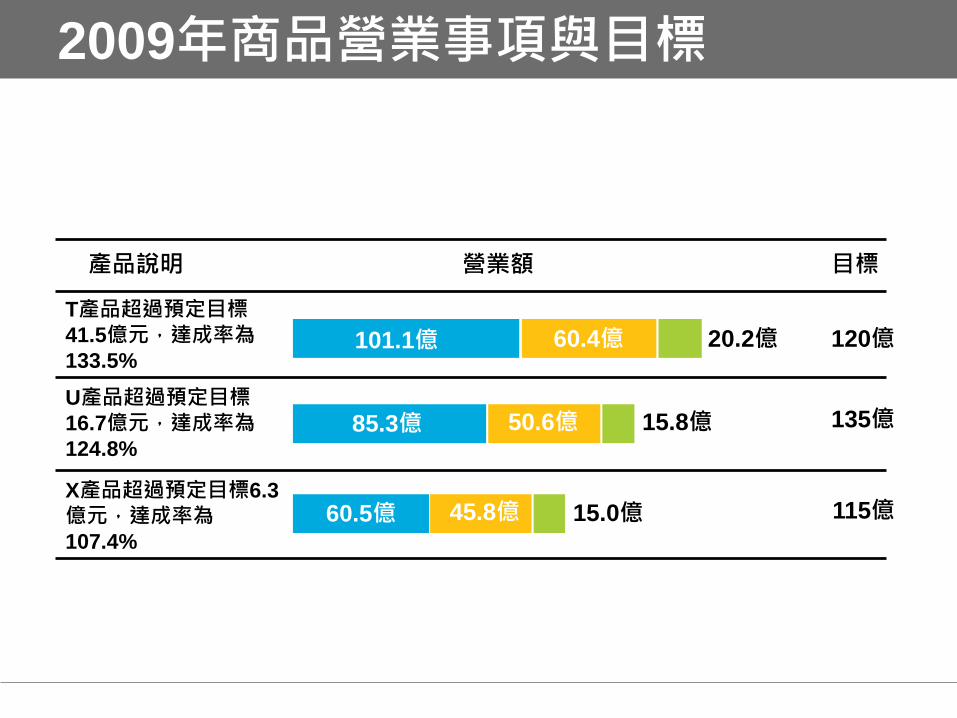
2009年商品營業事項與目標
101.1億
85.3億
60.5億
60.4億
50.6億
45.8億
目標 營業額
20.2億
15.8億
15.0億
120億
135億
115億
產品說明
T產品超過預定目標41.5億元,達成率為133.5%
U產品超過預定目標16.7億元,達成率為124.8%
X產品超過預定目標6.3
億元,達成率為107.4%
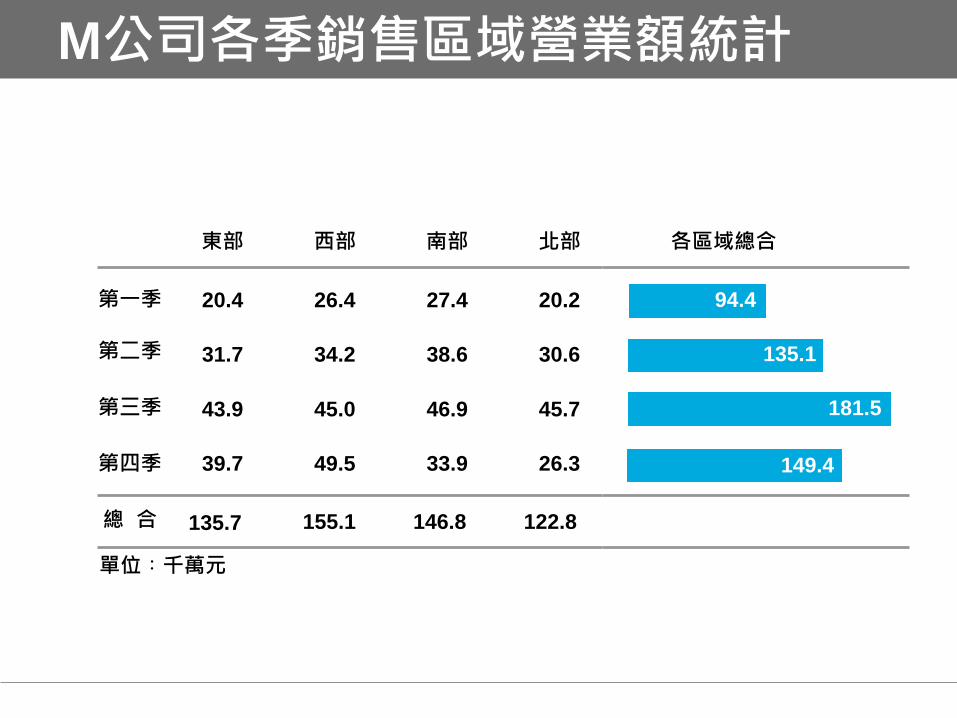
M公司各季銷售區域營業額統計
單位︰千萬元
東部 西部 南部 北部
20.4 26.4 27.4 20.2
31.7 34.2 38.6 30.6
43.9 45.0 46.9 45.7
39.7 49.5 33.9 26.3
135.7 155.1 146.8 122.8
第一季
第二季
第三季
第四季
總 合
94.4
135.1
181.5
149.4
各區域總合
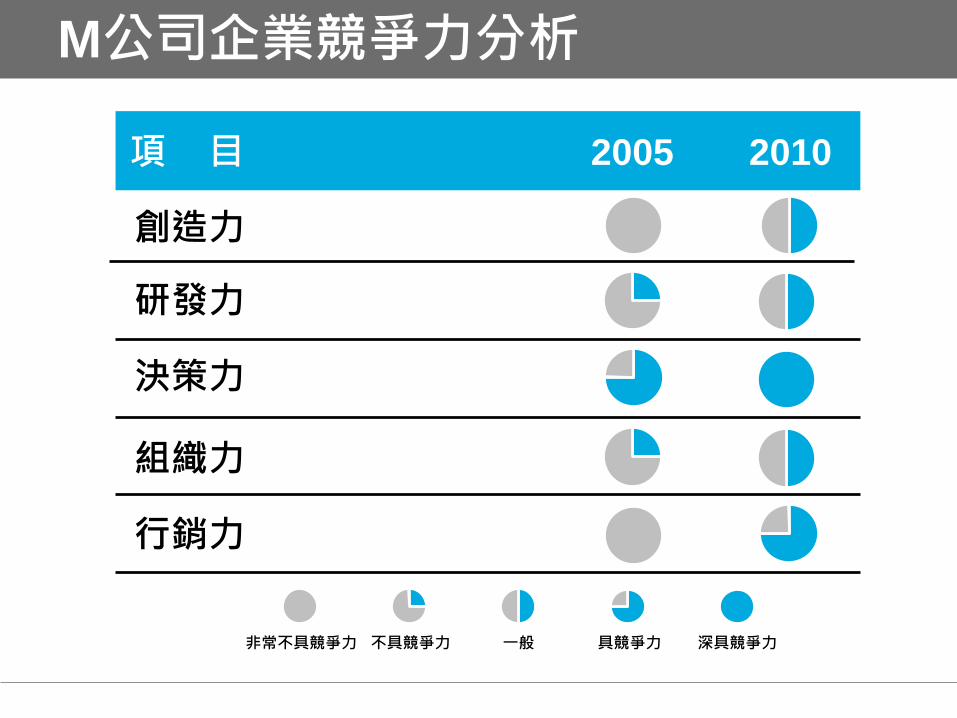
M公司企業競爭力分析
項 目 2005 2010
創造力
研發力
決策力
組織力
行銷力
深具競爭力 具競爭力 一般 不具競爭力 非常不具競爭力

圖表製作範例
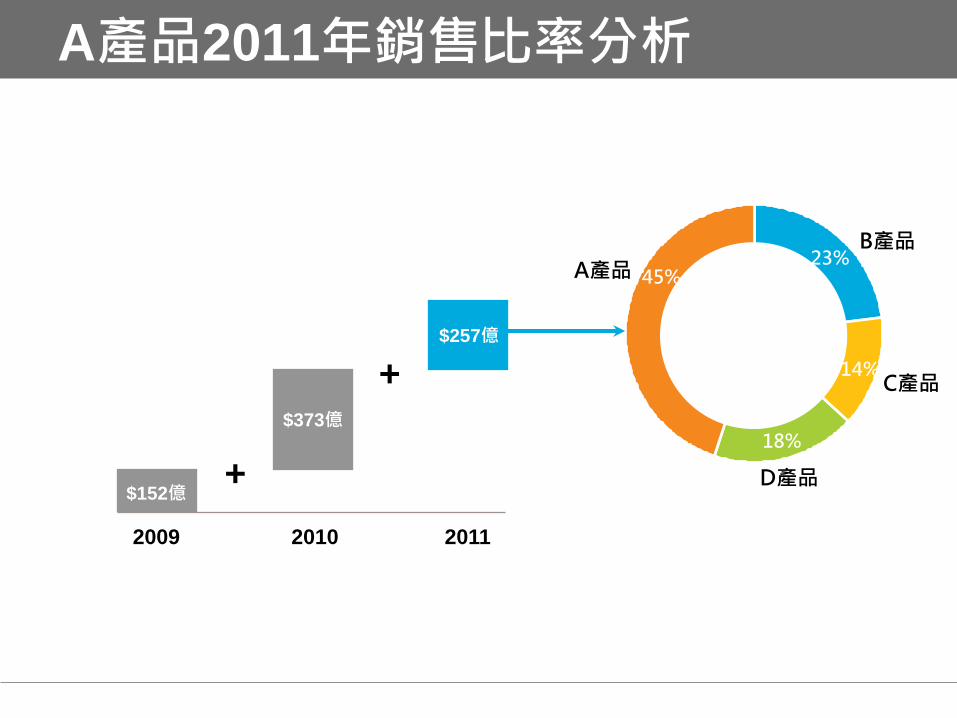
A產品2011年銷售比率分析
$152億
$373億
$257億
2009 2010 2011
+
+
23%
14%
18%
45% A產品
B產品
C產品
D產品
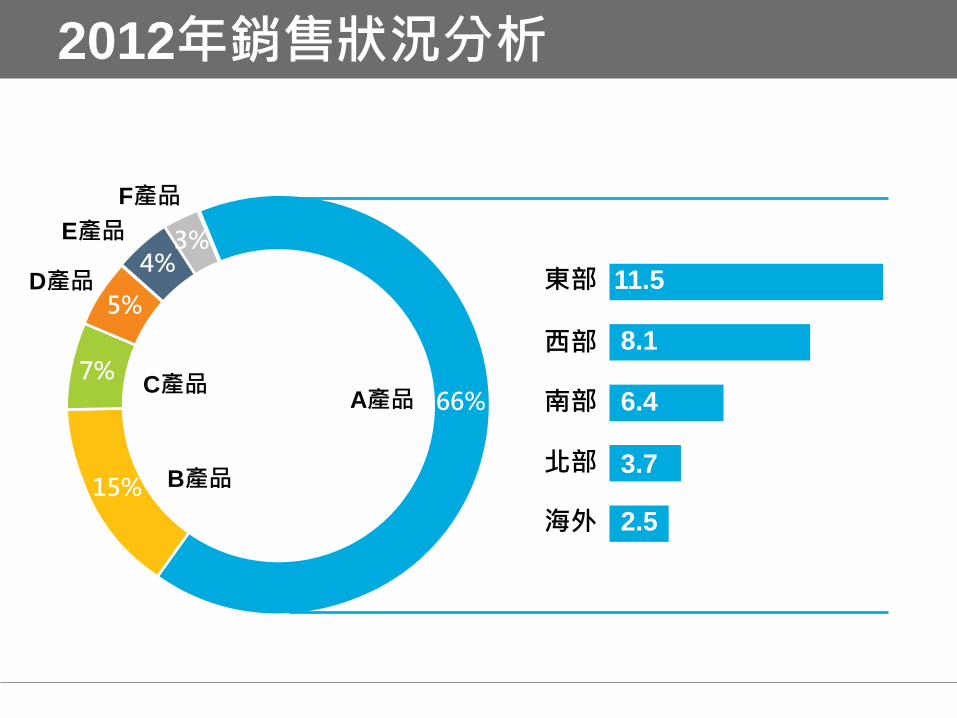
2012年銷售狀況分析
66%
4%
5%
7%
15%
3%
A產品
B產品
C產品
D產品
E產品
F產品
東部
西部
南部
北部
海外
11.5
8.1
6.4
3.7
2.5
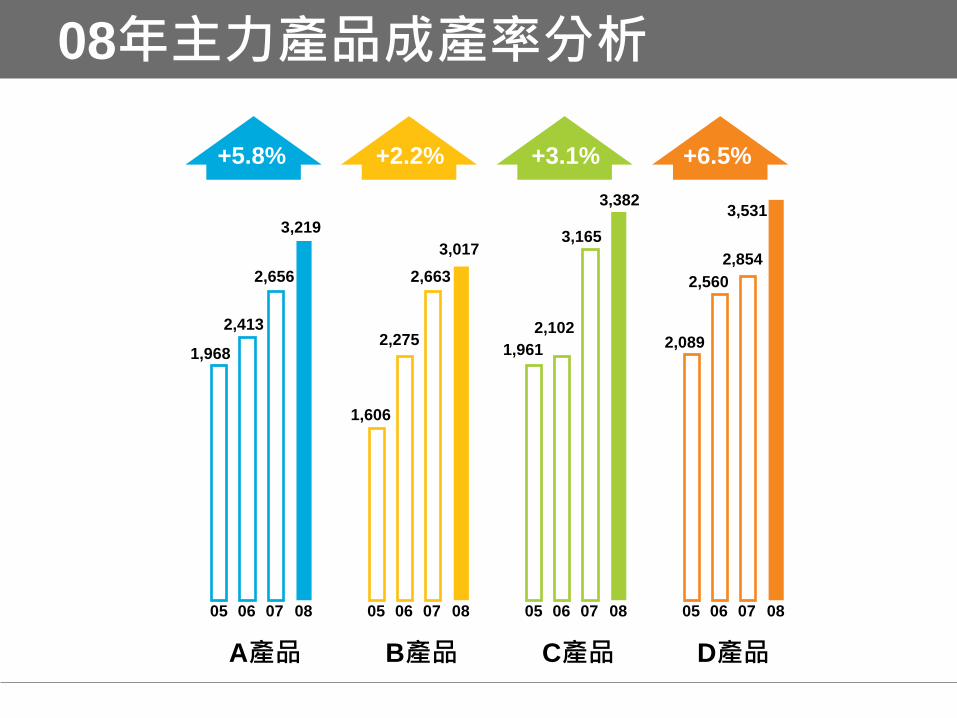
08年主力產品成產率分析
+5.8% +2.2% +3.1% +6.5%
05 06 07 08 05 06 07 08 05 06 07 08 05 06 07 08
3,531
2,854
2,560
2,089 2,102
1,961
3,165
3,382
3,017
2,663
2,275
1,606
3,219
2,656
2,413
1,968
A產品 B產品 C產品 D產品
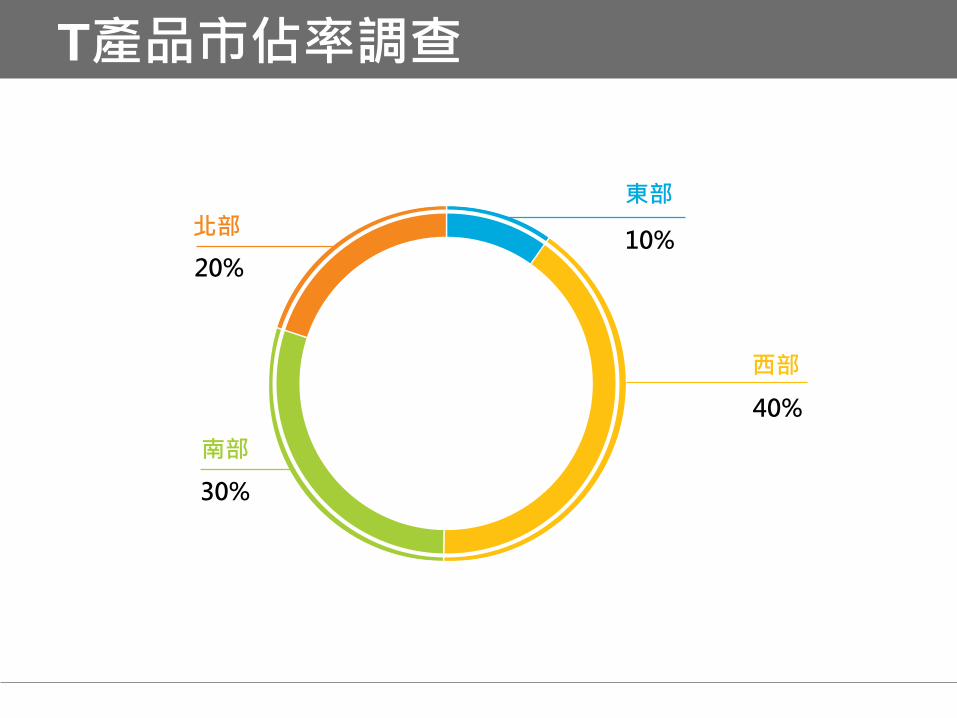
T產品市佔率調查
40%
10%
30%
20%
東部
西部
南部
北部
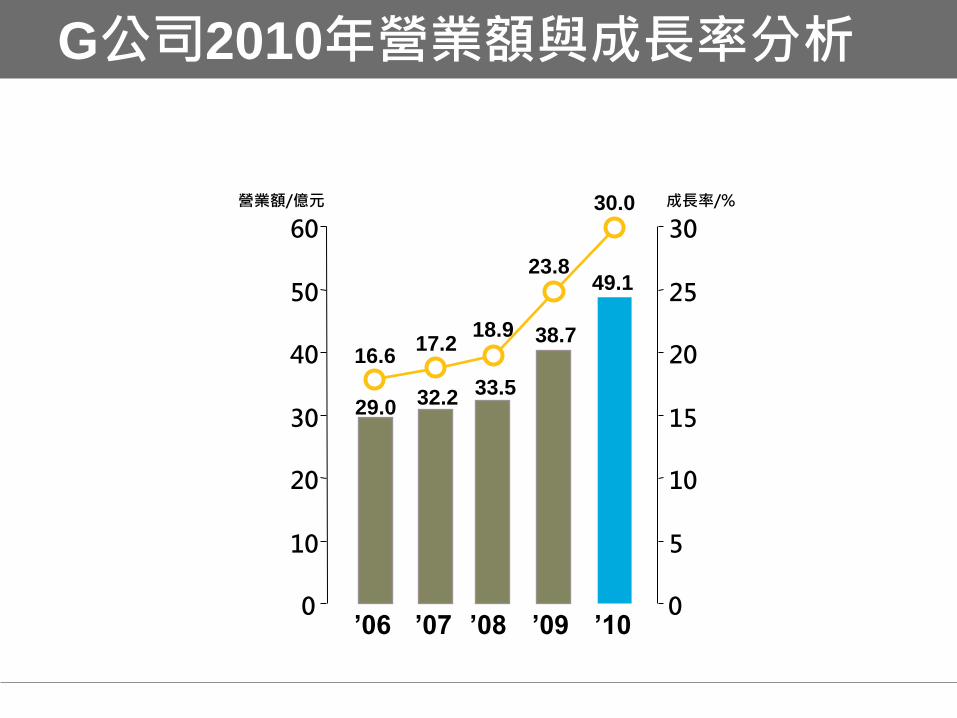
G公司2010年營業額與成長率分析
29.0 32.2
33.5
38.7
49.1 23.8
30.0
18.9 17.2
16.6
’06 ’07 ’08 ’09 ’10 0
10
20
30
40
50
60
營業額/億元
0
5
10
15
20
25
30
成長率/%
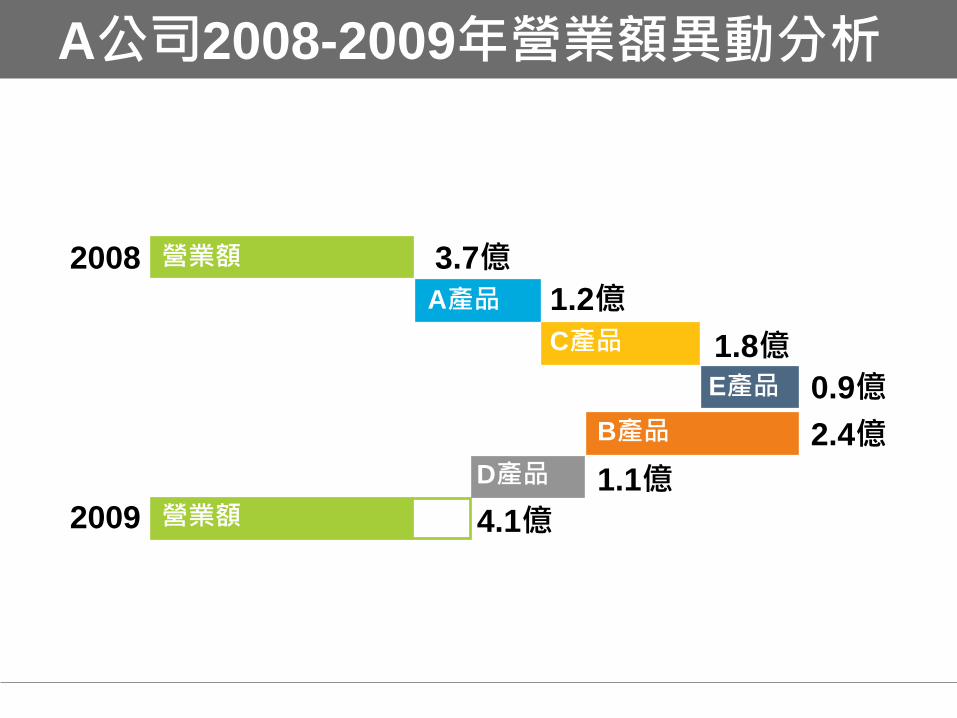
A公司2008-2009年營業額異動分析
2008 3.7億 營業額
A產品 1.2億
1.8億 C產品
E產品 0.9億
B產品 2.4億
4.1億 2009 營業額
D產品 1.1億
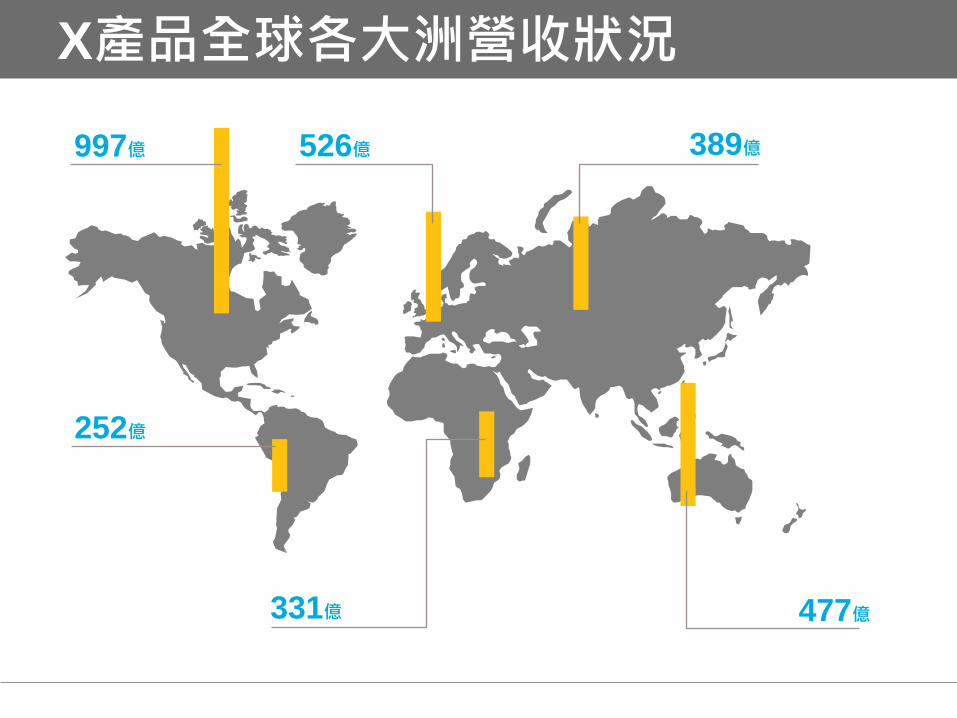
中南美洲
252億
北美
997億
非洲
331億
西歐
526億
澳洲
477億
亞洲
389億
X產品全球各大洲營收狀況
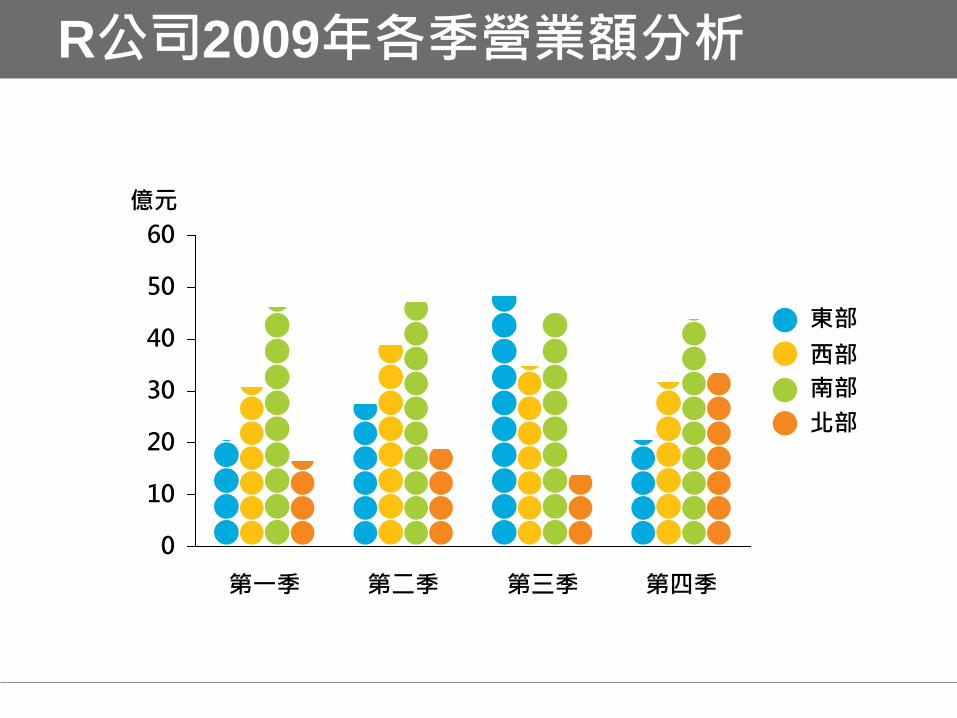
R公司2009年各季營業額分析
0
10
20
30
40
50
60
第一季 第二季 第三季 第四季
東部
西部
南部
北部
億元
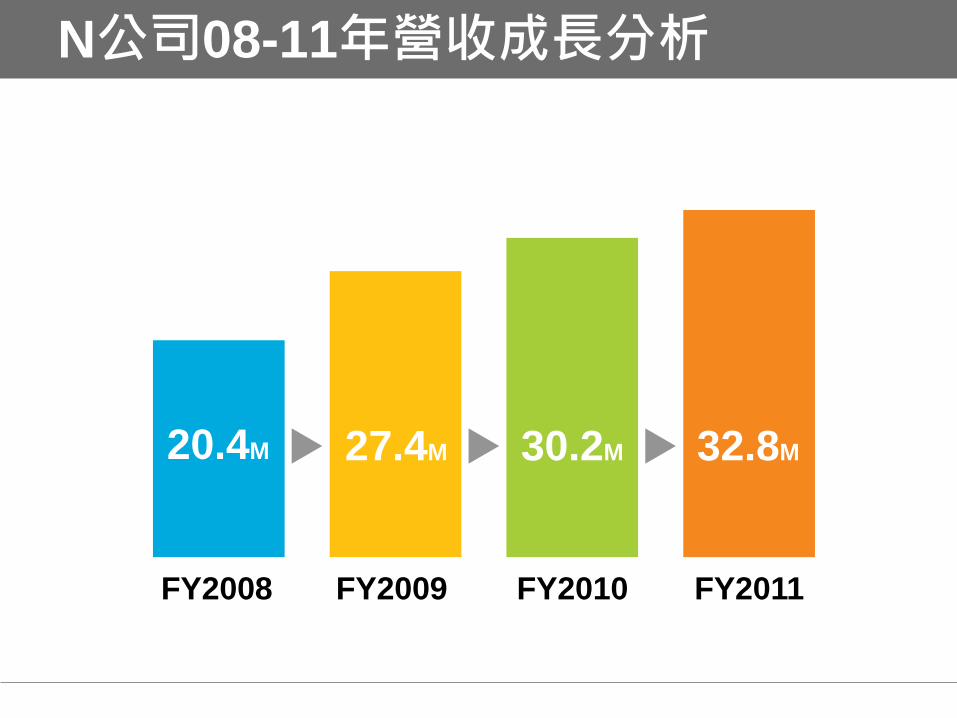
N公司08-11年營收成長分析
20.4M
FY2008
30.2M
FY2010
32.8M
FY2011 FY2009
27.4M
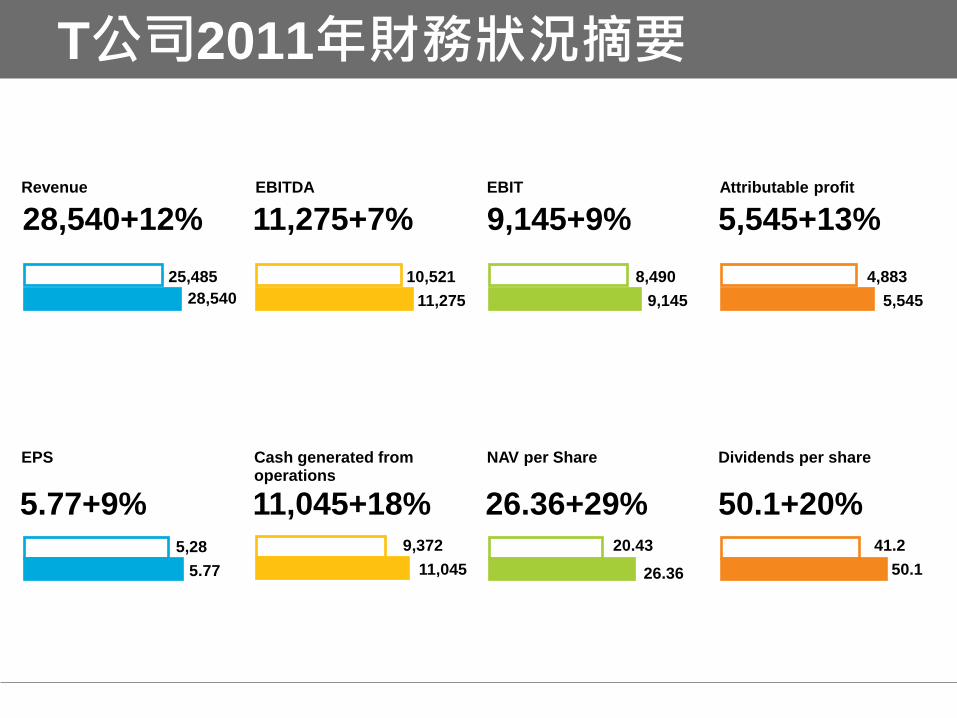
T公司2011年財務狀況摘要
25,485
28,540
28,540+12%
10,521
11,275
11,275+7%
8,490
9,145
9,145+9%
4,883
5,545
5,545+13%
5,28
5.77
5.77+9% 9,372
11,045
11,045+18% 26.36+29% 20.43
26.36
50.1+20% 41.2
50.1
Revenue EBITDA EBIT
EPS Cash generated from operations
NAV per Share Dividends per share
Attributable profit

韓明文
商業簡報網站長
暢銷書作者
專職簡報企管講師
500大企業指定簡報講師
鼎新電腦知識學院特聘講師
信瑞企管特聘講師
講師簡介

簡報製作原則
邏輯性簡報建構法
商業簡報KPI
商業簡報整合技巧
STP技術性簡報法
高階簡報製作
商業圖表活用術
商業圖解技巧
企劃2.0
課程內容