Embed Size (px)
Citation preview
Basic Accounting ACC30205
NAME : NGIENG TIEN YUNG (0320221) TERENCE TAN PENG ONG (0320275) TAN MING HOWE (0320199) ASSIGNMENT : FINANCIAL RATIO ANALYSIS COMPANY NAME : NIKE LECTURER : MR. CHANG JAU HO
Table of content
1. History of NIKE
2. Recent development
3. Profitability ratio
4. Stability ratio
5. Price earning ratio
6. Investment recommendation
7. Appendix
8. References
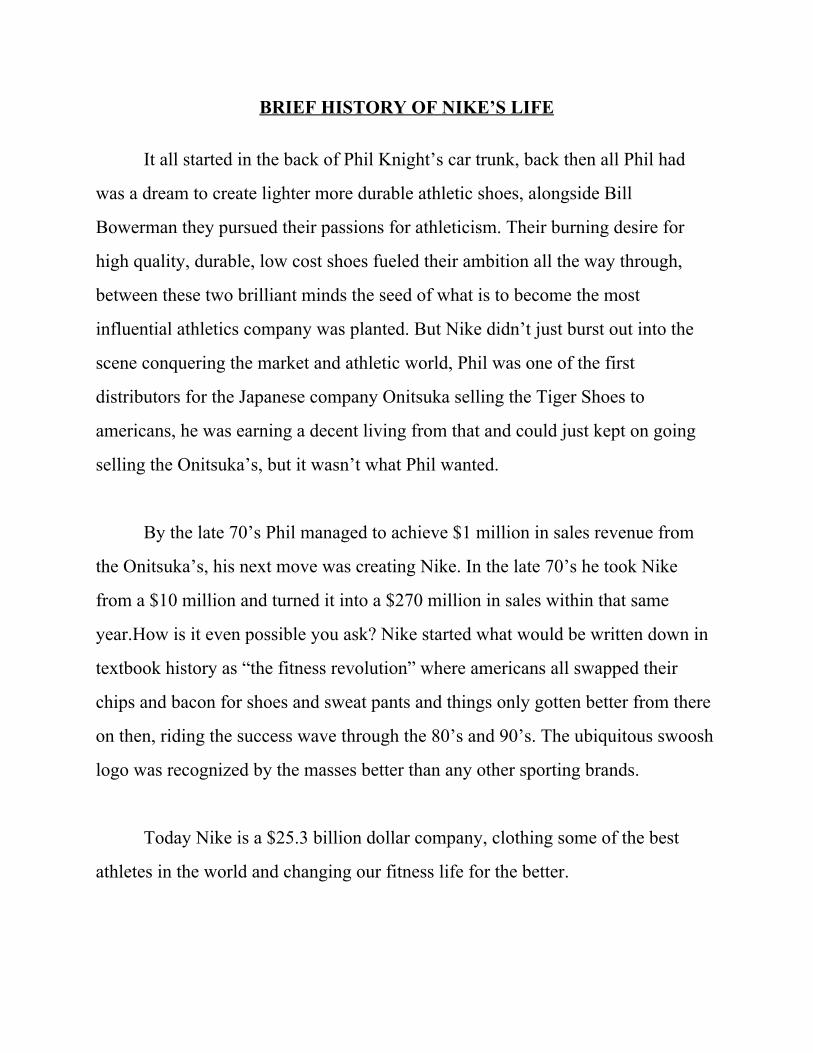
BRIEF HISTORY OF NIKE’S LIFE
It all started in the back of Phil Knight’s car trunk, back then all Phil had
was a dream to create lighter more durable athletic shoes, alongside Bill
Bowerman they pursued their passions for athleticism. Their burning desire for
high quality, durable, low cost shoes fueled their ambition all the way through,
between these two brilliant minds the seed of what is to become the most
influential athletics company was planted. But Nike didn’t just burst out into the
scene conquering the market and athletic world, Phil was one of the first
distributors for the Japanese company Onitsuka selling the Tiger Shoes to
americans, he was earning a decent living from that and could just kept on going
selling the Onitsuka’s, but it wasn’t what Phil wanted.
By the late 70’s Phil managed to achieve $1 million in sales revenue from
the Onitsuka’s, his next move was creating Nike. In the late 70’s he took Nike
from a $10 million and turned it into a $270 million in sales within that same
year.How is it even possible you ask? Nike started what would be written down in
textbook history as “the fitness revolution” where americans all swapped their
chips and bacon for shoes and sweat pants and things only gotten better from there
on then, riding the success wave through the 80’s and 90’s. The ubiquitous swoosh
logo was recognized by the masses better than any other sporting brands.
Today Nike is a $25.3 billion dollar company, clothing some of the best
athletes in the world and changing our fitness life for the better.
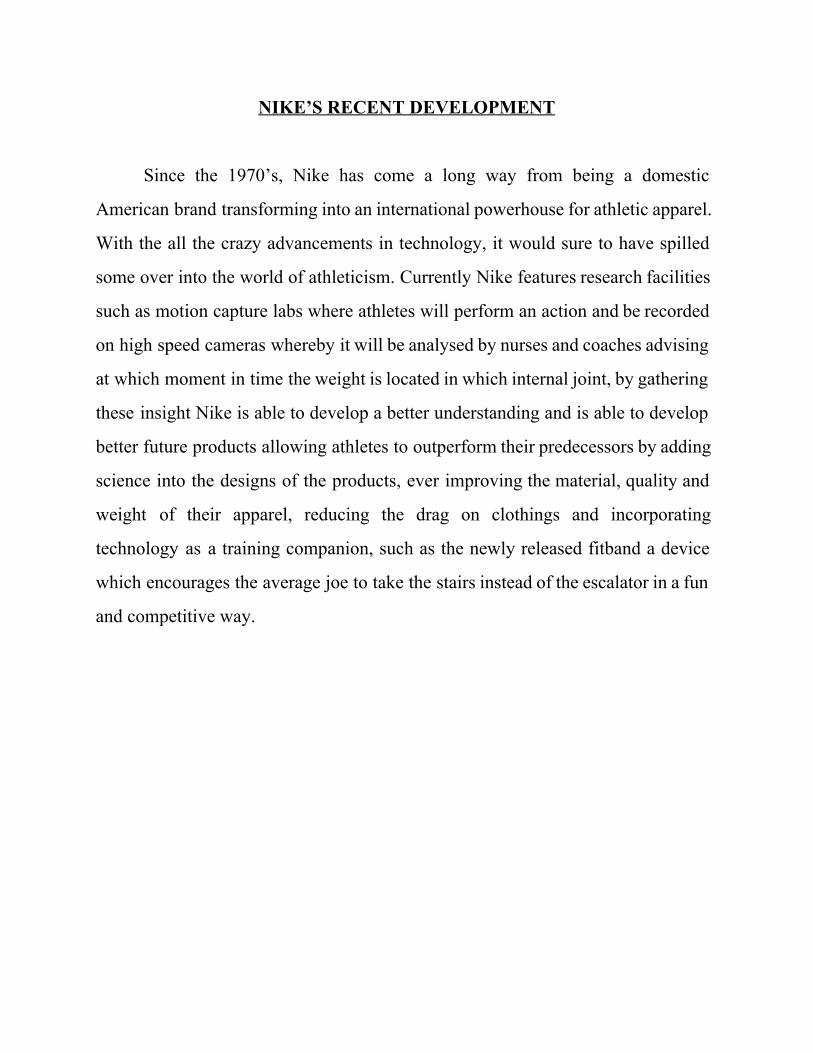
NIKE’S RECENT DEVELOPMENT
Since the 1970’s, Nike has come a long way from being a domestic
American brand transforming into an international powerhouse for athletic apparel.
With the all the crazy advancements in technology, it would sure to have spilled
some over into the world of athleticism. Currently Nike features research facilities
such as motion capture labs where athletes will perform an action and be recorded
on high speed cameras whereby it will be analysed by nurses and coaches advising
at which moment in time the weight is located in which internal joint, by gathering
these insight Nike is able to develop a better understanding and is able to develop
better future products allowing athletes to outperform their predecessors by adding
science into the designs of the products, ever improving the material, quality and
weight of their apparel, reducing the drag on clothings and incorporating
technology as a training companion, such as the newly released fitband a device
which encourages the average joe to take the stairs instead of the escalator in a fun
and competitive way.
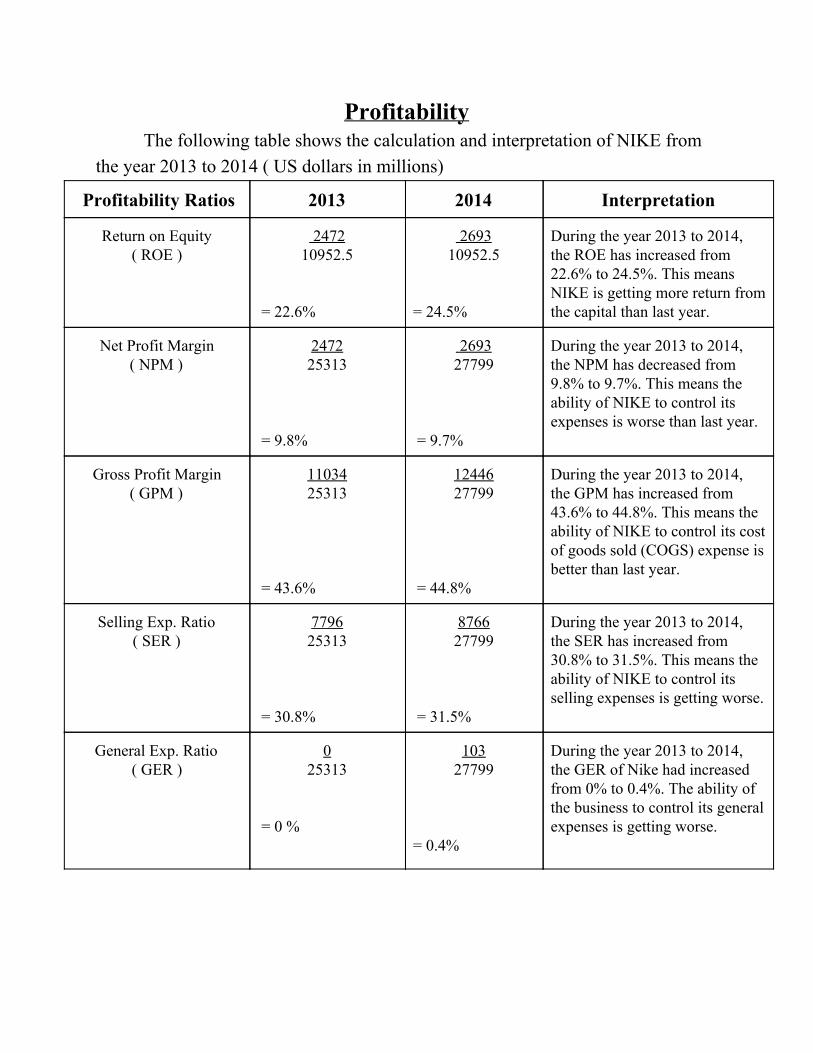
Profitability The following table shows the calculation and interpretation of NIKE from
the year 2013 to 2014 ( US dollars in millions) Profitability Ratios 2013 2014 Interpretation
Return on Equity ( ROE )
2472 10952.5
= 22.6%
2693 10952.5
= 24.5%
During the year 2013 to 2014, the ROE has increased from 22.6% to 24.5%. This means NIKE is getting more return from the capital than last year.
Net Profit Margin ( NPM )
2472 25313
= 9.8%
2693 27799
= 9.7%
During the year 2013 to 2014, the NPM has decreased from 9.8% to 9.7%. This means the ability of NIKE to control its expenses is worse than last year.
Gross Profit Margin ( GPM )
11034 25313
= 43.6%
12446 27799
= 44.8%
During the year 2013 to 2014, the GPM has increased from 43.6% to 44.8%. This means the ability of NIKE to control its cost of goods sold (COGS) expense is better than last year.
Selling Exp. Ratio ( SER )
7796 25313
= 30.8%
8766 27799
= 31.5%
During the year 2013 to 2014, the SER has increased from 30.8% to 31.5%. This means the ability of NIKE to control its selling expenses is getting worse.
General Exp. Ratio ( GER )
0 25313
= 0 %
103 27799
= 0.4%
During the year 2013 to 2014, the GER of Nike had increased from 0% to 0.4%. The ability of the business to control its general expenses is getting worse.
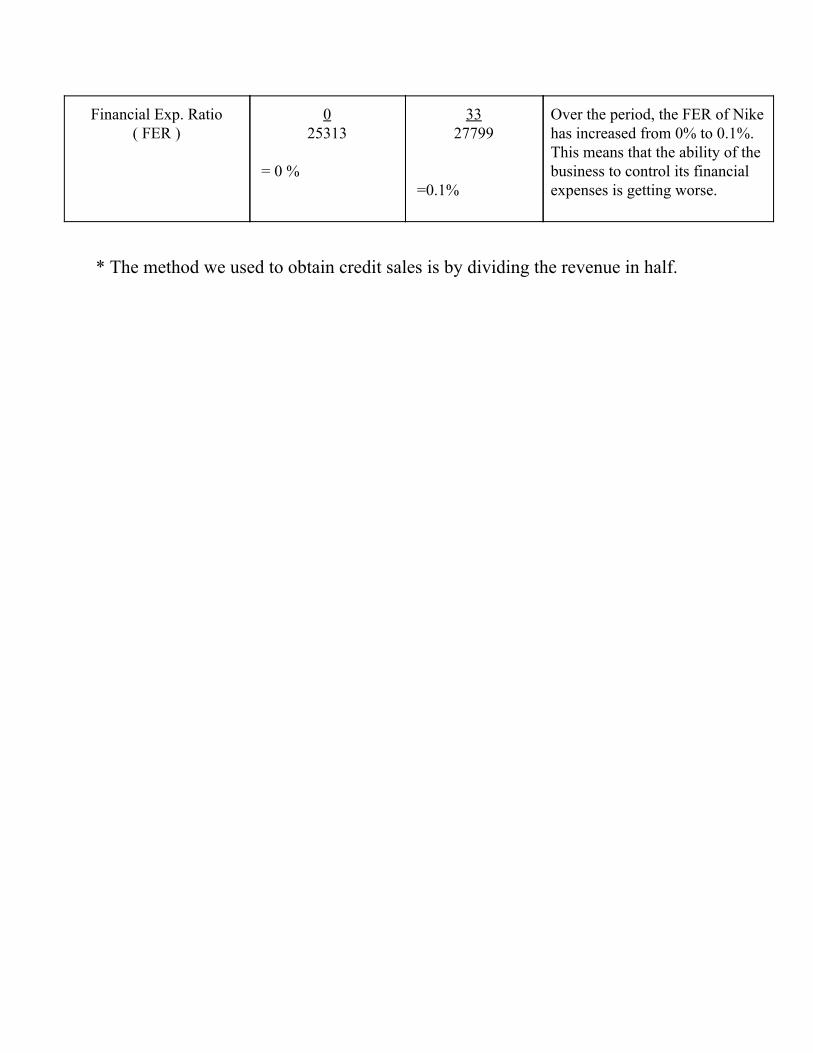
Financial Exp. Ratio ( FER )
0 25313
= 0 %
33 27799
=0.1%
Over the period, the FER of Nike has increased from 0% to 0.1%. This means that the ability of the business to control its financial expenses is getting worse.
* The method we used to obtain credit sales is by dividing the revenue in half.
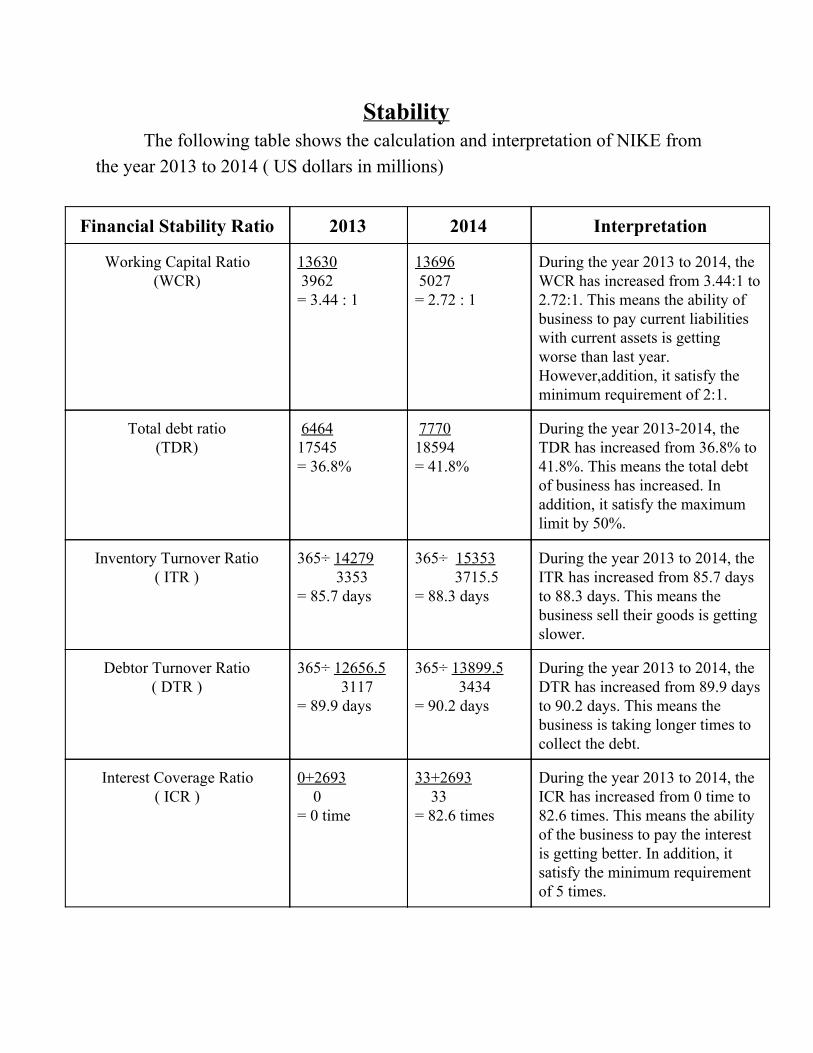
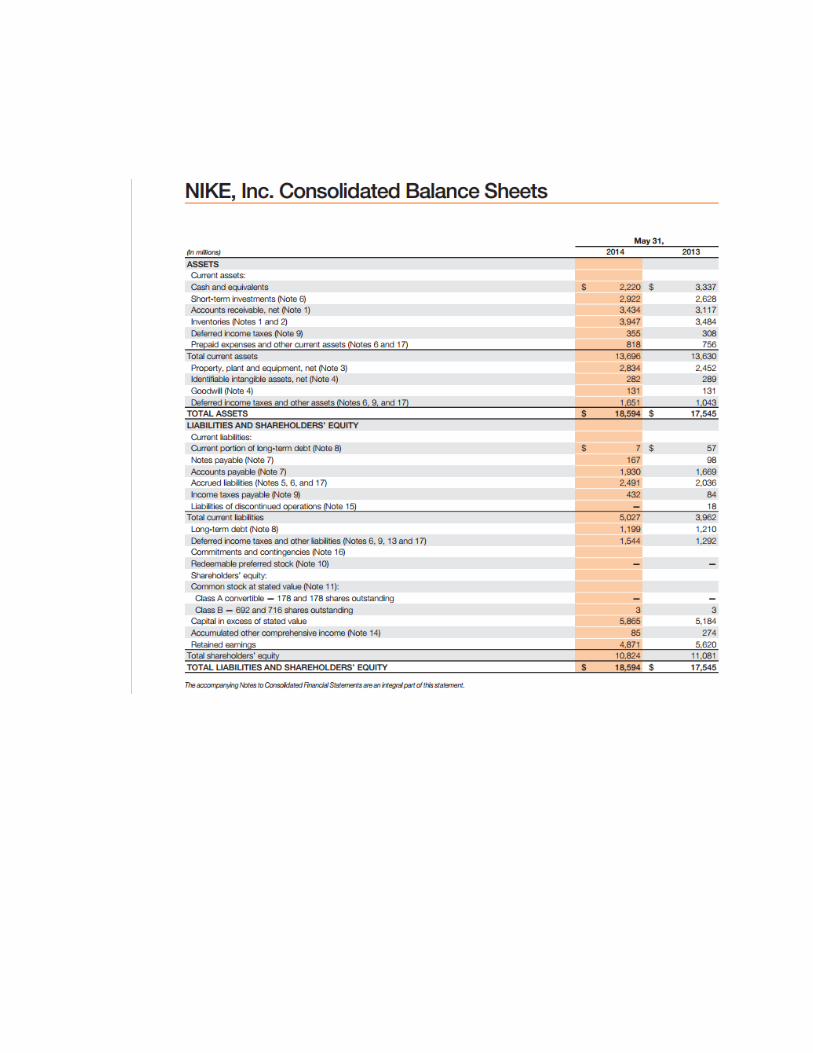
Stability The following table shows the calculation and interpretation of NIKE from
the year 2013 to 2014 ( US dollars in millions)
Financial Stability Ratio 2013 2014 Interpretation
Working Capital Ratio (WCR)
13630 3962 = 3.44 : 1
13696 5027 = 2.72 : 1
During the year 2013 to 2014, the WCR has increased from 3.44:1 to 2.72:1. This means the ability of business to pay current liabilities with current assets is getting worse than last year. However,addition, it satisfy the minimum requirement of 2:1.
Total debt ratio (TDR)
6464 17545 = 36.8%
7770 18594 = 41.8%
During the year 20132014, the TDR has increased from 36.8% to 41.8%. This means the total debt of business has increased. In addition, it satisfy the maximum limit by 50%.
Inventory Turnover Ratio ( ITR )
365÷ 14279 3353
= 85.7 days
365÷ 15353 3715.5 = 88.3 days
During the year 2013 to 2014, the ITR has increased from 85.7 days to 88.3 days. This means the business sell their goods is getting slower.
Debtor Turnover Ratio ( DTR )
365÷ 12656.5 3117 = 89.9 days
365÷ 13899.5 3434 = 90.2 days
During the year 2013 to 2014, the DTR has increased from 89.9 days to 90.2 days. This means the business is taking longer times to collect the debt.
Interest Coverage Ratio ( ICR )
0+2693 0 = 0 time
33+2693 33 = 82.6 times
During the year 2013 to 2014, the ICR has increased from 0 time to 82.6 times. This means the ability of the business to pay the interest is getting better. In addition, it satisfy the minimum requirement of 5 times.
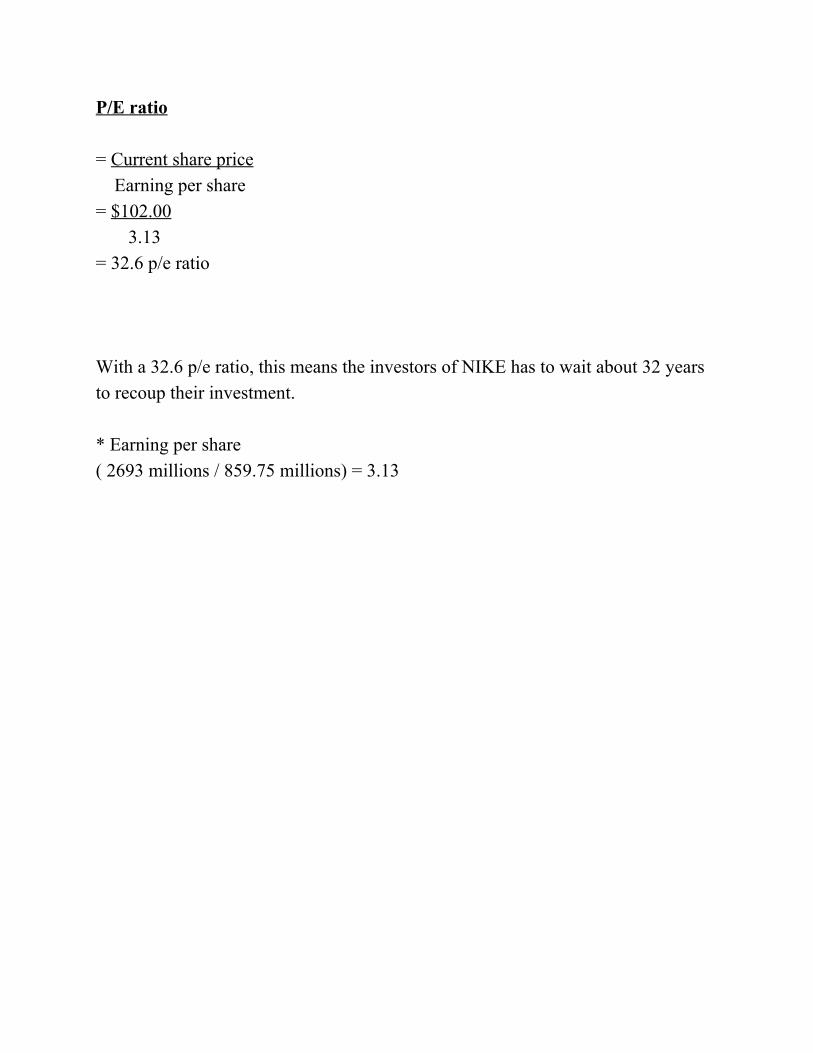
P/E ratio = Current share price Earning per share = $102.00 3.13 = 32.6 p/e ratio With a 32.6 p/e ratio, this means the investors of NIKE has to wait about 32 years to recoup their investment. * Earning per share ( 2693 millions / 859.75 millions) = 3.13
Investment Recommendation
Based on profitability ratio, we obtained the total Net profit margin figure
(NPM). The Selling expenses (SER) and general expenses (GER) ratio for nike
showed their method of handling the business had worsen even though the gross
profit margin (GPM) and return on equity (ROE) had increased. Nike’s ability to
pay off their current liabilities is also worsening but still satisfies the 2:1 ratio of
staying within the borderline of borrowing. Nike’s total debt has also increased and
it satisfies the 50%maximum limit. Their stock turnover has also slowed down and
they are taking a longer time to reclaim old debts. On the flip side their ability for
paying interest is getting better.
In conclusion nike earned more profit in 2014 compared to 2013. The
company has shown good promise in terms of revenue growth in the future as it
has always managed to stay ahead of the pack not only financially but also product
wise. Nike also has received AAA ratings from several different stock analysts
since and has proven itself to be a very stable company. Although Nike is a great
company but we do not recommend purchasing any shares from this company as it
would take over a calculated 30 years to earn back a profit on your investment.
Appendix
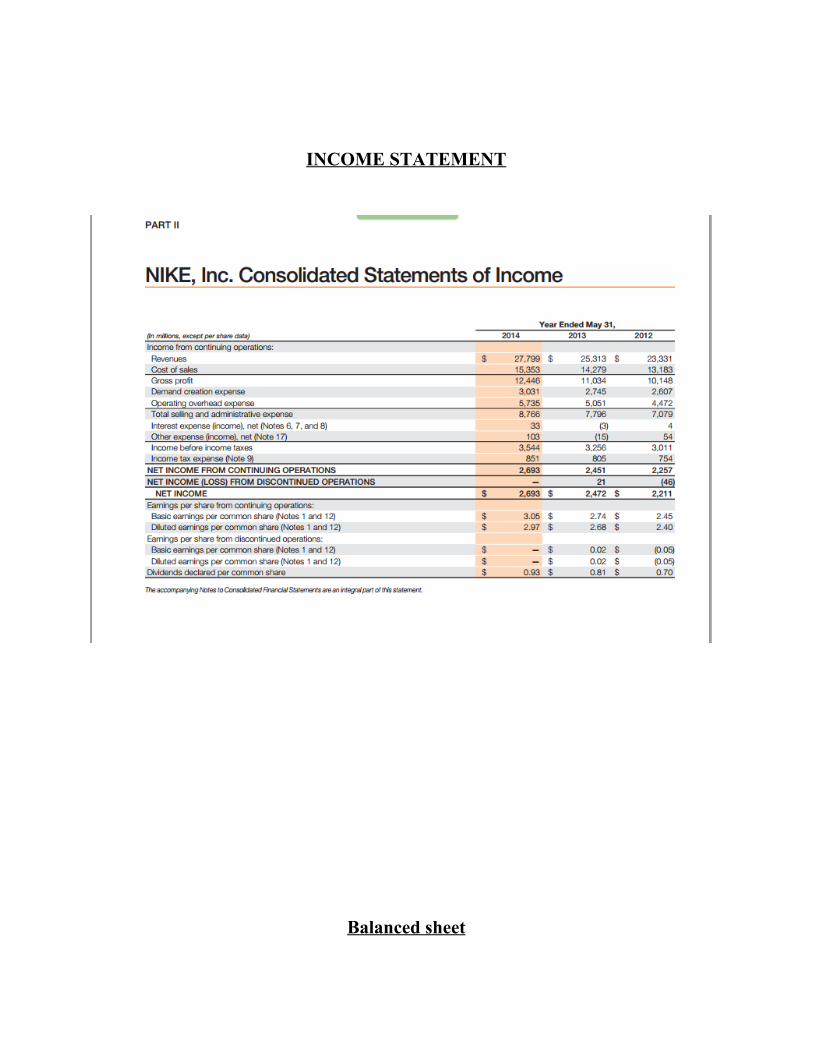
INCOME STATEMENT
Balanced sheet
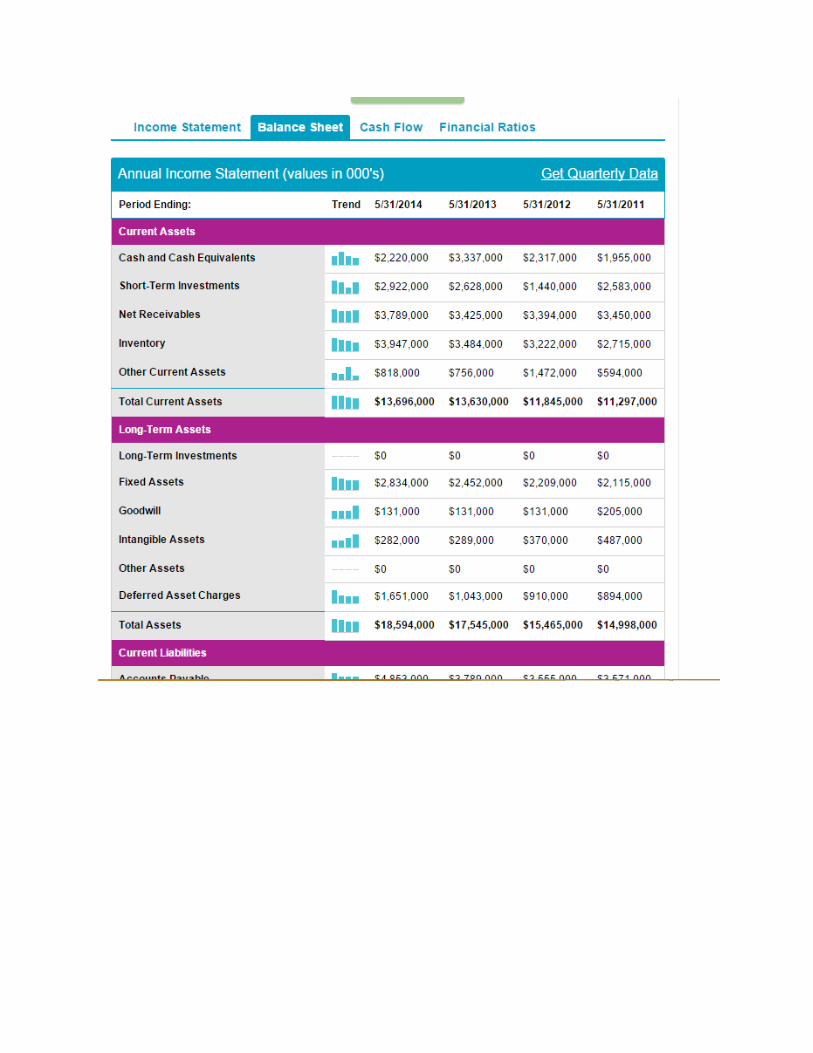
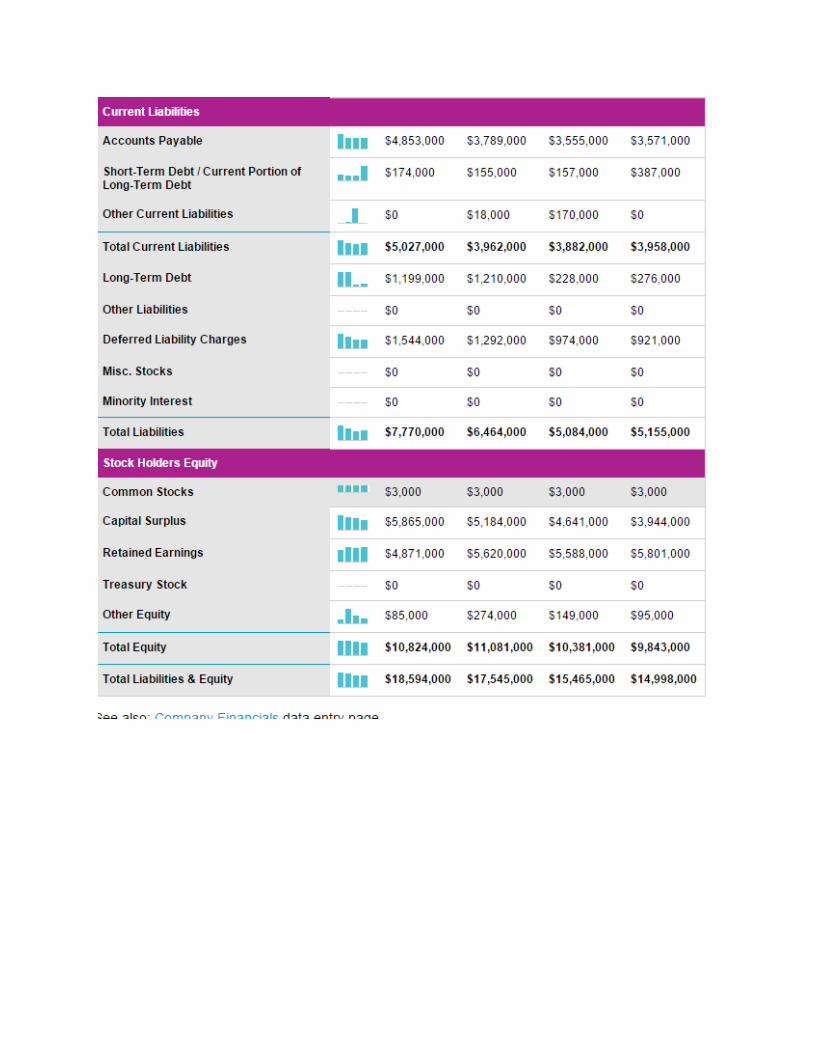
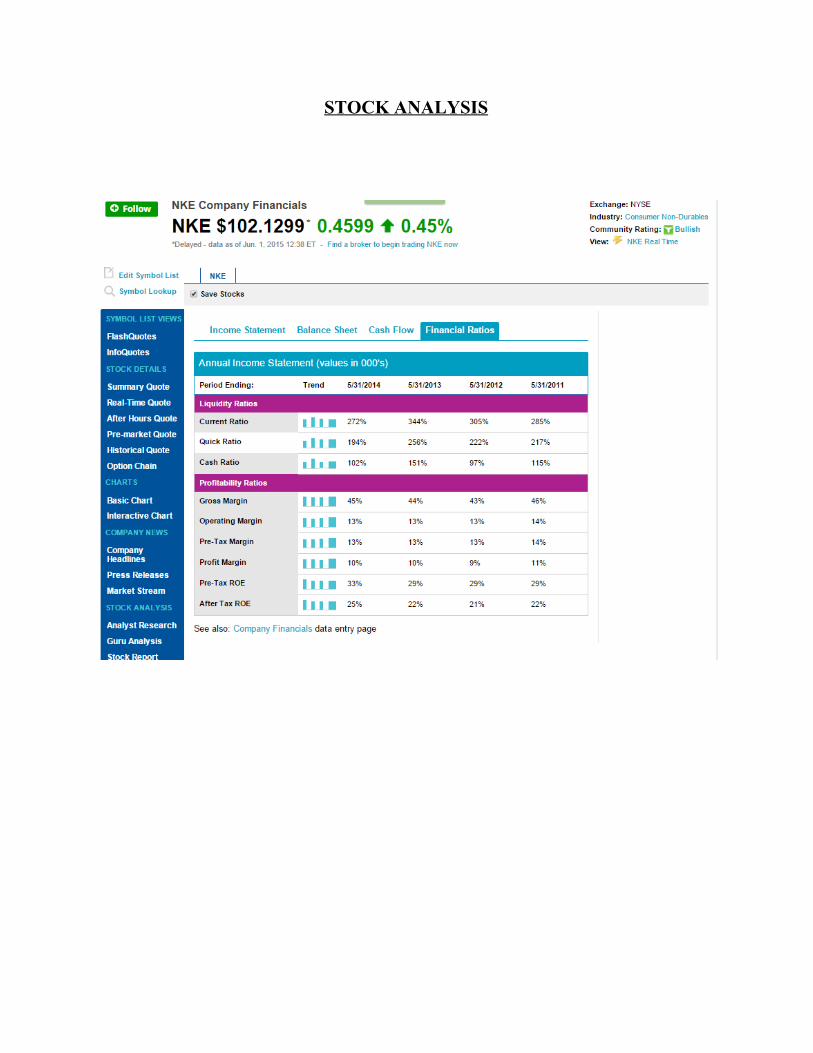
STOCK ANALYSIS
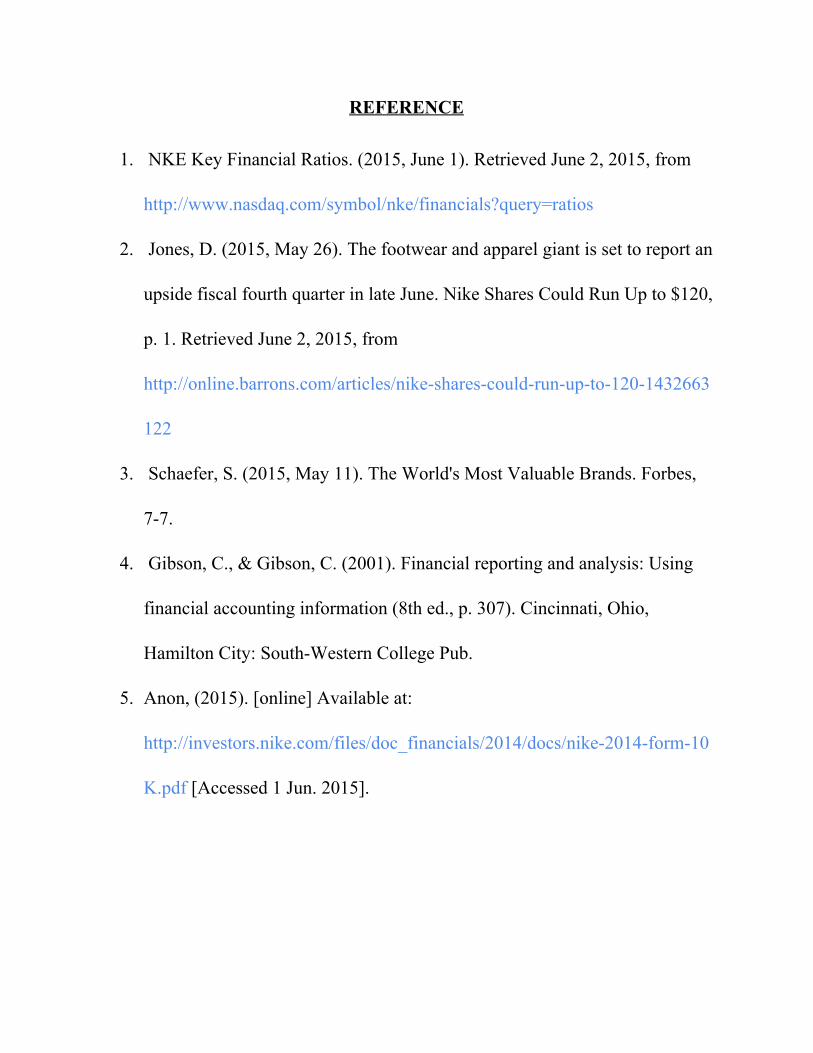
REFERENCE
1. NKE Key Financial Ratios. (2015, June 1). Retrieved June 2, 2015, from
http://www.nasdaq.com/symbol/nke/financials?query=ratios
2. Jones, D. (2015, May 26). The footwear and apparel giant is set to report an
upside fiscal fourth quarter in late June. Nike Shares Could Run Up to $120,
p. 1. Retrieved June 2, 2015, from
http://online.barrons.com/articles/nikesharescouldrunupto1201432663
122
3. Schaefer, S. (2015, May 11). The World's Most Valuable Brands. Forbes,
77.
4. Gibson, C., & Gibson, C. (2001). Financial reporting and analysis: Using
financial accounting information (8th ed., p. 307). Cincinnati, Ohio,
Hamilton City: SouthWestern College Pub.
5. Anon, (2015). [online] Available at:
http://investors.nike.com/files/doc_financials/2014/docs/nike2014form10
K.pdf [Accessed 1 Jun. 2015].