Embed Size (px)
Citation preview
Reassessment of Probabilistic Seismic Hazard in the Marmara Region
by Erol Kalkan, Polat Gülkan, Nazan Yilmaz, and Mehmet Çelebi
Abstract In 1999, the eastern coastline of the Marmara region (Turkey) witnessedincreased seismic activity on the North Anatolian fault (NAF) system with two dam-aging earthquakes (M 7.4 Kocaeli and M 7.2 Düzce) that occurred almost threemonths apart. These events have reduced stress on the western segment of the NAFwhere it continues under the Marmara Sea. The undersea fault segments have beenrecently explored using bathymetric and reflection surveys. These recent findingshelped scientists to understand the seismotectonic environment of the Marmara basin,which has remained a perplexing tectonic domain. On the basis of collected new data,seismic hazard of the Marmara region is reassessed using a probabilistic approach.Two different earthquake source models: (1) the smoothed-gridded seismicity modeland (2) fault model and alternate magnitude-frequency relations, Gutenberg–Richterand characteristic, were used with local and imported ground-motion-predictionequations. Regional exposure is computed and quantified on a set of hazard mapsthat provide peak horizontal ground acceleration (PGA) and spectral accelerationat 0.2 and 1.0 sec on uniform firm-rock site condition (760 m=sec average shear wavevelocity in the upper 30 m). These acceleration levels were computed for ground mo-tions having 2% and 10% probabilities of exceedance in 50 yr, corresponding to returnperiods of about 2475 and 475 yr, respectively. The maximum PGA computed (at rocksite) is 1.5g along the fault segments of the NAF zone extending into the Marmara Sea.The new maps generally show 10% to 15% increase for PGA, 0.2 and 1.0 sec spectralacceleration values across much of Marmara compared to previous regional hazardmaps. Hazard curves and smooth design spectra for three site conditions: rock, soil,and soft-soil are provided for the Istanbul metropolitan area as possible tools in futurerisk estimates.
Introduction
The Marmara region houses one-third of Turkey’s popu-lation and is one of the most tectonically active regions inEurasia. In the last century, this region (Fig. 1) experiencedunusual seismic activity with nine strong events havingM ≥7:0 (M � moment magnitude). In 1999, two destructiveearthquakes (Kocaeli and Düzce) occurred in the eastern partof the Marmara region on the North Anatolian fault (NAF)system. This strike-slip fault system cuts across northernTurkey for more than 1200 km and accommodates∼25 mm=yr right-lateral slip between the Anatolian andEurasian plates (Straub et al. 1997; McClusky et al. 2000).Since 1939, the NAF system has produced nine large earth-quakes in a consistently westward-propagating sequence(Fig. 2); the only exception is the most recent large earth-quake (Düzce) that occurred east of the second most-recentearthquake (Kocaeli). This pattern of earthquake propagationwas recognized long ago (Ketin, 1969; Ambraseys, 1970;Barka, 1992; Stein et al., 1997).
The Kocaeli earthquake (M 7.4) is the most recent eventthat occurred on the south of the eastern border of the
Istanbul province, which is located in the heart of the Mar-mara region. Today, this most-populated city in Europe isunder threat of much publicized forecasted earthquakes.Two fault systems located south and southeast of Istanbul(the Yalova fault segment and the northern boundary fault)have the potential to rupture (Parsons et al., 2000; Hubert–Ferrari et al., 2000). Based on a renewal model, the probabil-ity of occurrence of M 7.0 and greater earthquakes in theMarmara region that could directly influence the Istanbulmetropolitan area was computed as 44� 18% in the next30 yr (Parsons, 2004). As implied by the level of seismicrisk, critical assessment of the regional seismic hazard isof paramount importance to facilitate and support a widerange of earthquake engineering applications.
The current regulatory seismic zoning map of Turkey,including the Marmara region, was developed using a Bayes-ian estimation based on then available earthquake catalogand ground-motion-prediction equations (GMPEs) originallydeveloped from western U.S. ground motion data (Gülkanet al., 1993). This choice was dictated by the paucity of
2127
Bulletin of the Seismological Society of America, Vol. 99, No. 4, pp. 2127–2146, August 2009, doi: 10.1785/0120080285
strong-motion records in the country at the time. In the past15 yr, a number of strong-motion records have been recordedin Turkey, mainly from the 1999 Kocaeli M 7.4 and DuzceM 7.2 events, and hence, prompted development of nationalGMPEs (e.g., Gülkan and Kalkan, 2002; Kalkan and Gülkan,2004; Ulusay et al., 2004). In addition, tracing of new faultsegments beneath the Marmara Sea has helped better under-standing of the seismotectonic environment of the Marmarabasin (Le Pichon et al., 2001; Armijo et al., 2002; Le Pichonet al., 2003; Armijo et al., 2005).
Seismic hazard of the Marmara region has been studiedpreviously (Atakan et al., 2002; Erdik et al., 2004). Thesestudies are based on broadly described fault segments underthe Marmara Sea and nonindigenous GMPEs from the 1990s.In our study, the regional seismic hazard is reassessed byconsidering detailed submarine faults and using the latest
generation of GMPEs. The next generation of attenuation(NGA) relations (Boore and Atkinson, 2008; Campbell andBozorgnia, 2008; Chiou and Youngs, 2008) are used in ad-dition to the GMPE of Kalkan and Gülkan, developed basedon data from shallow crustal tectonic environment of Turkey.The weight assigned to the local GMPE is set equal to totalweight of the NGA relations.
In computing the probabilistic seismic hazard,we includetwo different earthquake source models: (1) smoothed-gridded seismicity model and (2) fault model, similar to thoseused in the development of the 2008 USGS National SeismicHazard Maps (Petersen et al. 2008). The first model assumesthat historical large earthquakes have in general taken placein locations where epicenters of smaller earthquakes have ac-cumulated (Kafka and Walcott, 1998; Kafka, 2002). Thismodel is based on the earthquake catalog and characterizes
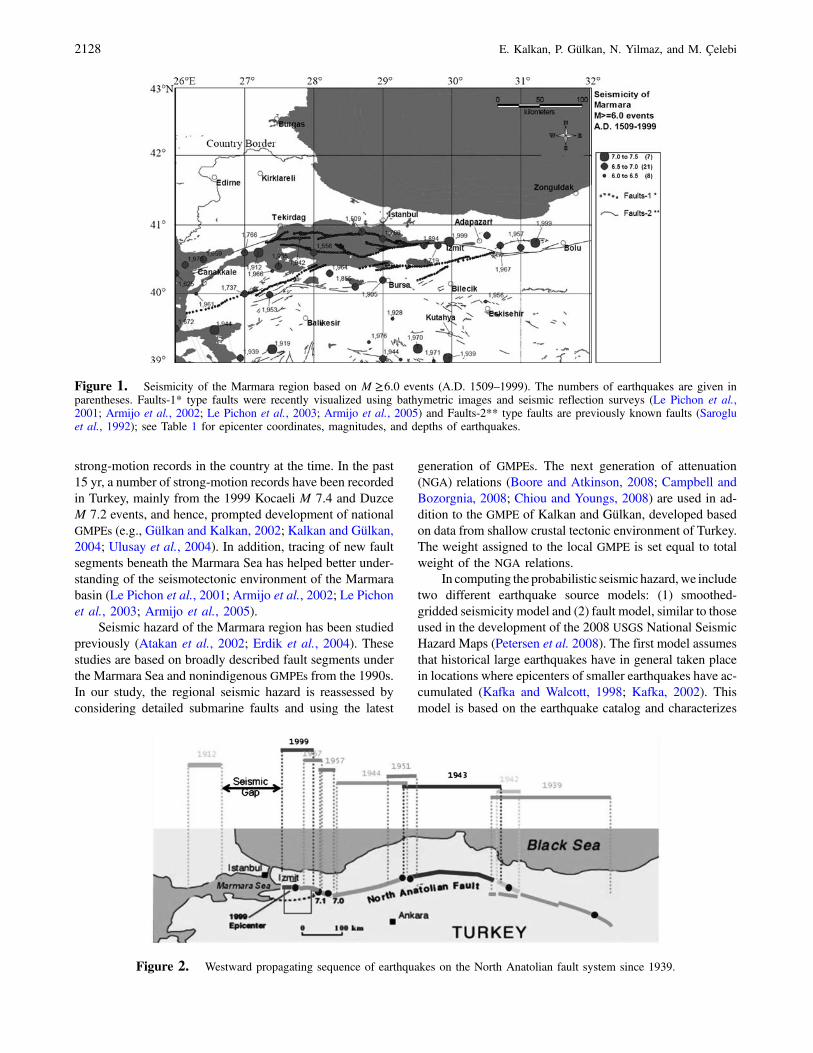
Figure 1. Seismicity of the Marmara region based on M ≥6:0 events (A.D. 1509–1999). The numbers of earthquakes are given inparentheses. Faults-1* type faults were recently visualized using bathymetric images and seismic reflection surveys (Le Pichon et al.,2001; Armijo et al., 2002; Le Pichon et al., 2003; Armijo et al., 2005) and Faults-2** type faults are previously known faults (Sarogluet al., 1992); see Table 1 for epicenter coordinates, magnitudes, and depths of earthquakes.
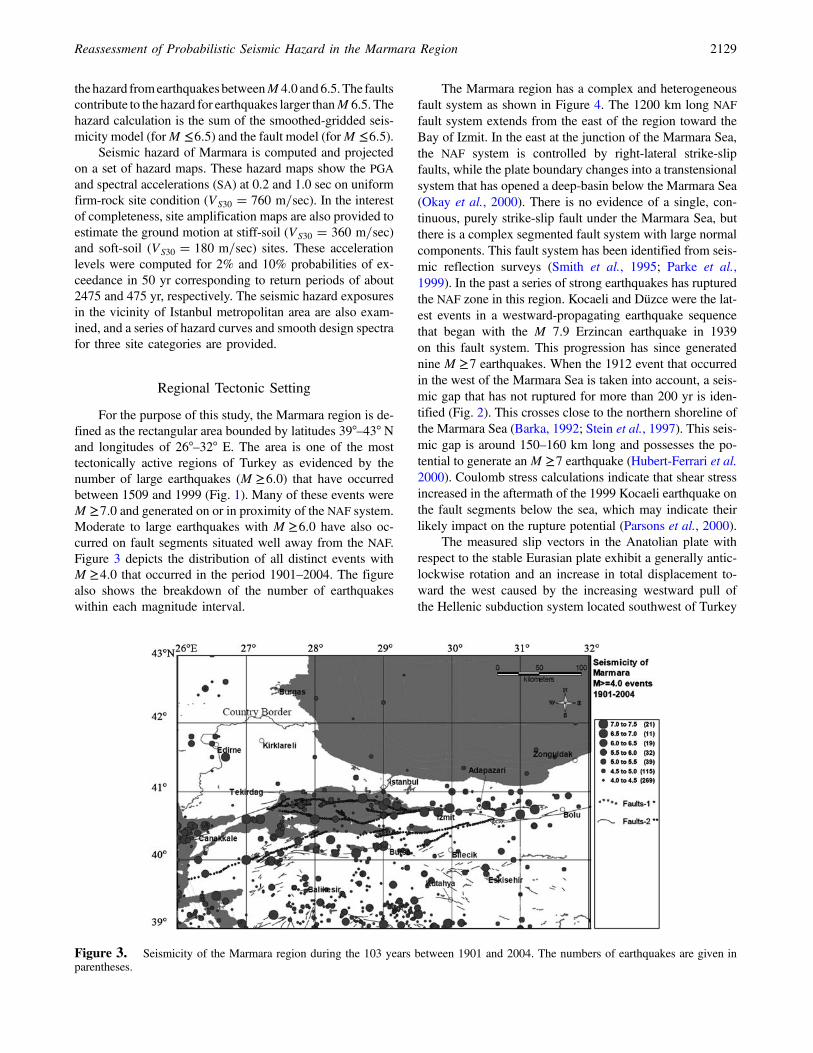
Figure 2. Westward propagating sequence of earthquakes on the North Anatolian fault system since 1939.
2128 E. Kalkan, P. Gülkan, N. Yilmaz, and M. Çelebi
the hazard fromearthquakesbetweenM 4.0 and6.5.The faultscontribute to the hazard for earthquakes larger thanM 6.5. Thehazard calculation is the sum of the smoothed-gridded seis-micity model (forM ≤6:5) and the fault model (forM ≤6:5).
Seismic hazard of Marmara is computed and projectedon a set of hazard maps. These hazard maps show the PGAand spectral accelerations (SA) at 0.2 and 1.0 sec on uniformfirm-rock site condition (VS30 � 760 m=sec). In the interestof completeness, site amplification maps are also provided toestimate the ground motion at stiff-soil (VS30 � 360 m=sec)and soft-soil (VS30 � 180 m=sec) sites. These accelerationlevels were computed for 2% and 10% probabilities of ex-ceedance in 50 yr corresponding to return periods of about2475 and 475 yr, respectively. The seismic hazard exposuresin the vicinity of Istanbul metropolitan area are also exam-ined, and a series of hazard curves and smooth design spectrafor three site categories are provided.
Regional Tectonic Setting
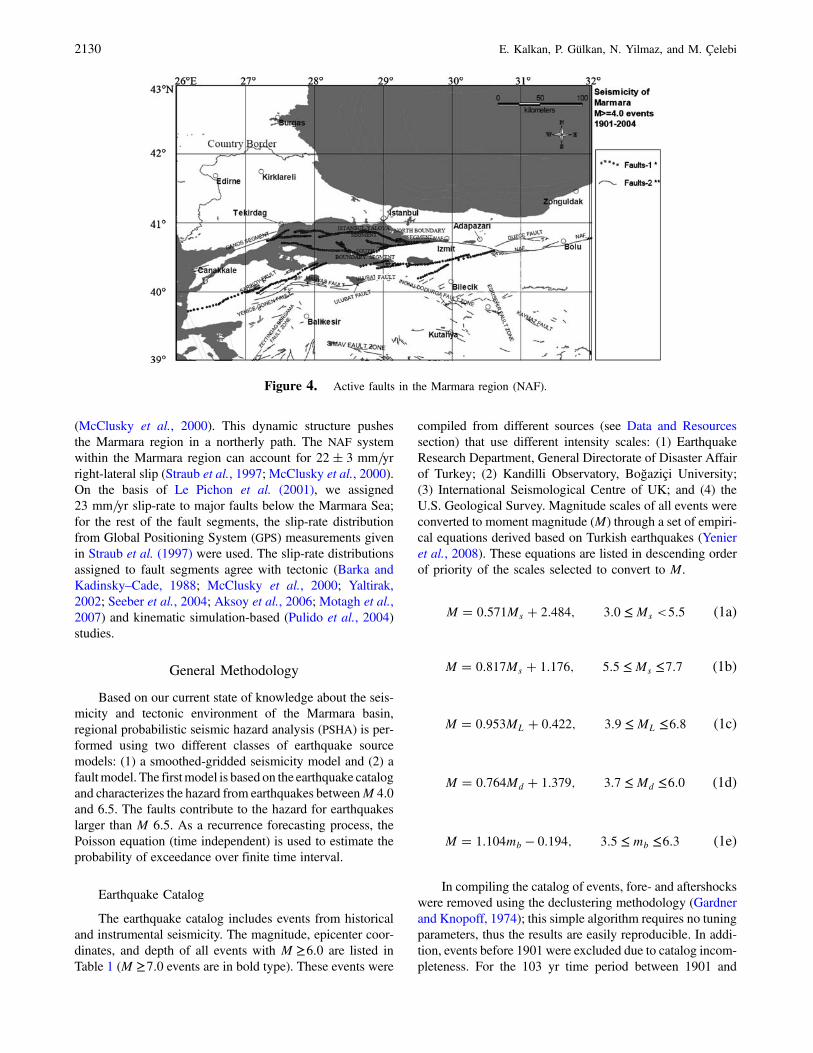
For the purpose of this study, the Marmara region is de-fined as the rectangular area bounded by latitudes 39°–43° Nand longitudes of 26°–32° E. The area is one of the mosttectonically active regions of Turkey as evidenced by thenumber of large earthquakes (M ≥6:0) that have occurredbetween 1509 and 1999 (Fig. 1). Many of these events wereM ≥7:0 and generated on or in proximity of the NAF system.Moderate to large earthquakes with M ≥6:0 have also oc-curred on fault segments situated well away from the NAF.Figure 3 depicts the distribution of all distinct events withM ≥4:0 that occurred in the period 1901–2004. The figurealso shows the breakdown of the number of earthquakeswithin each magnitude interval.
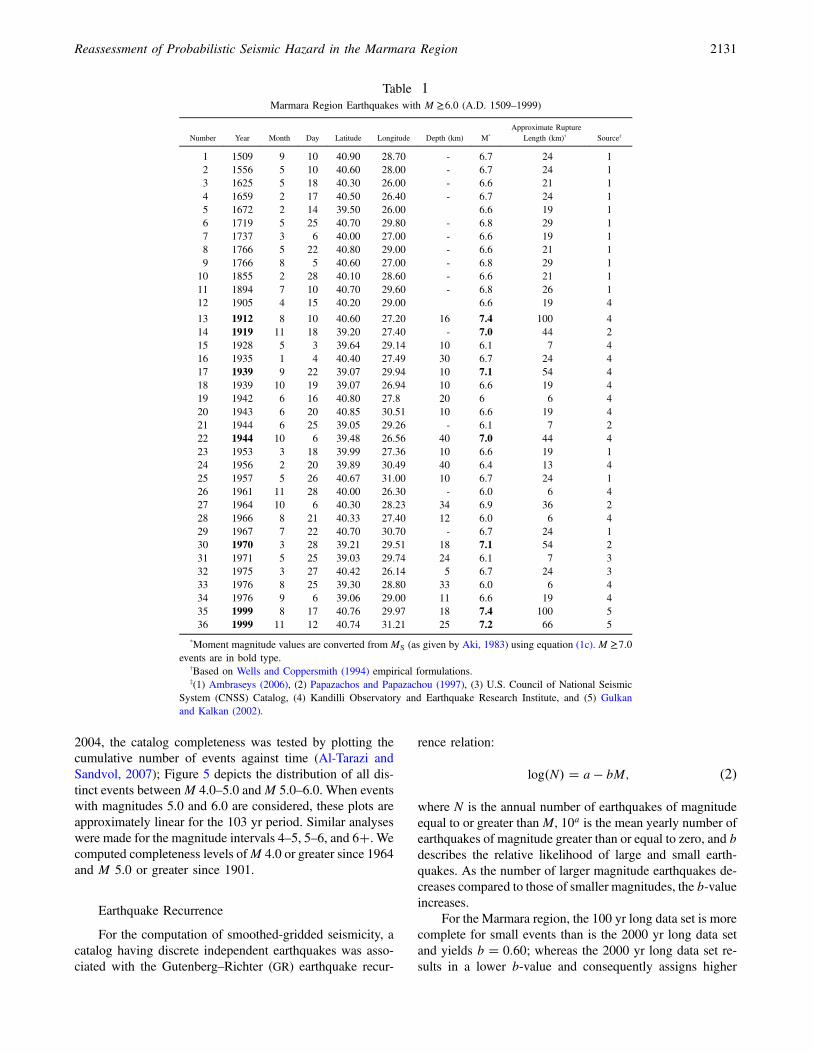
The Marmara region has a complex and heterogeneousfault system as shown in Figure 4. The 1200 km long NAFfault system extends from the east of the region toward theBay of Izmit. In the east at the junction of the Marmara Sea,the NAF system is controlled by right-lateral strike-slipfaults, while the plate boundary changes into a transtensionalsystem that has opened a deep-basin below the Marmara Sea(Okay et al., 2000). There is no evidence of a single, con-tinuous, purely strike-slip fault under the Marmara Sea, butthere is a complex segmented fault system with large normalcomponents. This fault system has been identified from seis-mic reflection surveys (Smith et al., 1995; Parke et al.,1999). In the past a series of strong earthquakes has rupturedthe NAF zone in this region. Kocaeli and Düzce were the lat-est events in a westward-propagating earthquake sequencethat began with the M 7.9 Erzincan earthquake in 1939on this fault system. This progression has since generatednine M ≥7 earthquakes. When the 1912 event that occurredin the west of the Marmara Sea is taken into account, a seis-mic gap that has not ruptured for more than 200 yr is iden-tified (Fig. 2). This crosses close to the northern shoreline ofthe Marmara Sea (Barka, 1992; Stein et al., 1997). This seis-mic gap is around 150–160 km long and possesses the po-tential to generate anM ≥7 earthquake (Hubert-Ferrari et al.2000). Coulomb stress calculations indicate that shear stressincreased in the aftermath of the 1999 Kocaeli earthquake onthe fault segments below the sea, which may indicate theirlikely impact on the rupture potential (Parsons et al., 2000).
The measured slip vectors in the Anatolian plate withrespect to the stable Eurasian plate exhibit a generally antic-lockwise rotation and an increase in total displacement to-ward the west caused by the increasing westward pull ofthe Hellenic subduction system located southwest of Turkey
Figure 3. Seismicity of the Marmara region during the 103 years between 1901 and 2004. The numbers of earthquakes are given inparentheses.
Reassessment of Probabilistic Seismic Hazard in the Marmara Region 2129
(McClusky et al., 2000). This dynamic structure pushesthe Marmara region in a northerly path. The NAF systemwithin the Marmara region can account for 22� 3 mm=yrright-lateral slip (Straub et al., 1997; McClusky et al., 2000).On the basis of Le Pichon et al. (2001), we assigned23 mm=yr slip-rate to major faults below the Marmara Sea;for the rest of the fault segments, the slip-rate distributionfrom Global Positioning System (GPS) measurements givenin Straub et al. (1997) were used. The slip-rate distributionsassigned to fault segments agree with tectonic (Barka andKadinsky–Cade, 1988; McClusky et al., 2000; Yaltirak,2002; Seeber et al., 2004; Aksoy et al., 2006; Motagh et al.,2007) and kinematic simulation-based (Pulido et al., 2004)studies.
General Methodology
Based on our current state of knowledge about the seis-micity and tectonic environment of the Marmara basin,regional probabilistic seismic hazard analysis (PSHA) is per-formed using two different classes of earthquake sourcemodels: (1) a smoothed-gridded seismicity model and (2) afaultmodel. The firstmodel is based on the earthquake catalogand characterizes the hazard from earthquakes betweenM 4.0and 6.5. The faults contribute to the hazard for earthquakeslarger than M 6.5. As a recurrence forecasting process, thePoisson equation (time independent) is used to estimate theprobability of exceedance over finite time interval.
Earthquake Catalog
The earthquake catalog includes events from historicaland instrumental seismicity. The magnitude, epicenter coor-dinates, and depth of all events with M ≥6:0 are listed inTable 1 (M ≥7:0 events are in bold type). These events were
compiled from different sources (see Data and Resourcessection) that use different intensity scales: (1) EarthquakeResearch Department, General Directorate of Disaster Affairof Turkey; (2) Kandilli Observatory, Boğaziçi University;(3) International Seismological Centre of UK; and (4) theU.S. Geological Survey. Magnitude scales of all events wereconverted to moment magnitude (M) through a set of empiri-cal equations derived based on Turkish earthquakes (Yenieret al., 2008). These equations are listed in descending orderof priority of the scales selected to convert to M.
M � 0:571Ms � 2:484; 3:0 ≤ Ms <5:5 (1a)
M � 0:817Ms � 1:176; 5:5 ≤ Ms ≤7:7 (1b)
M � 0:953ML � 0:422; 3:9 ≤ ML ≤6:8 (1c)
M � 0:764Md � 1:379; 3:7 ≤ Md ≤6:0 (1d)
M � 1:104mb � 0:194; 3:5 ≤ mb ≤6:3 (1e)
In compiling the catalog of events, fore- and aftershockswere removed using the declustering methodology (Gardnerand Knopoff, 1974); this simple algorithm requires no tuningparameters, thus the results are easily reproducible. In addi-tion, events before 1901 were excluded due to catalog incom-pleteness. For the 103 yr time period between 1901 and
Figure 4. Active faults in the Marmara region (NAF).
2130 E. Kalkan, P. Gülkan, N. Yilmaz, and M. Çelebi
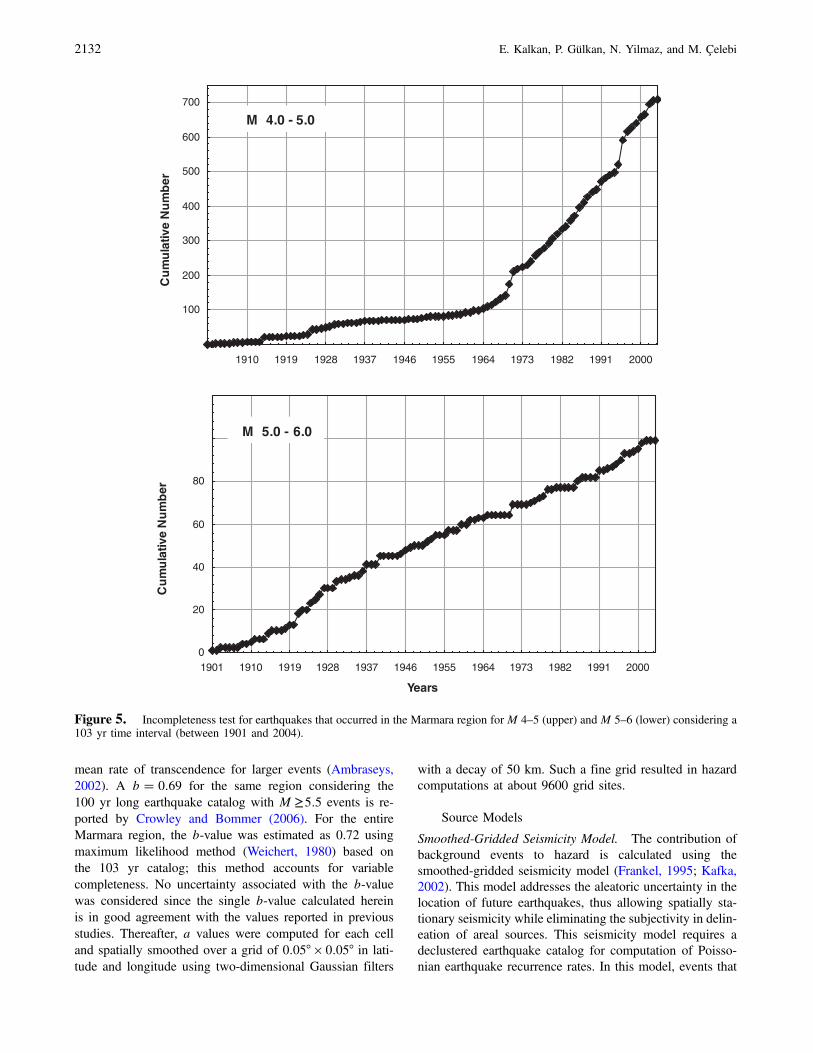
2004, the catalog completeness was tested by plotting thecumulative number of events against time (Al-Tarazi andSandvol, 2007); Figure 5 depicts the distribution of all dis-tinct events betweenM 4.0–5.0 andM 5.0–6.0. When eventswith magnitudes 5.0 and 6.0 are considered, these plots areapproximately linear for the 103 yr period. Similar analyseswere made for the magnitude intervals 4–5, 5–6, and 6�. Wecomputed completeness levels ofM 4.0 or greater since 1964and M 5.0 or greater since 1901.
Earthquake Recurrence
For the computation of smoothed-gridded seismicity, acatalog having discrete independent earthquakes was asso-ciated with the Gutenberg–Richter (GR) earthquake recur-
rence relation:
log�N� � a � bM; (2)
where N is the annual number of earthquakes of magnitudeequal to or greater thanM, 10a is the mean yearly number ofearthquakes of magnitude greater than or equal to zero, and bdescribes the relative likelihood of large and small earth-quakes. As the number of larger magnitude earthquakes de-creases compared to those of smaller magnitudes, the b-valueincreases.
For the Marmara region, the 100 yr long data set is morecomplete for small events than is the 2000 yr long data setand yields b � 0:60; whereas the 2000 yr long data set re-sults in a lower b-value and consequently assigns higher
Table 1Marmara Region Earthquakes with M ≥6:0 (A.D. 1509–1999)
Number Year Month Day Latitude Longitude Depth (km) M*
Approximate RuptureLength (km)† Source‡
1 1509 9 10 40.90 28.70 - 6.7 24 12 1556 5 10 40.60 28.00 - 6.7 24 13 1625 5 18 40.30 26.00 - 6.6 21 14 1659 2 17 40.50 26.40 - 6.7 24 15 1672 2 14 39.50 26.00 6.6 19 16 1719 5 25 40.70 29.80 - 6.8 29 17 1737 3 6 40.00 27.00 - 6.6 19 18 1766 5 22 40.80 29.00 - 6.6 21 19 1766 8 5 40.60 27.00 - 6.8 29 1
10 1855 2 28 40.10 28.60 - 6.6 21 111 1894 7 10 40.70 29.60 - 6.8 26 112 1905 4 15 40.20 29.00 6.6 19 4
13 1912 8 10 40.60 27.20 16 7.4 100 414 1919 11 18 39.20 27.40 - 7.0 44 215 1928 5 3 39.64 29.14 10 6.1 7 416 1935 1 4 40.40 27.49 30 6.7 24 417 1939 9 22 39.07 29.94 10 7.1 54 418 1939 10 19 39.07 26.94 10 6.6 19 419 1942 6 16 40.80 27.8 20 6 6 420 1943 6 20 40.85 30.51 10 6.6 19 421 1944 6 25 39.05 29.26 - 6.1 7 222 1944 10 6 39.48 26.56 40 7.0 44 423 1953 3 18 39.99 27.36 10 6.6 19 124 1956 2 20 39.89 30.49 40 6.4 13 425 1957 5 26 40.67 31.00 10 6.7 24 126 1961 11 28 40.00 26.30 - 6.0 6 427 1964 10 6 40.30 28.23 34 6.9 36 228 1966 8 21 40.33 27.40 12 6.0 6 429 1967 7 22 40.70 30.70 - 6.7 24 130 1970 3 28 39.21 29.51 18 7.1 54 231 1971 5 25 39.03 29.74 24 6.1 7 332 1975 3 27 40.42 26.14 5 6.7 24 333 1976 8 25 39.30 28.80 33 6.0 6 434 1976 9 6 39.06 29.00 11 6.6 19 435 1999 8 17 40.76 29.97 18 7.4 100 536 1999 11 12 40.74 31.21 25 7.2 66 5
*Moment magnitude values are converted from MS (as given by Aki, 1983) using equation (1c). M ≥7:0events are in bold type.
†Based on Wells and Coppersmith (1994) empirical formulations.‡(1) Ambraseys (2006), (2) Papazachos and Papazachou (1997), (3) U.S. Council of National Seismic
System (CNSS) Catalog, (4) Kandilli Observatory and Earthquake Research Institute, and (5) Gulkanand Kalkan (2002).
Reassessment of Probabilistic Seismic Hazard in the Marmara Region 2131
mean rate of transcendence for larger events (Ambraseys,2002). A b � 0:69 for the same region considering the100 yr long earthquake catalog with M ≥5:5 events is re-ported by Crowley and Bommer (2006). For the entireMarmara region, the b-value was estimated as 0.72 usingmaximum likelihood method (Weichert, 1980) based onthe 103 yr catalog; this method accounts for variablecompleteness. No uncertainty associated with the b-valuewas considered since the single b-value calculated hereinis in good agreement with the values reported in previousstudies. Thereafter, a values were computed for each celland spatially smoothed over a grid of 0:05° × 0:05° in lati-tude and longitude using two-dimensional Gaussian filters
with a decay of 50 km. Such a fine grid resulted in hazardcomputations at about 9600 grid sites.
Source Models
Smoothed-Gridded Seismicity Model. The contribution ofbackground events to hazard is calculated using thesmoothed-gridded seismicity model (Frankel, 1995; Kafka,2002). This model addresses the aleatoric uncertainty in thelocation of future earthquakes, thus allowing spatially sta-tionary seismicity while eliminating the subjectivity in delin-eation of areal sources. This seismicity model requires adeclustered earthquake catalog for computation of Poisso-nian earthquake recurrence rates. In this model, events that
100
200
300
400
500
600
700
1910 1919 1928 1937 1946 1955 1964 1973 1982 1991 2000
Cu
mu
lativ
e N
um
ber
M 4.0 - 5.0
0
20
40
60
80
1901 1910 1919 1928 1937 1946 1955 1964 1973 1982 1991 2000
Years
Cu
mu
lativ
e N
um
ber
M 5.0 - 6.0
Figure 5. Incompleteness test for earthquakes that occurred in the Marmara region for M 4–5 (upper) and M 5–6 (lower) considering a103 yr time interval (between 1901 and 2004).
2132 E. Kalkan, P. Gülkan, N. Yilmaz, and M. Çelebi
are not assigned to specific faults are assumed to be potentialseismogenic sources and are spatially gridded to cells. First,we count the number of earthquakes ni with magnitudegreater than Mref in each cell i of a grid with spacing of0.05° in latitude and 0.05° in longitude. This count repre-sents the maximum likelihood estimate of 10a for that cell(Weichert, 1980; Bender, 1983) for earthquakes aboveMref . The values of ni are converted from cumulative values(number of events above Mref ) to incremental values (num-ber of events from Mref to Mref �ΔM) using the Herrmannformula (Herrmann, 1977). The grid of ni values is thensmoothed spatially by multiplying by a Gaussian functionwith correlation distance c. For each cell i, the smoothed va-lue ~ni is obtained from (Frankel, 1995)
~ni �
Pjnje
�Δ2ij=c
2
Pje�Δ
2ij=c
2 : (3)
In this equation, ~ni is normalized to preserve the total numberof events, and Δij is the distance between the ith and jthcells. The sum is taken over cells j within a distance of3c of cell i. The annual probability of exceeding specifiedground motions is calculated for a grid of sites using ~ni fromequation (3). For each site, the values of ~ni are binned bytheir distance from that site, so that Nk denotes the total of~ni values for cells within a certain distance increment of thesite. Now the annual rate λ�u > u0� of exceeding groundmotion u0 at a specific site is determined from a sum overdistance and magnitude (Frankel, 1995)
λ�u > u0� �X
k
X
l
10�log�NK=T��b�Ml�Mref ��
× P�u > u0jDk;Ml�;(4)
where k is the index for the distance bin, and l is the index for
the magnitude bin; T is the time in years of the earthquakecatalog used to determine Nk. The first factor in the summa-tion is the annual rate of earthquakes in the distance bin k andmagnitude bin l. P�u > u0jDk;Ml� is the probability that uat the site will exceed u0, for an earthquake at distance Dk
with magnitude Ml (Dk is fixed for each bin). This probabil-ity is dependent on the attenuation relation and the standarddeviation (variability) of the ground motion for any specificdistance and magnitude. For this model, values are computedfrom the magnitude 4.0 and larger earthquakes since 1901.
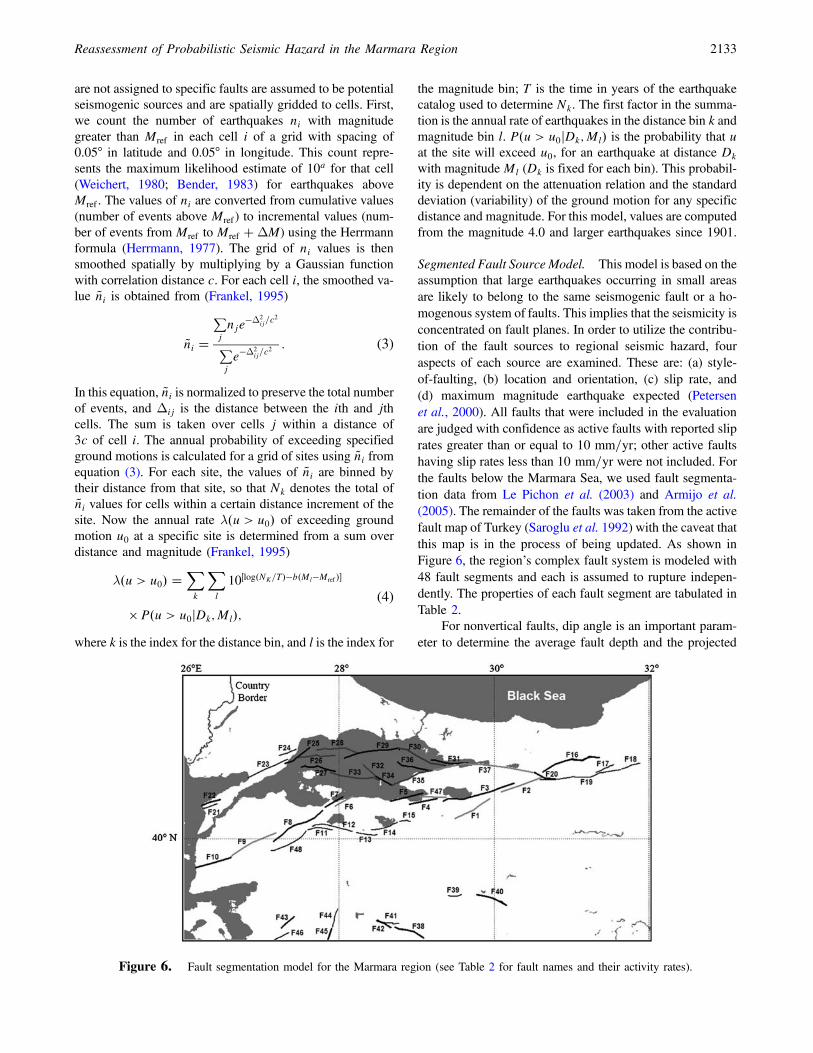
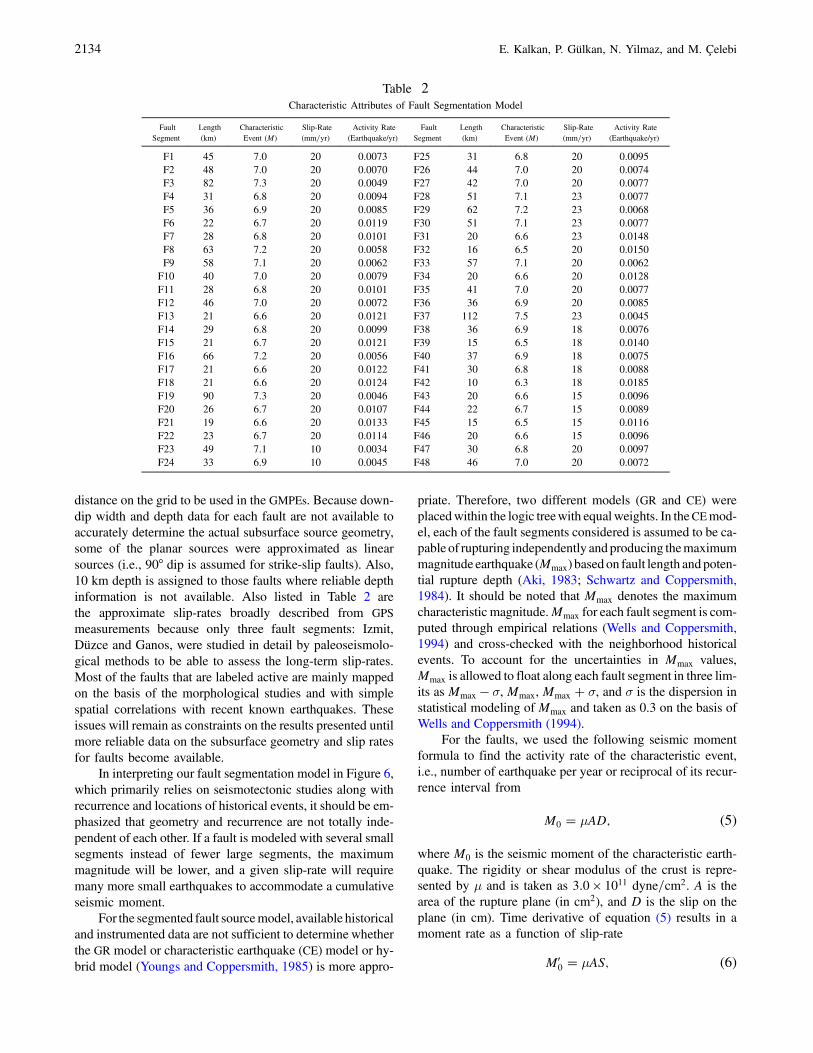
Segmented Fault Source Model. This model is based on theassumption that large earthquakes occurring in small areasare likely to belong to the same seismogenic fault or a ho-mogenous system of faults. This implies that the seismicity isconcentrated on fault planes. In order to utilize the contribu-tion of the fault sources to regional seismic hazard, fouraspects of each source are examined. These are: (a) style-of-faulting, (b) location and orientation, (c) slip rate, and(d) maximum magnitude earthquake expected (Petersenet al., 2000). All faults that were included in the evaluationare judged with confidence as active faults with reported sliprates greater than or equal to 10 mm=yr; other active faultshaving slip rates less than 10 mm=yr were not included. Forthe faults below the Marmara Sea, we used fault segmenta-tion data from Le Pichon et al. (2003) and Armijo et al.(2005). The remainder of the faults was taken from the activefault map of Turkey (Saroglu et al. 1992) with the caveat thatthis map is in the process of being updated. As shown inFigure 6, the region’s complex fault system is modeled with48 fault segments and each is assumed to rupture indepen-dently. The properties of each fault segment are tabulated inTable 2.
For nonvertical faults, dip angle is an important param-eter to determine the average fault depth and the projected
Figure 6. Fault segmentation model for the Marmara region (see Table 2 for fault names and their activity rates).
Reassessment of Probabilistic Seismic Hazard in the Marmara Region 2133
distance on the grid to be used in the GMPEs. Because down-dip width and depth data for each fault are not available toaccurately determine the actual subsurface source geometry,some of the planar sources were approximated as linearsources (i.e., 90° dip is assumed for strike-slip faults). Also,10 km depth is assigned to those faults where reliable depthinformation is not available. Also listed in Table 2 arethe approximate slip-rates broadly described from GPSmeasurements because only three fault segments: Izmit,Düzce and Ganos, were studied in detail by paleoseismolo-gical methods to be able to assess the long-term slip-rates.Most of the faults that are labeled active are mainly mappedon the basis of the morphological studies and with simplespatial correlations with recent known earthquakes. Theseissues will remain as constraints on the results presented untilmore reliable data on the subsurface geometry and slip ratesfor faults become available.
In interpreting our fault segmentation model in Figure 6,which primarily relies on seismotectonic studies along withrecurrence and locations of historical events, it should be em-phasized that geometry and recurrence are not totally inde-pendent of each other. If a fault is modeled with several smallsegments instead of fewer large segments, the maximummagnitude will be lower, and a given slip-rate will requiremany more small earthquakes to accommodate a cumulativeseismic moment.
For the segmented fault sourcemodel, available historicaland instrumented data are not sufficient to determine whetherthe GR model or characteristic earthquake (CE) model or hy-brid model (Youngs and Coppersmith, 1985) is more appro-
priate. Therefore, two different models (GR and CE) wereplacedwithin the logic treewith equalweights. In the CEmod-el, each of the fault segments considered is assumed to be ca-pable of rupturing independently andproducing themaximummagnitude earthquake (Mmax) based on fault length andpoten-tial rupture depth (Aki, 1983; Schwartz and Coppersmith,1984). It should be noted that Mmax denotes the maximumcharacteristic magnitude.Mmax for each fault segment is com-puted through empirical relations (Wells and Coppersmith,1994) and cross-checked with the neighborhood historicalevents. To account for the uncertainties in Mmax values,Mmax is allowed to float along each fault segment in three lim-its as Mmax � σ, Mmax, Mmax � σ, and σ is the dispersion instatistical modeling of Mmax and taken as 0.3 on the basis ofWells and Coppersmith (1994).
For the faults, we used the following seismic momentformula to find the activity rate of the characteristic event,i.e., number of earthquake per year or reciprocal of its recur-rence interval from
M0 � μAD; (5)
where M0 is the seismic moment of the characteristic earth-quake. The rigidity or shear modulus of the crust is repre-sented by μ and is taken as 3:0 × 1011 dyne=cm2. A is thearea of the rupture plane (in cm2), and D is the slip on theplane (in cm). Time derivative of equation (5) results in amoment rate as a function of slip-rate
M00 � μAS; (6)
Table 2Characteristic Attributes of Fault Segmentation Model
FaultSegment
Length(km)
CharacteristicEvent (M)
Slip-Rate(mm=yr)
Activity Rate(Earthquake/yr)
FaultSegment
Length(km)
CharacteristicEvent (M)
Slip-Rate(mm=yr)
Activity Rate(Earthquake/yr)
F1 45 7.0 20 0.0073 F25 31 6.8 20 0.0095F2 48 7.0 20 0.0070 F26 44 7.0 20 0.0074F3 82 7.3 20 0.0049 F27 42 7.0 20 0.0077F4 31 6.8 20 0.0094 F28 51 7.1 23 0.0077F5 36 6.9 20 0.0085 F29 62 7.2 23 0.0068F6 22 6.7 20 0.0119 F30 51 7.1 23 0.0077F7 28 6.8 20 0.0101 F31 20 6.6 23 0.0148F8 63 7.2 20 0.0058 F32 16 6.5 20 0.0150F9 58 7.1 20 0.0062 F33 57 7.1 20 0.0062
F10 40 7.0 20 0.0079 F34 20 6.6 20 0.0128F11 28 6.8 20 0.0101 F35 41 7.0 20 0.0077F12 46 7.0 20 0.0072 F36 36 6.9 20 0.0085F13 21 6.6 20 0.0121 F37 112 7.5 23 0.0045F14 29 6.8 20 0.0099 F38 36 6.9 18 0.0076F15 21 6.7 20 0.0121 F39 15 6.5 18 0.0140F16 66 7.2 20 0.0056 F40 37 6.9 18 0.0075F17 21 6.6 20 0.0122 F41 30 6.8 18 0.0088F18 21 6.6 20 0.0124 F42 10 6.3 18 0.0185F19 90 7.3 20 0.0046 F43 20 6.6 15 0.0096F20 26 6.7 20 0.0107 F44 22 6.7 15 0.0089F21 19 6.6 20 0.0133 F45 15 6.5 15 0.0116F22 23 6.7 20 0.0114 F46 20 6.6 15 0.0096F23 49 7.1 10 0.0034 F47 30 6.8 20 0.0097F24 33 6.9 10 0.0045 F48 46 7.0 20 0.0072
2134 E. Kalkan, P. Gülkan, N. Yilmaz, and M. Çelebi
whereM00 is the moment rate, and S is the slip rate. The seis-
mic moment can be obtained through moment magnitude,M, from the relation given by Hanks and Kanamori (1979)
M � 2=3 logM0 � 10:7 (7)
By rewriting equation (7), we obtain seismic moment as
log10�M0� � 1:5M� 16:05 (8)
and the activity rate of earthquakes above a minimum mag-nitude, Mmin, from
N�Mmin� �μAS
mean�M0=earthquake�(9)
On the basis of these formulas, the activity rate for each faultsegment was computed and is listed in Table 2.
The GR model requires computation of a value for eachfault segment, therefore, buffer zoneswith radius of 10–15 kmwere introduced around each fault segment, and events withineach zone were counted. If one event was counted for onebuffer zone, it was not included in any other zones althoughit might fall within their radius.
Ground-Motion-Prediction Equations
In the post-1999 period, many ground motion recordswere recorded in Turkey. These new data were combinedwith the existing national ground motion library to developa GMPE to be used for regional hazard assessments (Gülkanand Kalkan, 2002). The GMPE of Gülkan and Kalkan has thesame functional form as the GMPE of Boore et al. (1997) butwith different coefficients; this model was updated later by
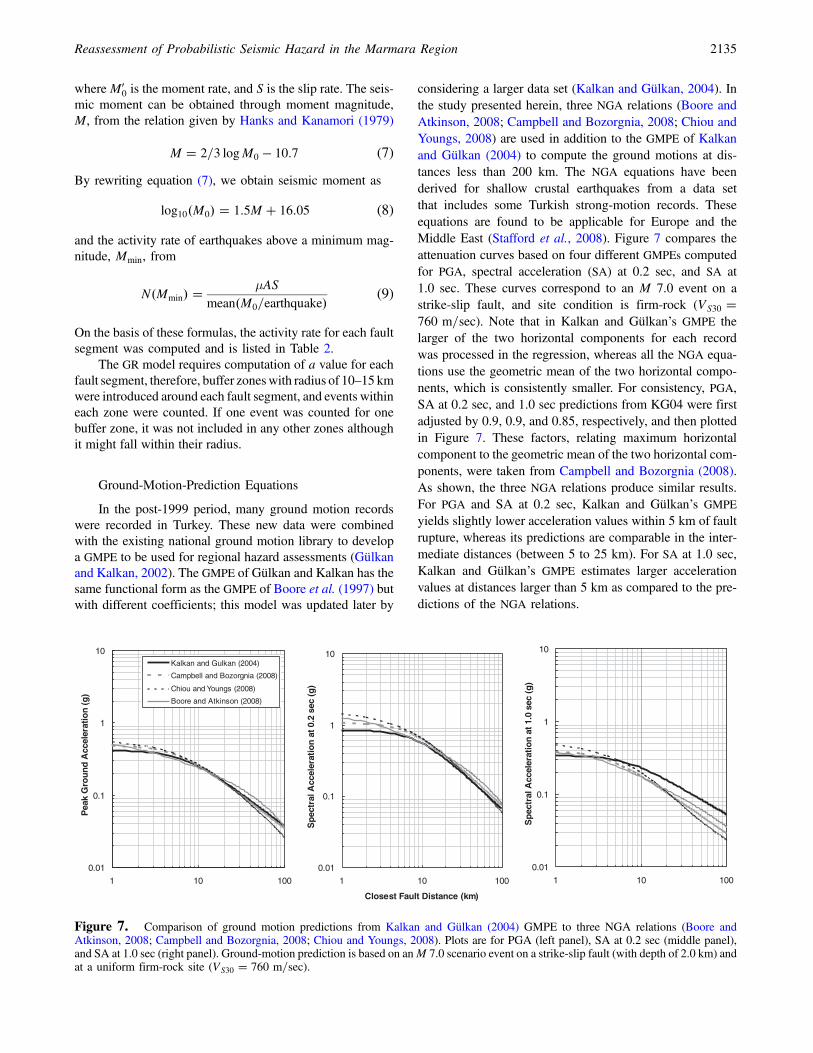
considering a larger data set (Kalkan and Gülkan, 2004). Inthe study presented herein, three NGA relations (Boore andAtkinson, 2008; Campbell and Bozorgnia, 2008; Chiou andYoungs, 2008) are used in addition to the GMPE of Kalkanand Gülkan (2004) to compute the ground motions at dis-tances less than 200 km. The NGA equations have beenderived for shallow crustal earthquakes from a data setthat includes some Turkish strong-motion records. Theseequations are found to be applicable for Europe and theMiddle East (Stafford et al., 2008). Figure 7 compares theattenuation curves based on four different GMPEs computedfor PGA, spectral acceleration (SA) at 0.2 sec, and SA at1.0 sec. These curves correspond to an M 7.0 event on astrike-slip fault, and site condition is firm-rock (VS30 �760 m=sec). Note that in Kalkan and Gülkan’s GMPE thelarger of the two horizontal components for each recordwas processed in the regression, whereas all the NGA equa-tions use the geometric mean of the two horizontal compo-nents, which is consistently smaller. For consistency, PGA,SA at 0.2 sec, and 1.0 sec predictions from KG04 were firstadjusted by 0.9, 0.9, and 0.85, respectively, and then plottedin Figure 7. These factors, relating maximum horizontalcomponent to the geometric mean of the two horizontal com-ponents, were taken from Campbell and Bozorgnia (2008).As shown, the three NGA relations produce similar results.For PGA and SA at 0.2 sec, Kalkan and Gülkan’s GMPEyields slightly lower acceleration values within 5 km of faultrupture, whereas its predictions are comparable in the inter-mediate distances (between 5 to 25 km). For SA at 1.0 sec,Kalkan and Gülkan’s GMPE estimates larger accelerationvalues at distances larger than 5 km as compared to the pre-dictions of the NGA relations.
0.01
0.1
1
10
1 10 100
Pea
k G
rou
nd
Acc
eler
atio
n (
g)
Kalkan and Gulkan (2004)
Campbell and Bozorgnia (2008)
Chiou and Youngs (2008)
Boore and Atkinson (2008)
0.01
0.1
1
10
1 10 100
Closest Fault Distance (km)
Sp
ectr
al A
ccel
erat
ion
at
0.2
sec
(g)
0.01
0.1
1
10
1 10 100
Sp
ectr
al A
ccel
erat
ion
at
1.0
sec
(g)
Figure 7. Comparison of ground motion predictions from Kalkan and Gülkan (2004) GMPE to three NGA relations (Boore andAtkinson, 2008; Campbell and Bozorgnia, 2008; Chiou and Youngs, 2008). Plots are for PGA (left panel), SA at 0.2 sec (middle panel),and SA at 1.0 sec (right panel). Ground-motion prediction is based on anM 7.0 scenario event on a strike-slip fault (with depth of 2.0 km) andat a uniform firm-rock site (VS30 � 760 m=sec).
Reassessment of Probabilistic Seismic Hazard in the Marmara Region 2135
Logic Tree
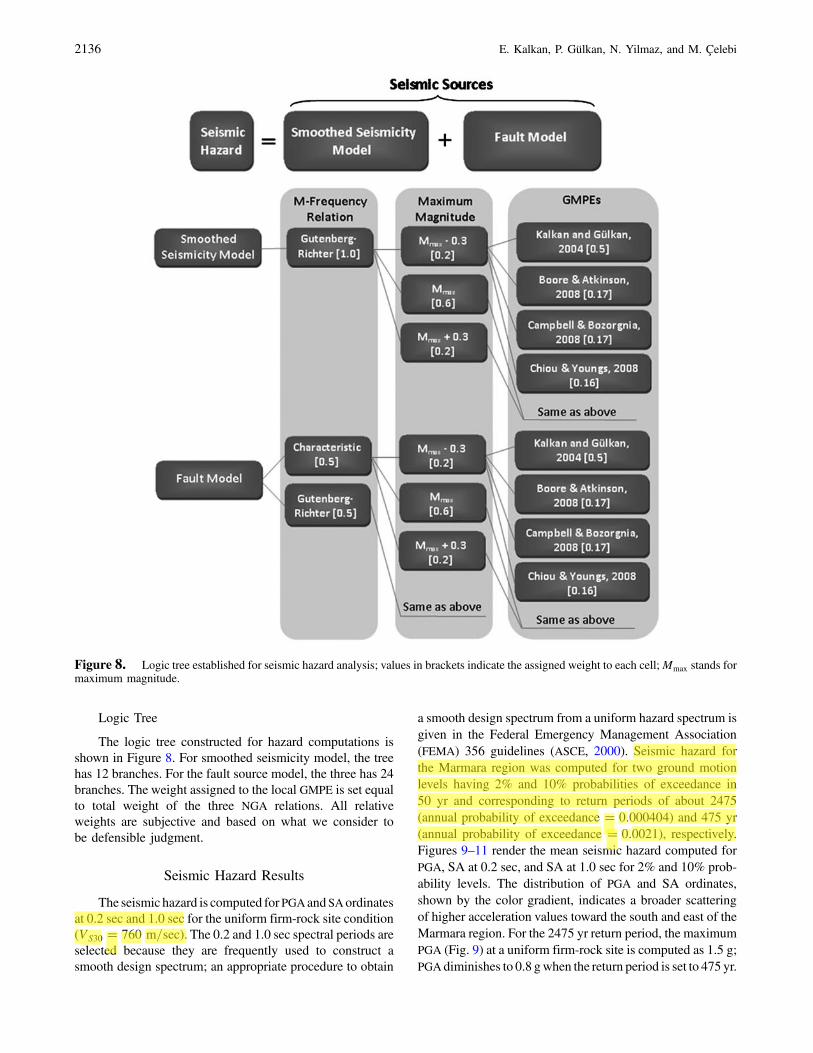
The logic tree constructed for hazard computations isshown in Figure 8. For smoothed seismicity model, the treehas 12 branches. For the fault source model, the three has 24branches. The weight assigned to the local GMPE is set equalto total weight of the three NGA relations. All relativeweights are subjective and based on what we consider tobe defensible judgment.
Seismic Hazard Results
The seismic hazard is computed for PGAand SAordinatesat 0.2 sec and 1.0 sec for the uniform firm-rock site condition(VS30 � 760 m=sec). The 0.2 and 1.0 sec spectral periods areselected because they are frequently used to construct asmooth design spectrum; an appropriate procedure to obtain
a smooth design spectrum from a uniform hazard spectrum isgiven in the Federal Emergency Management Association(FEMA) 356 guidelines (ASCE, 2000). Seismic hazard forthe Marmara region was computed for two ground motionlevels having 2% and 10% probabilities of exceedance in50 yr and corresponding to return periods of about 2475(annual probability of exceedance � 0:000404) and 475 yr(annual probability of exceedance � 0:0021), respectively.Figures 9–11 render the mean seismic hazard computed forPGA, SA at 0.2 sec, and SA at 1.0 sec for 2% and 10% prob-ability levels. The distribution of PGA and SA ordinates,shown by the color gradient, indicates a broader scatteringof higher acceleration values toward the south and east of theMarmara region. For the 2475 yr return period, the maximumPGA (Fig. 9) at a uniform firm-rock site is computed as 1.5 g;PGAdiminishes to 0.8 gwhen the return period is set to 475 yr.
Figure 8. Logic tree established for seismic hazard analysis; values in brackets indicate the assigned weight to each cell;Mmax stands formaximum magnitude.
2136 E. Kalkan, P. Gülkan, N. Yilmaz, and M. Çelebi
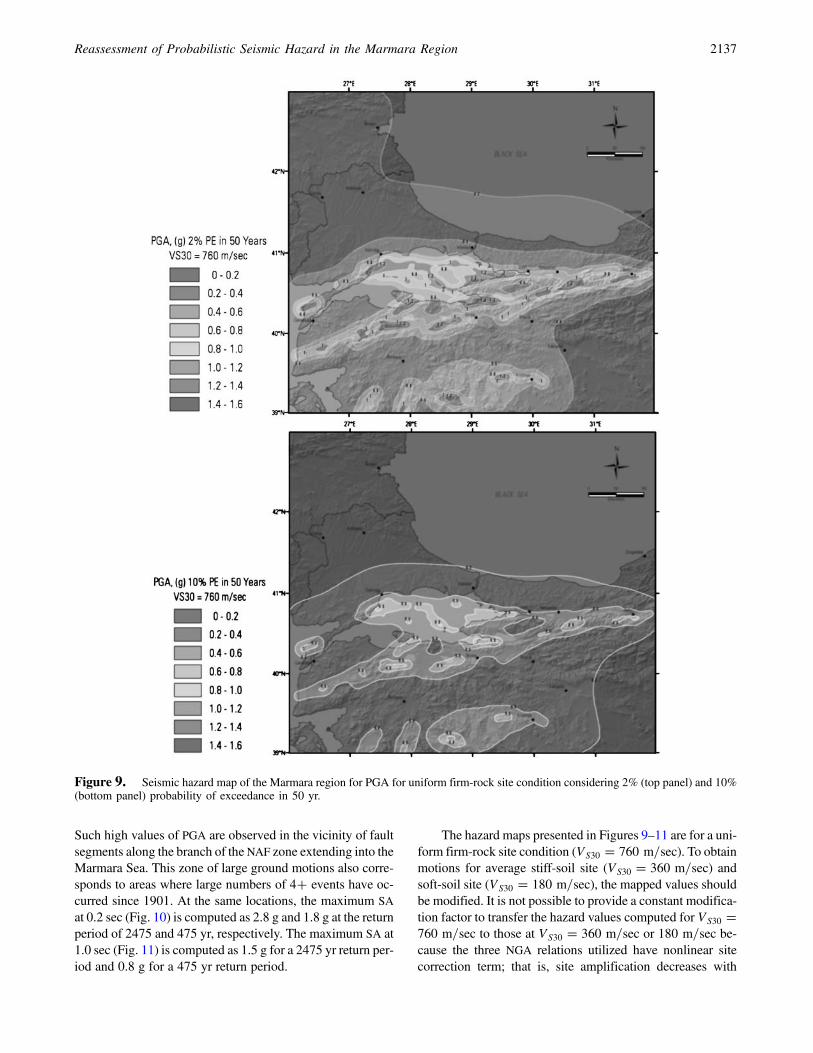
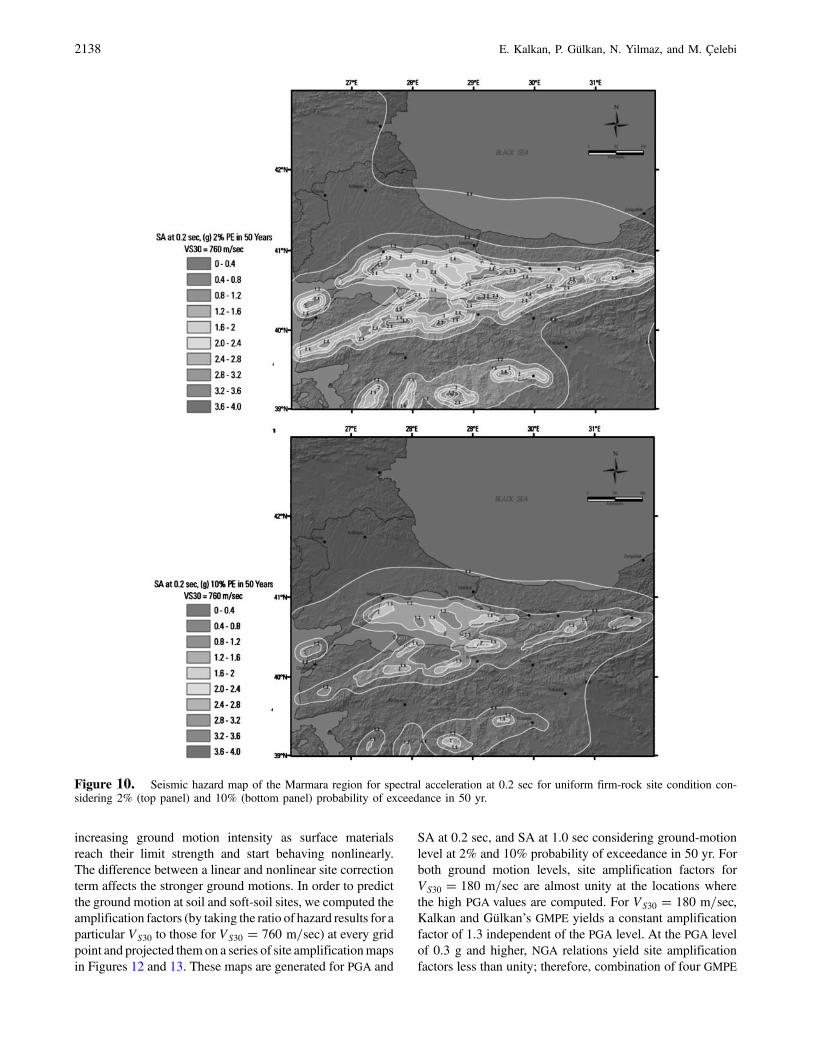
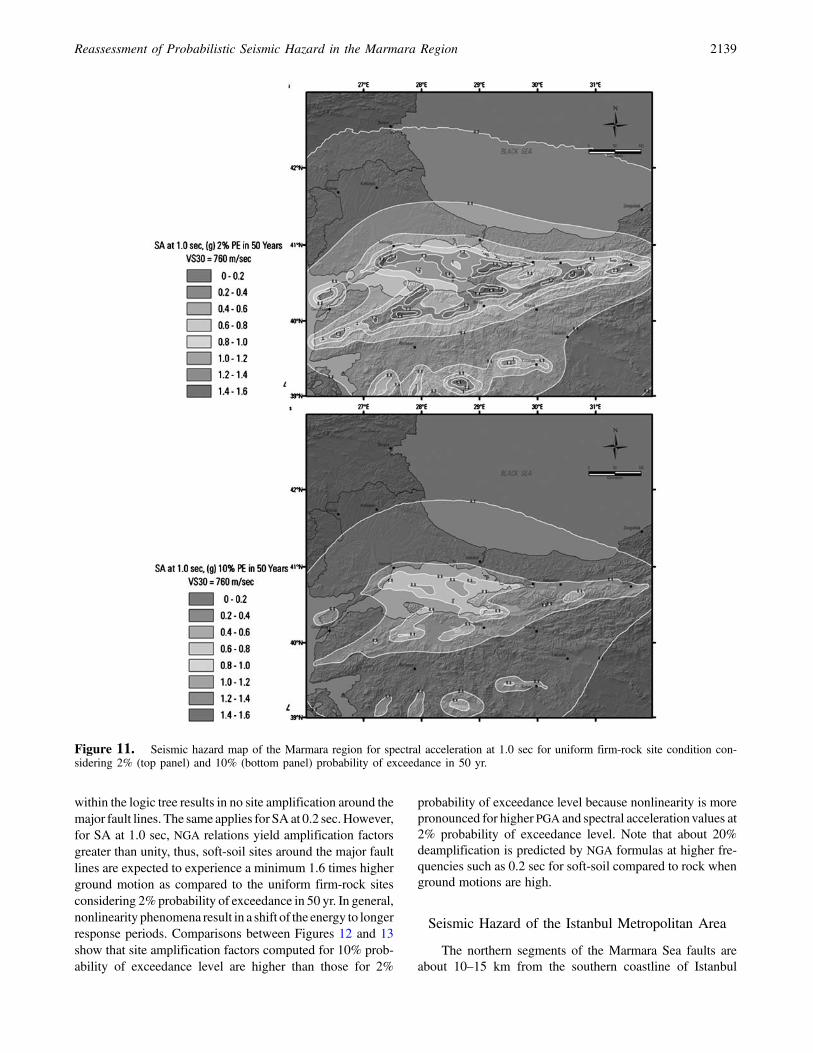
Such high values of PGA are observed in the vicinity of faultsegments along the branch of the NAF zone extending into theMarmara Sea. This zone of large ground motions also corre-sponds to areas where large numbers of 4� events have oc-curred since 1901. At the same locations, the maximum SAat 0.2 sec (Fig. 10) is computed as 2.8 g and 1.8 g at the returnperiod of 2475 and 475 yr, respectively. The maximum SA at1.0 sec (Fig. 11) is computed as 1.5 g for a 2475 yr return per-iod and 0.8 g for a 475 yr return period.
The hazard maps presented in Figures 9–11 are for a uni-form firm-rock site condition (VS30 � 760 m=sec). To obtainmotions for average stiff-soil site (VS30 � 360 m=sec) andsoft-soil site (VS30 � 180 m=sec), the mapped values shouldbe modified. It is not possible to provide a constant modifica-tion factor to transfer the hazard values computed for VS30 �760 m=sec to those at VS30 � 360 m=sec or 180 m=sec be-cause the three NGA relations utilized have nonlinear sitecorrection term; that is, site amplification decreases with
Figure 9. Seismic hazard map of the Marmara region for PGA for uniform firm-rock site condition considering 2% (top panel) and 10%(bottom panel) probability of exceedance in 50 yr.
Reassessment of Probabilistic Seismic Hazard in the Marmara Region 2137
increasing ground motion intensity as surface materialsreach their limit strength and start behaving nonlinearly.The difference between a linear and nonlinear site correctionterm affects the stronger ground motions. In order to predictthe ground motion at soil and soft-soil sites, we computed theamplification factors (by taking the ratio of hazard results for aparticular VS30 to those for VS30 � 760 m=sec) at every gridpoint and projected them on a series of site amplificationmapsin Figures 12 and 13. These maps are generated for PGA and
SA at 0.2 sec, and SA at 1.0 sec considering ground-motionlevel at 2% and 10% probability of exceedance in 50 yr. Forboth ground motion levels, site amplification factors forVS30 � 180 m=sec are almost unity at the locations wherethe high PGA values are computed. For VS30 � 180 m=sec,Kalkan and Gülkan’s GMPE yields a constant amplificationfactor of 1.3 independent of the PGA level. At the PGA levelof 0.3 g and higher, NGA relations yield site amplificationfactors less than unity; therefore, combination of four GMPE
Figure 10. Seismic hazard map of the Marmara region for spectral acceleration at 0.2 sec for uniform firm-rock site condition con-sidering 2% (top panel) and 10% (bottom panel) probability of exceedance in 50 yr.
2138 E. Kalkan, P. Gülkan, N. Yilmaz, and M. Çelebi
within the logic tree results in no site amplification around themajor fault lines. The same applies for SA at 0.2 sec.However,for SA at 1.0 sec, NGA relations yield amplification factorsgreater than unity, thus, soft-soil sites around the major faultlines are expected to experience a minimum 1.6 times higherground motion as compared to the uniform firm-rock sitesconsidering 2%probability of exceedance in 50 yr. In general,nonlinearity phenomena result in a shift of the energy to longerresponse periods. Comparisons between Figures 12 and 13show that site amplification factors computed for 10% prob-ability of exceedance level are higher than those for 2%
probability of exceedance level because nonlinearity is morepronounced for higher PGA and spectral accelerationvalues at2% probability of exceedance level. Note that about 20%deamplification is predicted by NGA formulas at higher fre-quencies such as 0.2 sec for soft-soil compared to rock whenground motions are high.
Seismic Hazard of the Istanbul Metropolitan Area
The northern segments of the Marmara Sea faults areabout 10–15 km from the southern coastline of Istanbul
Figure 11. Seismic hazard map of the Marmara region for spectral acceleration at 1.0 sec for uniform firm-rock site condition con-sidering 2% (top panel) and 10% (bottom panel) probability of exceedance in 50 yr.
Reassessment of Probabilistic Seismic Hazard in the Marmara Region 2139
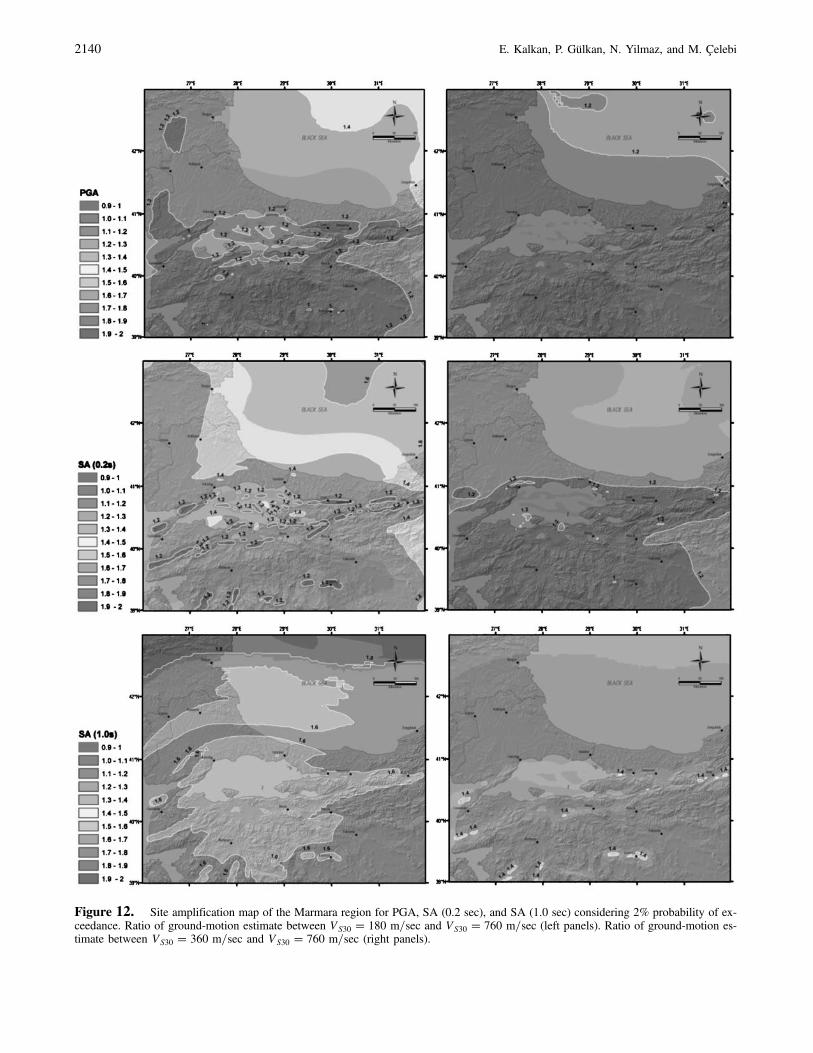
Figure 12. Site amplification map of the Marmara region for PGA, SA (0.2 sec), and SA (1.0 sec) considering 2% probability of ex-ceedance. Ratio of ground-motion estimate between VS30 � 180 m=sec and VS30 � 760 m=sec (left panels). Ratio of ground-motion es-timate between VS30 � 360 m=sec and VS30 � 760 m=sec (right panels).
2140 E. Kalkan, P. Gülkan, N. Yilmaz, and M. Çelebi
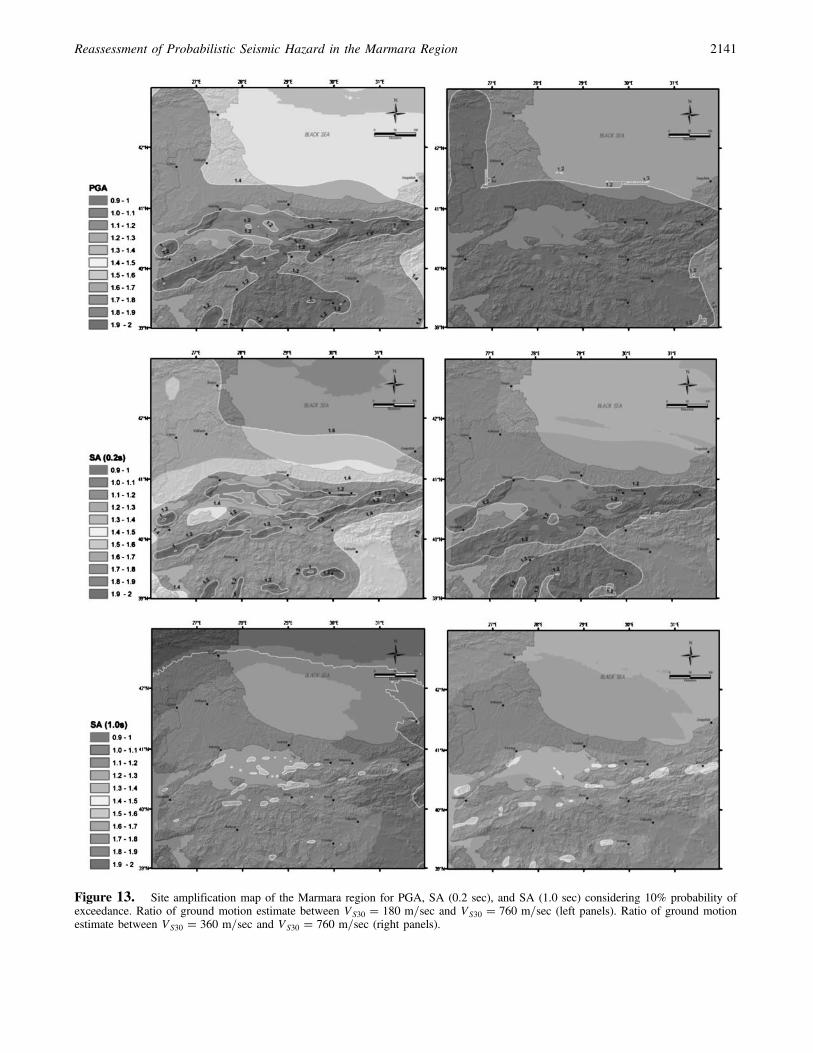
Figure 13. Site amplification map of the Marmara region for PGA, SA (0.2 sec), and SA (1.0 sec) considering 10% probability ofexceedance. Ratio of ground motion estimate between VS30 � 180 m=sec and VS30 � 760 m=sec (left panels). Ratio of ground motionestimate between VS30 � 360 m=sec and VS30 � 760 m=sec (right panels).
Reassessment of Probabilistic Seismic Hazard in the Marmara Region 2141
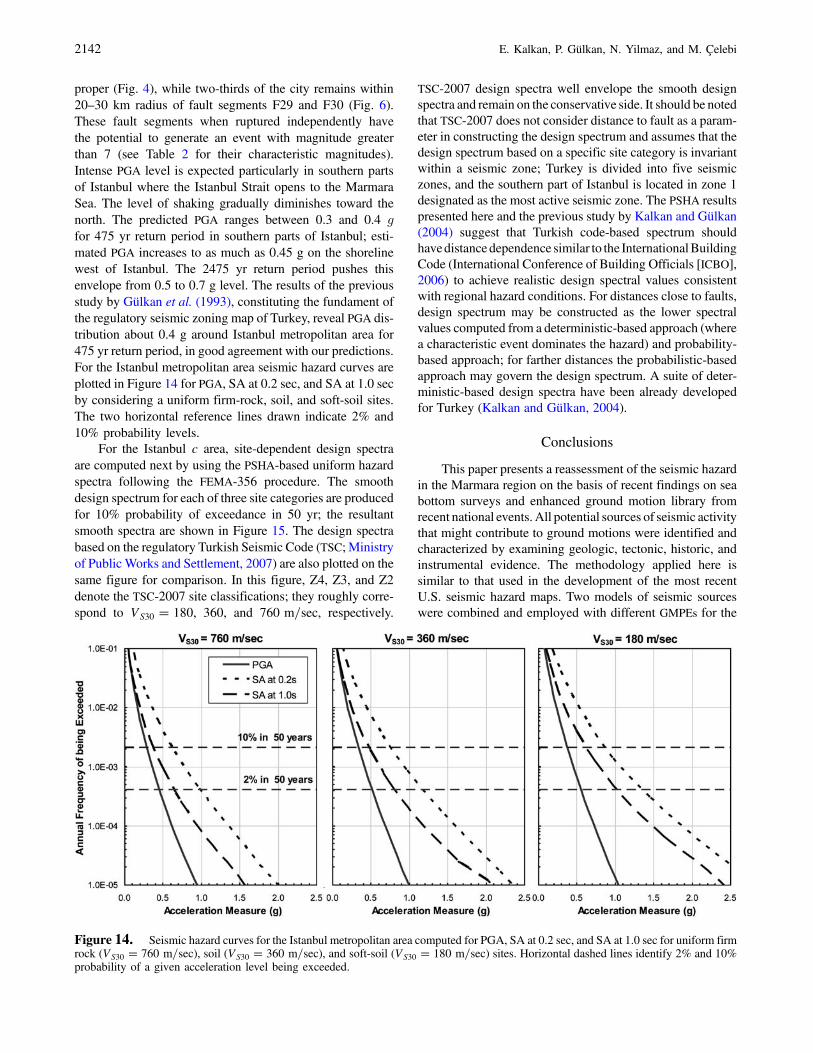
proper (Fig. 4), while two-thirds of the city remains within20–30 km radius of fault segments F29 and F30 (Fig. 6).These fault segments when ruptured independently havethe potential to generate an event with magnitude greaterthan 7 (see Table 2 for their characteristic magnitudes).Intense PGA level is expected particularly in southern partsof Istanbul where the Istanbul Strait opens to the MarmaraSea. The level of shaking gradually diminishes toward thenorth. The predicted PGA ranges between 0.3 and 0.4 gfor 475 yr return period in southern parts of Istanbul; esti-mated PGA increases to as much as 0.45 g on the shorelinewest of Istanbul. The 2475 yr return period pushes thisenvelope from 0.5 to 0.7 g level. The results of the previousstudy by Gülkan et al. (1993), constituting the fundament ofthe regulatory seismic zoning map of Turkey, reveal PGA dis-tribution about 0.4 g around Istanbul metropolitan area for475 yr return period, in good agreement with our predictions.For the Istanbul metropolitan area seismic hazard curves areplotted in Figure 14 for PGA, SA at 0.2 sec, and SA at 1.0 secby considering a uniform firm-rock, soil, and soft-soil sites.The two horizontal reference lines drawn indicate 2% and10% probability levels.
For the Istanbul c area, site-dependent design spectraare computed next by using the PSHA-based uniform hazardspectra following the FEMA-356 procedure. The smoothdesign spectrum for each of three site categories are producedfor 10% probability of exceedance in 50 yr; the resultantsmooth spectra are shown in Figure 15. The design spectrabased on the regulatory Turkish Seismic Code (TSC; Ministryof Public Works and Settlement, 2007) are also plotted on thesame figure for comparison. In this figure, Z4, Z3, and Z2denote the TSC-2007 site classifications; they roughly corre-spond to VS30 � 180, 360, and 760 m=sec, respectively.
TSC-2007 design spectra well envelope the smooth designspectra and remain on the conservative side. It should be notedthat TSC-2007 does not consider distance to fault as a param-eter in constructing the design spectrum and assumes that thedesign spectrum based on a specific site category is invariantwithin a seismic zone; Turkey is divided into five seismiczones, and the southern part of Istanbul is located in zone 1designated as the most active seismic zone. The PSHA resultspresented here and the previous study by Kalkan and Gülkan(2004) suggest that Turkish code-based spectrum shouldhavedistancedependence similar to the InternationalBuildingCode (International Conference of Building Officials [ICBO],2006) to achieve realistic design spectral values consistentwith regional hazard conditions. For distances close to faults,design spectrum may be constructed as the lower spectralvalues computed from a deterministic-based approach (wherea characteristic event dominates the hazard) and probability-based approach; for farther distances the probabilistic-basedapproach may govern the design spectrum. A suite of deter-ministic-based design spectra have been already developedfor Turkey (Kalkan and Gülkan, 2004).
Conclusions
This paper presents a reassessment of the seismic hazardin the Marmara region on the basis of recent findings on seabottom surveys and enhanced ground motion library fromrecent national events. All potential sources of seismic activitythat might contribute to ground motions were identified andcharacterized by examining geologic, tectonic, historic, andinstrumental evidence. The methodology applied here issimilar to that used in the development of the most recentU.S. seismic hazard maps. Two models of seismic sourceswere combined and employed with different GMPEs for the
Figure 14. Seismic hazard curves for the Istanbul metropolitan area computed for PGA, SA at 0.2 sec, and SA at 1.0 sec for uniform firmrock (VS30 � 760 m=sec), soil (VS30 � 360 m=sec), and soft-soil (VS30 � 180 m=sec) sites. Horizontal dashed lines identify 2% and 10%probability of a given acceleration level being exceeded.
2142 E. Kalkan, P. Gülkan, N. Yilmaz, and M. Çelebi
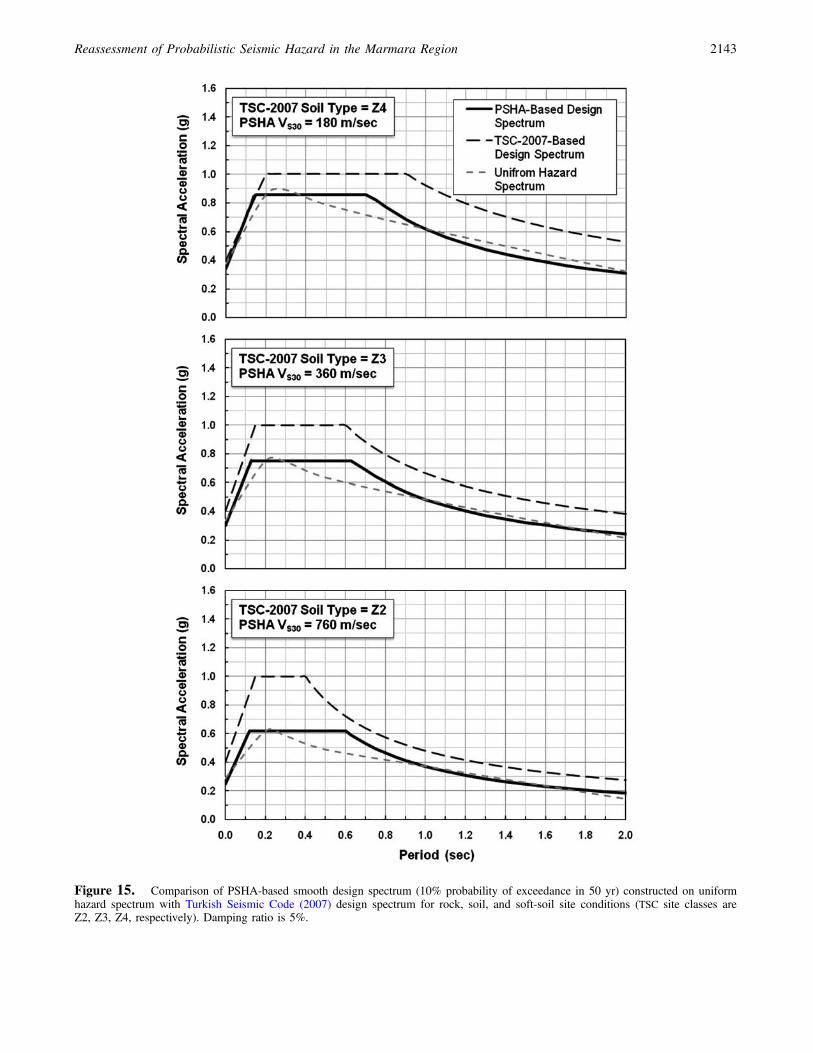
Figure 15. Comparison of PSHA-based smooth design spectrum (10% probability of exceedance in 50 yr) constructed on uniformhazard spectrum with Turkish Seismic Code (2007) design spectrum for rock, soil, and soft-soil site conditions (TSC site classes areZ2, Z3, Z4, respectively). Damping ratio is 5%.
Reassessment of Probabilistic Seismic Hazard in the Marmara Region 2143
assessment of hazard quantified in terms of peak ground ac-celeration and spectral accelerations at 0.2 and1.0 secwith 2%and 10% probability of exceedance in 50 yr. Confidence oftime-dependent models is inevitably hampered by short-termcompleteness of the earthquake catalog, and as a result tem-poral occurrence of earthquakes was assumed to be Poisso-nian; because of that our model represents an upper boundcompared to time-dependentmodels. Hazardmapswere com-puted for generic rock site conditions; for soil and soft-soilsites, a set of amplification maps is provided.
The reliability of the hazard analyses conducted heredepends primarily on precision with which uncertainty inmagnitude, epicenter, recurrence, fault segmentation, andtheir cross effects can be identified and characterized. Forinstance, the maximum magnitude at each fault segmentwas estimated from the fault length and approximate sliprates. In order to account for the associated uncertainties,maximum magnitude is allowed to float along each faultsegment. This treatment results in enhanced hazard levelespecially for long return periods (e.g., 2475 yr), while itsinfluence remains marginal for short return periods (e.g.,475 yr). The uncertainty in recurrence is also a factor becauseof the many big events in the 1999–present period. We haveignored the faults with less than 10 mm=yr average slip. Inaddition, we did not model faults as unsegmented as anotherbranch in the logic tree. Considering them in PSHA mayincrease the hazard in the region.
Results in this study show that for the 475 yr returnperiod, PGAmay reach to asmuch as a 0.4 g level in the south-ern areas of Istanbul and the Yalova region and 0.5 g levelaround the shoreline to the west of the metropolitan area ata closest distance of about 10 km to the active MarmaraSea faults. PGA increases to the 0.8 g level at much closerdistances near the fault segments. In the Istanbul downtownarea, the average PGA is expected to measure at 0.4 g for10% probability of exceedance in the next 50 yr. Our analysesfor the Istanbul metropolitan area lack very fine grid-spacing,and the results presented herein are intended to give a generalperspective on the anticipated level of shaking.
The principal differences of the study described here andthe previous studies focused on the Marmara region (e.g.,Atakan et al., 2002; Erdik et al., 2004) are that the GMPEdeveloped from indigenous sources has been given prepon-derance in the weighting. The characteristics attributed to theseismogenic sources and use of NGA relations are also majorimprovements. The new maps (Figs. 9–11) generally show10% to 15% increase for PGA, 0.2 sec, and 1.0 sec spectralacceleration across much of Marmara compared to previousregional hazard maps.
The seismic hazard maps provided here are intended toshed some light on future assessments of risk to structures inthe defined Marmara region and, we hope, serve as a remind-er to improve design and construction practices to minimizelosses of life and property.
Data and Resources
Digital data of hazard curves for the entire Marmararegion including the Istanbul metropolitan area and hazardmaps presented herein can beviewed in color and downloadedfromwww.erolkalkan.com/Marmara_Research (last accessedJune 2009). Seismic hazard maps are also integrated with the3D-Earth model at www.erolkalkan.com/MIM (last accessedJune 2009) to provide an interactive interface. Events that usedifferent intensity scales compiled from different sources arethe Earthquake Research Department, General Directorate ofDisaster Affairs of Turkey (http://angora.deprem.gov.tr/ivmekataloglaren.htm, last accessed June 2009); KandilliObservatory, Boğaziçi University (http://www.koeri.boun.edu.tr/sismo/Mudim/katalog.asp, last accessed June 2009);International Seismological Centre (http://www.isc.ac.uk/doc/products/catalogue.html, last accessed June 2009); andthe U.S. Geological Survey (http://neic.usgs.gov/neis/epic/,last accessed June 2009).
Acknowledgments
Wewish to thank Tom Parsons for providing us the coordinates of faultsegments under the Marmara Sea and Steve Harmsen for his generous sup-port on the latest version of the USGS seismic hazard code and also forreviewing this article. Special thanks are extended to Luke J. Blair whoplotted the maps in a GIS environment, Thomas Holzer, Vladimir Graizer,and Tianqin Cao for their insightful reviews. Comments and suggestions byJulian J. Bommer, Fleur O. Strasser, and an anonymous reviewer were help-ful in improving the technical quality of the paper.
References
Aki, K. (1983). Seismological evidence in support of the existence of char-acteristic earthquakes, Earthquake Notes 54, 60–61.
Aksoy, M. E., M. Meghraoui, M. Ferry, Z. Çakir, S. Akyüz, V. Karabacak,and E. Altunel (2006). Fault characteristics, segmentation and paleo-seismology along the 9 August 1912 Ganos earthquake-rupture (NorthAnatolian Fault, Turkey), Geophys. Res. Abstr. 8, 10002.
Al-Tarazi, E., and E. Sandvol (2007). Alternative Models of Seismic HazardEvaluation along the Jordan—Dead Sea Transform, Earthq. Spectra32, no. 1, 1–19.
Ambraseys, N. N. (1970). Some characteristic features of the Anatolian faultzone, Tectonophysics 9, 143–165.
Ambraseys, N. N. (2002). The seismic activity of the Marmara region overthe last 2000 years, Bull. Seismol. Soc. Am. 92, no. 1, 1–18.
Ambraseys, N. N. (2006). Comparison of frequency of occurrence of earth-quakes with slip rates from long-term seismicity data: The cases ofGulf of Corinth, Marmara Sea and Dead Sea Fault Zone, Geophys.J. Int. 165, 516–526.
American Society of Civil Engineers (ASCE) (2000). Prestandard and Com-mentary for the Seismic Rehabilitation of Buildings, prepared for theSAC Joint Venture, Federal Emergency Management Agency, FEMA-356, Washington D.C.
Armijo, R., B. Meyer, S. Navarro, G. King, and A. Barka (2002). Asym-metric slip partitioning in the Marmara Sea pull-apart: A clue topropagation processes of the North Anatolian fault? Terranova 14,80–86.
Armijo, R., N. Pondard, B. Meyer, G. Üçarcus, B. Mercier de Lépinay,J. Malavieille, S. Dominguez, M.-A. Gustcher, S. Schmidt, C. Beck,N. Çağatay, Z. Cakir, C. Imren, K. Eris, B. Natalin, S. Özalaybey,L. Tolun, I. Lefèvre, L. Seeber, L. Gasperini, C. Rangin, Ö. Emre,and K. Sarikavak (2005). Submarine fault scarps in the Sea of Mar-
2144 E. Kalkan, P. Gülkan, N. Yilmaz, and M. Çelebi
mara pull-apart (North Anatolian Fault): Implications for seismic ha-zard in Istanbul, Geochem. Geophys. Geosyst. 6, no. 6, 1–29.
Atakan, K., A. Ojeda, M. Meghraoui, A. A. Barka, M. Erdik, and A. Bodare(2002). Seismic hazard in Istanbul following the 17 August 1999 Izmitand 12 November 1999 Düzce earthquakes, Bull. Seismol. Soc. Am.92, no. 1, 466–482.
Barka, A. (1992). The North Anatolian fault zone, Annales Tectonicae 6,164–195.
Barka, A., and K. Kadinsky-Cade (1988). Strike-slip fault geometry inTurkey and its influence on earthquake activity, Tectonics 7, no. 3,663–684.
Bender, B. (1983). Maximum likelihood estimation of b values for magni-tude grouped data, Bull. Seismol. Soc. Am. 73, 831–851.
Boore, D. M., and G. Atkinson (2008). Ground motion prediction equationsfor the average horizontal component of PGA, PGV, and 5%-dampedPSA at spectral periods between 0.01 s and 10.0 s, Earthq. Spectra 24,no. 1, 99–138.
Boore, D. M., W. B. Joyner, and T. E. Fumal (1997). Equations for estimat-ing horizontal response spectra and peak acceleration from westernNorth American earthquakes: A summary of recent work, Seism.Res. Lett. 68, no. 1, 128–153.
Campbell, K., and Y. Bozorgnia (2008). NGA ground motion model for thegeometric mean horizontal component of PGA, PGV, PGD and 5%damped linear elastic response spectra for periods ranging from0.01 s to 10 s, Earthquake Spectra 24, no. 1, 139–171.
Chiou, B., and R. Youngs (2008). An NGA model for the average horizontalcomponent of peak ground motion and response spectra, Earthq. Spec-tra 24, no. 1, 173–215.
Crowley, H., and J. J. Bommer (2006). Modeling seismic hazard in earth-quake loss models with spatially distributed exposure, Bull. Eq. Eng. 4,249–273.
Erdik, M., M. Demircioğlu, K. Şeşetyan, E. Durukal, and B. Siyahi (2004).Earthquake hazard in Marmara region, Turkey, Soil Dyn. Earthq. Eng.24, 605–631.
Frankel, A. (1995). Mapping seismic hazard in the Central and EasternUnited States, Seism. Res. Lett. 66, no. 4, 8–21.
Gardner, J. K., and L. Knopoff (1974). Is the sequence of earthquakes insouthern California, with aftershocks removed, Poissonian? Bull. Seis-mol. Soc. Am. 64, 1363–1367.
Gülkan, P., and E. Kalkan (2002). Attenuation modeling of recent earth-quakes in Turkey, J. Seism. 6, no. 3, 397–409.
Gülkan, P., A. Koçyiğit, M. S. Yücemen, V. Doyuran, and N. Başöz (1993).A seismic zones map of Turkey derived from recent data, Middle EastTechnical University, Earthquake Engineering Research CenterReport No. 93-01, (in Turkish).
Hanks, T. C., and H. Kanamori (1979). A moment magnitude scale, J.Geophys. Res. 84, 2348–2350.
Herrmann, R. B. (1977). Recurrence Relations, Earthquake Notes 88,47–49.
Hubert-Ferrari, A., A. A. Barka, E. Jacquess, S. S. Nalbant, B. Meyer, R.Armijo, P. Tapponier, and G. C. P. King (2000). Seismic hazard in theMarmara Sea following the Izmit earthquake, Nature 404, 269–272.
International Conference of Building Officials (ICBO) (2006). InternationalBuilding Code, Whittier, CA.
Kafka, A. L. (2002). Statistical analysis of the hypothesis that seismicitydelineates areas where future large earthquakes are likely to occurin the central and eastern United States, Seism. Res. Lett. 73, no. 6,992–1003.
Kafka, A. L., and J. R. Walcott (1998). How well does the spatial distri-bution of smaller earthquakes forecast the locations of larger earth-quakes in the northwestern United States? Seism. Res. Lett. 69,428–440.
Kalkan, E., and P. Gülkan (2004). Site-dependent spectra derivedfrom ground motion records in Turkey, Earthq. Spectra 20, no. 4,1111–1138.
Ketin, I. (1969). Uber die nordanatolische Horizontalverschiebung, Bull.Min. Res. Explor. Inst. Turkey 72, 1–28.
Le Pichon, X., A. M. C. Sengor, E. Demirbag, C. Rangin, C. Imren,R. Armijo, N. Gorur, N. Cagatay, B. Mercier de Lepinay, B. Meyer,R. Saatcilar, and B. Tok (2001). The active main Marmara fault, EarthPlanet. Sci. Lett. 192, 595–616.
Le Pichon, X., N. Chamot-Rooke, C. Rangin, and A. M. C. Sengor (2003).The North Anatolian Fault in the Marmara Sea 2003, J. Geophys. Res.B Solid Earth Planets 108, 2170–2179.
McClusky, S.27 coauthors (2000). Global Positioning System constraintson plate kinematics and dynamics in the eastern Mediterranean andCaucasus, J. Geophys. Res. 105, 5695–5719.
Ministry of Public Works and Settlement (2007). Turkish Seismic Code,Specification for Structures to be Built in Disaster Areas, Ankara,Turkey.
Motagh, M., J. Hoffmann, B. Kampes, M. Baes, and J. Zschau (2007). Strainaccumulation across the Gazikoy—Saros segment of the NorthAnatolian Fault inferred from Persistent Scatterer Interferometryand GPS measurements, Earth Planet Sci. Lett. 255, no. 30, 432–444.
Okay, A. I., A. K. Ozcan, C. Imren, A. B. Guney, E. Demirbag, and I. Kuscu(2000). Active faults and evolving strike-slip basins in the MarmaraSea, northwest Turkey: A multichannel seismic reflection study,Tectonophysics 321, 189–218.
Papazachos, B. C., and C. Papazachou (1997). The Earthquakes of Greece,ZITI Ed., Thessaloniki 304 p.
Parke, J. R., T. A. Minshull, and G. Anderson (1999). Active faults in theMarmara Sea, western Turkey, imaged by seismic reflection profiles,Terra Nova 11, 223–227.
Parsons, T. (2004). Recalculated probability of M ≥ 7 earthquakesbeneath the Marmara Sea, Turkey, J. Geophys. Res. 109, B05304,1–21.
Parsons, T., S. Toda, R. S. Stein, A. Barka, and J. H. Dieterich (2000).Heightenined odds of large earthquake near Istanbul: An interac-tion-based probability calculation, Science 288, 661–665.
Petersen, Mark D., Arthur D. Frankel, Stephen C. Harmsen, Charles S.Mueller, Kathleen M. Haller, Russell L. Wheeler, Robert L. Wesson,Yuehua Zeng, Oliver S. Boyd, David M. Perkins, Nicolas Luco,H. Field Edward, Chris J. Wills, and S. Rukstales Kenneth (2008).Documentation for the 2008 Update of the United States NationalSeismic Hazard Maps, U.S. Geol. Surv. Open-File Rept. 2008-1128, 61 p.
Petersen, M. D., T. R. Toppozada, T. Cao, C. H. Cramer, M. S. Reichle, andW. A. Bryant (2000). Active fault near-source zones within and bor-dering the State of California for the 1997 Uniform Building Code,Earthq. Spectra 16, no. 1, 69–83.
Pulido, N., A. Ojeda, K. Atakan, and T. Kubo (2004). Strong ground motionestimation in the Marmara Sea region (Turkey) based on scenarioearthquake, Tectonophysics 39, 357–374.
Saroglu, F., O. Emre, and I. Kuscu (1992). Active fault map of Turkey, Ma-den Tetkik ve Arama (in Turkish).
Schwartz, D. P., and K. J. Coppersmith (1984). Fault behavior and charac-teristic earthquakes: Examples from the Wasatch and San Andreasfault zones, J. Geophys. Res. 89, no. B7, 5681–5698.
Seeber, L., O. Emre, M. H. Cormier, C. C Sorlien, C. M. G. McHugh,A. Polonia, N. Ozer, N. Cagatay, and The team of the 2000 R/V UraniaCruise in the Marmara Sea (2004). Uplift and subsidence from obliqueslip: The Ganos Marmara bend of the North Anatolian Transform,western Turkey, Tectonophysics 391, no. 1–4, 239–258.
Smith, A. D., T. Taymaz, F. Oktay, H. Yuce, B. Alpar, H. Basaran,J. A. Jackson, S. Kara, and M. Simsek (1995). High-resolution seismicprofiling in the Marmara Sea (Northwest Turkey); Late Quaternarysedimentation and sea-level changes, Spec. Pap. Geol. Soc. Am.107, 923–936.
Stafford, P. J., F. O. Strasser, and J. J. Bommer (2008). An evaluation of theapplicability of the NGA models to ground motion prediction in theEuro-Mediterranean region, Bull. Earthquake Eng. 6, no. 2, 149–177.
Stein, R. S., A. A. Barka, and J. H. Dieterich (1997). Progressive failure onNorth Anatolian Fault since 1939 by earthquake stress triggering,Geo-phys. J. Int. 128, 594–604.
Reassessment of Probabilistic Seismic Hazard in the Marmara Region 2145
Straub, C., H-G. Kahle, and C. Schindler (1997). GPS and geologic esti-mates of the tectonic activity in the Marmara Sea region, NWAnatolia,J. Geophys. Res. 102, no. 27, 587–601.
Ulusay, R., E. Tuncay, H. Sonmez, and C. Gokceoglu (2004). An attenua-tion relationship based on Turkish strong-motion data and iso-acceleration map of Turkey, Eng. Geol. 74, no. 3–4, 265–291.
Weichert, D. H. (1980). Estimation of earthquake recurrence parameters forunequal observation periods for different magnitudes, Bull. Seismol.Soc. Am. 70, 1337–1356.
Wells, D. L., and K. J. Coppersmith (1994). New empirical relation-ships among magnitude, rupture length, rupture width, rupturearea, and surface displacement, Bull. Seismol. Soc. Am. 84, no. 4,974–1002.
Yaltirak, C. (2002). Tectonic evolution of the Marmara Sea and its surround-ings, Mar. Geol. 190, 493–529.
Yenier, E., O. Erdoğan, and S. Akkar (2008). Empirical Relationships forMagnitude and Source-To-Site Distance Conversions using Recently
Compiled Turkish Strong-Ground motion Database, The FourteenthWorld Conference on Earthquake Engineering, October 12–172008, Beijing, China.
Youngs, R. R., and K. J. Coppersmith (1985). Implications of fault slip ratesand earthquake recurrence models to probabilistic seismic hazardestimates, Bull. Seismol. Soc. Am. 75, no. 4, 939–964.
U.S. Geological SurveyWestern Region Earthquake Hazards TeamMS977, 345 Middlefield Rd.Menlo Park, California [email protected]
Manuscript received 1 November 2007
2146 E. Kalkan, P. Gülkan, N. Yilmaz, and M. Çelebi