Embed Size (px)
Citation preview
The First NIDA Business Analytics and Data Sciences Contest/Conferenceวันที่ 1-2 กันยายน 2559 ณ อาคารนวมินทราธิราช สถาบันบัณฑิตพัฒนบริหารศาสตร์
https://businessanalyticsnida.wordpress.comhttps://www.facebook.com/BusinessAnalyticsNIDA/
-ผลเลือกตั้งจะออกมาเป็นเช่นไร หากรัฐธรรมนูญผ่าน-ท านายผลการเลือกตั้งด้วย Data Sciences ได้หรือไม่-ปัจจัยด้านสังคมเศรษฐกิจ ภูมศิาสตร์ ประชากรศาสตร์ พฤติกรรมศาสตร์ ปัจจัยใดที่ท านายผลการเลือกตั้งได้ดี-พื้นที่เขตเลือกตั้งแบบใดมีแนวโน้มที่จะมบีัตรเสีย Vote No และ No Vote เพื่อไทย หรือประชาธิปัตย์-แบบจ าลองแบบไหนที่ใช้ท านายผลเลือกตั้ง สร้างได้อย่างไร
Spatial regression model predicting Thailand’s election อาจารย์ ดร. อานนท์ ศักดิ์วรวิชญ์
นางสาวรัชนีพร จันทร์สา คณะสถิติประยุกต์ NIDAนวมินทราธิราช 4001 วันที่ 2 กันยายน 2559 13.30-14.00 น.
Spatial regression model predicting
Thailand’s election result.
Arnond Sakworawich, Ph.D.
Ratchaneeporn Jansa
Graduate School of Applied Statistics
National Institute of Development Administration, Bangkok, Thailand
AbstractThe purpose of the current research are to 1) investigate the spatial relationships of voting
behaviors among each electorates, 2) investigate geographical, behavioral, socio-economic, and
demographic components related to election results, and 3) build up the spatial negative binomial
regression models predicting Thailand election results. Election results in 2005 and 2007 retrieved from Election Commission of Thailand (ECT) were used to predict % vote for no vote, vote No, voided
ballot, as well as % vote for Democrat Party, Pheu Thai Party, Chartthaipattana Party, and Bhumjaithai
Party as behavioral components for 2011 election results. Socio-economic and demographic variables
were from socio-economic status survey in 2010 from National statistical office. Geographic variables
were from department of land development and department of royal irrigation. Moran’s I statistics and
the spatial negative binomial regression model were used to investigate the spatial autocorrelation of
election results among electorates and the relationship between geographical, behavioral, socio-
economic, and demographic components and election results. This current research will shed light on
how to develop Thailand’s politics and it can also be applied for election and campaign management.
The spatial negative binomial regression model can be used to predict an incoming election results by
substitute 2011 election results with the near future election poll.
Keyword: Election, Spatial Model, geography, social, economics, demography, behavior
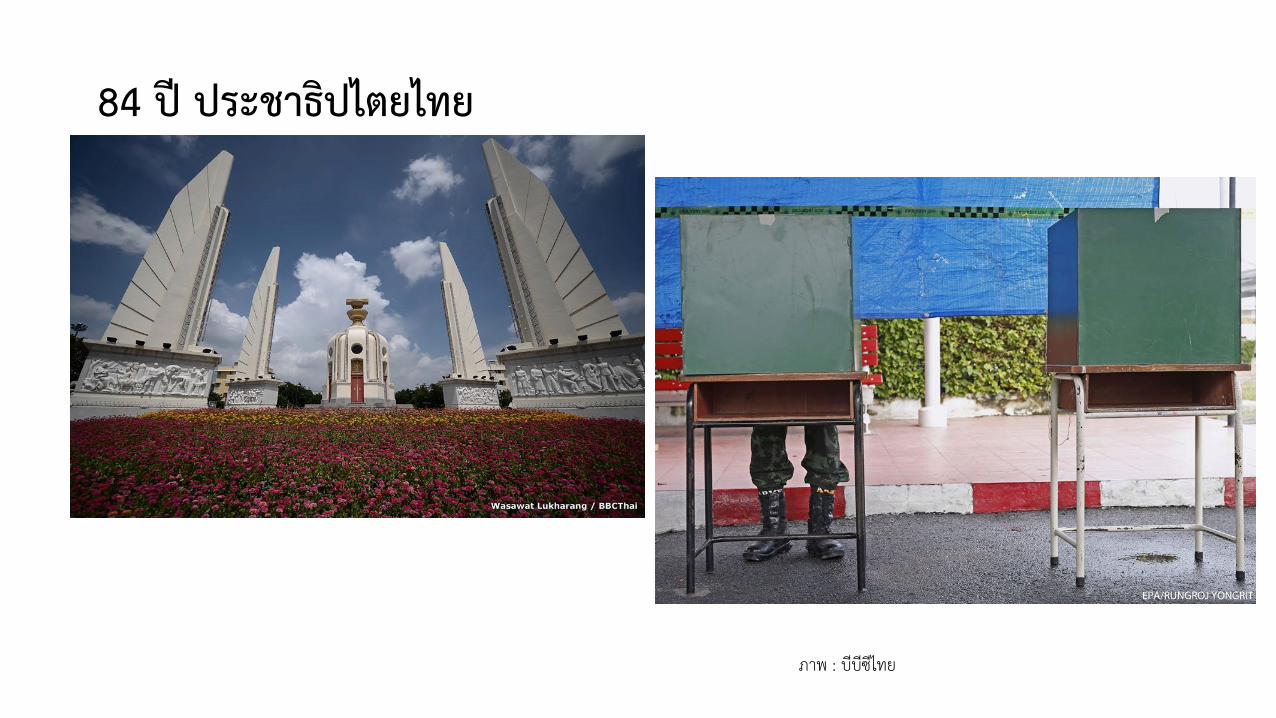
84 ปี ประชาธิปไตยไทย
ภาพ : บีบีซีไทย


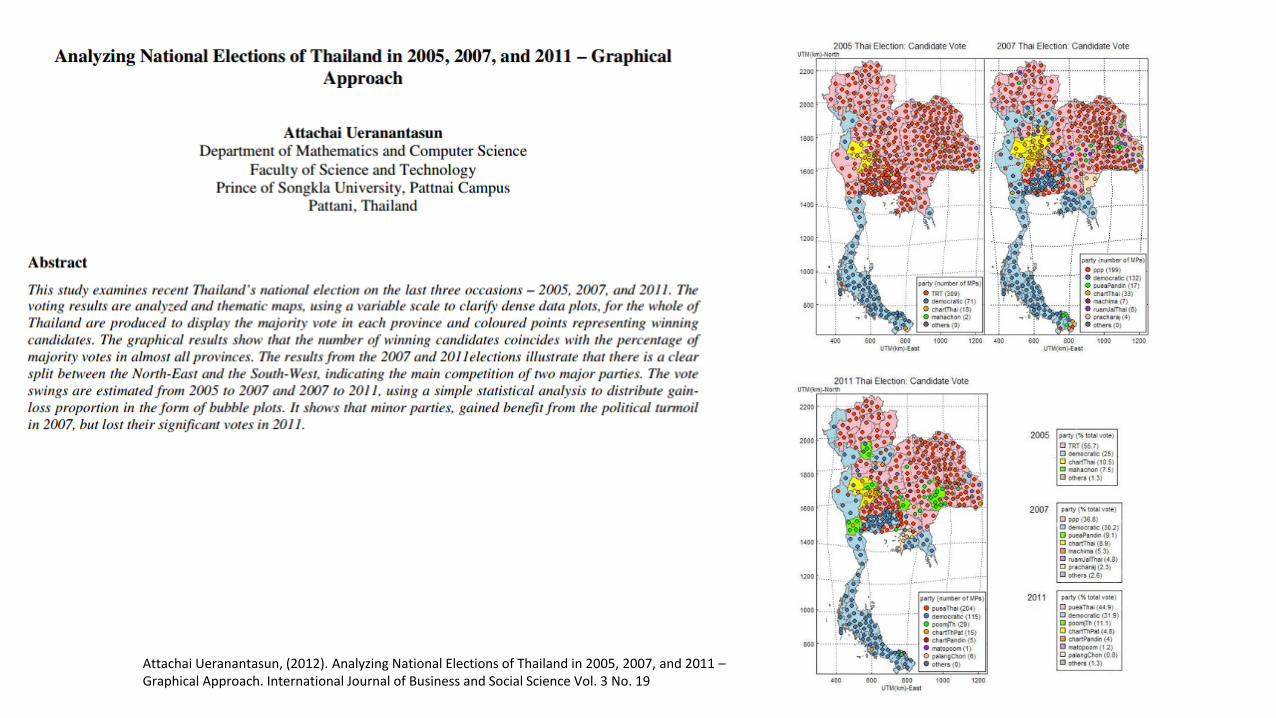
Attachai Ueranantasun, (2012). Analyzing National Elections of Thailand in 2005, 2007, and 2011 –Graphical Approach. International Journal of Business and Social Science Vol. 3 No. 19
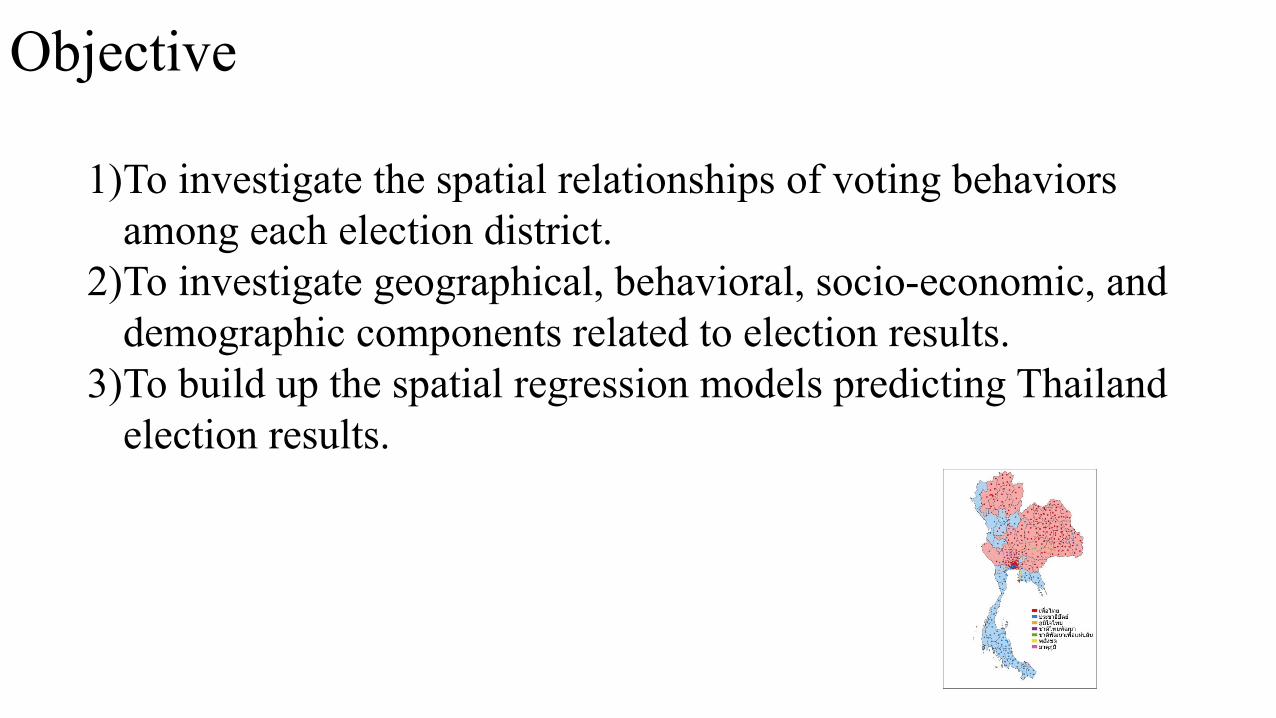
Objective
1)To investigate the spatial relationships of voting behaviors
among each election district.
2)To investigate geographical, behavioral, socio-economic, and
demographic components related to election results.
3)To build up the spatial regression models predicting Thailand
election results.
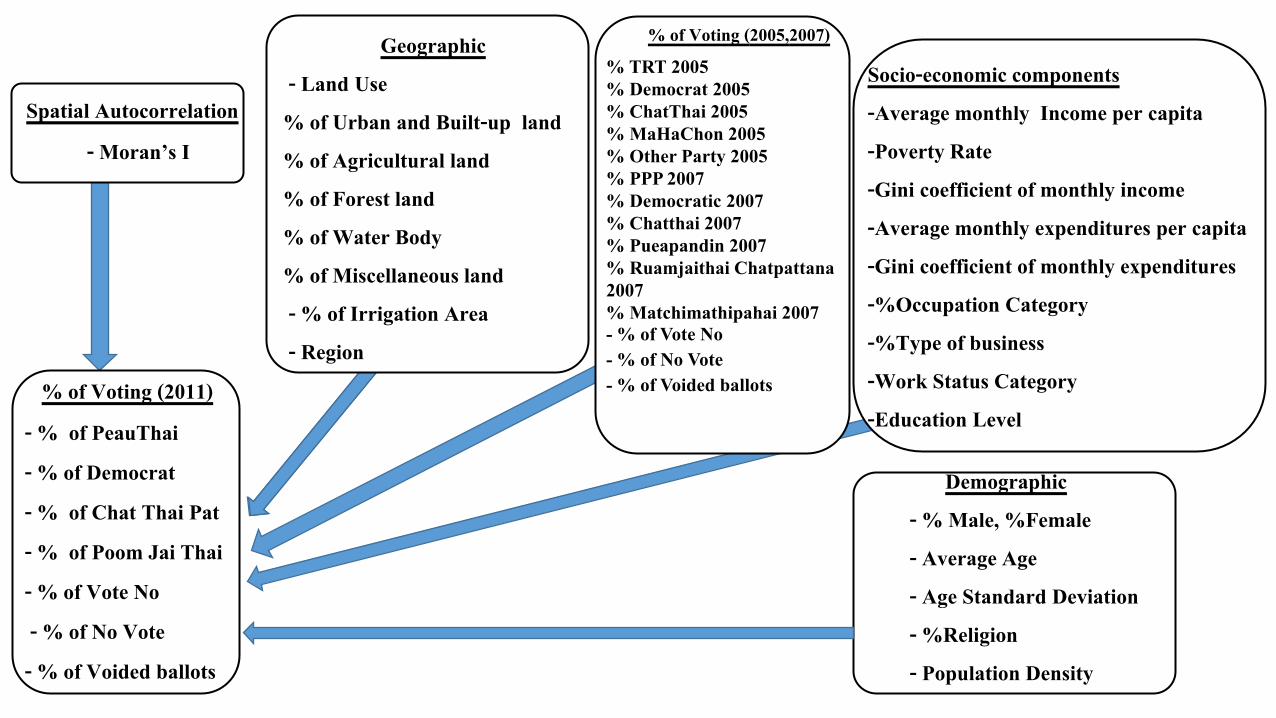
Demographic- % Male, %Female- Average Age- Age Standard Deviation- %Religion- Population Density
Socio-economic components-Average monthly Income per capita-Poverty Rate-Gini coefficient of monthly income-Average monthly expenditures per capita-Gini coefficient of monthly expenditures-%Occupation Category -%Type of business-Work Status Category-Education Level
Geographic- Land Use
% of Urban and Built-up land% of Agricultural land % of Forest land % of Water Body% of Miscellaneous land- % of Irrigation Area- Region
Spatial Autocorrelation- Moran’s I
% of Voting (2011)- % of PeauThai- % of Democrat- % of Chat Thai Pat- % of Poom Jai Thai- % of Vote No- % of No Vote
- % of Voided ballots
% of Voting (2005,2007)% TRT 2005
% Democrat 2005
% ChatThai 2005
% MaHaChon 2005
% Other Party 2005
% PPP 2007
% Democratic 2007
% Chatthai 2007
% Pueapandin 2007
% Ruamjaithai Chatpattana
2007
% Matchimathipahai 2007
- % of Vote No
- % of No Vote
- % of Voided ballots

Source of data
• Office of the Election Commission of Thailand
• National Statistical Office Thailand
• Land Development Department
• Royal Irrigation Department
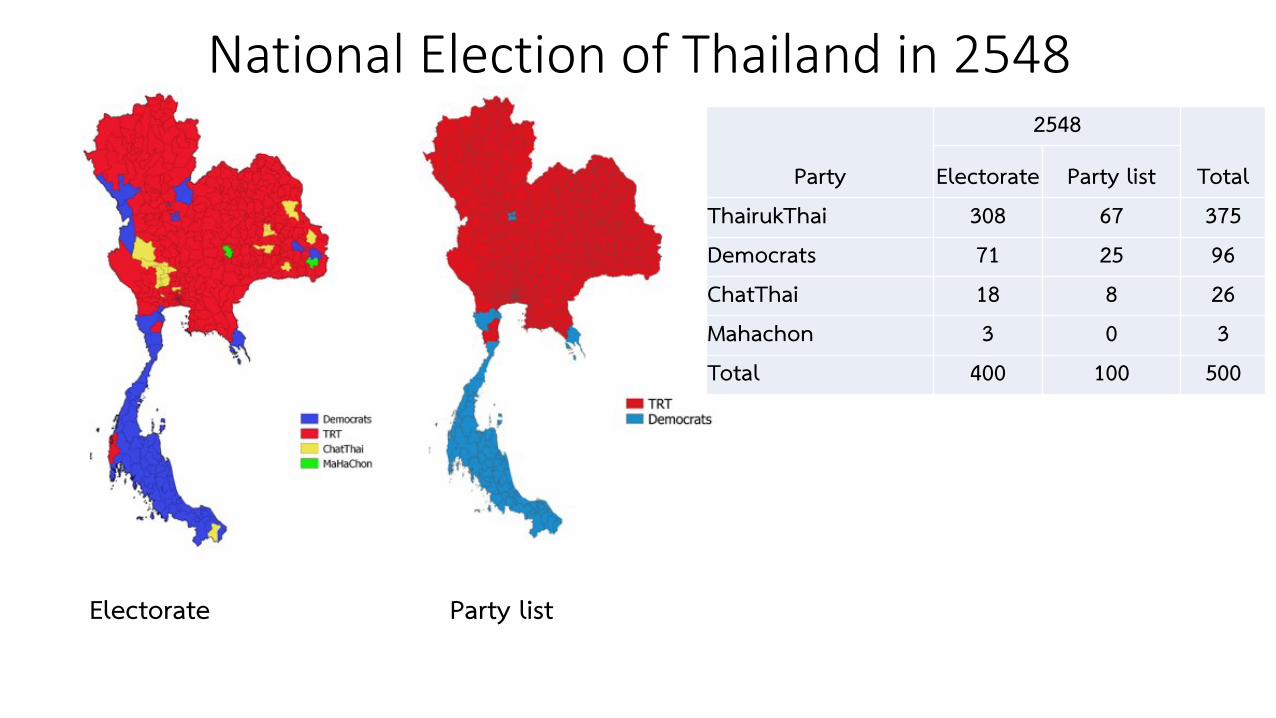
Party
2548
TotalElectorate Party listThairukThai 308 67 375Democrats 71 25 96ChatThai 18 8 26Mahachon 3 0 3Total 400 100 500
Electorate Party list
National Election of Thailand in 2548
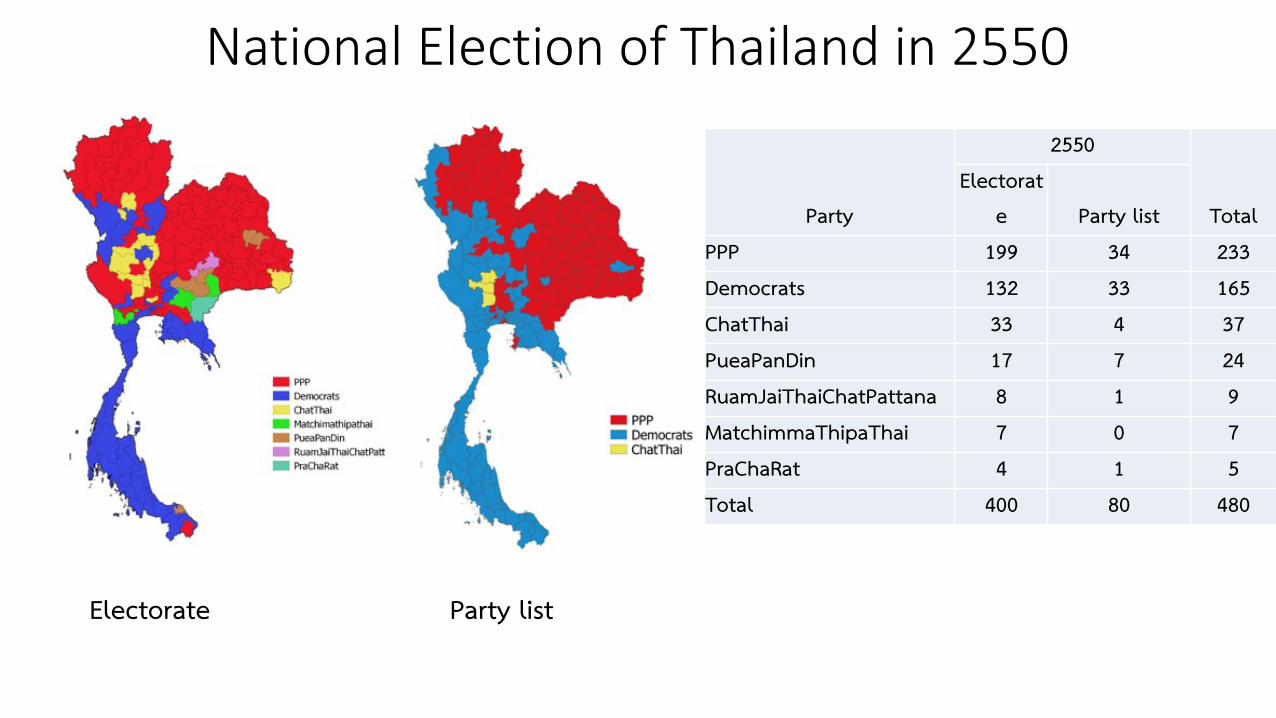
Party
2550
TotalElectorat
e Party listPPP 199 34 233Democrats 132 33 165ChatThai 33 4 37PueaPanDin 17 7 24RuamJaiThaiChatPattana 8 1 9MatchimmaThipaThai 7 0 7PraChaRat 4 1 5Total 400 80 480
National Election of Thailand in 2550
Electorate Party list
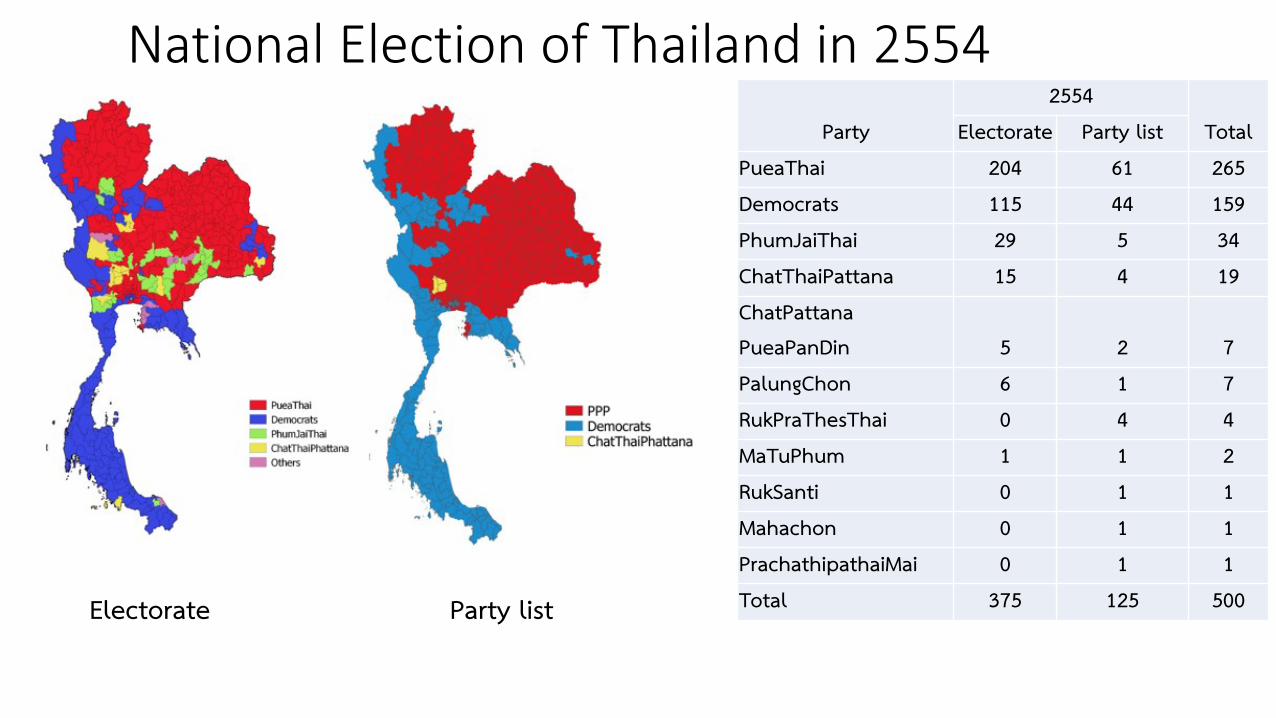
Party2554
TotalElectorate Party listPueaThai 204 61 265Democrats 115 44 159PhumJaiThai 29 5 34ChatThaiPattana 15 4 19ChatPattana PueaPanDin 5 2 7PalungChon 6 1 7RukPraThesThai 0 4 4MaTuPhum 1 1 2RukSanti 0 1 1Mahachon 0 1 1PrachathipathaiMai 0 1 1Total 375 125 500
National Election of Thailand in 2554
Electorate Party list
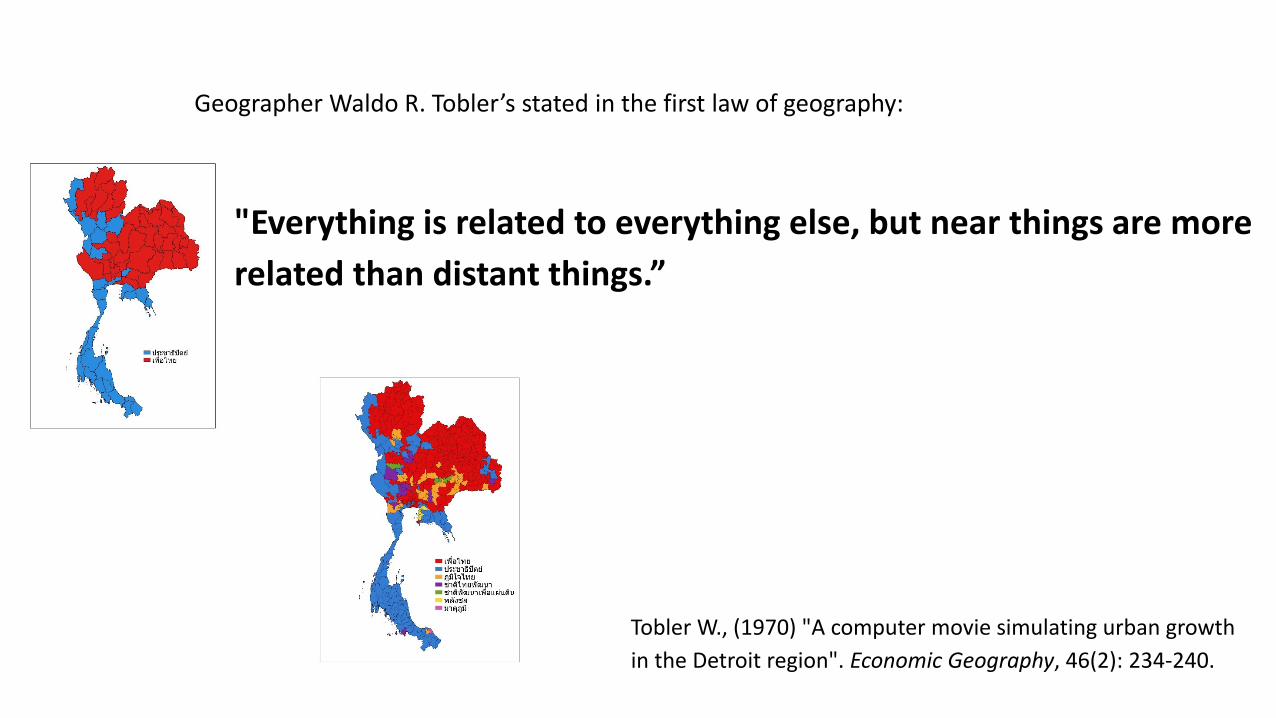
"Everything is related to everything else, but near things are more
related than distant things.”
Tobler W., (1970) "A computer movie simulating urban growth
in the Detroit region". Economic Geography, 46(2): 234-240.
Geographer Waldo R. Tobler’s stated in the first law of geography:
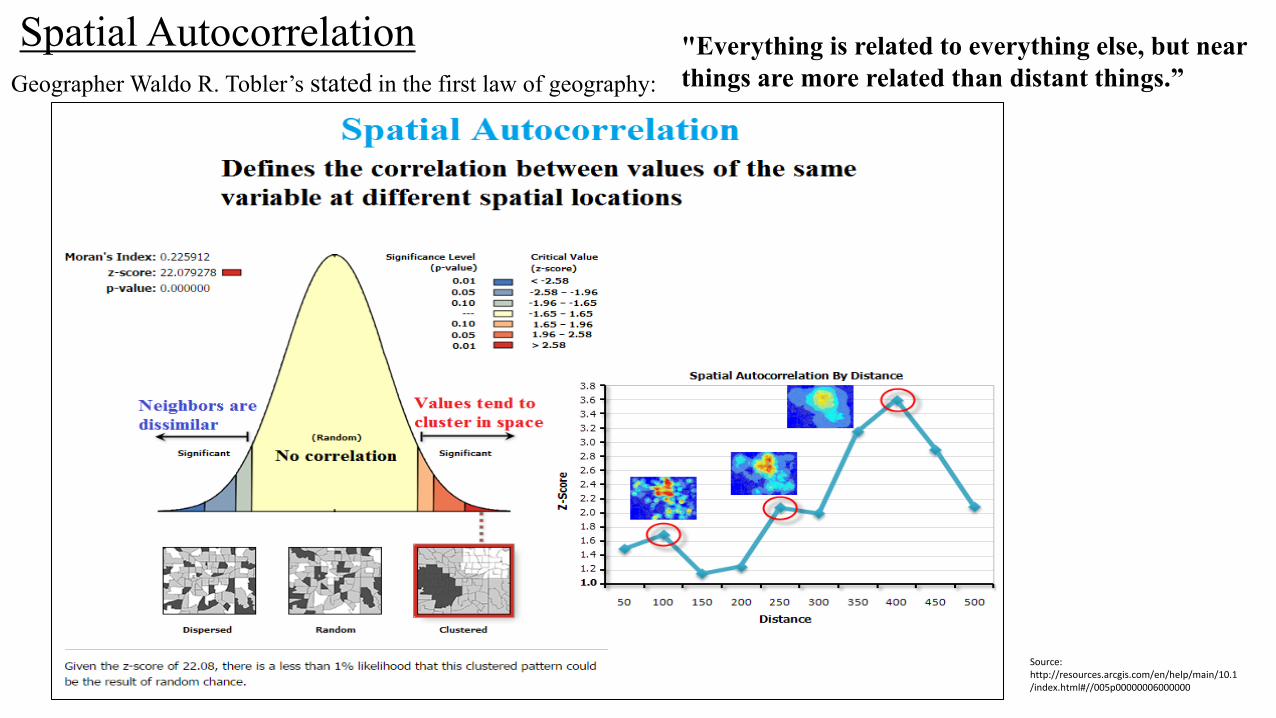
Spatial AutocorrelationGeographer Waldo R. Tobler’s stated in the first law of geography:
"Everything is related to everything else, but near
things are more related than distant things.”
Source: http://resources.arcgis.com/en/help/main/10.1/index.html#//005p00000006000000
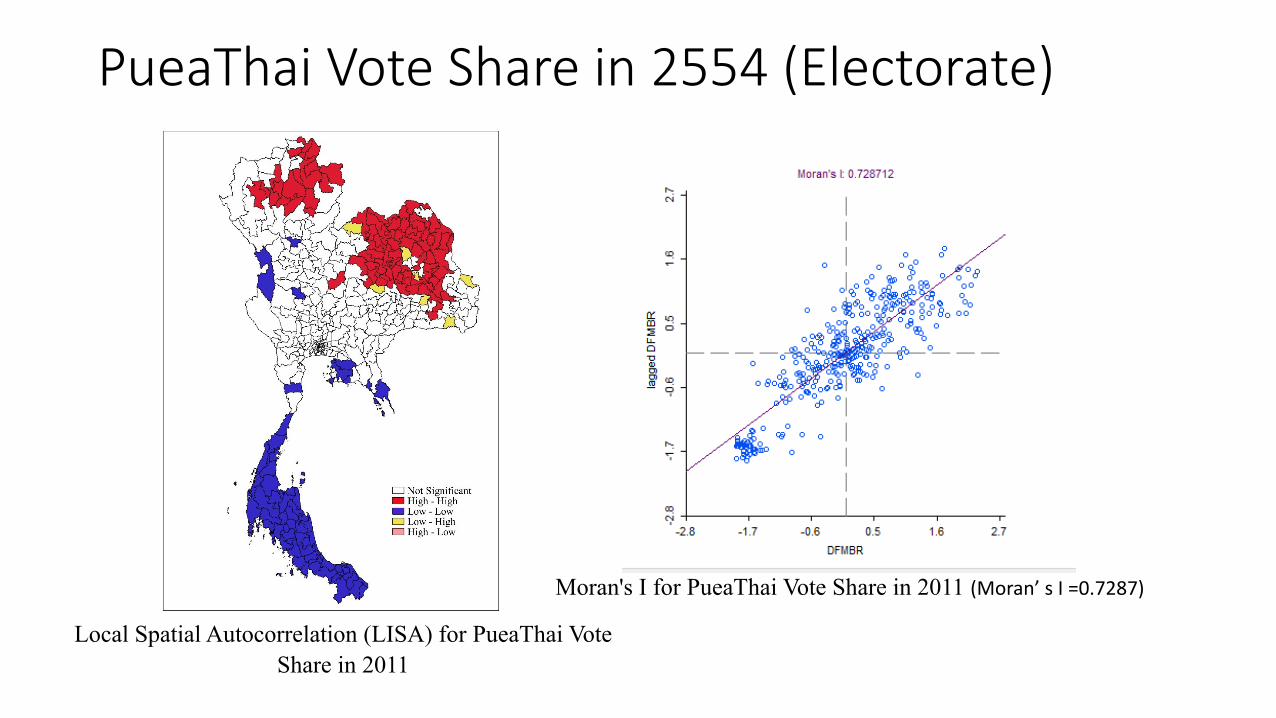
PueaThai Vote Share in 2554 (Electorate)
Moran's I for PueaThai Vote Share in 2011 (Moran’ s I =0.7287)
Local Spatial Autocorrelation (LISA) for PueaThai Vote
Share in 2011
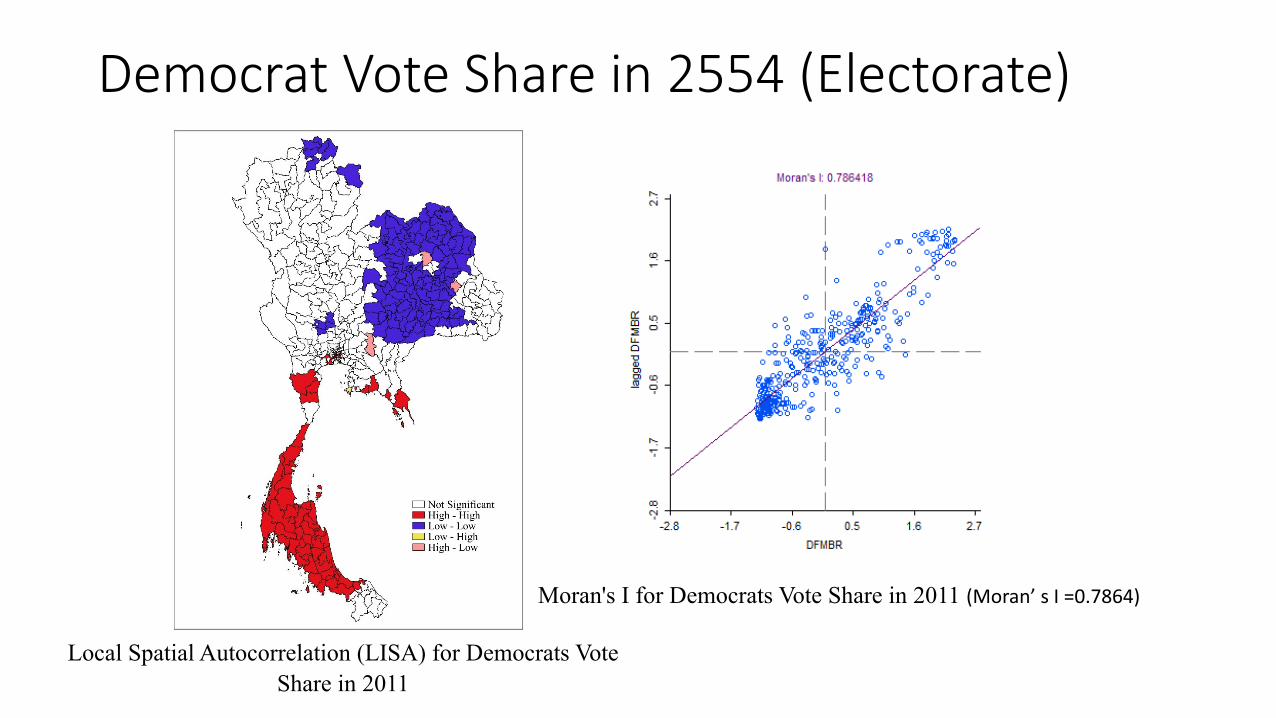
Democrat Vote Share in 2554 (Electorate)
Moran's I for Democrats Vote Share in 2011 (Moran’ s I =0.7864)
Local Spatial Autocorrelation (LISA) for Democrats Vote
Share in 2011
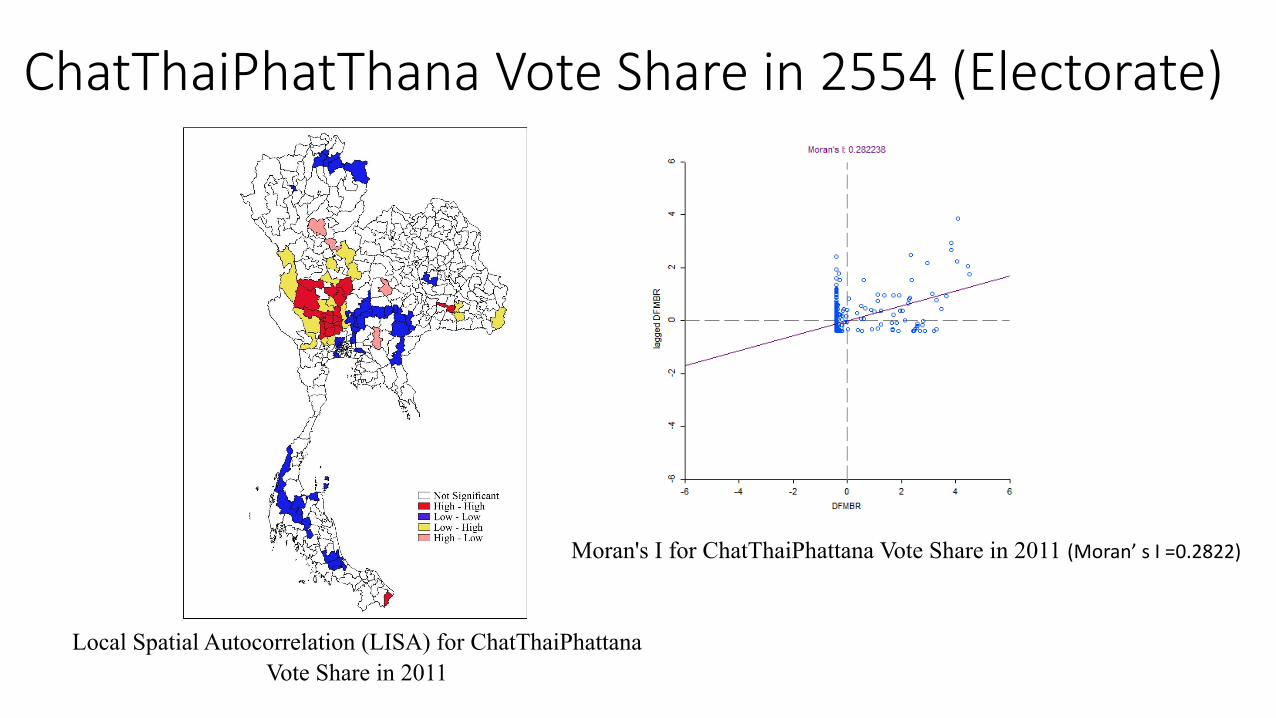
ChatThaiPhatThana Vote Share in 2554 (Electorate)
Moran's I for ChatThaiPhattana Vote Share in 2011 (Moran’ s I =0.2822)
Local Spatial Autocorrelation (LISA) for ChatThaiPhattana
Vote Share in 2011
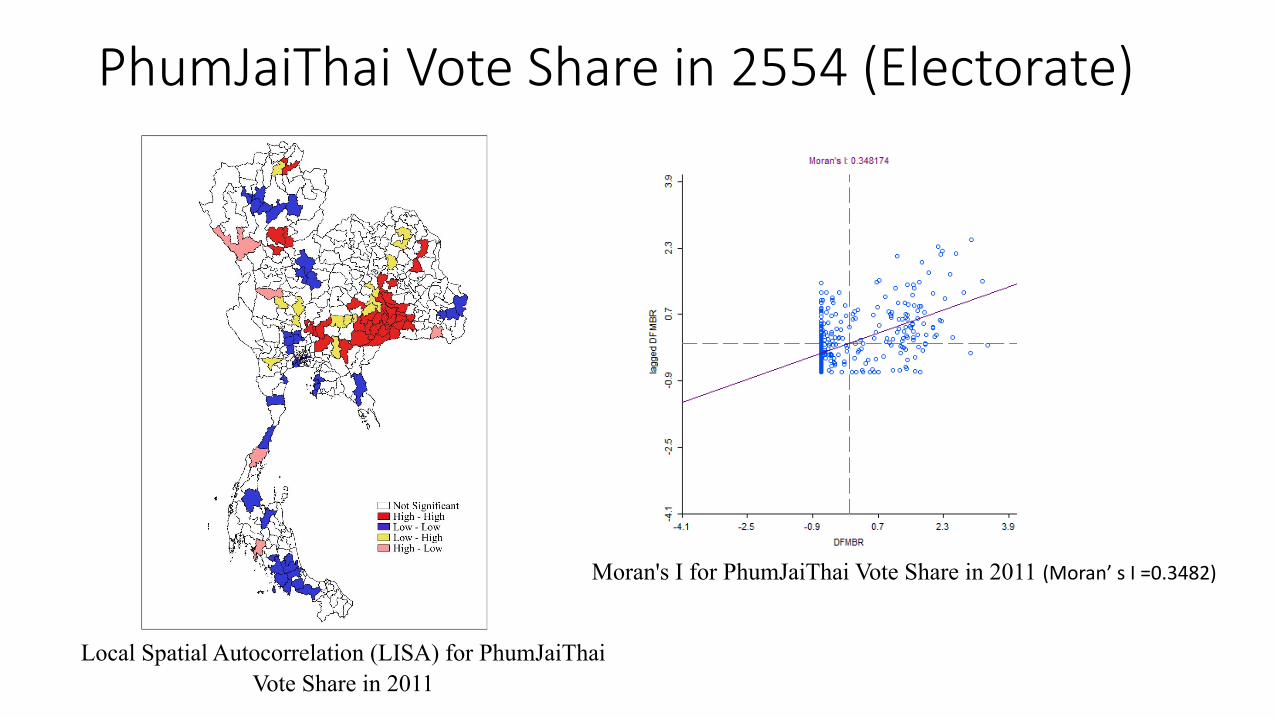
PhumJaiThai Vote Share in 2554 (Electorate)
Moran's I for PhumJaiThai Vote Share in 2011 (Moran’ s I =0.3482)
Local Spatial Autocorrelation (LISA) for PhumJaiThai
Vote Share in 2011
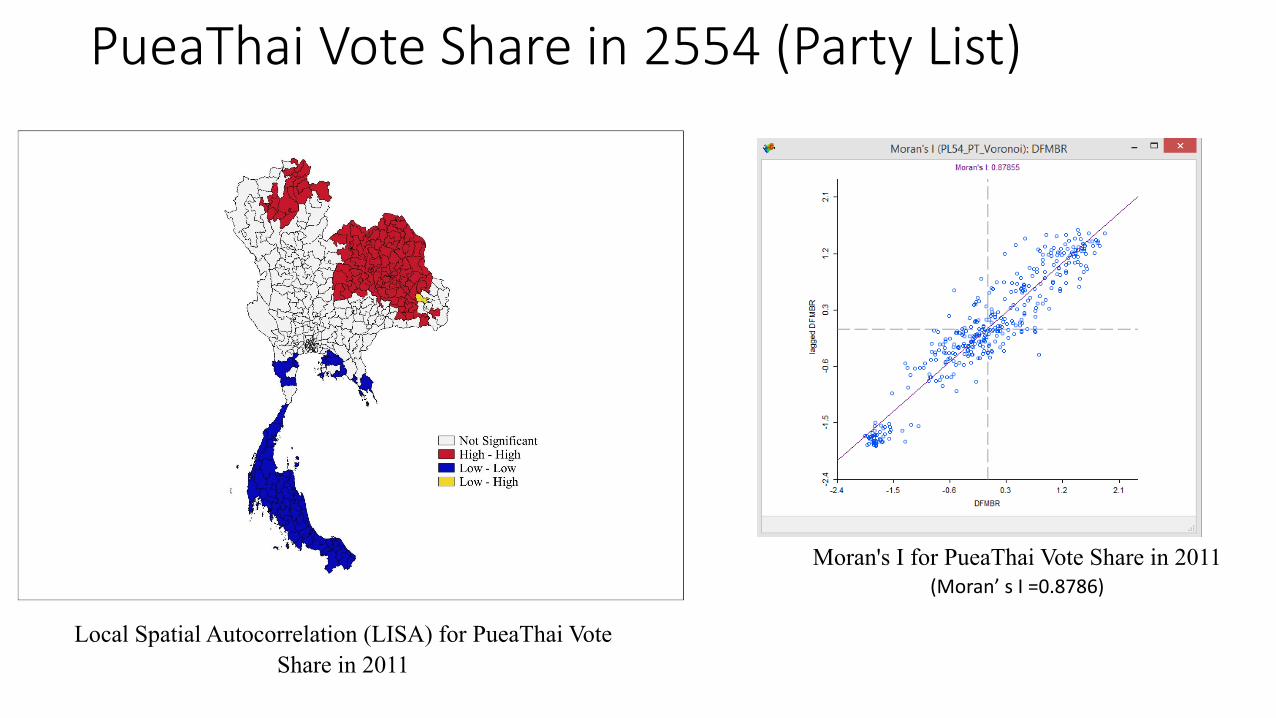
PueaThai Vote Share in 2554 (Party List)
Moran's I for PueaThai Vote Share in 2011
(Moran’ s I =0.8786)
Local Spatial Autocorrelation (LISA) for PueaThai Vote
Share in 2011
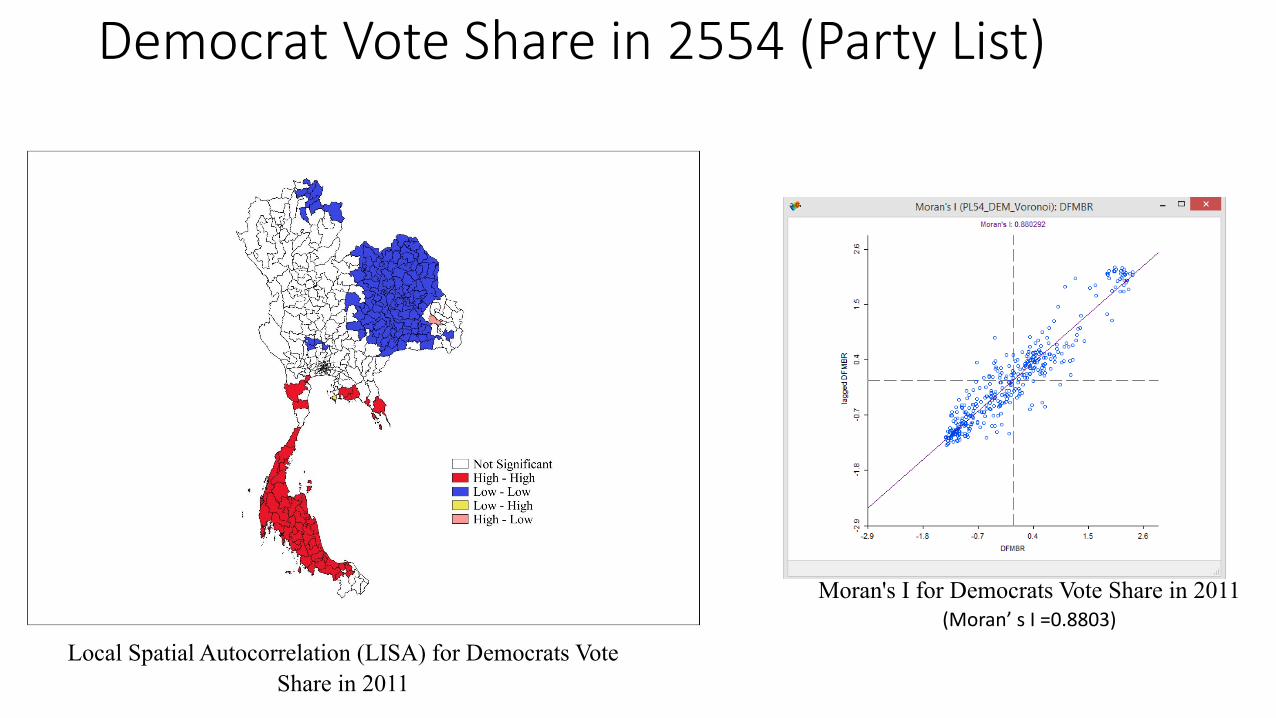
Democrat Vote Share in 2554 (Party List)
Moran's I for Democrats Vote Share in 2011
(Moran’ s I =0.8803)
Local Spatial Autocorrelation (LISA) for Democrats Vote
Share in 2011
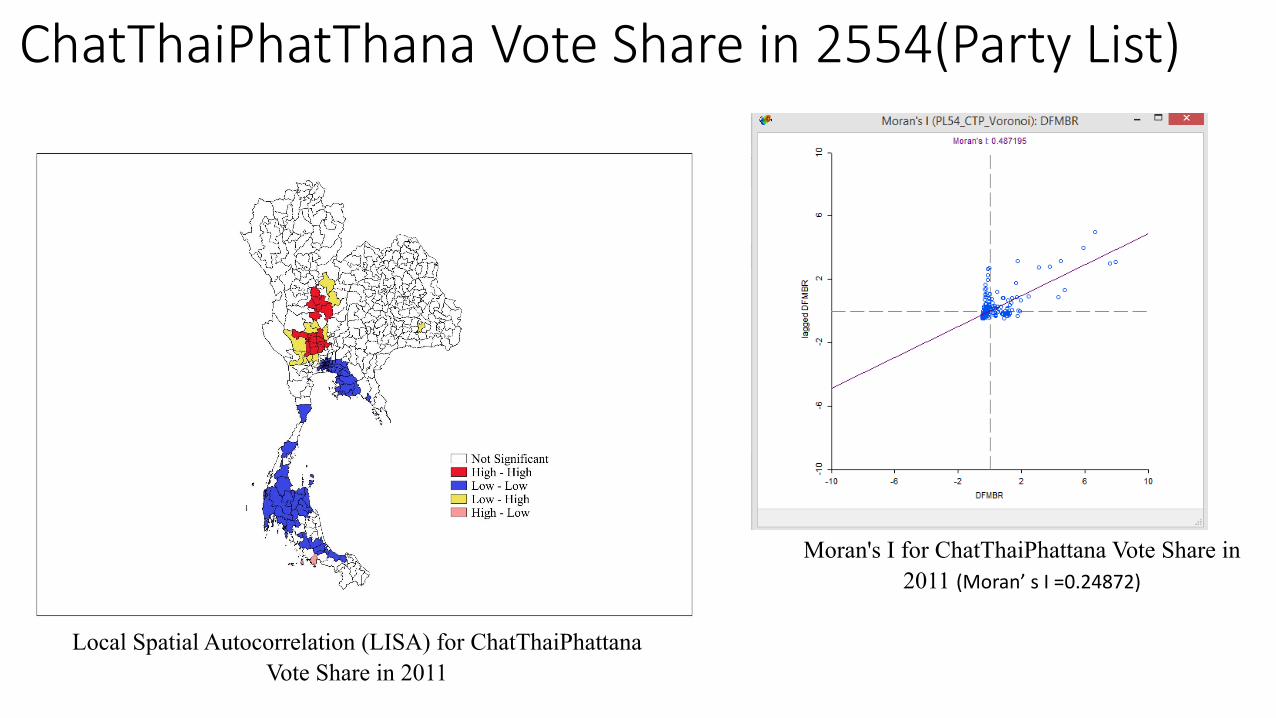
ChatThaiPhatThana Vote Share in 2554(Party List)
Moran's I for ChatThaiPhattana Vote Share in
2011 (Moran’ s I =0.24872)
Local Spatial Autocorrelation (LISA) for ChatThaiPhattana
Vote Share in 2011
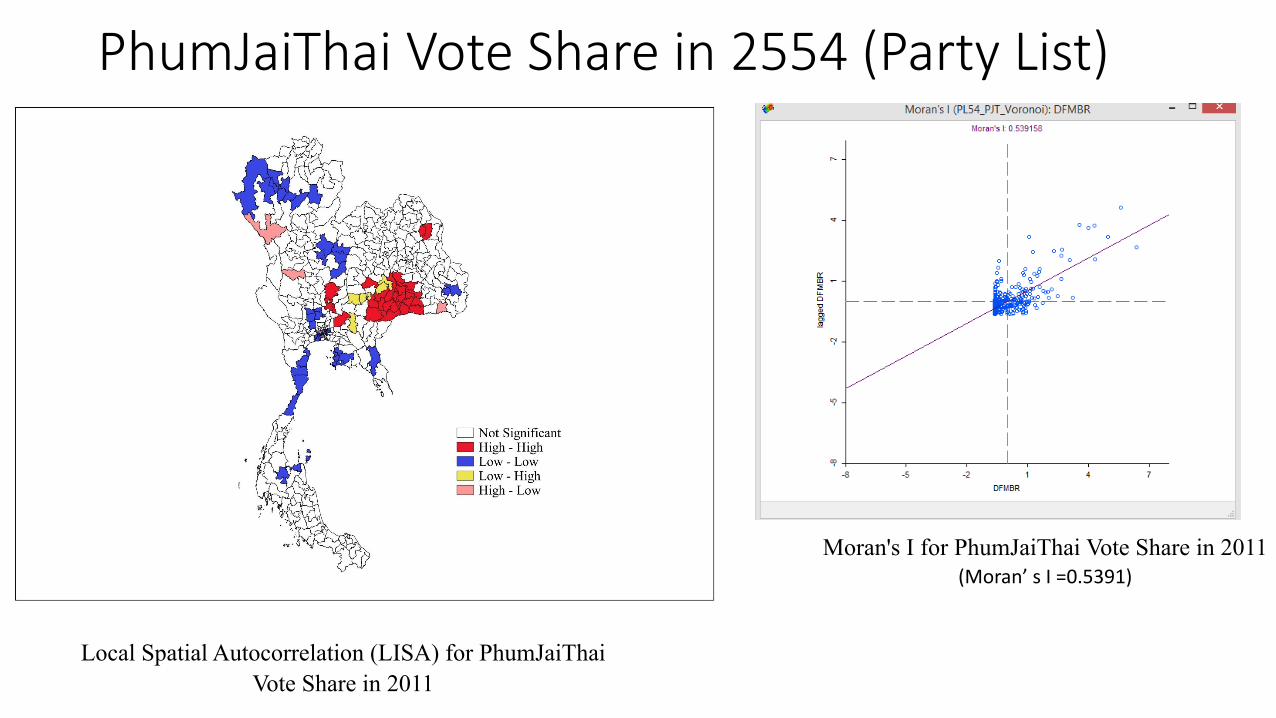
PhumJaiThai Vote Share in 2554 (Party List)
Moran's I for PhumJaiThai Vote Share in 2011
(Moran’ s I =0.5391)
Local Spatial Autocorrelation (LISA) for PhumJaiThai
Vote Share in 2011
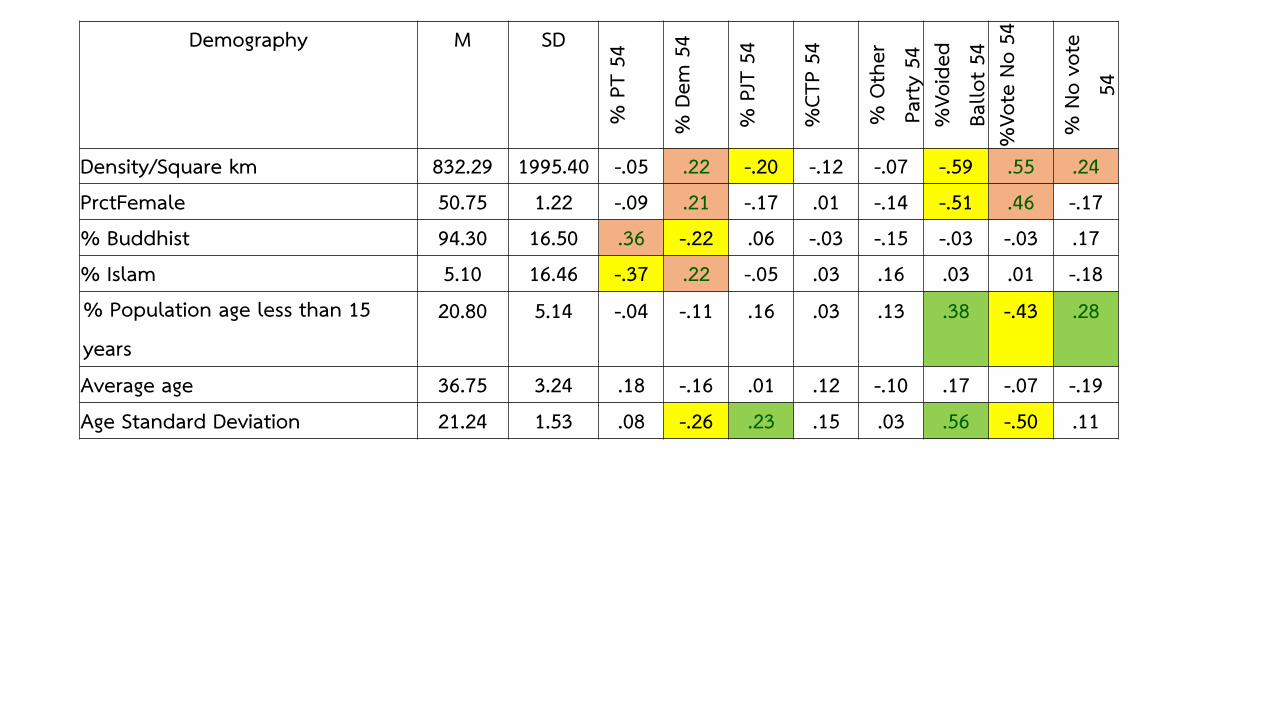
Demography M SD
% P
T 54
% D
em 5
4
% P
JT 5
4
%CT
P 54
% O
ther
Pa
rty 5
4%
Void
ed
Ballo
t 54
%Vo
te N
o 54
% N
o vo
te
54
Density/Square km 832.29 1995.40 -.05 .22 -.20 -.12 -.07 -.59 .55 .24PrctFemale 50.75 1.22 -.09 .21 -.17 .01 -.14 -.51 .46 -.17% Buddhist 94.30 16.50 .36 -.22 .06 -.03 -.15 -.03 -.03 .17% Islam 5.10 16.46 -.37 .22 -.05 .03 .16 .03 .01 -.18% Population age less than 15 years
20.80 5.14 -.04 -.11 .16 .03 .13 .38 -.43 .28
Average age 36.75 3.24 .18 -.16 .01 .12 -.10 .17 -.07 -.19Age Standard Deviation 21.24 1.53 .08 -.26 .23 .15 .03 .56 -.50 .11
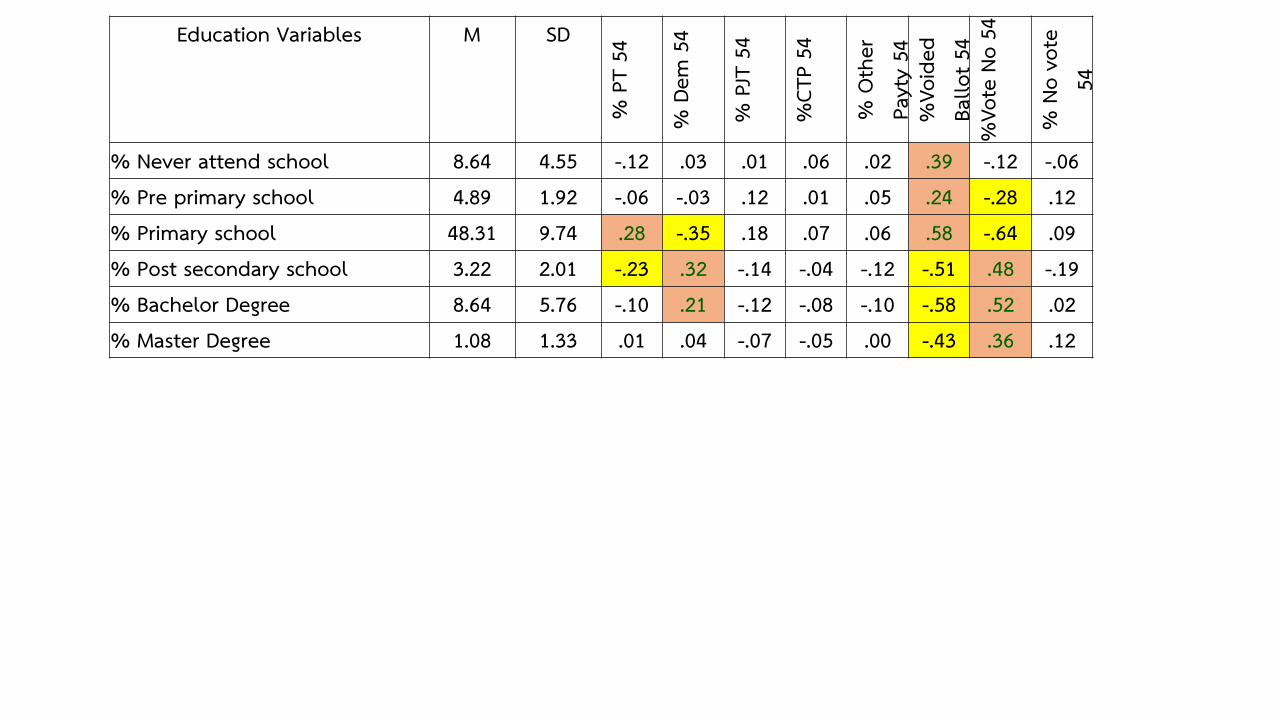
Education Variables M SD
% P
T 54
% D
em 5
4
% P
JT 5
4
%CT
P 54
% O
ther
Pa
yty
54%
Void
ed
Ballo
t 54
%Vo
te N
o 54
% N
o vo
te
54
% Never attend school 8.64 4.55 -.12 .03 .01 .06 .02 .39 -.12 -.06% Pre primary school 4.89 1.92 -.06 -.03 .12 .01 .05 .24 -.28 .12% Primary school 48.31 9.74 .28 -.35 .18 .07 .06 .58 -.64 .09% Post secondary school 3.22 2.01 -.23 .32 -.14 -.04 -.12 -.51 .48 -.19% Bachelor Degree 8.64 5.76 -.10 .21 -.12 -.08 -.10 -.58 .52 .02% Master Degree 1.08 1.33 .01 .04 -.07 -.05 .00 -.43 .36 .12
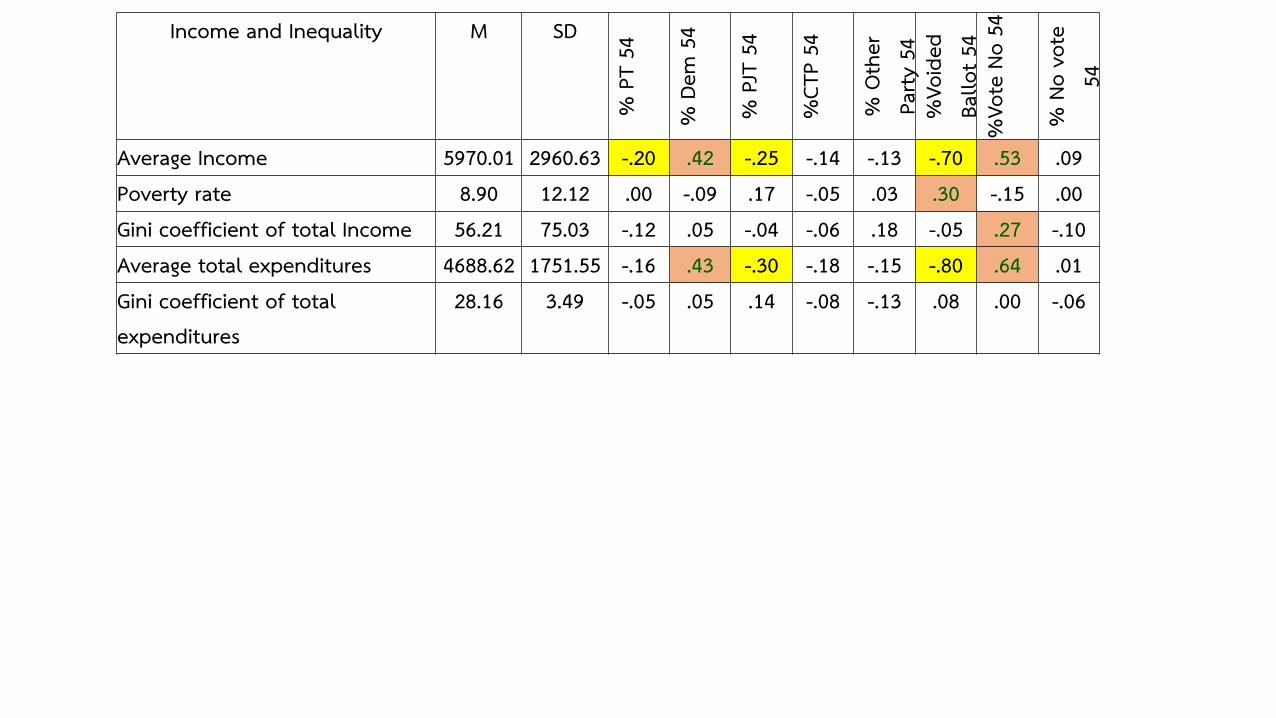
Income and Inequality M SD
% P
T 54
% D
em 5
4
% P
JT 5
4
%CT
P 54
% O
ther
Pa
rty 5
4%
Void
ed
Ballo
t 54
%Vo
te N
o 54
% N
o vo
te
54
Average Income 5970.01 2960.63 -.20 .42 -.25 -.14 -.13 -.70 .53 .09Poverty rate 8.90 12.12 .00 -.09 .17 -.05 .03 .30 -.15 .00Gini coefficient of total Income 56.21 75.03 -.12 .05 -.04 -.06 .18 -.05 .27 -.10Average total expenditures 4688.62 1751.55 -.16 .43 -.30 -.18 -.15 -.80 .64 .01Gini coefficient of total expenditures
28.16 3.49 -.05 .05 .14 -.08 -.13 .08 .00 -.06
Employment Status M SD
% P
T 54
% D
em 5
4
% P
JT 5
4
%CT
P 54
% O
ther
Pa
yty
54%
Void
ed
Ballo
t 54
%Vo
te N
o 54
% N
o vo
te 5
4
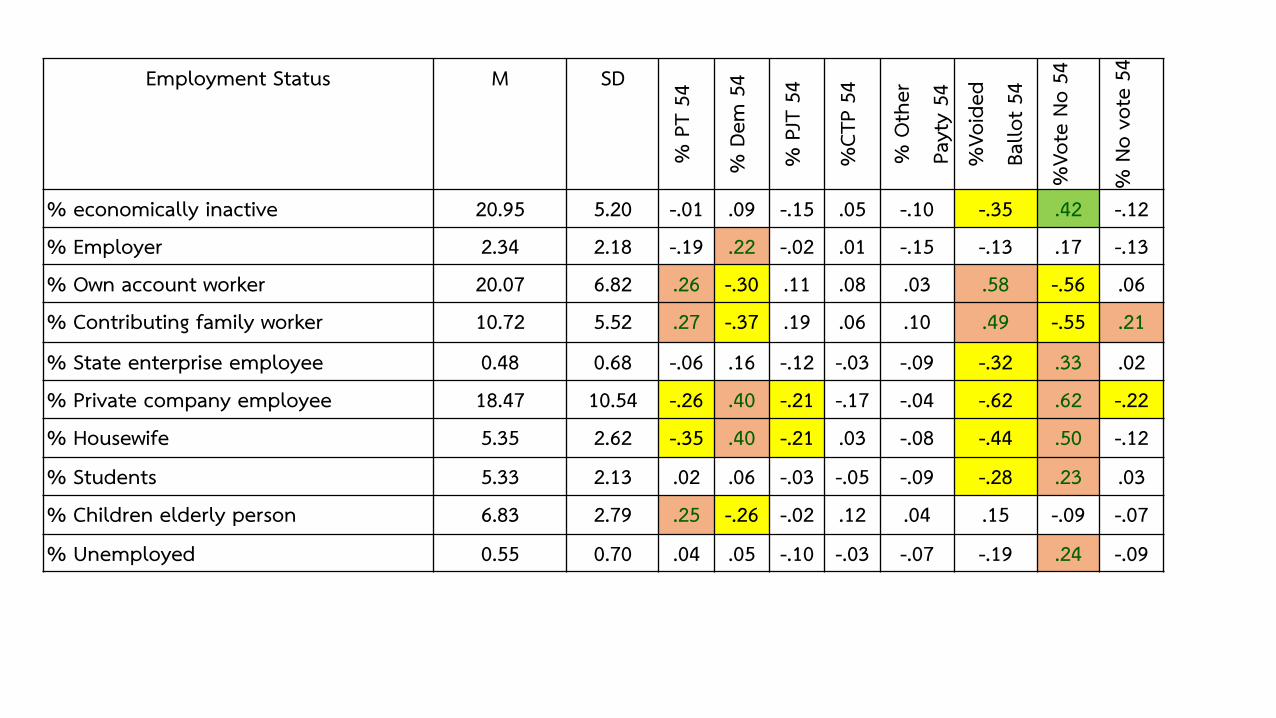
% economically inactive 20.95 5.20 -.01 .09 -.15 .05 -.10 -.35 .42 -.12% Employer 2.34 2.18 -.19 .22 -.02 .01 -.15 -.13 .17 -.13% Own account worker 20.07 6.82 .26 -.30 .11 .08 .03 .58 -.56 .06% Contributing family worker 10.72 5.52 .27 -.37 .19 .06 .10 .49 -.55 .21
% State enterprise employee 0.48 0.68 -.06 .16 -.12 -.03 -.09 -.32 .33 .02% Private company employee 18.47 10.54 -.26 .40 -.21 -.17 -.04 -.62 .62 -.22% Housewife 5.35 2.62 -.35 .40 -.21 .03 -.08 -.44 .50 -.12% Students 5.33 2.13 .02 .06 -.03 -.05 -.09 -.28 .23 .03% Children elderly person 6.83 2.79 .25 -.26 -.02 .12 .04 .15 -.09 -.07% Unemployed 0.55 0.70 .04 .05 -.10 -.03 -.07 -.19 .24 -.09
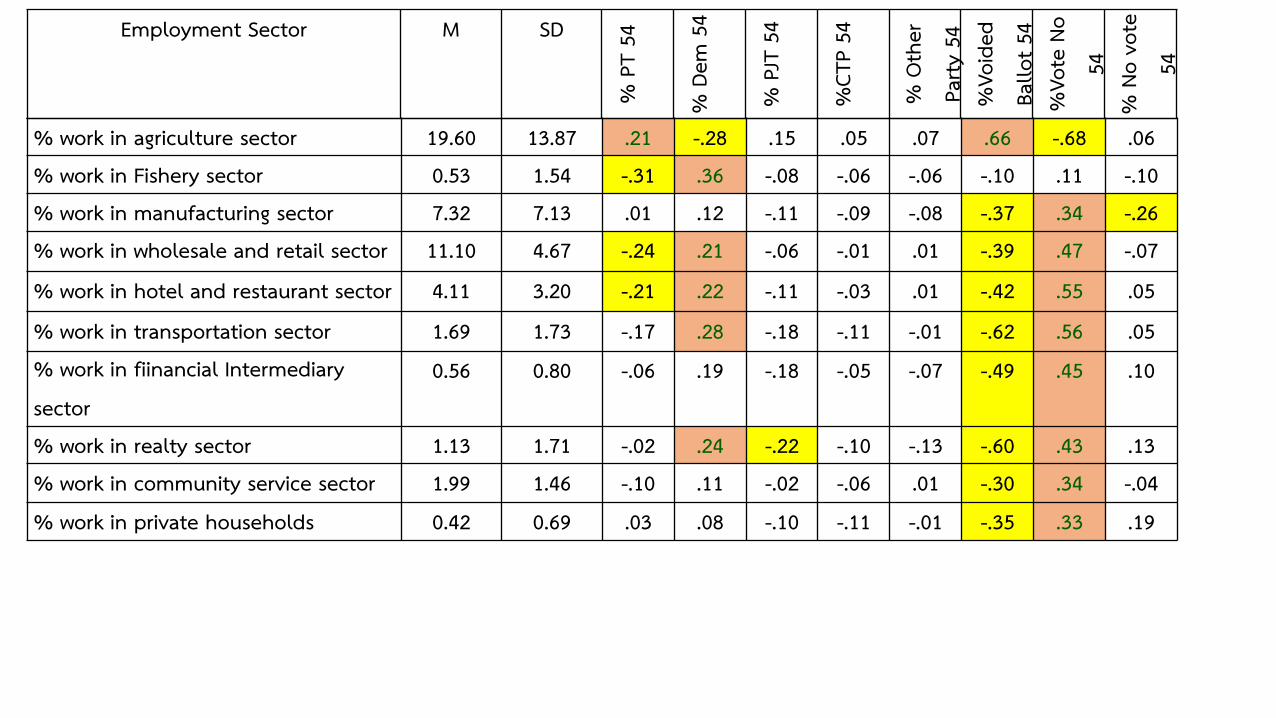
% work in agriculture sector 19.60 13.87 .21 -.28 .15 .05 .07 .66 -.68 .06% work in Fishery sector 0.53 1.54 -.31 .36 -.08 -.06 -.06 -.10 .11 -.10% work in manufacturing sector 7.32 7.13 .01 .12 -.11 -.09 -.08 -.37 .34 -.26% work in wholesale and retail sector 11.10 4.67 -.24 .21 -.06 -.01 .01 -.39 .47 -.07
% work in hotel and restaurant sector 4.11 3.20 -.21 .22 -.11 -.03 .01 -.42 .55 .05
% work in transportation sector 1.69 1.73 -.17 .28 -.18 -.11 -.01 -.62 .56 .05% work in fiinancial Intermediary sector
0.56 0.80 -.06 .19 -.18 -.05 -.07 -.49 .45 .10
% work in realty sector 1.13 1.71 -.02 .24 -.22 -.10 -.13 -.60 .43 .13% work in community service sector 1.99 1.46 -.10 .11 -.02 -.06 .01 -.30 .34 -.04% work in private households 0.42 0.69 .03 .08 -.10 -.11 -.01 -.35 .33 .19
Employment Sector M SD
% P
T 54
% D
em 5
4
% P
JT 5
4
%CT
P 54
% O
ther
Pa
rty 5
4%
Void
ed
Ballo
t 54
%Vo
te N
o 54
% N
o vo
te
54
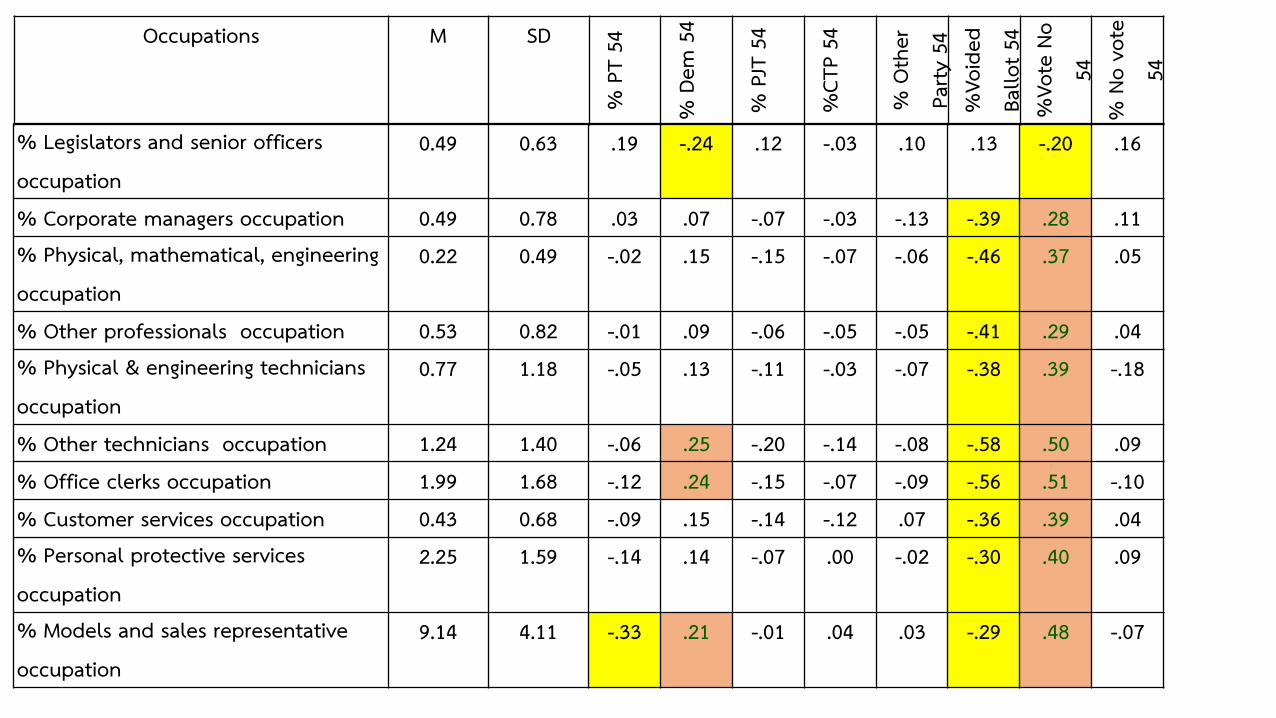
% Legislators and senior officers occupation
0.49 0.63 .19 -.24 .12 -.03 .10 .13 -.20 .16
% Corporate managers occupation 0.49 0.78 .03 .07 -.07 -.03 -.13 -.39 .28 .11% Physical, mathematical, engineering occupation
0.22 0.49 -.02 .15 -.15 -.07 -.06 -.46 .37 .05
% Other professionals occupation 0.53 0.82 -.01 .09 -.06 -.05 -.05 -.41 .29 .04% Physical & engineering technicians occupation
0.77 1.18 -.05 .13 -.11 -.03 -.07 -.38 .39 -.18
% Other technicians occupation 1.24 1.40 -.06 .25 -.20 -.14 -.08 -.58 .50 .09% Office clerks occupation 1.99 1.68 -.12 .24 -.15 -.07 -.09 -.56 .51 -.10% Customer services occupation 0.43 0.68 -.09 .15 -.14 -.12 .07 -.36 .39 .04% Personal protective services occupation
2.25 1.59 -.14 .14 -.07 .00 -.02 -.30 .40 .09
% Models and sales representative occupation
9.14 4.11 -.33 .21 -.01 .04 .03 -.29 .48 -.07
Occupations M SD
% P
T 54
% D
em 5
4
% P
JT 5
4
%CT
P 54
% O
ther
Pa
rty 5
4%
Void
ed
Ballo
t 54
%Vo
te N
o 54
% N
o vo
te
54
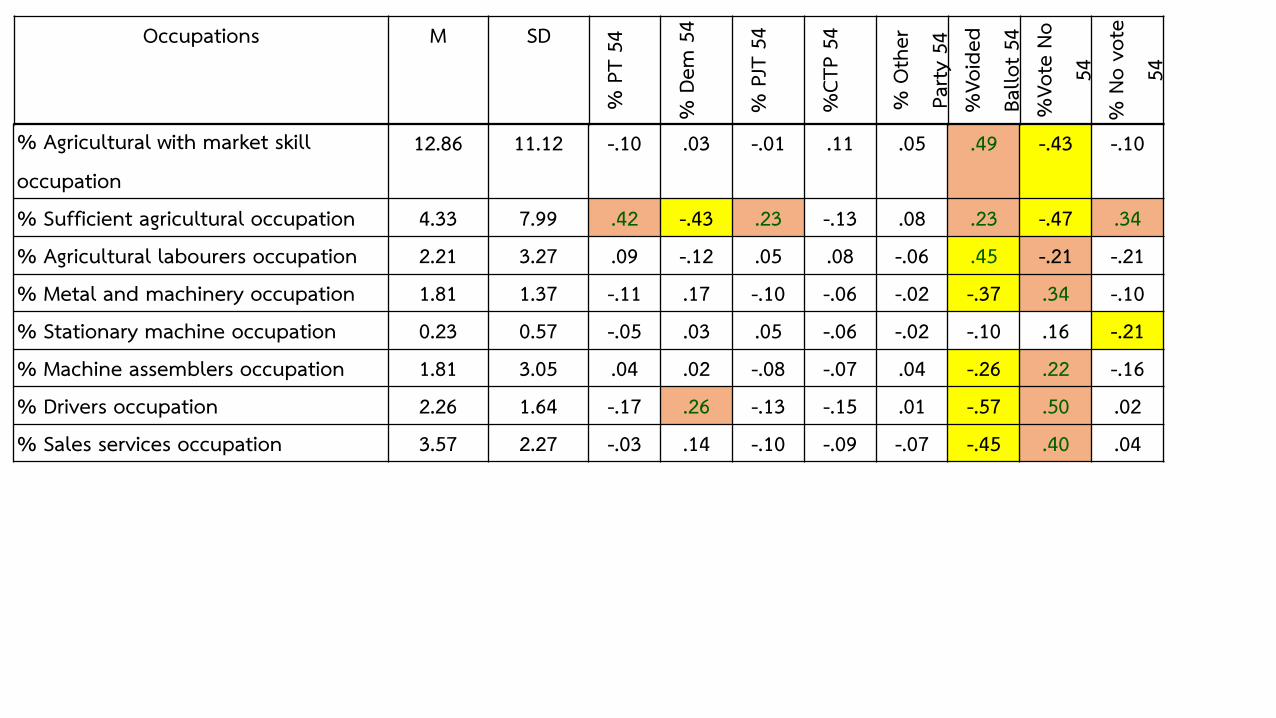
% Agricultural with market skill occupation
12.86 11.12 -.10 .03 -.01 .11 .05 .49 -.43 -.10
% Sufficient agricultural occupation 4.33 7.99 .42 -.43 .23 -.13 .08 .23 -.47 .34% Agricultural labourers occupation 2.21 3.27 .09 -.12 .05 .08 -.06 .45 -.21 -.21% Metal and machinery occupation 1.81 1.37 -.11 .17 -.10 -.06 -.02 -.37 .34 -.10% Stationary machine occupation 0.23 0.57 -.05 .03 .05 -.06 -.02 -.10 .16 -.21% Machine assemblers occupation 1.81 3.05 .04 .02 -.08 -.07 .04 -.26 .22 -.16% Drivers occupation 2.26 1.64 -.17 .26 -.13 -.15 .01 -.57 .50 .02% Sales services occupation 3.57 2.27 -.03 .14 -.10 -.09 -.07 -.45 .40 .04
Occupations M SD
% P
T 54
% D
em 5
4
% P
JT 5
4
%CT
P 54
% O
ther
Pa
rty 5
4%
Void
ed
Ballo
t 54
%Vo
te N
o 54
% N
o vo
te
54
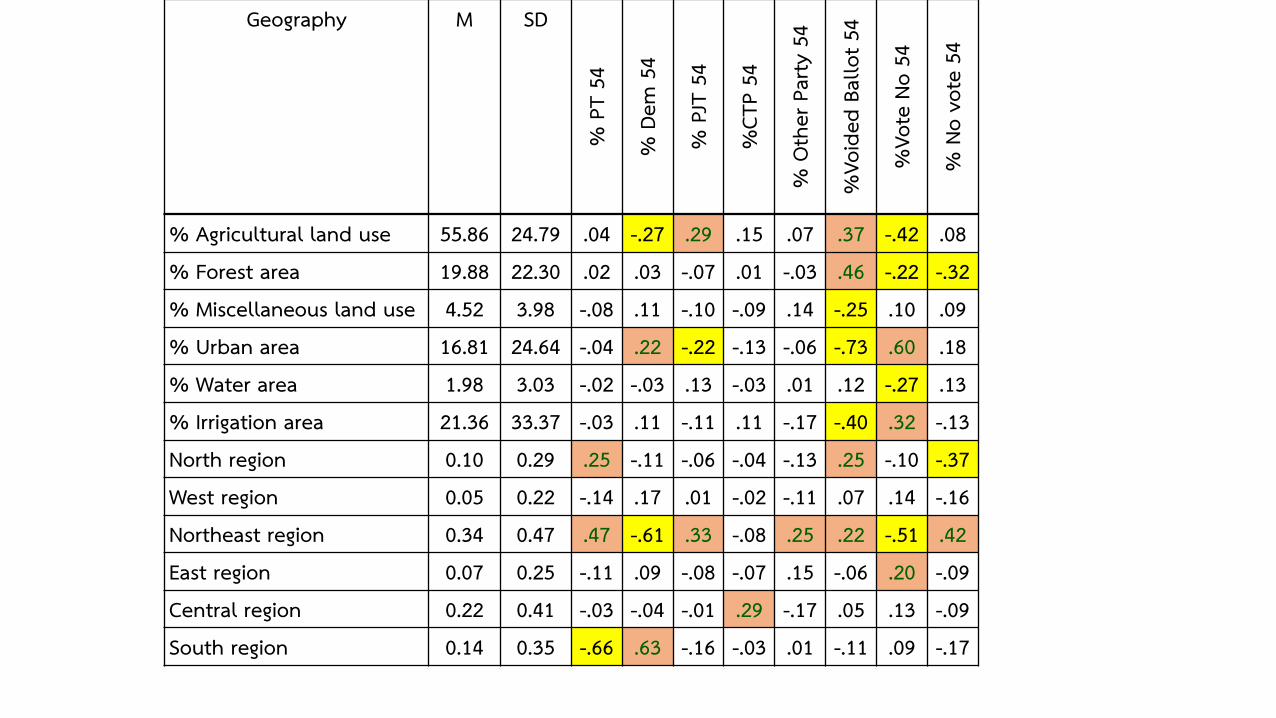
% Agricultural land use 55.86 24.79 .04 -.27 .29 .15 .07 .37 -.42 .08% Forest area 19.88 22.30 .02 .03 -.07 .01 -.03 .46 -.22 -.32% Miscellaneous land use 4.52 3.98 -.08 .11 -.10 -.09 .14 -.25 .10 .09% Urban area 16.81 24.64 -.04 .22 -.22 -.13 -.06 -.73 .60 .18% Water area 1.98 3.03 -.02 -.03 .13 -.03 .01 .12 -.27 .13% Irrigation area 21.36 33.37 -.03 .11 -.11 .11 -.17 -.40 .32 -.13North region 0.10 0.29 .25 -.11 -.06 -.04 -.13 .25 -.10 -.37West region 0.05 0.22 -.14 .17 .01 -.02 -.11 .07 .14 -.16Northeast region 0.34 0.47 .47 -.61 .33 -.08 .25 .22 -.51 .42East region 0.07 0.25 -.11 .09 -.08 -.07 .15 -.06 .20 -.09Central region 0.22 0.41 -.03 -.04 -.01 .29 -.17 .05 .13 -.09South region 0.14 0.35 -.66 .63 -.16 -.03 .01 -.11 .09 -.17
Geography M SD
% P
T 54
% D
em 5
4
% P
JT 5
4
%CT
P 54
% O
ther
Par
ty 5
4
%Vo
ided
Bal
lot 5
4
%Vo
te N
o 54
% N
o vo
te 5
4
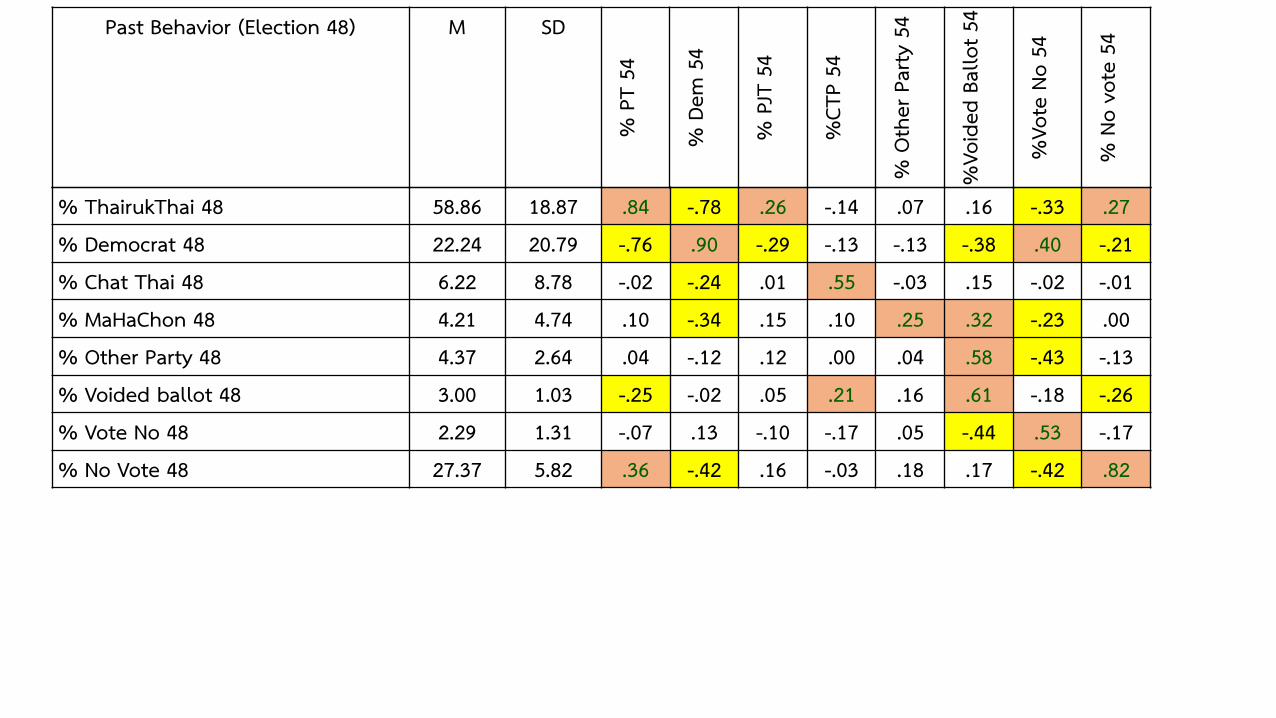
% ThairukThai 48 58.86 18.87 .84 -.78 .26 -.14 .07 .16 -.33 .27% Democrat 48 22.24 20.79 -.76 .90 -.29 -.13 -.13 -.38 .40 -.21% Chat Thai 48 6.22 8.78 -.02 -.24 .01 .55 -.03 .15 -.02 -.01% MaHaChon 48 4.21 4.74 .10 -.34 .15 .10 .25 .32 -.23 .00% Other Party 48 4.37 2.64 .04 -.12 .12 .00 .04 .58 -.43 -.13% Voided ballot 48 3.00 1.03 -.25 -.02 .05 .21 .16 .61 -.18 -.26% Vote No 48 2.29 1.31 -.07 .13 -.10 -.17 .05 -.44 .53 -.17% No Vote 48 27.37 5.82 .36 -.42 .16 -.03 .18 .17 -.42 .82
Past Behavior (Election 48) M SD
% P
T 54
% D
em 5
4
% P
JT 5
4
%CT
P 54
% O
ther
Par
ty 5
4
%Vo
ided
Bal
lot 5
4
%Vo
te N
o 54
% N
o vo
te 5
4
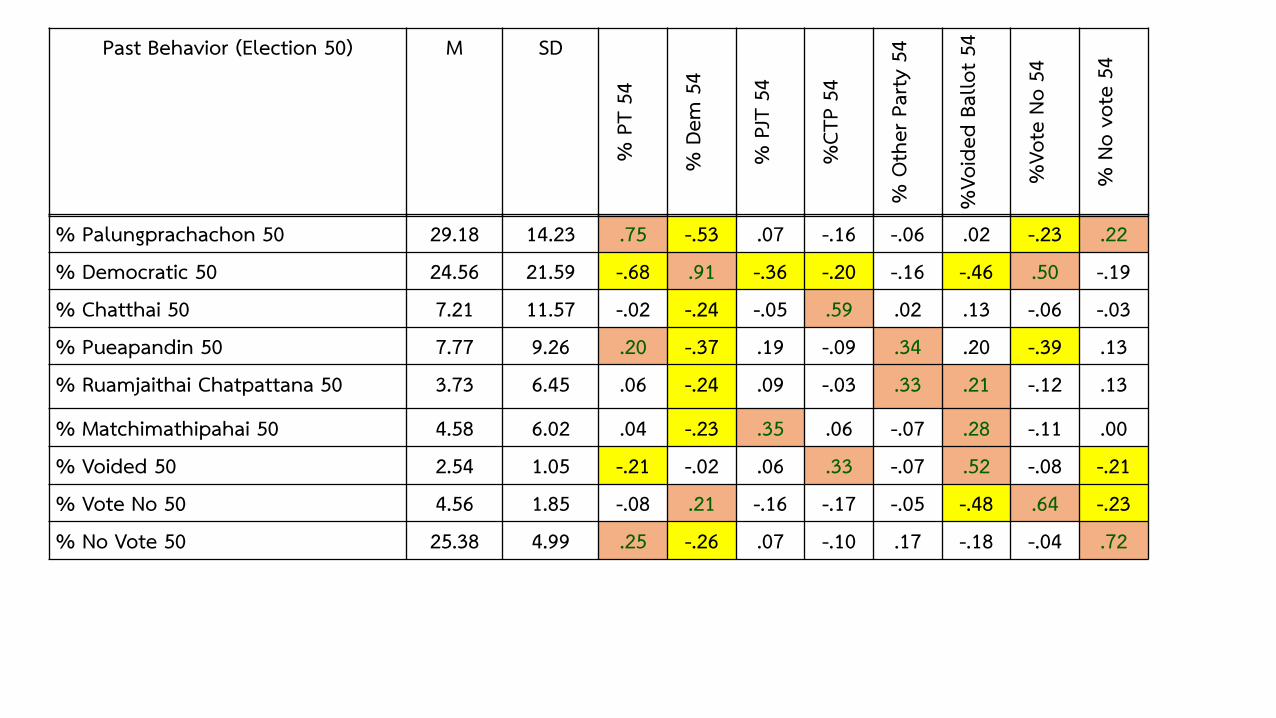
% Palungprachachon 50 29.18 14.23 .75 -.53 .07 -.16 -.06 .02 -.23 .22% Democratic 50 24.56 21.59 -.68 .91 -.36 -.20 -.16 -.46 .50 -.19% Chatthai 50 7.21 11.57 -.02 -.24 -.05 .59 .02 .13 -.06 -.03% Pueapandin 50 7.77 9.26 .20 -.37 .19 -.09 .34 .20 -.39 .13% Ruamjaithai Chatpattana 50 3.73 6.45 .06 -.24 .09 -.03 .33 .21 -.12 .13
% Matchimathipahai 50 4.58 6.02 .04 -.23 .35 .06 -.07 .28 -.11 .00% Voided 50 2.54 1.05 -.21 -.02 .06 .33 -.07 .52 -.08 -.21% Vote No 50 4.56 1.85 -.08 .21 -.16 -.17 -.05 -.48 .64 -.23% No Vote 50 25.38 4.99 .25 -.26 .07 -.10 .17 -.18 -.04 .72
Past Behavior (Election 50) M SD
% P
T 54
% D
em 5
4
% P
JT 5
4
%CT
P 54
% O
ther
Par
ty 5
4
%Vo
ided
Bal
lot 5
4
%Vo
te N
o 54
% N
o vo
te 5
4
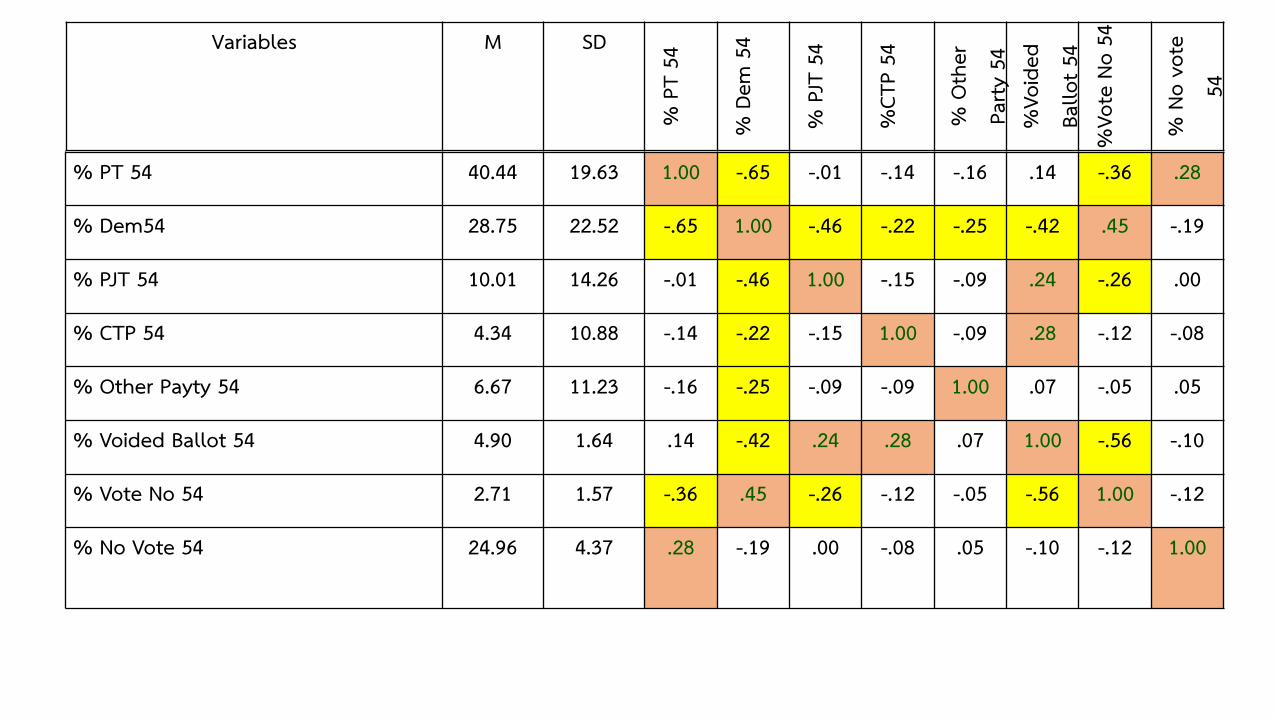
% PT 54 40.44 19.63 1.00 -.65 -.01 -.14 -.16 .14 -.36 .28
% Dem54 28.75 22.52 -.65 1.00 -.46 -.22 -.25 -.42 .45 -.19
% PJT 54 10.01 14.26 -.01 -.46 1.00 -.15 -.09 .24 -.26 .00
% CTP 54 4.34 10.88 -.14 -.22 -.15 1.00 -.09 .28 -.12 -.08
% Other Payty 54 6.67 11.23 -.16 -.25 -.09 -.09 1.00 .07 -.05 .05
% Voided Ballot 54 4.90 1.64 .14 -.42 .24 .28 .07 1.00 -.56 -.10
% Vote No 54 2.71 1.57 -.36 .45 -.26 -.12 -.05 -.56 1.00 -.12
% No Vote 54 24.96 4.37 .28 -.19 .00 -.08 .05 -.10 -.12 1.00
Variables M SD
% P
T 54
% D
em 5
4
% P
JT 5
4
%CT
P 54
% O
ther
Pa
rty 5
4%
Void
ed
Ballo
t 54
%Vo
te N
o 54
% N
o vo
te
54
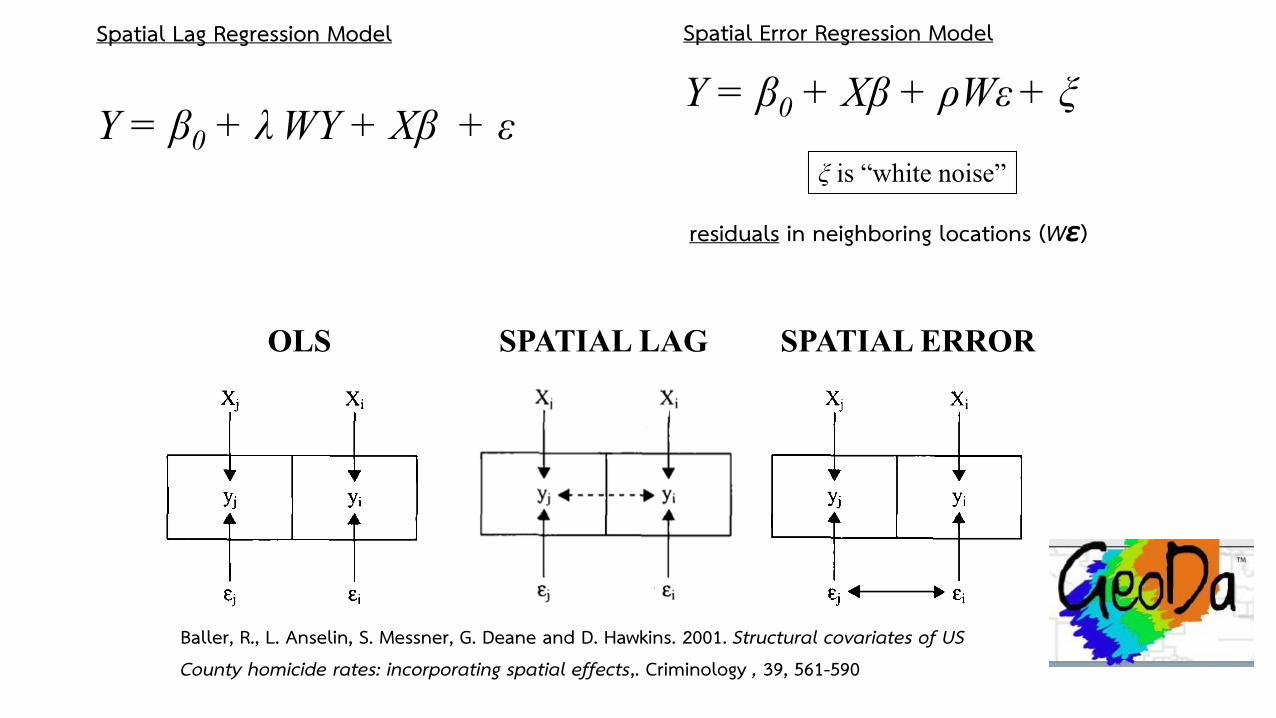
Y = β0 + λ WY + Xβ + εY = β0 + Xβ + ρWε + ξ
ξ is “white noise”
Spatial Lag Regression Model Spatial Error Regression Model
residuals in neighboring locations (Wε)
OLS SPATIAL LAG SPATIAL ERROR
Baller, R., L. Anselin, S. Messner, G. Deane and D. Hawkins. 2001. Structural covariates of US County homicide rates: incorporating spatial effects,. Criminology , 39, 561-590
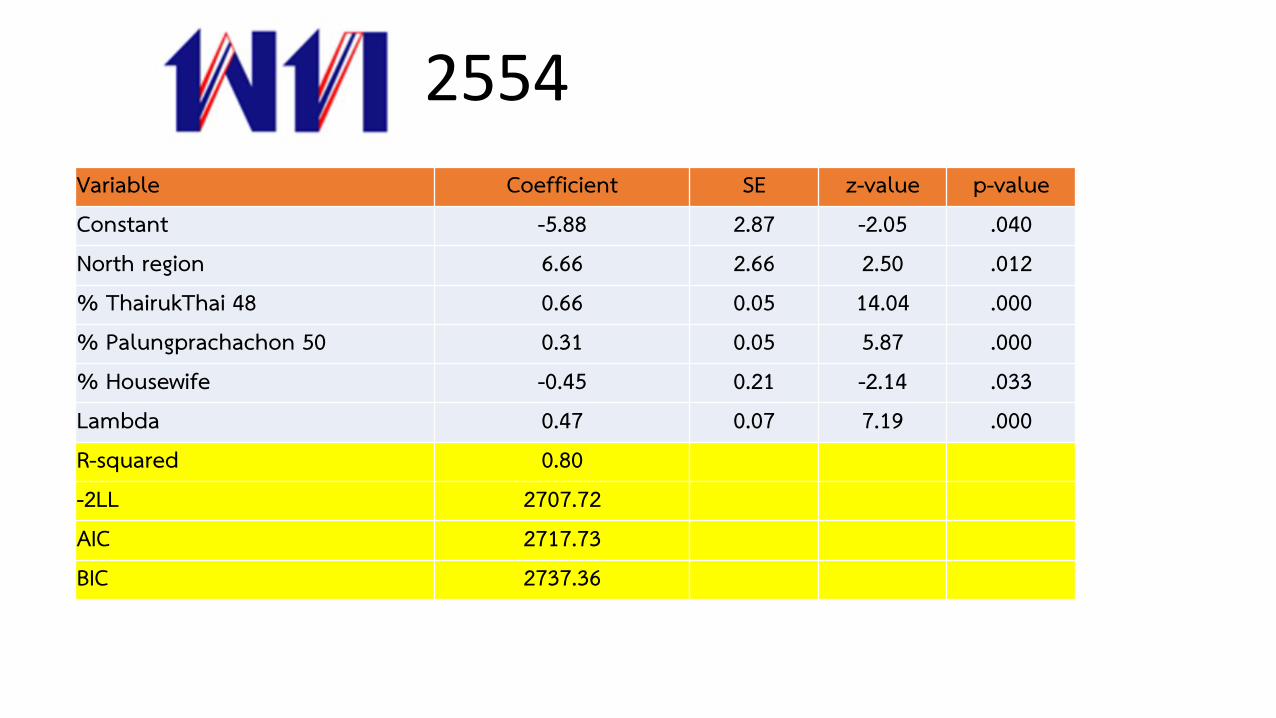
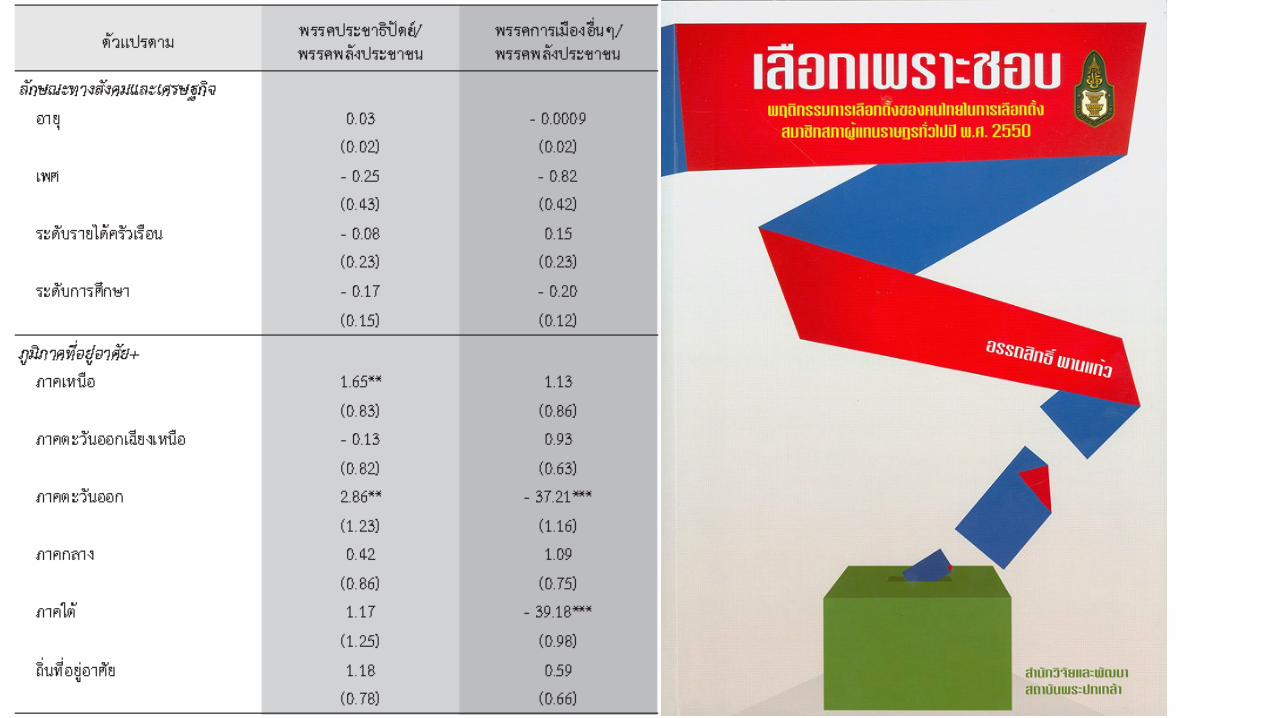
Variable Coefficient SE z-value p-valueConstant -5.88 2.87 -2.05 .040North region 6.66 2.66 2.50 .012% ThairukThai 48 0.66 0.05 14.04 .000% Palungprachachon 50 0.31 0.05 5.87 .000% Housewife -0.45 0.21 -2.14 .033Lambda 0.47 0.07 7.19 .000R-squared 0.80-2LL 2707.72AIC 2717.73BIC 2737.36
2554
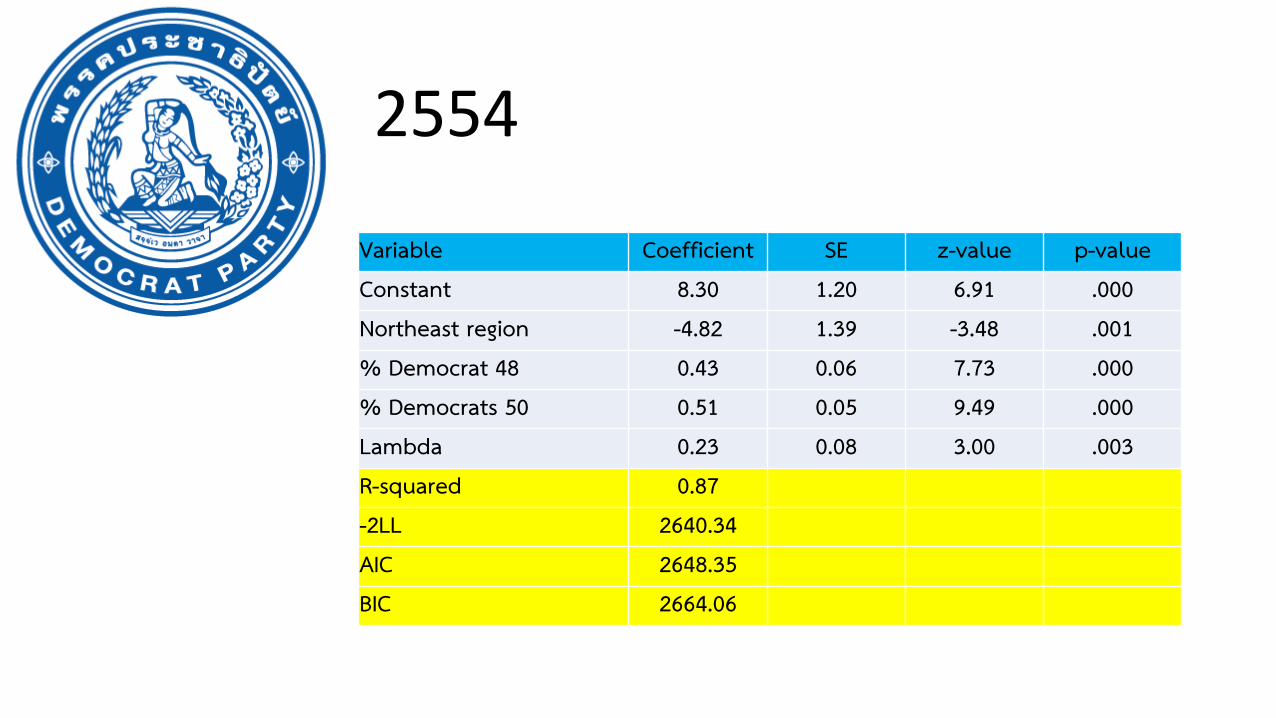
Variable Coefficient SE z-value p-valueConstant 8.30 1.20 6.91 .000Northeast region -4.82 1.39 -3.48 .001% Democrat 48 0.43 0.06 7.73 .000% Democrats 50 0.51 0.05 9.49 .000Lambda 0.23 0.08 3.00 .003R-squared 0.87-2LL 2640.34AIC 2648.35BIC 2664.06
2554
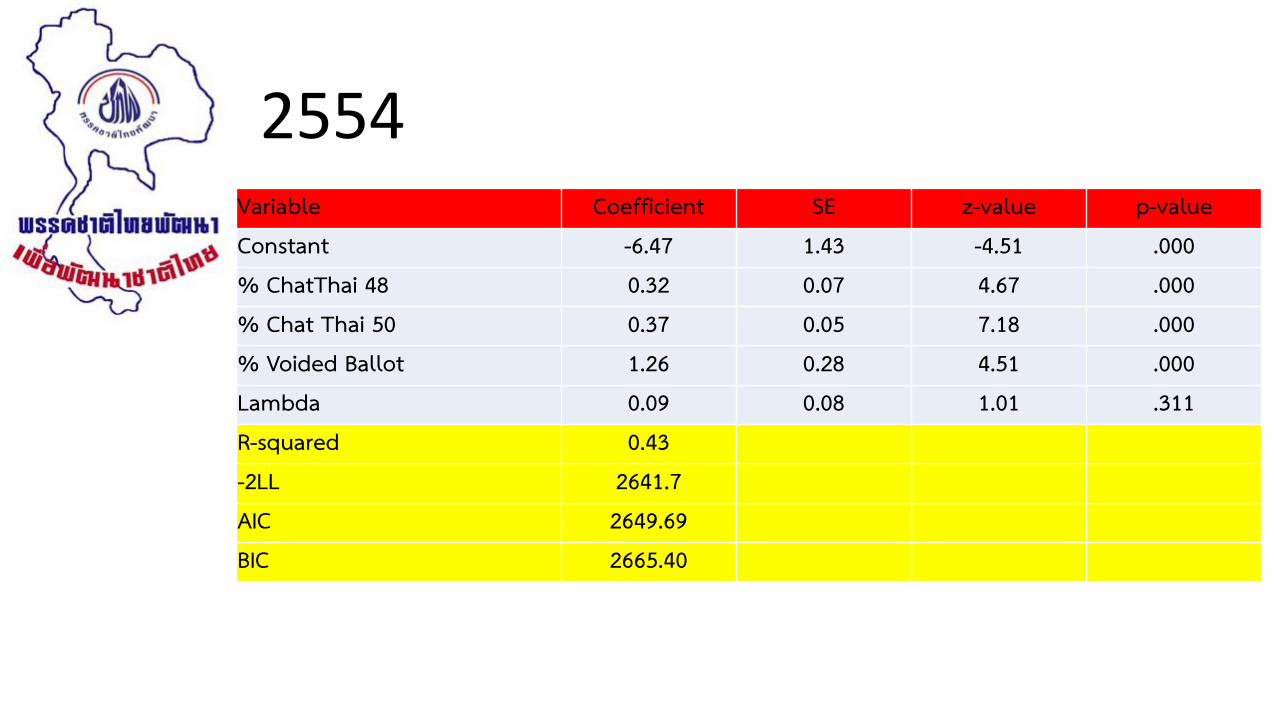
Variable Coefficient SE z-value p-valueConstant -6.47 1.43 -4.51 .000% ChatThai 48 0.32 0.07 4.67 .000% Chat Thai 50 0.37 0.05 7.18 .000% Voided Ballot 1.26 0.28 4.51 .000Lambda 0.09 0.08 1.01 .311R-squared 0.43-2LL 2641.7AIC 2649.69BIC 2665.40
2554
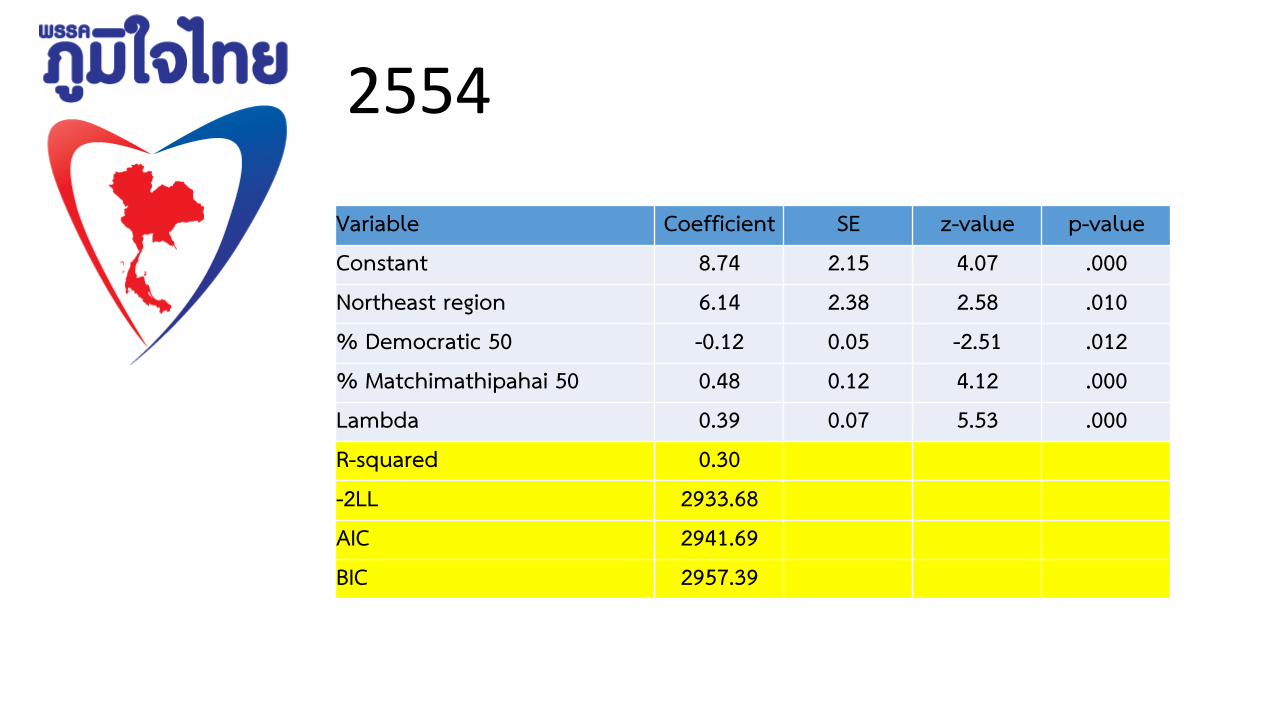
Variable Coefficient SE z-value p-valueConstant 8.74 2.15 4.07 .000Northeast region 6.14 2.38 2.58 .010% Democratic 50 -0.12 0.05 -2.51 .012% Matchimathipahai 50 0.48 0.12 4.12 .000Lambda 0.39 0.07 5.53 .000R-squared 0.30-2LL 2933.68AIC 2941.69BIC 2957.39
2554
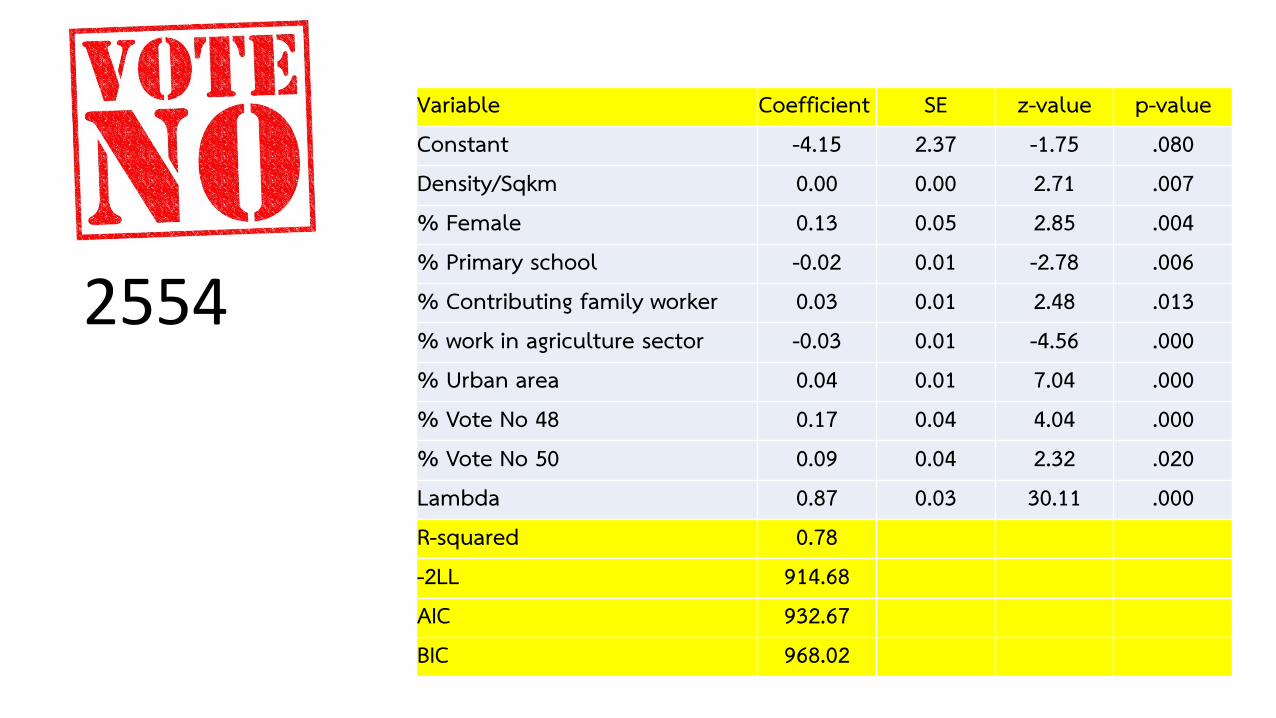
Variable Coefficient SE z-value p-valueConstant -4.15 2.37 -1.75 .080Density/Sqkm 0.00 0.00 2.71 .007% Female 0.13 0.05 2.85 .004% Primary school -0.02 0.01 -2.78 .006% Contributing family worker 0.03 0.01 2.48 .013% work in agriculture sector -0.03 0.01 -4.56 .000% Urban area 0.04 0.01 7.04 .000% Vote No 48 0.17 0.04 4.04 .000% Vote No 50 0.09 0.04 2.32 .020Lambda 0.87 0.03 30.11 .000R-squared 0.78-2LL 914.68AIC 932.67BIC 968.02
2554
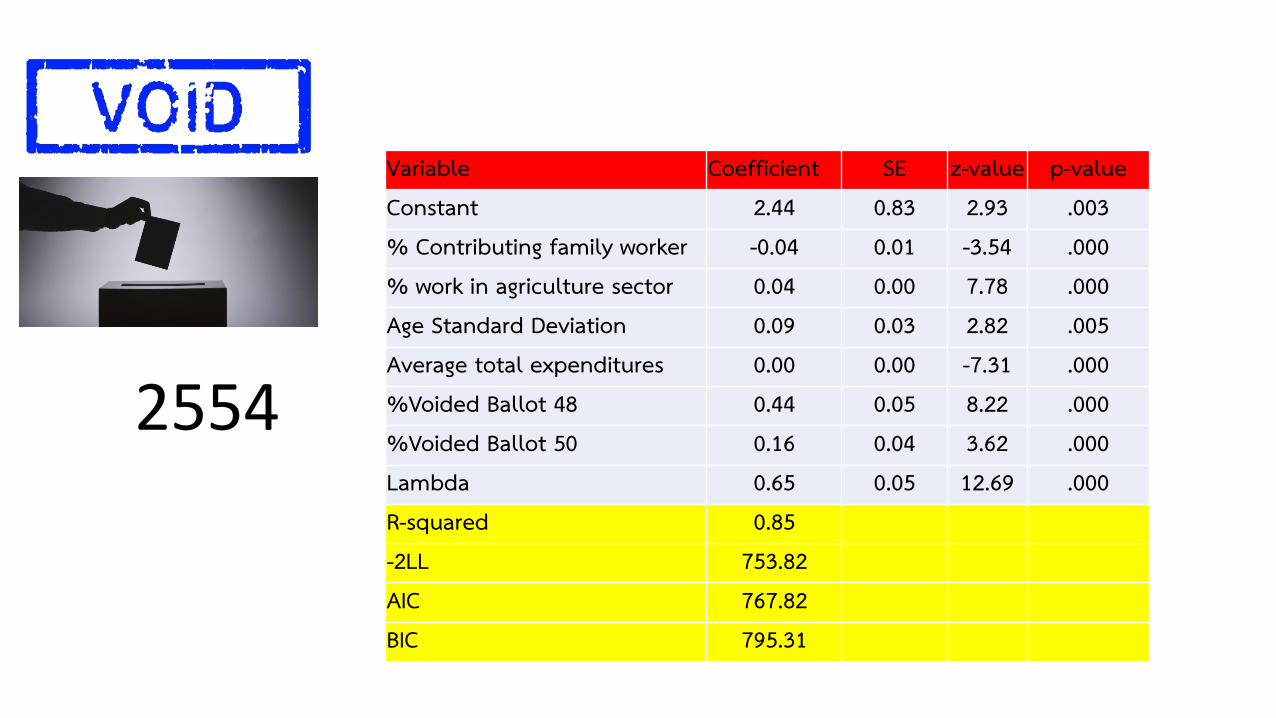
Variable Coefficient SE z-value p-valueConstant 2.44 0.83 2.93 .003% Contributing family worker -0.04 0.01 -3.54 .000% work in agriculture sector 0.04 0.00 7.78 .000Age Standard Deviation 0.09 0.03 2.82 .005Average total expenditures 0.00 0.00 -7.31 .000%Voided Ballot 48 0.44 0.05 8.22 .000%Voided Ballot 50 0.16 0.04 3.62 .000Lambda 0.65 0.05 12.69 .000R-squared 0.85-2LL 753.82AIC 767.82BIC 795.31
2554
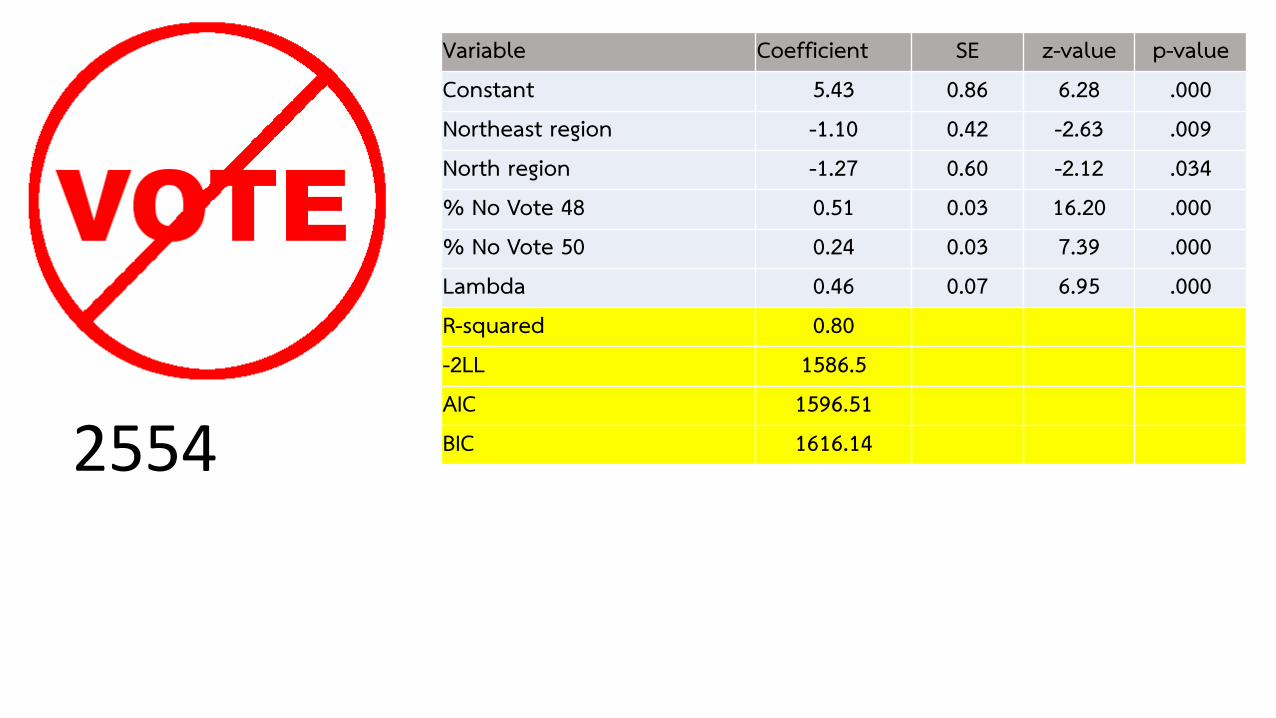
Variable Coefficient SE z-value p-valueConstant 5.43 0.86 6.28 .000Northeast region -1.10 0.42 -2.63 .009North region -1.27 0.60 -2.12 .034% No Vote 48 0.51 0.03 16.20 .000% No Vote 50 0.24 0.03 7.39 .000Lambda 0.46 0.07 6.95 .000R-squared 0.80-2LL 1586.5AIC 1596.51BIC 1616.142554
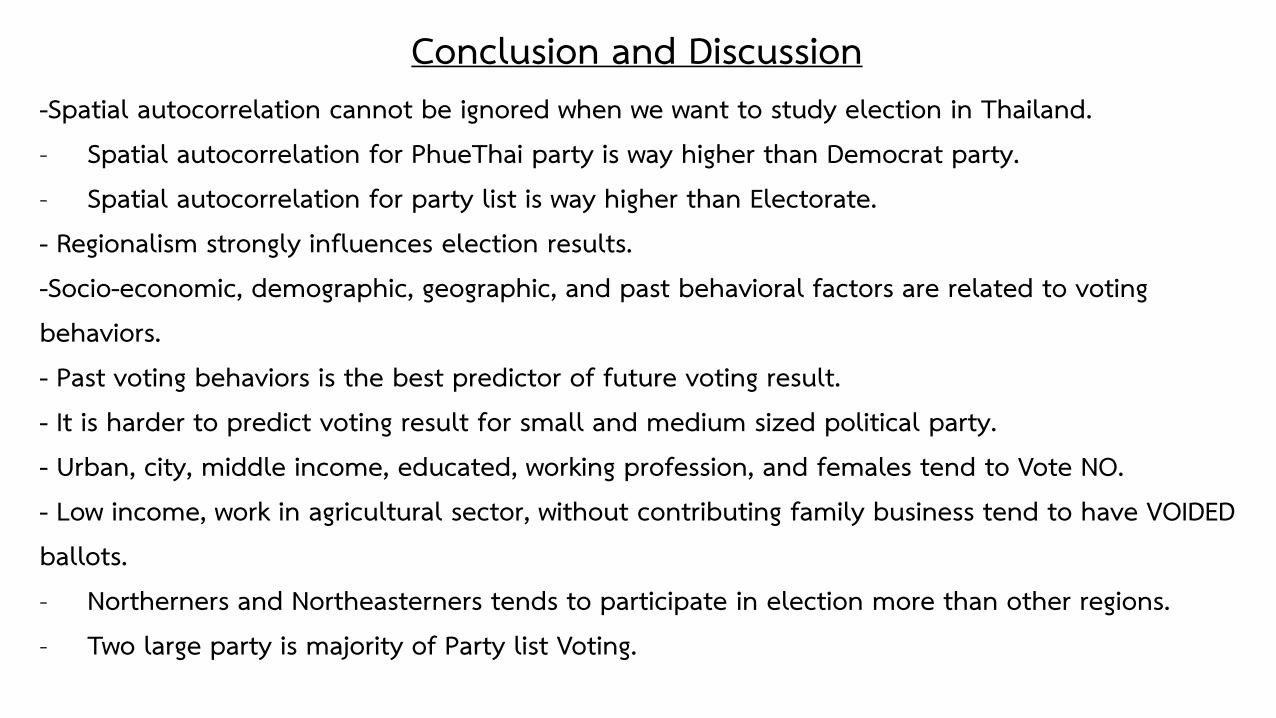
-Spatial autocorrelation cannot be ignored when we want to study election in Thailand.- Spatial autocorrelation for PhueThai party is way higher than Democrat party.- Spatial autocorrelation for party list is way higher than Electorate.- Regionalism strongly influences election results.-Socio-economic, demographic, geographic, and past behavioral factors are related to voting behaviors.- Past voting behaviors is the best predictor of future voting result.- It is harder to predict voting result for small and medium sized political party.- Urban, city, middle income, educated, working profession, and females tend to Vote NO.- Low income, work in agricultural sector, without contributing family business tend to have VOIDED ballots.- Northerners and Northeasterners tends to participate in election more than other regions.- Two large party is majority of Party list Voting.
Conclusion and Discussion
-Spatial regression models predicting party list voting result- Develop model to predict future voting result when public election polls is available.- Political development and socio-economic development
Future Research
The 2010 Household Socio-Economic Survey Whole Kingdom. National Statistical Office (NSO)
• Area Survey: Whole Kingdom (both municipal and non-municipal areas)
• Duration: January to December, 2010
• Sample: 52,000 Households