Embed Size (px)
Citation preview
COMPUTER SIMULATION OF DRAWING PROCESS WITH SHEAR
Chief researcher, Candidate of Science (Engineering) Semenov V.I., junior researcher Raab A.G. Institute of Physics of Advanced Materials – Ufa State Aviation Technical University, Ufa, Russia
Abstract: With the help of computer simulation in the software “DEFORM-3D” there was performed virtual complete factor experiment of the drawing with shear process, in its course there was performed assessment of influence of independent parameters (drawing speed, die rotation speed, die angle and friction factor) on the strain intensity. As a result of the experiment there was derived a regression equation and were determined the most significant individual factors and their combination, which influence the response parameters. Also, there were represented the comparative results of processes of conventional drawing and shear drawing. There was demonstrated a higher efficiency of shear drawing process from the point of view of strain intensity. KEYWORDS: COMPUTER SIMULATION, SHEAR DRAWING, VIRTUAL COMPLETE FACTOR EXPERIMENT, PLANNING MATRIX, DEFORMATION INTENSITY.
1. Introduction At present time there is observed a considerable interest to studies in the sphere of strength increase of metals by means of structure refinement to submicrocrystalline (SMC) dimensions via processing under conditions of severe plastic deformation (SPD) [1]. One of the most advanced techniques of SPD is multicycle equal channel angular pressing (ECAP) [2, 3] and its further development - ECAP-Conform [4], designed for production of long-length billets with a bulk SMC structure and allowing creating background for practical realization of the SPD process. Technological process, based on structure refinement by the SPD technique and realized on the ECAP-conform die-set is a highly efficient technique of strength increase of metals and alloys. However this technique has a number of drawbacks: 1) multicycle processing for achievement of high values of accumulated strain, which is the basis for strength increase of the processed material; 2) production of long-length rods with a square cross section; 3) introduction of additional post-processing treatment, for example drawing (calibration), for getting rods with a round cross section.
2. Background for solution of the problem For elimination of the mentioned drawbacks there is suggested the method of drawing with shear. The invention is designed for formation of a SMC structure and increase of a complex of mechanical properties in long-length metallic materials with the length to diameter ratio of over 100 by means of deformation processing. The method comprises drawing with shear and deformation of the metal by means of application of the tractive force via two successive conical drawing dies with simultaneous rotation of one of the drawing dies. Performance of the low-cost production deformation process, accompanied by change of physical-mechanical properties of metal is achieved by means of providing of additional shear strain by the set eccentricity in relation to the axis of rotation, formed by the conical channel of the rotating drawing die [5]. The behavior description and forecasting of the process of drawing with shear is complicated due to the lack of full-scale experiments, as work on physical experiments is both time and money-consuming. In the scientific and practical activity a significant place is occupied by numerical methods of complex processes study, including computer simulation with application of the up-to-date software. However efficiency of application of simulation techniques and solution of engineering tasks considerably increases if on the stage, preceding to the design of the real technological process, there are created conditions for assessment of value of the most important parameters. Application of mathematical methods for simulation of labor-intensive and high-cost experiments is one of the most rational approaches to solution of tasks on assessment of efficiency of non-standard forming processes. Therefore it appears reasonable to perform numerical simulation with planning of virtual complete factor experiment by the “path-of-steepest-ascent” method [6].
The advantage of the factor experiment is the possibility to describe the process with complete compliance with the algorithm of the physical experiment taking into account the set assumptions. The complete factor experiment is the most easily realizable one among numerous methods of physical experiment. The aim of application of the complete factor experiment is getting the linear mathematic model of the process, which allows determining the further strategy for performance of the real experiment. Thus, the aim of the simulation is performance of the virtual process of drawing with shear with the help of the complete factor experiment, and determination of the most efficient drawing regime for production of long-length SMC semi-products.
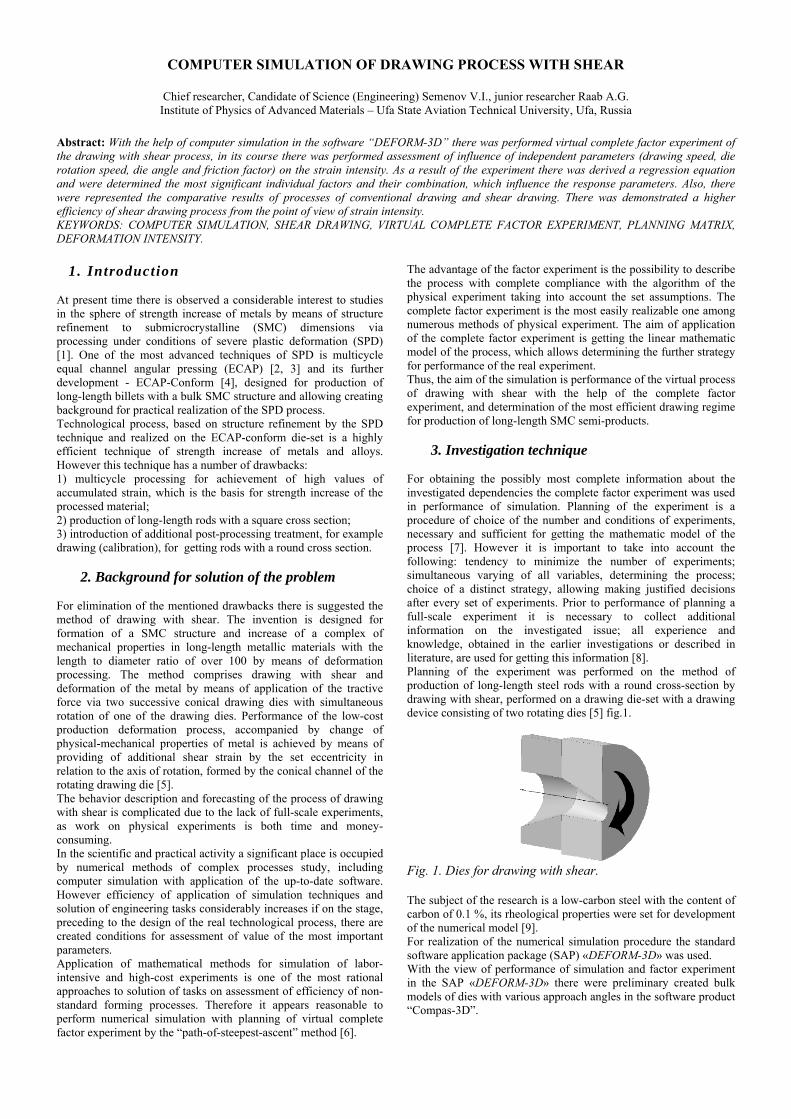
3. Investigation technique For obtaining the possibly most complete information about the investigated dependencies the complete factor experiment was used in performance of simulation. Planning of the experiment is a procedure of choice of the number and conditions of experiments, necessary and sufficient for getting the mathematic model of the process [7]. However it is important to take into account the following: tendency to minimize the number of experiments; simultaneous varying of all variables, determining the process; choice of a distinct strategy, allowing making justified decisions after every set of experiments. Prior to performance of planning a full-scale experiment it is necessary to collect additional information on the investigated issue; all experience and knowledge, obtained in the earlier investigations or described in literature, are used for getting this information [8]. Planning of the experiment was performed on the method of production of long-length steel rods with a round cross-section by drawing with shear, performed on a drawing die-set with a drawing device consisting of two rotating dies [5] fig.1.
Fig. 1. Dies for drawing with shear.
The subject of the research is a low-carbon steel with the content of carbon of 0.1 %, its rheological properties were set for development of the numerical model [9]. For realization of the numerical simulation procedure the standard software application package (SAP) «DEFORM-3D» was used. With the view of performance of simulation and factor experiment in the SAP «DEFORM-3D» there were preliminary created bulk models of dies with various approach angles in the software product “Compas-3D”.
3.1. Taken assumptions 1) billet material in the initial condition (prior to deformation) is isotropic, there are no initial stresses and strains in it; 2) deformation environment temperature is 20ºС; 3) the tool is absolutely rigid, automated consideration of the tool geometry; 4) initial billet material is plastic; 5) prior to start of simulation, the die, which is a movable tool, was set with the rotating speed of 1.5 mm/sec along the drawing axis, and also the rotation frequency of 10 rad. There were chosen 100 steps for simulation, reflecting complete passing of the billet through the dies and getting of a stable result; 6) The billet was divided into 43553 elements in the form of trapezoids.
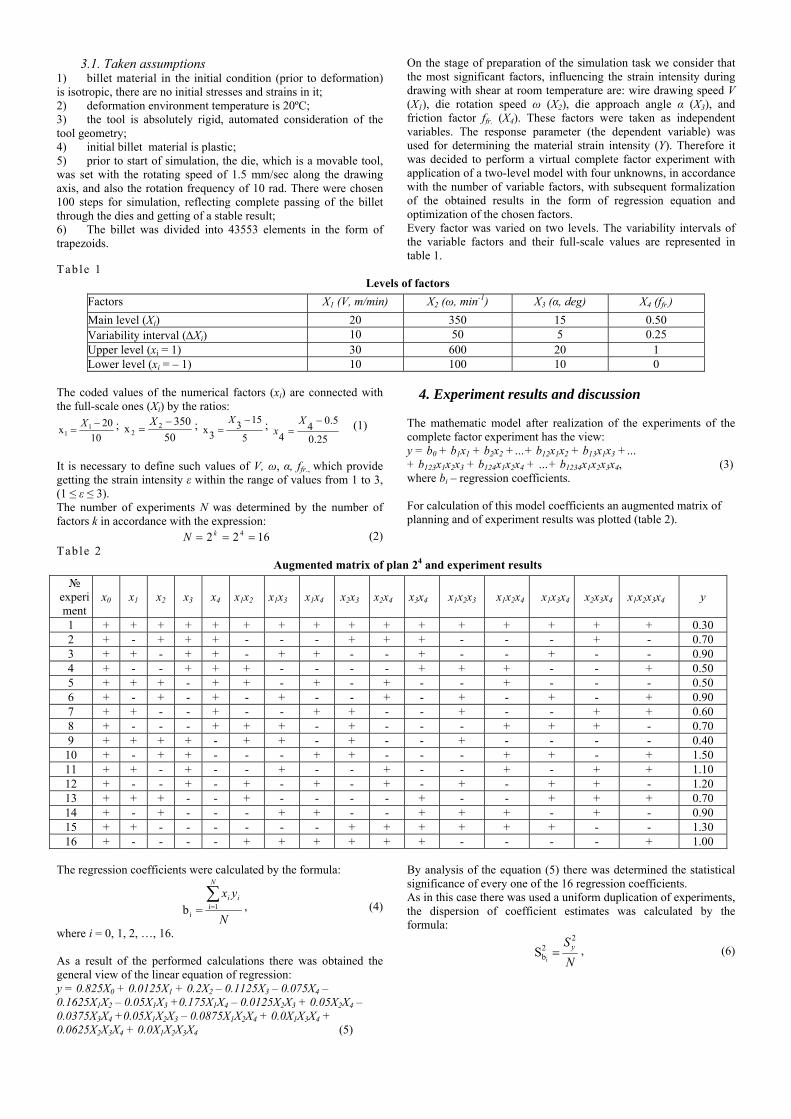
On the stage of preparation of the simulation task we consider that the most significant factors, influencing the strain intensity during drawing with shear at room temperature are: wire drawing speed V (Х1), die rotation speed ω (Х2), die approach angle α (Х3), and friction factor ffr. (Х4). These factors were taken as independent variables. The response parameter (the dependent variable) was used for determining the material strain intensity (Y). Therefore it was decided to perform a virtual complete factor experiment with application of a two-level model with four unknowns, in accordance with the number of variable factors, with subsequent formalization of the obtained results in the form of regression equation and optimization of the chosen factors. Every factor was varied on two levels. The variability intervals of the variable factors and their full-scale values are represented in table 1.
Tab le 1 Levels of factors
Factors X1 (V, m/min) X2 (ω, min-1) X3 (α, deg) X4 (ffr.)
Main level (Xi) 20 350 15 0.50 Variability interval (Xi) 10 50 5 0.25 Upper level (xi = 1) 30 600 20 1 Lower level (xi = – 1) 10 100 10 0
The coded values of the numerical factors (xi) are connected with the full-scale ones (Xi) by the ratios:
10
20x 1
1
X ; 50
350x 2
2
X ; 5
1533x
X ; 25.0
5.04
4
Xx (1)
It is necessary to define such values of V, ω, α, ffr., which provide getting the strain intensity ε within the range of values from 1 to 3, (1 ≤ ε ≤ 3). The number of experiments N was determined by the number of factors k in accordance with the expression:
1622 4 kN (2)
4. Experiment results and discussion
The mathematic model after realization of the experiments of the complete factor experiment has the view: y = b0 + b1x1 + b2x2 +…+ b12x1x2 + b13x1x3 +… + b123x1x2x3 + b124x1x2x4 + …+ b1234x1x2x3x4, (3) where bi – regression coefficients. For calculation of this model coefficients an augmented matrix of planning and of experiment results was plotted (table 2).
Tab le 2 Augmented matrix of plan 24 and experiment results
№ experiment
х0 х1 х2 х3 х4 х1х2 х1х3 х1х4 х2х3 х2х4 х3х4 х1х2х3 х1х2х4 х1х3х4 х2х3х4 х1х2х3х4 у
1 + + + + + + + + + + + + + + + + 0.30 2 + - + + + - - - + + + - - - + - 0.70 3 + + - + + - + + - - + - - + - - 0.90 4 + - - + + + - - - - + + + - - + 0.50 5 + + + - + + - + - + - - + - - - 0.50 6 + - + - + - + - - + - + - + - + 0.90 7 + + - - + - - + + - - + - - + + 0.60 8 + - - - + + + - + - - - + + + - 0.70 9 + + + + - + + - + - - + - - - - 0.40 10 + - + + - - - + + - - - + + - + 1.50 11 + + - + - - + - - + - - + - + + 1.10 12 + - - + - + - + - + - + - + + - 1.20 13 + + + - - + - - - - + - - + + + 0.70 14 + - + - - - + + - - + + + - + - 0.90 15 + + - - - - - - + + + + + + - - 1.30 16 + - - - - + + + + + + - - - - + 1.00
The regression coefficients were calculated by the formula:
N
yxN
ii 1i
ib , (4)
where i = 0, 1, 2, …, 16. As a result of the performed calculations there was obtained the general view of the linear equation of regression: y = 0.825X0 + 0.0125X1 + 0.2X2 – 0.1125X3 – 0.075X4 – 0.1625X1X2 – 0.05X1X3 +0.175X1X4 – 0.0125X2X3 + 0.05X2X4 – 0.0375X3X4 +0.05X1X2X3 – 0.0875X1X2X4 + 0.0X1X3X4 + 0.0625X2X3X4 + 0.0X1X2X3X4 (5)
By analysis of the equation (5) there was determined the statistical significance of every one of the 16 regression coefficients. As in this case there was used a uniform duplication of experiments, the dispersion of coefficient estimates was calculated by the formula:
N
Sy2
2bi
S , (6)
where 2yS = 0.0137 – experiment dispersion, calculated by the
known techniques [10]. Therefrom 2bi
S = 0.00086, and the root-
mean-square error ibS = 0.0293.
In case of significance level = 0.05 and the number of degrees of freedom f1 = N = 16 the table value of the t-Student criterion t0.05; 16 = 2.12 [10]. Then the confidence interval of the regression
coefficients ib equals:
0621.01i ;b
ibf St . (7)
Coefficients, the absolute value of which is equal or higher than the
confidence interval bi ib , are accepted as statistically
significant [10]. In this case bi 0.0621, i.e. these are b2, b3, b4, b12, b14, b124, b234. Statistically insignificant coefficients b1, b13, b23, b24, b34, b123, b134, b1234 were removed from the equation (5), and after realization of the complete factor experiment 24 the regression equation got the view: y = 0.825X0 + 0.2X2 – 0.1125X3 – 0.075X4 + 0.1025X1X2 +0.175X1X4 – 0.0875X1X2X4 + 0.0625X2X3X4 (8) Hypothesis of adequacy of the model was checked with the help of F-ratio test. With the help of the equation (8), there were determined the calculated values уcalc and then they were compared with the experimental values уexp (table 3). Tab le 3
Comparison of the experimental and calculated data №
experiment Уexp Уcalc /у/ у2
1 0.30 0.425 0.125 0.015625 2 0.70 0.575 0.125 0.015625 3 0.90 0.715 0.175 0.030625 4 0.50 0.355 0.145 0.021025 5 0.50 0.475 0.025 0.000625 6 0.90 0.825 0.075 0.005625 7 0.60 0.575 0.025 0.000625 8 0.70 0.685 0.015 0.000225 9 0.40 0.375 0.025 0.000625
10 1.50 1.550 0.050 0.002500 11 1.10 1.175 0.075 0.005625 12 1.20 1.150 0.050 0.002500 13 0.70 0.675 0.025 0.000625 14 0.90 1.075 0.175 0.030625 15 1.30 1.150 0.150 0.022500 16 1.00 1.150 0.150 0.022500
As duplication of the experiments was uniform, the dispersion of inadequacy was determined by the formula:
2
2N
1uuu
2inad f
)y(yS
expcalc
, (9)
where f2 = N – k’ – number of degrees of freedom, k’ – number of remained equation coefficients (including b0). The obtained model (8) comprised 8 coefficients, thus the number of freedom degrees f2
= 8, and dispersion of inadequacy 2inadS = 0.0222.
The calculated value of the F-ratio was determined by the formula:
2y
2inad
; S
SF
12calc
ff. (10)
F-ratio value represents the ratio of the dispersion of inadequacy to dispersion of the experiment and answers the question, by how many times the model forecasts worse than the experiment. The hypothesis of adequacy of the equation is accepted in case when the calculated value of the F-ratio does not exceed the table value for the selected level of significance, i.e. when Fcalc Ftable.
The calculated value of the F-ratio calc
16;8F = 1.62, in case of the
level of significance = 0.05 the table value of the F-ratio table
16;8;05.0F = 2.64.
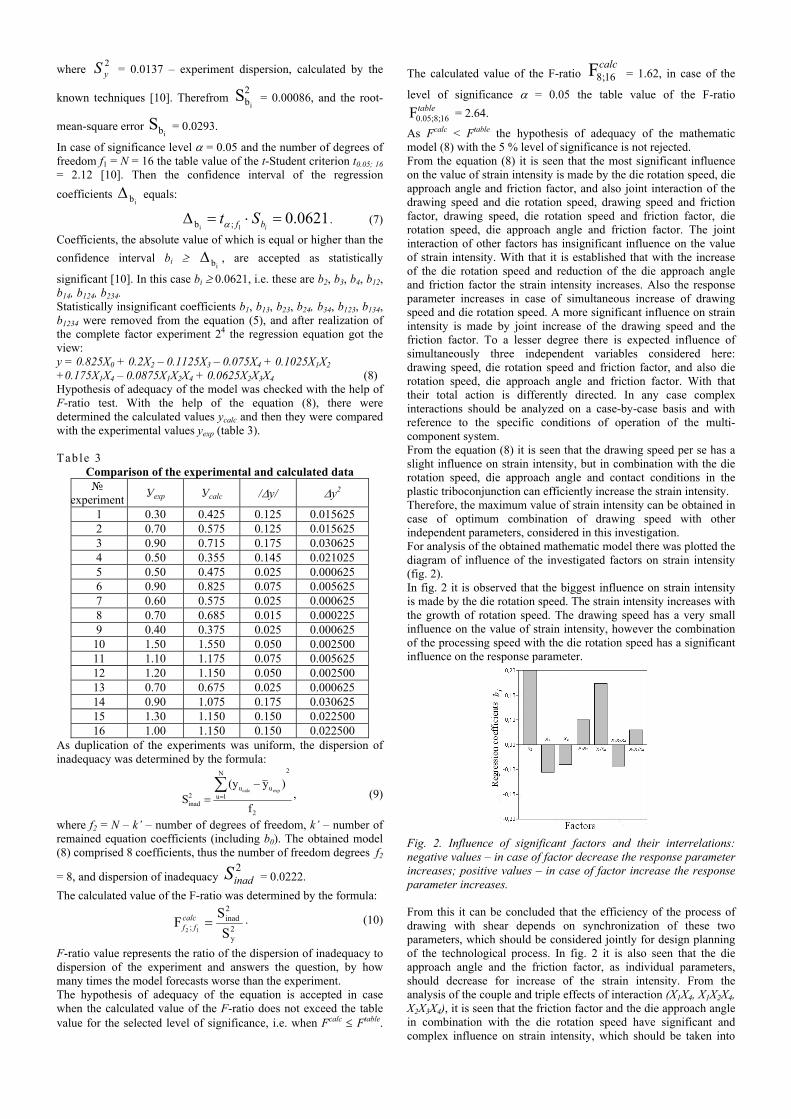
As Fcalc < Ftable the hypothesis of adequacy of the mathematic model (8) with the 5 % level of significance is not rejected. From the equation (8) it is seen that the most significant influence on the value of strain intensity is made by the die rotation speed, die approach angle and friction factor, and also joint interaction of the drawing speed and die rotation speed, drawing speed and friction factor, drawing speed, die rotation speed and friction factor, die rotation speed, die approach angle and friction factor. The joint interaction of other factors has insignificant influence on the value of strain intensity. With that it is established that with the increase of the die rotation speed and reduction of the die approach angle and friction factor the strain intensity increases. Also the response parameter increases in case of simultaneous increase of drawing speed and die rotation speed. A more significant influence on strain intensity is made by joint increase of the drawing speed and the friction factor. To a lesser degree there is expected influence of simultaneously three independent variables considered here: drawing speed, die rotation speed and friction factor, and also die rotation speed, die approach angle and friction factor. With that their total action is differently directed. In any case complex interactions should be analyzed on a case-by-case basis and with reference to the specific conditions of operation of the multi-component system. From the equation (8) it is seen that the drawing speed per se has a slight influence on strain intensity, but in combination with the die rotation speed, die approach angle and contact conditions in the plastic triboconjunction can efficiently increase the strain intensity. Therefore, the maximum value of strain intensity can be obtained in case of optimum combination of drawing speed with other independent parameters, considered in this investigation. For analysis of the obtained mathematic model there was plotted the diagram of influence of the investigated factors on strain intensity (fig. 2). In fig. 2 it is observed that the biggest influence on strain intensity is made by the die rotation speed. The strain intensity increases with the growth of rotation speed. The drawing speed has a very small influence on the value of strain intensity, however the combination of the processing speed with the die rotation speed has a significant influence on the response parameter.
Fig. 2. Influence of significant factors and their interrelations: negative values – in case of factor decrease the response parameter increases; positive values – in case of factor increase the response parameter increases.
From this it can be concluded that the efficiency of the process of drawing with shear depends on synchronization of these two parameters, which should be considered jointly for design planning of the technological process. In fig. 2 it is also seen that the die approach angle and the friction factor, as individual parameters, should decrease for increase of the strain intensity. From the analysis of the couple and triple effects of interaction (Х1Х4, Х1Х2Х4, Х2Х3Х4), it is seen that the friction factor and the die approach angle in combination with the die rotation speed have significant and complex influence on strain intensity, which should be taken into
account for design planning of the technological process of drawing with shear. Of practical interest is the solution of the optimization task on determination of actual values of independent parameters, considered in the virtual experiment of numerical simulation, providing maximum value of strain intensity in case of drawing with shear. This task was solved by the “path-of-steepest ascent” method. In accordance with this method the movement from a certain point inside the investigated area in direction of the gradient i.e. in direction of the biggest derivative of the response function – is the shortest way to extreme point. In case of presence of the linear model for performance of movement by the gradient it is necessary to vary factor values proportionally to the coefficient values b1, b2, b3, b4 taking into account their modifying sign. Steps in variation of factors were calculated in full-scale. Firstly there were determined the multiplications of coefficients to the corresponding intervals of variation of the factors, (biXi), then in
proportion to these products there were set steps. The orders of realization of the stages of the path-of-steepest-ascent are represented in table 4. As the characteristics of the stress-strain condition, having a significant influence on strain intensity, are die rotation speed, die approach angle and friction factor (the drawing speed influence in the investigated range was considered as statistically insignificant), the three factors mentioned above were taken as main factors, subject to variation. The values biXi, were used for determining the steps of factor variation in the following way:
2
1
22
11
b
b
X
X ;
3
1
33
11
b
b
X
X ;
4
1
44
11
b
b
X
X (11)
As the response function is the value of strain intensity, the steps in direction opposite to their modifying signs will decrease the value of function y.
Tab le 4
Path-of-steepest-ascent
Factors Х1 (drawing
speed, m/min) X2 (die rotation speed, min-1)
X3 (die approach angle,
deg)
X4 (friction factor)
y (strain intensity)
bi biXi Step
Step after rounding-off
0.0125 5* 10 10
0.20 10.00
20 50
- 0.1125 - 0.5625 - 1.125 - 2.0
- 0.075 - 0.019 - 0.038 - 0.05
Main level (Xi) 20 350 15 0.50 Thought experiment Realized experiment Thought experiment
15 15 15
100 150 200
20 18 16
0.45 0.40 0.35
0.90
Thought experiment Realized experiment Thought experiment
15 15 15
250 300 350
14 12 10
0.30 0.25 0.20
0.70
Thought experiment Realized experiment Realized experiment
15 15 15
400 300 500
20 18 16
0.15 0.10 0.12
1.20 1.60
Thought experiment Realized experiment Thought experiment
15 15 15
550 600 600
14 12 10
0.15 0.10 0.05
0.70
* value biXi for Х1 (drawing speed) was set a priori due to the necessity to synchronize this factor with other independent variable parameters, taken for consideration. The step was chosen at random due to technological reasons Some of the thought experiments were realized in the computer model (table 4). The experiment planning with application of the path-of-steepest-ascent method demonstrated that under the investigated conditions the highest strain intensity will be at high speed of die rotation (ω ≈ 600 min-1), low die approach angle (α ≈ 10o) and the decreasing friction factor (ffr. → min). With that the axial drawing speed (V), due to the low influence on the strain intensity as an individual parameter was taken as constant and equal to 15 m/min. Within the frames of the set investigation task there were obtained optimized values of the variable parameters, corresponding to the required value of strain intensity (ε ≥ 1.5): V = 15 m/min; V1 = 500 rot/min; α = 16°. By insertion of the obtained values into the new model, with other conditions being equal, we get the distribution fields of stresses and strains, and also the corrected value of strain intensity. Simulation of the process of drawing with shear in the «DEFORM 3D» was performed with the following adjusted parameters: Friction factor (Siebel) 0.12 Die approach angle, deg 16 Drawing speed, m/min 15 Die rotation speed, min-1 500
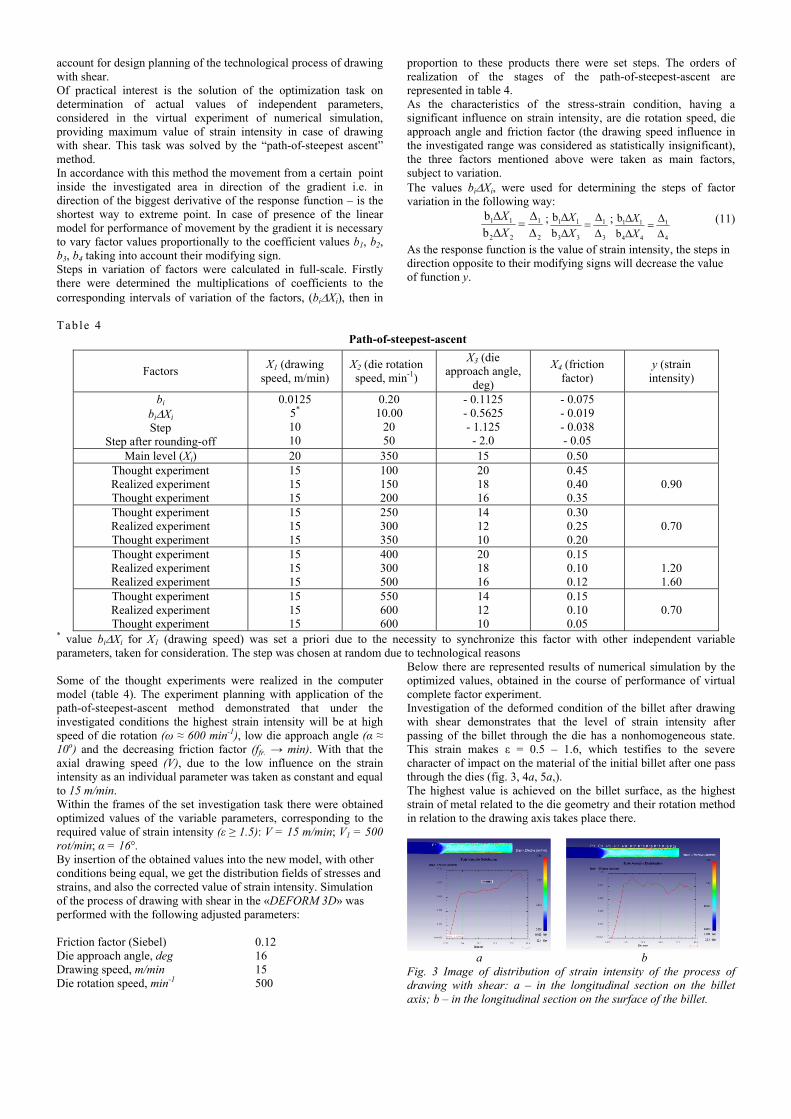
Below there are represented results of numerical simulation by the optimized values, obtained in the course of performance of virtual complete factor experiment. Investigation of the deformed condition of the billet after drawing with shear demonstrates that the level of strain intensity after passing of the billet through the die has a nonhomogeneous state. This strain makes ε = 0.5 – 1.6, which testifies to the severe character of impact on the material of the initial billet after one pass through the dies (fig. 3, 4а, 5а,). The highest value is achieved on the billet surface, as the highest strain of metal related to the die geometry and their rotation method in relation to the drawing axis takes place there.
a b Fig. 3 Image of distribution of strain intensity of the process of drawing with shear: а – in the longitudinal section on the billet axis; b – in the longitudinal section on the surface of the billet.
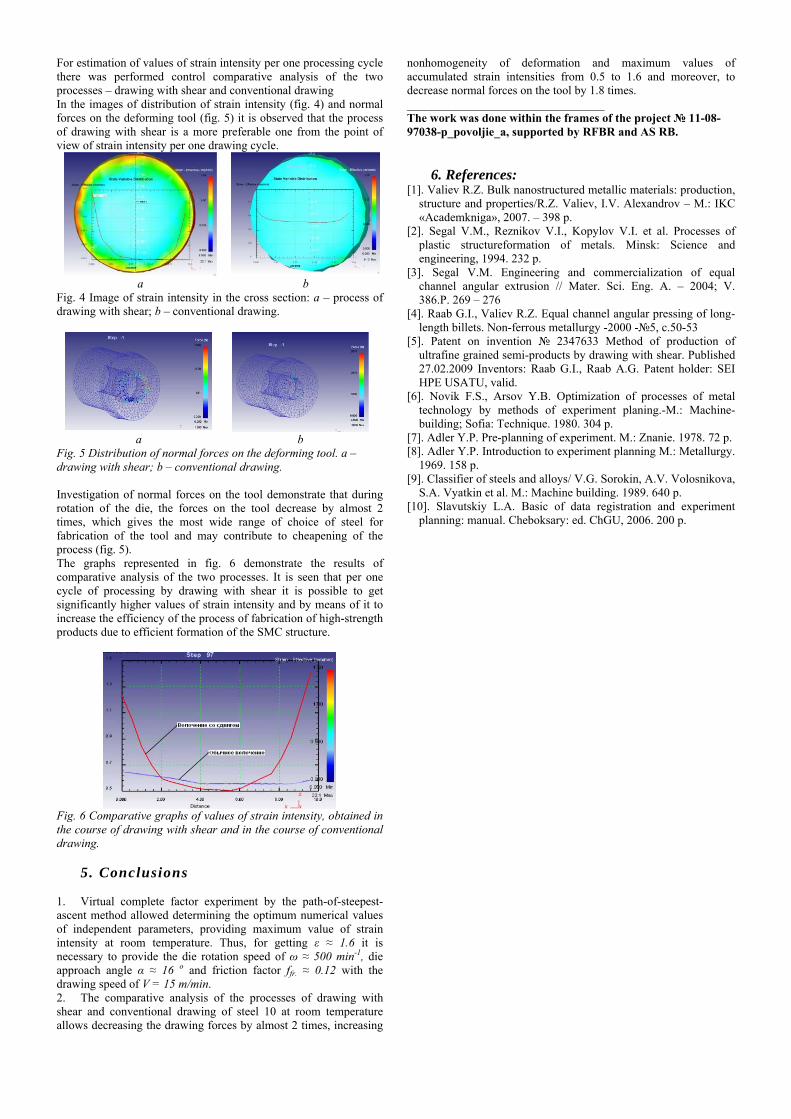
For estimation of values of strain intensity per one processing cycle there was performed control comparative analysis of the two processes – drawing with shear and conventional drawing In the images of distribution of strain intensity (fig. 4) and normal forces on the deforming tool (fig. 5) it is observed that the process of drawing with shear is a more preferable one from the point of view of strain intensity per one drawing cycle.
а b
Fig. 4 Image of strain intensity in the cross section: а – process of drawing with shear; b – conventional drawing.
а b
Fig. 5 Distribution of normal forces on the deforming tool. а – drawing with shear; b – conventional drawing. Investigation of normal forces on the tool demonstrate that during rotation of the die, the forces on the tool decrease by almost 2 times, which gives the most wide range of choice of steel for fabrication of the tool and may contribute to cheapening of the process (fig. 5). The graphs represented in fig. 6 demonstrate the results of comparative analysis of the two processes. It is seen that per one cycle of processing by drawing with shear it is possible to get significantly higher values of strain intensity and by means of it to increase the efficiency of the process of fabrication of high-strength products due to efficient formation of the SMC structure.
Fig. 6 Comparative graphs of values of strain intensity, obtained in the course of drawing with shear and in the course of conventional drawing.
5. Conclusions
1. Virtual complete factor experiment by the path-of-steepest-ascent method allowed determining the optimum numerical values of independent parameters, providing maximum value of strain intensity at room temperature. Thus, for getting ε ≈ 1.6 it is necessary to provide the die rotation speed of ω ≈ 500 min-1, die approach angle α ≈ 16 о and friction factor ffr. ≈ 0.12 with the drawing speed of V = 15 m/min. 2. The comparative analysis of the processes of drawing with shear and conventional drawing of steel 10 at room temperature allows decreasing the drawing forces by almost 2 times, increasing
nonhomogeneity of deformation and maximum values of accumulated strain intensities from 0.5 to 1.6 and moreover, to decrease normal forces on the tool by 1.8 times. _________________________________ The work was done within the frames of the project № 11-08-97038-р_povoljie_а, supported by RFBR and AS RB.
6. References: [1]. Valiev R.Z. Bulk nanostructured metallic materials: production,
structure and properties/R.Z. Valiev, I.V. Alexandrov – М.: IKC «Academkniga», 2007. – 398 p.
[2]. Segal V.M., Reznikov V.I., Kopylov V.I. et al. Processes of plastic structureformation of metals. Minsk: Science and engineering, 1994. 232 p.
[3]. Segal V.M. Engineering and commercialization of equal channel angular extrusion // Mater. Sci. Eng. A. – 2004; V. 386.P. 269 – 276
[4]. Raab G.I., Valiev R.Z. Equal channel angular pressing of long-length billets. Non-ferrous metallurgy -2000 -№5, с.50-53
[5]. Patent on invention № 2347633 Method of production of ultrafine grained semi-products by drawing with shear. Published 27.02.2009 Inventors: Raab G.I., Raab A.G. Patent holder: SEI HPE USATU, valid.
[6]. Novik F.S., Arsov Y.B. Optimization of processes of metal technology by methods of experiment planing.-М.: Machine-building; Sofia: Technique. 1980. 304 p.
[7]. Adler Y.P. Pre-planning of experiment. М.: Znanie. 1978. 72 p. [8]. Adler Y.P. Introduction to experiment planning М.: Metallurgy.
1969. 158 p. [9]. Classifier of steels and alloys/ V.G. Sorokin, A.V. Volosnikova,
S.A. Vyatkin et al. М.: Machine building. 1989. 640 p. [10]. Slavutskiy L.A. Basic of data registration and experiment
planning: manual. Cheboksary: ed. ChGU, 2006. 200 p.