Embed Size (px)
Citation preview
Sesame trade arrangements, costs and risks in Ethiopia:
A baseline survey
Sorsa Debela Gelalcha February 2009
2
Pictures: Wim Gorris, Herma Mulder and Francesco Cecchi
This report was prepared for publication by Mark Speer
This series is a result of the Partnership Programme between the Netherlands’ Ministry of Foreign Affairs Government and Wageningen UR. The views expressed in this report are the authors' only and do not reflect the views of the Netherlands’ Ministry of Foreign Affairs Government.
The Netherlands’ Directorate-General for International Cooperation and Wageningen UR are implementing the Partnership Programme ‘Globalisation and Sustainable Rural Development’. In the context of conflicting local, national and global interests and drivers of change processes, the programme aims, among other things, to generate options for the sustainable use of natural resources, pro-poor agro-supply chains and agro-biodiversity. Capacity strengthening and institutional development form cross-cutting issues in of the Partnership programme. The programme’s activities contribute to improved rural livelihoods, poverty alleviation and economic development in countries in the south. Farmers and other small-scale entrepreneurs in the agricultural sector form the primary target group. The program has a strong -but not exclusive- focus on countries in Sub-Sahara Africa.
c/o Wageningen International

3

4
5
Table of Contents 0 Executive summary.................................................................................................. 8
0.1 Production and Harvest .......................................................................................... 9 0.2 Sesame Trade Arrangements.................................................................................. 9 0.3 Sesame Value Addition ......................................................................................... 10 0.4 Enabling Environment ........................................................................................... 10
1 Introduction............................................................................................................. 12 1.1 Background and Justification ................................................................................ 12 1.2 Statement of the Problem..................................................................................... 14 1.3 Objectives of the Study......................................................................................... 14 1.4 Relevance of the Study......................................................................................... 14 1.5 Methodologies of the Study .................................................................................. 15
1.5.1 Data Source and Methods of Data Collection ...................................................... 15 1.5.2 Limitations of the Study .................................................................................... 16 1.5.3 Methods of Analysis ......................................................................................... 17 1.5.4 Organization of the Study Report ....................................................................... 17
2 Review of relevant literature...................................................................................... 18 2.1 The Concept of Trade Arrangements, Transaction Costs and Risks .......................... 18 2.2 Sesame Production and Marketing in Ethiopia ........................................................ 19
2.2.1 Production....................................................................................................... 19 2.2.2 Marketing ........................................................................................................ 21
3 main results of the baseline study ............................................................................. 23 3.1 Main Results of the Study at Producers’ Level ........................................................ 23
3.1.1 Demographic Characteristics of Respondents..................................................... 23 3.1.2 Land Ownership ............................................................................................... 23 3.1.3 Agronomic Practices ........................................................................................ 24 3.1.4 Sesame Production, Productivity and Means of Cultivation................................... 26 3.1.5 Problems Associated with Sesame Production.................................................... 29 3.1.6 Sesame Farmers’ Experiences of Different Crises/Problems................................ 29 3.1.7 Problems Associated with Sesame Harvest ........................................................ 30 3.1.8 Storing Sesame and Use at Home ..................................................................... 31 Sesame Trade Arrangements ...................................................................................... 32 3.1.9 Preferred Sesame Trade Arrangement............................................................... 33 3.1.10 Selling Sesame to the Same/Different Collectors ............................................ 34 3.1.11 Time Spent and Number of Buyers Visited by Each Farmer to Sell His/Her Sesame 34 3.1.12 Sesame Marketing Problems and Mechanisms for Denying Farmers Fair Prices. 35 3.1.13 The Extent of Sesame Marketing Problems..................................................... 36 3.1.14 Sesame Sales and Mechanisms of Price Determination and Negotiation............ 37 3.1.15 Sesame Price Trends ................................................................................... 38 3.1.16 Availability of Credit Service .......................................................................... 40 3.1.17 Proposed Solutions for the Problems Associated with Sesame Marketing ......... 40
3.2 Main Results of the Study at Collectors’ Level......................................................... 41 3.2.1 Demographic Characteristics of Local Sesame Collectors ................................... 41 3.2.2 Sesame Trade Arrangements, Problems and Price-Setting Mechanisms................ 41 3.2.3 Sesame Quality Assessment and Available Quantity for Market............................. 43 3.2.4 Sesame Storage and Transaction Arrangements Applied by Collectors................. 45 3.2.5 Sesame Trade-Related Problems and Proposed Solutions at Collectors’ Level ....... 48
6
3.3 Central Market and Export Level............................................................................ 50 3.3.1 Sourcing and Quality Control ............................................................................. 51 3.3.2 Storage and Value Addition Activities ................................................................. 53 3.3.3 Sales Outlets and Arrangements........................................................................ 53 3.3.4 Overall Issues of Chain Operation, Actors’ Relationship and Cooperation ............... 55
4 Conclusions and recommendations ........................................................................... 57 4.1 Production........................................................................................................... 57 4.2 Market Arrangements........................................................................................... 59 4.3 Chain Relations and Estimated Cost and Value-Sharing among the Chain Actors ........ 59 4.4 Main Recommendations........................................................................................ 61
4.4.1 Improve Seed Variety Development Research ..................................................... 61 4.4.2 Devise a System for Regular Access to Market Information.................................. 62 4.4.3 Facilitate Institutional Arrangement to Achieve Smooth Relations and Governance among Chain Actors ...................................................................................................... 62 4.4.4 Improve Credit Facilities and Banking Services ................................................... 62 4.4.5 Improve Logistical Services of the Chain ............................................................ 63 4.4.6 Encourage Local Value Addition......................................................................... 63 4.4.7 Facilitate Effective and Efficient Business Development Service Provisions............ 63 4.4.8 Create and Enhance the Enabling Environment.................................................... 63
5 References.............................................................................................................. 65 Tables Table 2.1: Number of sesame producers, land under cultivation, total production and
productivity in 2005-06 ..................................................................................... 19 Table 2.1: Mean land area owned by respondents by land category and region (in ha.) ...... 23 Table 2.1: Mean land area allocated to sesame by year and region .................................... 24 Table 3.3: Major crops produced by sesame farmers by region .......................................... 25 Table 3.4: Major cash crops produced by sesame farmers by region.................................. 25 Table 3.5: Reasons for not specializing in the production of one potential crop by region.... 26 Table 3.6: Alternative means of cultivating sesame by region............................................. 26 Table 3.7: Estimated average sesame production (in quintals) by years and regions .......... 27 Table 3.8: Estimated average sesame productivity per hectare by years and regions ......... 27 Table 3.9: Estimated cost of sesame production per hectare.............................................. 28 Table 3.10: Problems Associated with Sesame Production ................................................ 29 Table 3.11: Crisis/problems experienced by sesame farmers by region .............................. 30 Table 3.12: Problems associated with sesame harvest by region ....................................... 30 Table 3.13: Reasons for selling sesame immediately after harvest by region...................... 32 Table 3.14: Reasons for not selling all the sesame farmers produce by region ................... 32 Table 3.15: Sesame trade arrangements by region ............................................................ 33 Table 3.16: Preferred Sesame Trade Arrangements by Region.......................................... 33 Table 3.17: Mean time spent (minutes) on different activities in selling sesame by region ... 34 Table 3.18: Mean number of traders visited by each farmer to sell his/her sesame ............. 35 Table 3.19: Mechanisms buyers use to deny farmers fair prices for sesame by region ....... 35 Table 3.20: Extent of sesame marketing problems by region.............................................. 36 Table 3.21: Extent to which farmers trust buyers by region................................................. 36 Table 3.22: Average quintals of sesame sold by year and region ....................................... 37 Table 3.23: Mechanisms of sesame price negotiation by region ......................................... 38 Table 3.24: Indicators of sesame quality used by sesame farmers by region ...................... 38 Table 3.25: Sesame Price Trend over the Last Three Years .............................................. 39
7
Table 3.26: Suggested solutions for minimizing problems associated with sesame transaction by region .......................................................................................................... 40
Table 3.27: Problems associated with sesame collection by region .................................... 41 Table 3.28: The extent to which collectors trust farmers during sesame transactions by
region............................................................................................................... 42 Table 3.29: Average minutes spent by collectors buying sesame from farmers by region ... 43 Table 3.30: Mean quantity, price/quintal & total capital used by each buyer to buy sesame last
year by region ................................................................................................... 44 Table 3.31: Mean sesame prices (in birr) per quintal by grade of sesame per region for the
2007-2008 harvest season ............................................................................... 44 Table 3.32: Average number of minutes spent selling collected sesame to buyers by region46 Table 3.33: The extent to which collectors trust buyers during sesame transactions by region
........................................................................................................................ 46 Table 3.34: Means by which collectors and buyers negotiate sesame prices by region ....... 47 Table 3.35: Price and marginal profit/quintal from sesame sales last season by region ............ 47 Table 3.36: The most important factors determining the price of sesame in local markets by
region............................................................................................................... 47 Table 3.37: Problems faced in sesame transactions by region ........................................... 48 Table 3.38: Suggested solutions for the sesame transaction problems by region................ 49 Table 3.39: Average quintals of sesame bought and percent increase over time by region . 49 Table 3.40: Estimated average costs/quintal of sesame bought other than purchase
expenses in East Wellega ................................................................................ 50 Table 3.41: Summary of different companies’ sesame purchasing plan, accomplishment and
purchasing price. .............................................................................................. 52 Table 3.42: Sales, purchase and margin calculation of the companies ............................... 54 Table 3.43: Estimate of sesame transaction costs by companies for 2007.......................... 56
Figures
Figure 1: Sesame price trend over the three years ............................................................. 39 Figure 2: Sesame Value Chain Map .................................................................................. 60 Figure 3: Breakdown of margins ........................................................................................ 61
Acronyms and abbreviations
EGTE Ethiopian Grain Trade Enterprise EPOSPEA Ethiopian Pulses and Oil Seeds Processing and Export Association MoARD Ministry of Agriculture and Rural Development
8
1 Executive summary Study reports indicate that Ethiopia is among the top-five producers of oilseeds in the world. One of the oilseeds for which Ethiopia is known in the international market is sesame. In the last few years, sesame production and marketing has shown very significant growth. Between 1998 and 2005-06, the total area of production and the quantity of sesame produced has grown threefold. According to different assessments and the plan of the Ministry of Agriculture and Rural Development (MoARD), sesame production can potentially triple again. Similarly, there is considerable international market demand for Ethiopian sesame seed, and this is expected to continue increasing. The increasing international market demand for sesame is not only evident in the rise of export volume but also in new buyers coming to the market. The traditional importers of Ethiopian sesame seed were China, Israel, Turkey and other Middle Eastern countries. Currently, more European countries and Japan are also trying to enter the market. Despite the country’s immense potential to increase its production and productivity and significantly increase the international market’s demand for sesame, both the production and marketing system of sesame is full of challenges for all involved parties. The level of productivity of sesame (seven quintals/hectare) is by far below 50% of the estimated potential of the country and the average productivity level of other sesame-producing countries. Similarly, the sesame value chain is hampered by a variety of constraints, primarily severe coordination challenges. Small amounts of sesame must be collected from a multitude of farmers, which then need to be transported and sold to different markets. As a result, there are transaction risks and high chain costs due to inadequate coordination among the chain actors. In understanding Ethiopia’s great potential for the production of oilseeds, on the one hand, and in recognition of multifaceted production- and marketing-related problems, on the other hand, the Ethiopian-Dutch Public-Private Partnership (PPP) initiative has launched different projects to improve the situation. Besides activities emanating from the PPP initiative, LEI-Wageningen University & Research Centre, financed by DGIS, has established a programme entitled ‘Value Chains for Pro-Poor Development’ and started an action research project on Transaction Risks in the Sesame Chain in Ethiopia. The project aims to analyze sesame trade arrangements, transaction risks and costs in order to identify necessary improvement measures in collaboration with all stakeholders from the sesame sector. Therefore, both initiatives joined forces to conduct a baseline survey on sesame trade arrangements, transaction risks and costs. The main objectives of the study were to investigate the existing situation regarding production and trade arrangements among chain actors at different levels, and depict related transaction costs and risks in order to propose improvement measures. Accordingly, two main sesame production areas (Humera and East Wellega) were selected, and a study of the three main categories of chain actors was conducted: primary producers, local buyers and central market operators and exporters. In-depth information was collected and analyzed at all three levels. The analysis results, which reveal a variety of aspects linked to sesame production and marketing features, are summarized below.
9
1.1 Production and Harvest Sesame is mainly produced for the market and it is wanted for its seed and for the oil in the seed. Seed oil content is the most important parameter for determining its suitability for oil extraction, while sesame coat colour determines the quality for the confectionery market and other purposes. Ethiopia is endowed with different specialty sesame seeds according to information obtained in this survey from the chain actors. However, this potential has not been adequately tapped yet due to different production-related problems. One of these problems is the lack of improvement in the seed supply and the accompanying extension service for producers. Producers depend on traditional seeds for many years, and this is one of the most important factors that determine the (lack of) productivity of the seed. Moreover, there is no considerable extension service provided that would improve the production techniques and management of the sesame farming system. In addition to this, a shortage of input supply, mainly fertilizer, is an additional production problem. Farmers also suspect the prevalence of diseases that are damaging their sesame during the germination and vegetative stages. Because of these and other related problems in areas like East Wellega, the productivity of sesame is becoming dismal, and producers consider it one of the most risky crops. As a result of this, most producers have started substituting sesame with other crops like maize and sorghum, which they consider less risky and more profitable. On the other hand, local collectors and purchasing companies complain about the poor quality of sesame due to the substantial quantity of admixtures in sesame and in adequacy of the supply quantities.
1.2 Sesame Trade Arrangements The survey revealed that there are various types of sales outlets for sesame in the survey areas. Among these, the single most important is selling to local collectors in the nearby local markets, followed by selling to collectors who visit producers at home. This survey revealed that transaction are characterised by “cash and carry exchange” without institutional arrangements to minimize transaction risks and costs. Only limited attempts were made, by companies such as Kaleb and Tradin, in the form of contract agreements to secure their supply both in terms of quantity and quality. Moreover, none of the chain actors clearly indicated a preferred trade arrangement for the future and seemed content using the opportunistic practices already in place, which are full of uncertainties. Some of the producers from Humera aim to supply the central market by circumventing local market buyers since they believe that local buyers employ a variety of tactics to cheat them. Similarly, most of the East Wellega producers distrust their local buyers and to remedy this they prefer to sell through a cooperative. This situation suggests that the Ethiopian sesame value chain suffers from inadequately coordinated trade arrangements, and as long as this does not improve, its future prospects will remain bleak. Regarding the lack of adequate trade arrangements, the level of trust among chain actors is very low, and the transaction risks and costs are very high. Farmers from both Humera and East Wellega reported that they visit about two buyers on average to decide sales. As the actors do not trust each other, negotiating price and quality and the inspection of sesame is quite a lengthy process. Such a costly process reduces the competitiveness of the chain and the potential of the sesame trade to benefit both the chain actors and the country.
10
1.3 Sesame Value Addition Value addition is the process of transforming sesame locally so as to increase its value in the international market and contribute to vitality of the local economy. In this regard, only limited activities are taking place. Tahini1 production by an Israeli company in Gonder and a hullling initiative by Kaleb in cooperation with Tradin (a Dutch International company) are some relevant examples.
1.4 Enabling Environment Most of the chain actors included in this survey feel that the legal environment of Ethiopia is by and large conducive for business development. However, they feel that much is still lacking in terms of its practical application. Among other things, the government needs to introduce improvements in key areas, such as customs administrations and the lengthy and bureaucratic processes people have to go through to obtain bank loans. Moreover, some companies indicate that infrastructure facilities are also insufficient for optimal chain performance. Besides facilitation of the internal environment, the government is also expected to facilitate business-to-business relations and create support structures for them in order to improve the business development and management capacities of local companies. In a nutshell, based on the survey results, the study team has identified a number of areas for improvement that would result in better performance of the sesame value chain. Among these areas, the following should receive priority attention from all of the stakeholders: Improve Seed Variety Development Research To improve production, productivity and the quality of sesame, and to make it economically interesting for the chain actors in particular and the country in general, comprehensive research and development should be carried out. Devise a System for Regular Access to Market Information Lack of access to reliable market information has contributed to creating confusion among the chain actors (e.g. regarding market prices, supply and demand dynamics). Therefore, it is thought that devising a system in which all chain actors have access to reliable information will improve many of the problems. Facilitate Institutional Arrangement to Achieve Smooth Relations and Governance among Chain Actors The current business relationship between chain actors is characterized by opportunistic behaviour and governed by price only. This situation discourages trust among chain actors and contributes to high transaction risks and costs, which in turn minimizes competitiveness throughout the entire chain. Improve Credit Facilities and Banking Services All the chain actors – from producers at the beginning of the process to the ultimate exporters – complain about a shortage of working capital and a lack of access to proper and efficient financial
1 Tahini, tahine, tehina, or sesame paste is a paste of ground sesame seeds used in cooking.
11
services. It is recommended that studies be conducted of practices in other countries and that the situation be facilitated in such a way that it encourages business development. Improve Logistical Services of the Chain Sesame grows in and is supplied from lowlands where the infrastructure is not yet well developed and the means of communication are very weak. This is also another factor contributing to the lack of information in the chain, and, in addition, it impacts cost aspects of the sesame trade. Moreover, the frequently reported cases of theft have also exacerbated logistical problems of the chain. In fact, it is hoped that the establishment of a dry port in Mojo will minimize the problem as the bags of sesame will be put in containers at this port. Encourage Local Value Addition Processing sesame locally and exporting processed products to international markets is expected to increase the benefits for chain actors and the country at large. Therefore, chain actors who engage in value-adding activities need to be provided with the necessary support, and others should be encouraged to take similar steps. Facilitate Effective and Efficient Business Development Service Provisions Most of the chain actors joined the sesame sector by chance, and their system of business management is ineffective. Therefore, improving these chain actors’ business capacity by means of business-to-business relations between the Ethiopian and Dutch private sectors and creating local capacities for the provision of market-based business development services for these chain actors are important steps towards a more professional sesame sector. Create and Enhance the Enabling Environment No business can thrive without a conducive business environment. Although the legal environment seems to be conducive for the sesame business, bureaucracy needs to be reduced in order to improve its actual application.
12
1 Introduction
1.1 Background and Justification
The oilseeds sector is one of Ethiopia’s fastest-growing and important sectors, both in terms of its foreign exchange earnings and as a main source of income for over three million Ethiopians. It is the second largest source of foreign exchange earnings after coffee. Study reports indicate that Ethiopia is among the top-five producers of sesame seed, linseed and Niger seed (Wijnands et al. 2008). In addition to these, Ethiopian mustard (rapeseed), castor bean, safflower and jatropha have also become important oilseeds in the country for some years now. The potential for further growth, both in terms of quantity and quality, through improved production techniques and productivity factors is considered to be great. This baseline study report is concerned with sesame seed, which has become one of the most important oilseeds for Ethiopia’s export earnings and for increasing the potential of generating income for the local population. In the last few years, sesame production and marketing has demonstrated highly significant growth. In 1997 (Kindie, 2007), the total area under sesame production was about 64,000 ha. In nearly ten years’ time (up to 2007), the total area of sesame production has increased by more than 200% to about 211,000 ha. The practice of sesame production has also expanded from the traditional regions (Northwest Humera, Wellega and North Gonder) to many new areas, including Benishangul, Illubabor and many other places (CSA, 2006-07). Similarly, the quantity of sesame produced during the same period, which is mainly intended for export, has also increased from 42,000 tonnes (Kindie, 2007) to about 149,000 tonnes (CSA, 2006-07), which is again an increment of over 250%. The potential to increase the area, production and productivity of sesame is still large. Similarly, there is considerable international market demand for Ethiopian sesame seed, and this is expected to continue increasing. In 1998, the total export of sesame was about 50,000 tonnes, but by 2006 it had exceeded 100,000 tonnes (Wijnands et al. 2008). The increasing international market demand for sesame is not only evident in the rise of export volume but also in new buyers coming to the market. The traditional importers of Ethiopian sesame seed were China, Israel, Turkey and other Middle Eastern countries. These days, while the purchase volume of the traditional buyers is continuing to increase, other new buyers (including Greece, Germany, The Netherlands, UK, etc.) are also coming to the market. Japan, the world’s biggest importer of sesame, has not yet been adequately approached. Therefore, if the Ethiopian sesame sector were able to meet the market’s various requirements, the demand for sesame could be potentially insatiable. However, despite the high potential for increased production and the rapidly growing demand in the international market for Ethiopian sesame, it is generally felt that the logistical supply chain of sesame suffers from different challenges, including the adulteration of sesame with foreign materials or the mixing of sesame with different sources of varying quality, a lack of transparency among chain actors and the contract default of producers and/or buyers in some cases. Sesame is being sold as plain seed, while quality characteristics such as oil content, percentage of admixture, fatty acid profile or residues are hardly accounted for. In addition, transaction risks, which are mainly the result of problems caused by the behaviour of actors throughout the entire
13
chain, lack of proper trade arrangements or coordination among chain actors and lack of capacity to accurately measure the quality standards of sesame and control problems related to theft and adulteration, have contributed to rising sesame transaction costs. On top of that, the existence of many chain segments drives up the price of sesame and reduces its competitiveness in the international market. It is believed that selecting and grading sesame according to its quality and clearly specifying its characteristics, such as its origin (for traceability), or whether it is organic or a speciality, etc., can create higher market prices and simultaneously fulfil buyer expectations in the end market. Knowing exactly what type of seed is being bagged and transported can also prevent adulteration during transport and create premium prices for guaranteed quality. With this conviction, the Ethiopian-Dutch Public-Private Partnership project, in collaboration with the Wageningen University & Research Centre, decided to commission a baseline survey on sesame trade arrangements, costs and risks. Therefore, this baseline survey report describes current trade practices along the chain (from primary producers, middlemen and traders, to processors and exporters), and tries to analyze where loss of quality and high transaction risks take place. Based on the main findings of the survey, recommendations are also made for possible improvements. The Ethiopian-Dutch Public-Private Partnership Project was initiated to tackle existing challenges and develop opportunities to improve production and quality and create added value in Ethiopia. The initiative has two objectives. First, it aims to ensure a healthy and effective business environment, which is expected to ensure an efficient and competitive value chain that will mutually benefit both suppliers and buyers of the product. Second, it is expected to improve the linkage of small producers to markets or integrate them into domestic or international value chains, which is widely recognized as a valuable development strategy in most developing countries in order to attain millennium development goals. Such strategies are strongly supported by many development organizations, ministries, NGOs, private companies and research institutes that are interested in poverty alleviation. The DGIS-WUR partnership programme entitled ‘Globalisation and Sustainable Rural Development’ comprises a thematic research programme related to value chains in the context of sustainable development and poverty reduction. The Ethiopian project on the sesame value chain is part of this programme. The main focus of the programme is on value chain and pro-poor development in Sub-Saharan Africa. Some of the programme’s key issues include:
• What are the main levers for influencing value chain developments in the direction of sustainable development and poverty reduction?
• What are the conditions under which these levers work, for specific commodities or in specific contexts?
• How can policy makers, producer organizations (international), corporate business managers and development practitioners plan and use these leveraging interventions in an effective and efficient manner?
Both initiatives are found to be complementary and essential for the improvement of the Ethiopian oilseeds value chain in general and of the sesame seed trade, which is among the highest value crop of the Ethiopian oilseeds. Therefore, the two initiatives have agreed to coordinate their efforts and jointly commissioned a baseline survey of the sesame trade arrangement, costs and risks in order to get clear understanding of the existing situation and design appropriate improvement strategies.
14
1.2 Statement of the Problem For chain actors of any agro-food product, in an increasingly globalizing world the need to meet basic quality standards and minimum requirements to enter the international market, on the one hand, and coordinate efforts to ensure efficiency and competitiveness, on the other hand, are often not matters of choice. The struggle to meet international market conditions and be competitive is becoming increasingly difficult as consumers (and therefore buyers) are becoming more and more conscious about health concerns, on the one hand, and suppliers from different parts of the world are also becoming more and more cost efficient, on the other hand. This twofold demand cannot be met with fragmented efforts and by producers and traders that face high transaction costs emanating from different risks and uncertainties. The Ethiopian oilseeds value chain is essentially full of challenges yet replete with opportunities. Despite the immense potential for improving the production and productivity of the sector, it is believed that the primary producers lack the necessary echnical and material input to improve their production and productivity; trade arrangements are not well organized; the necessary government policies and institutions, and the enforcement of regulations are either non-existent or functioning too ineffectively to ensure a smoothly operating chain.
1.3 Objectives of the Study
The main objective of the study is to investigate the existing trade arrangements within the sesame value chain among chain actors at different levels and describe related transaction costs and risks for improvement. Specifically, the study has the following objectives:
a) Analyze the role of key actors in the trade and marketing of sesame b) Identify existing trade arrangements and assess how agreements are reached among
chain actors regarding quality, quantity, price, time, etc. c) Identify main bottlenecks of the chain and potential solutions d) Propose recommendations for improving the chain performance
Attainment of these objectives is assumed to be instrumental to designing and implementing a pro-poor and competitive sesame value chain in Ethiopia.
1.4 Relevance of the Study In today’s globalized world, it is of paramount importance to meet international standards if one intends to enter the international market and coordinate efforts by different stakeholders in order to ensure efficiency and competitiveness. Improvement of the sesame value chain is expected to provide a variety of opportunities for different actors in the chain. The poor producers, whose sesame farm size is estimated at about 0.32 hectares on average (CSA 2006-07), would gain access to improved agricultural inputs, technologies and technical services to improve their production volume and quality. This could, in
15
turn, improve their market access, which would increase their income and livelihood. Similarly, traders who are engaged in the value chain through different trade arrangements would also be exposed to improved practices and services, which would facilitate their activities and potentially increase their credibility in the business and minimize their risks. As a result, the expectations of downstream actors – mainly exporters and processors – regarding quality, timeliness, minimized business risks, etc. – would be more likely to be met. Moreover, research can also identify constraints and opportunities in the chain with respect to each actor, which can pave the way to define the roles different stakeholders are expected to fulfil in order to improve the situation. Like many other countries in Sub-Saharan Africa, the Ethiopian economy has undergone dramatic market reforms since the early 1990s, resulting in a nearly complete liberalization of the grain market. Although the re-engagement of the private sector has improved market integration and resulted in the reduction of marketing margins, the reforms did not, as yet, have the envisaged impact on agricultural growth and poverty reduction. Market reforms did not reduce price volatility and, indeed, may have exacerbated it. Linked to this, significant market performance constraints remained, which led to the persistence of ‘thin’ markets, i.e. markets in which there are few purchases and sales. When demand is relatively price inelastic, thin markets inevitably lead to high price volatility (Gabre-Madhin, 2005). The sesame value chain can be seen as a huge coordination problem. Small amounts of sesame must be collected from a multitude of farmers, and then transported and sold to different markets, most of which are abroad in the case of sesame. Information about demand and supply and matching prices must also be distributed through the value chain. Weak infrastructure and the lack of support institutions exacerbate this problem of coordination. Although Ethiopia has invested substantially in improving roads (as well as airports), many smallholders still do not have proper access to roads and have a limited telecommunications and storage infrastructure. Transport costs and physical marketing costs, such as storage, handling, etc., are high. Gabre-Madhin (2005) estimates that marketing costs for grain amount to some 40 to 60 per cent of the final price, of which some 70 per cent are transport costs. The lack of support institutions in the value chain lead to high transaction costs. Transaction costs are costs related to conducting or coordinating market transactions between actors, which include search costs, contracting and monitoring and enforcement costs. In short, since obtaining a good understanding of the existing situation and identifying constraints and opportunities of the sesame chain will provide the Public-Private Partnership initiative and others with possible avenues to improve the situation, the relevance of the study is very high.
1.5 Methodologies of the Study 1.5.1 Data Source and Methods of Data Collection The study focuses on three main categories of chain actors: (i) primary producers, (ii) local buyers and (iii) central market operators and exporters. The main concerns of the study, although they differ in specificity according to the respective actor, were issues related to production, productivity and quality assurance, trade arrangements both with suppliers and buyers, storage and value-adding activities, problems related to the role of each actor and proposed mechanisms for improvement.
16
The study has relied heavily on primary data collected from primary producers, local collectors and central market operators and exporters. Appropriate data collection questionnaires and checklists were designed and tested in the field before being applied by the study team. Data related to primary producers and local buyers was collected in two important sesame-producing regions. These areas were selected on the basis of their important contribution to sesame production and marketing and speciality of their sesame. Within the study areas, the target woredas2 were selected on the basis of the number of farmers producing sesame and volume of sesame produced by those farmers. Finally, the farmers targeted for interview were identified by a simple random sampling technique. Local buyers (collectors) usually travel from place to place in search of a sesame supply and their number is not known by any agency in either area. This made it difficult to calculate a representative sample of this group. This problem was addressed by interviewing as many local buyers as possible. Similarly, at central markets, as many operators and exporters were interviewed as possible. The types of data collected at all levels are both quantitative and qualitative in nature. To complement the primary information collected at different levels, possible secondary sources are also explored. Among others, CSA, MA study papers, EIAR research, study and workshop reports, etc. were some of the secondary information sources that were used for this study. 1.5.2 Limitations of the Study Geographically, sesame is produced in different parts of Ethiopia. However, the dominant producers, who contribute over 70% to national production (CSA, 2006-07), are located in the areas of Humera, North Gonder and Wellega. Accordingly, the study was geographically limited to these important regions. Since the limits of time and budget made it impossible to address all three regions, it was decided to focus on two of the three areas in this study. Humera and Wellega were ultimately chosen for this study. North Gonder (which is mainly Metemma area) was excluded from this study because it was assumed that the findings at Humera would be equally applicable to Metemma, since both regions are in similar agro-ecological zones and the general specialty of sesame is also the same. In the Humera and Wellega areas, 1,000 and 500 smallholder producers, respectively, and as many local buyers (collectors) as possible were targeted for interview. However, due to the seasonal migration of some target interviewees from their area and the impossibility of replacing them with others, the total number of producers interviewed both in Humera and Wellega area amounted to 891 (89.1%) and 491 (98.2%), respectively. In total, 37 collectors were interviewed. Moreover, in spite of the considerable effort of those who conducted the interviews to convince the interviewees to yield accurate information (by explaining the purpose of the study, which will have no negative impact on them whatsoever), in some cases, especially at the level of primary producers and local buyers, we have reason to doubt the sincerity of some of the respondents’ information, such as quantity produced and traded, sales income, amount of profit gained, etc., since they still fear it might have tax implications for them. In addition, as they do not have proper records, they often recount information from memory, which calls the accuracy of their information into question. The study was also unable to include a sufficient number of
2 administrative division of Ethiopia (managed by a local government), equivalent to a district
17
respondents, at the central market, operator and exporter level, , as most of them were unwilling to take the time to sit down and enter into discussion with those who conducted the interviews. Despite these limitations, we feel that the study results, with respect to trade arrangements, transaction costs and risks for all the chain actors, are valid. 1.5.3 Methods of Analysis The Statistical Package for Social Sciences (SPSS) was used to analyze the primary information collected from different sources. The tool was selected for its flexibility to accommodate both quantitative and qualitative information and the ease with which it can analyze information by using basic statistics such as frequencies, averages, means, etc., in the cross-tabulation of different variables. Moreover, time series data, trend analyses, growth rates, graphs and charts were employed to examine, explain and present the underlying study. 1.5.4 Organization of the Study Report The content of the study is organized as follows: Chapter One introduces the study, which mainly deals with background information, the statement of the problem, the objectives, relevance, scope and limitation and methodologies of the study. Chapter Two presents a review of relevant literature. Chapter Three presents the main results from the different chain actors (farmers, collectors and traders at the central market and exporters). Chapter Four presents conclusions and recommendations.
18
2 Review of relevant literature
2.1 The Concept of Trade Arrangements, Transaction Costs and Risks Trade arrangements enable buyers and sellers to meet in order to exchange goods and services. In the case of agricultural commodities, different arrangements exist that facilitate exchanges between buyers and sellers. These arrangements include transactions in the spot market, different forms of contract farming, bidding by either the buyer or the seller, etc. An effectively functioning market is expected to generate income for producers, transporters, processors and related service providers, thus contributing to poverty alleviation (Meijerink et al. 2008). However, in some cases, the market fails to function effectively, and this failure demands special arrangements in order to minimize the risk of the market failure and the consequential costs. Transaction costs are the resources expended in the process of exchange transactions, which consist of the efforts devoted to finding a market, negotiating, signing agreements and also encompass any lost opportunities (Eaton et al. 2008). In short, transaction costs can be categorized under three main areas: (i) the search for information (about prices, traders, quantities etc), (ii) bargaining and (iii) supervision and enforcement costs. These costs mainly stem from a variety of risks. The higher the risk of a business, the greater the cost of its transactions. Eaton et al. (2008) have also provided a detailed explanation of the nature and types of transaction risks in their strategy and policy paper on ‘Understanding Institutional Arrangements: Fresh Fruit and Vegetable Value Chains in East Africa’. The literal meaning of risk is the probability that a loss will occur during the course of undertaking certain activities. In the business world, risk is therefore equivalent to, the probability of the market’s failure to properly regulate its functions, and it may therefore result in unexpected transaction costs. In a situation where market agents are limited in terms of receiving, storing, retrieving and transmitting market information properly, and where opportunistic behaviour is possible, which is mainly motivated by self-interest, the level of uncertainty and the probability of exposure to higher transaction risk is inevitable. According to Williamson (1981 & 1991b, quoted in Eaton et al. 2008), despite the fact that economic agents may enter into complex agreements, contracts are unavoidably incomplete, and to rely on ‘promised contracts’ is fraught with transaction risks due to opportunism. According to Meijerink et al. (2008), transaction risks emanate from four sources; i.e. asset specificity, uncertainty, performance measurement and coordination. Asset specificity risk occurs when an investment made for a certain specified purpose fails to achieve its initial purpose and cannot be used for other purposes. Uncertainty is primarily the result of uncontrollable factors, such as weather conditions, disasters, opportunistic behaviour, etc. Performance measurement may also lead to risk. The only way to know whether a transaction meets the required quantity and quality requirements is by performance measurement. This may necessitate large investments in test laboratories and scientific measurement equipment or smaller investments, such as inspecting bags of sesame. Finally, it is clear that no business is run by one single entity. Different actors are involved in the chain, whether it concern upstream or downstream activities. The failure of one or more of these actors to deliver goods or services will cause disruption in the chain, which ultimately results in unexpected costs for the chain actors. Unless these risks are
19
properly addressed by a joint effort of the chain actors, the transaction costs of a business can be very high and ultimately harm the competitiveness of the business. According to Meijerink et al. (2008), a set of rules or agreements (institutional arrangements) established among chain actors can minimize risk. These institutional arrangements can be formal or informal. Informal institutional arrangements are established on the basis of norms and traditions enforced by the customs and habits of societies. Formal institutional arrangements are embedded in the constitution and laws of a country and enforced by legal institutions. In order to realize gains from the market, the economic ‘rules of the game’ must be specified to ensure enforcement of private rights in the exchange process (IFPRI 2003). Enforcement occurs at two levels. The first level takes place between individual market participants vis-à-vis the market system. This is when rules are established to regulate the market with a specified set of standards, procedures, safety measures, obligations, etc., to be observed by the market participants while they perform exchange activities between themselves. The second level of enforcement is between individual market participants. With the increased complexity of business, the scope for opportunistic behaviour, contract defaults, etc., will increase. Therefore, without credible rules and enforcement mechanisms, the risks involved in trade could be very high and that will adversely affect the development of a country's business in general and the security of individual business persons in particular. That is why there is a need for institutional arrangements, be they formal or informal.
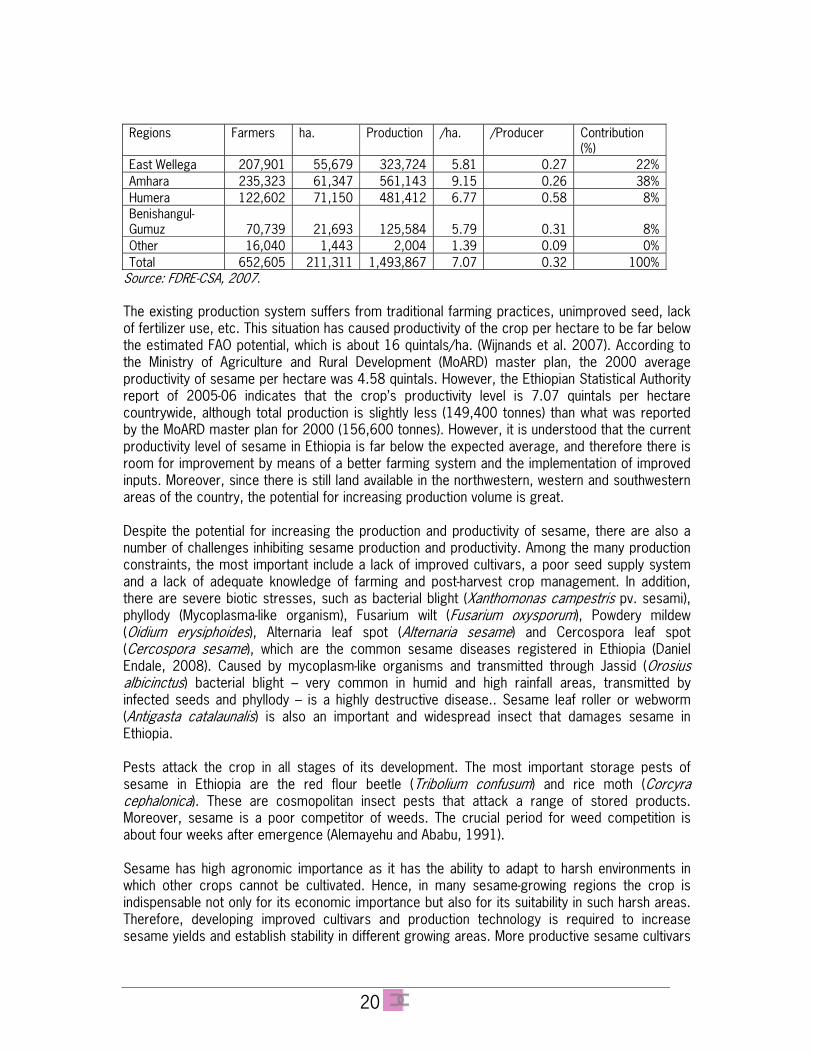
2.2 Sesame Production and Marketing in Ethiopia 2.2.1 Production Agriculture is the mainstay of the Ethiopian economy, not only by virtue its substantial contribution to the livelihood of a large majority of Ethiopians but also for its significant contribution to the country’s foreign exchange earnings. Cognizant of this fact, the Ethiopian government has pursued the Agricultural Development Led Industrialization (ADLI) strategy since 2001 as a means of economic development. The strategy document specifically indicates that the success of the effort is assured if the performance of the agricultural sector is transformed from a generations-long period of subsistence to a market-oriented commercial production system. To this effect, all responsible ministries and agencies of the federal and regional governments and different multilateral and bilateral collaborative efforts are in the process of implementing the strategy. As the most responsible body for this strategy The Ethiopian Ministry of Agriculture and Rural Development (MoARD), has developed a master plan to enhance market-oriented production for priority crops and livestock commodities (MoARD 2004). The oilseeds sub-sector, of which sesame is an important product, is one of the priority crops within the master plan. According to the master-plan document, in 2000 the total production of sesame seed was 156,600 tonnes, and yet this volume of production could potentially increase threefold. Consistent with this, the Ethiopian government aimed to double the production and export of oilseeds between 2005 and 2010 (PASDEP 2005). Table 2.1: Number of sesame producers, land under cultivation, total production and productivity in 2005-06 Main Production No. Area in Total Yield Land Holding Production
20
Regions Farmers ha. Production /ha. /Producer Contribution (%)
East Wellega 207,901 55,679 323,724 5.81 0.27 22%Amhara 235,323 61,347 561,143 9.15 0.26 38%Humera 122,602 71,150 481,412 6.77 0.58 8%Benishangul-Gumuz 70,739 21,693 125,584 5.79 0.31 8%Other 16,040 1,443 2,004 1.39 0.09 0%Total 652,605 211,311 1,493,867 7.07 0.32 100%
Source: FDRE-CSA, 2007. The existing production system suffers from traditional farming practices, unimproved seed, lack of fertilizer use, etc. This situation has caused productivity of the crop per hectare to be far below the estimated FAO potential, which is about 16 quintals/ha. (Wijnands et al. 2007). According to the Ministry of Agriculture and Rural Development (MoARD) master plan, the 2000 average productivity of sesame per hectare was 4.58 quintals. However, the Ethiopian Statistical Authority report of 2005-06 indicates that the crop’s productivity level is 7.07 quintals per hectare countrywide, although total production is slightly less (149,400 tonnes) than what was reported by the MoARD master plan for 2000 (156,600 tonnes). However, it is understood that the current productivity level of sesame in Ethiopia is far below the expected average, and therefore there is room for improvement by means of a better farming system and the implementation of improved inputs. Moreover, since there is still land available in the northwestern, western and southwestern areas of the country, the potential for increasing production volume is great. Despite the potential for increasing the production and productivity of sesame, there are also a number of challenges inhibiting sesame production and productivity. Among the many production constraints, the most important include a lack of improved cultivars, a poor seed supply system and a lack of adequate knowledge of farming and post-harvest crop management. In addition, there are severe biotic stresses, such as bacterial blight (Xanthomonas campestris pv. sesami), phyllody (Mycoplasma-like organism), Fusarium wilt (Fusarium oxysporum), Powdery mildew (Oidium erysiphoides), Alternaria leaf spot (Alternaria sesame) and Cercospora leaf spot (Cercospora sesame), which are the common sesame diseases registered in Ethiopia (Daniel Endale, 2008). Caused by mycoplasm-like organisms and transmitted through Jassid (Orosius albicinctus) bacterial blight – very common in humid and high rainfall areas, transmitted by infected seeds and phyllody – is a highly destructive disease.. Sesame leaf roller or webworm (Antigasta catalaunalis) is also an important and widespread insect that damages sesame in Ethiopia. Pests attack the crop in all stages of its development. The most important storage pests of sesame in Ethiopia are the red flour beetle (Tribolium confusum) and rice moth (Corcyra cephalonica). These are cosmopolitan insect pests that attack a range of stored products. Moreover, sesame is a poor competitor of weeds. The crucial period for weed competition is about four weeks after emergence (Alemayehu and Ababu, 1991). Sesame has high agronomic importance as it has the ability to adapt to harsh environments in which other crops cannot be cultivated. Hence, in many sesame-growing regions the crop is indispensable not only for its economic importance but also for its suitability in such harsh areas. Therefore, developing improved cultivars and production technology is required to increase sesame yields and establish stability in different growing areas. More productive sesame cultivars
21
that have been adapted by breeding are expected to be the major strategy for increasing yield and establishing stability in Ethiopia. 2.2.2 Marketing Sesame is mainly produced for the market and it is wanted for its seed and for the oil in the seed. Sesame contains up to 60% oil of a very high quality and up to 25% protein (Brar and Ahuja, 1979; Bedigian et al. 1985; and Ashri, 1998). Until very recently, almost all of the sesame produced by Ethiopian producers (both large scale and smallholders) was exported. In the international market, its demand comes from the oil industry and the confectionary sector. Seed oil content is the most important parameter for determining the suitability of sesame seeds for oil extraction, while seed coat color determines quality for the confectionary market (Ashri, 1998). Sesame seed is rich in amino acids, especially methionine, cystine, arginine and leucine. Sesame seed contains little vitamin A, but it is rich in vitamin E. Sesame seeds are used for decorating bread and cakes. Sesame oil contains a significant amount of fatty acids, mainly linoleic (39.3-59%) and oleic (32.7-53.9%) acid (Yeramanos et al. 1972), and palmitic (9-11%) and stearic (5-10%) acid (Kamal-Eldin et al. 1922a). Sesame oil is unique among vegetable oils due to the presence of natural antioxidants such as sesamin and sesamolin and their derivatives (sesamol and sesaminol), which provide a significantly long shelf life and stable characteristics (Brar and Ahuja, 1979; Johnson et al. 1979; Salunkhe and Desai, 1986; and Seegeler, 1983). Sesame oil is mostly used for cooking purposes. Sesame oil is also used in soaps, paints, perfumes, pharmaceuticals and insecticides. The cake produced after the extraction of oil from un-hulled seeds is an excellent protein feed for poultry and ruminants (Ashri, 1985). Having these intrinsic characteristics and unique uses, sesame is one of the most wanted oil crops in the world. Over the last two decades, the quantity of sesame traded on the world market has more than doubled. Japan, the European Union, South Korea, the USA and Egypt were largest importers, while India, Sudan, Guatemala, China, Myanmar, Ethiopia and Nigeria (Comtrade database, United Nations Statistics Division website, Wijnands et al. 2007) were major suppliers to the world market. In 1997, the total world import of sesame was estimated at 462,000 MT (Comtrade database, United Nations Statistics Division website) and forecasted to grow at between 6% to 8% by 2012 (Mal Bennet, Website material). The supply from some producing countries, such as China, has been in relative decline over the past few years, despite a general increase in demand for the crop. The main reason for this decline is attributable to the fact that other more remunerative crops compete with sesame for the limited amount of agricultural land and the shortage of labour. Ethiopia has a large number of different sesame varieties, including the Humera, Gonder and Wellega varieties, which well known in the international market. Ethiopia has been significantly increasing its supply to world markets: from 1998 to 2005-06, the total quantity exported annually increased from 50,000 tonnes to about 150,000 tonnes, which is a threefold rise in eight years’ time (Wijnands et al., CSA 2007). The main importers of Ethiopian sesame are China – which is also a major sesame exporter – Israel, Turkey and some European countries. In the long term, there is high potential for increasing the Ethiopian export of sesame to the European market. Europe is a major user of sesame seed for bakery applications and confectioneries. Currently, the main suppliers to European Union countries are India and Sudan (Comtrade database, United Nations Statistics Division website). Like China, India could well reduce its sesame supply to the world market as it focuses increasingly on industrialization instead of agriculture. Therefore, the European market presents Ethiopia with a good opportunity to
22
complement existing suppliers and even replace them should their supply decline. The only requirement Ethiopian farmers and traders need to meet is to adequately prevent the adulteration of seeds of different varieties and clean sesame up to 99-99.5%3 (Wijnands 2007). In addition, local investment in value-adding activities for the crop is expected to increase the benefits the country derives from sesame production, processing and marketing. The first and most important investment needs to be directed at cleaning and grading equipment, which will significantly contribute to achieving a level of purity of the crop that meets European Union standards. Subsequently, a gradual stepping up to higher levels of processing could increase the benefits derived from sesame. This may include the hulling of sesame, which is not currently practiced but easy to establish. In line with this, an Israeli company called ‘Poseidon’, which is a subsidiary of ‘Meir Ezra’, a leading company in Israel in the production, processing and trading of food products, has already decided to invest in the production of raw tahini in Gonder (Raw Tahini Production in Ethiopia; Business Plan 2003). To summarize, it can be concluded from this review that Ethiopia has the potential to tap into part of the rapidly growing global demand for sesame seed and its products. However, to properly seize these opportunities and develop the sesame sector into a competitive sector, Ethiopia needs to adequately manage its trade arrangements, risks and transaction costs.
3 Bags of sesame often contain “impurities” such as sand, twigs, etc.
23
3 main results of the baseline study
3.1 Main Results of the Study at Producers’ Level 3.1.1 Demographic Characteristics of Respondents The overall mean age of the sesame farmers interviewed is 43.2 years with a relatively higher average age for Humera (about 46 years) compared to East Wellega (39 years). The age data categorized by age group indicates that in East Wellega 33.9% of sesame farmers are found in the age interval 18-34 years as compared to 13.1% in Humera, which reveals that there are relatively more young sesame farmers in East Wellega. By contrast, a larger proportion (21.7%) of sesame farmers in Humera is in the age category of 55 years and above, whereas the figure for the same age category in East Wellega is only 9.3%. Only about 7.2% of all the interviewed sesame farmers were female (11% in Humera and 0.4% in East Wellega). Regarding marital status, 5.9%, 85.9%, 4.0%, 3.1% and 1.1% are single, married, divorced, widowed/er and separated, respectively. This shows that marriage is universal and it is unlikely for rural household heads to remain unmarried. Disaggregated by region, there is a larger proportion of married households (96.7%) as reported by East Wellega sesame farmers compared to those reported by Humera sesame farmers (79.8%). A higher proportion of single, divorced, widowed/er and separated people are reported to exist among the sesame farmers interviewed in Humera. Respondents were also asked whether they have any formal education. About 56% of all respondents reported to have had a formal education. The figure for East Wellega is slightly higher (62.9%) than that of Humera (51.5%). On average, the highest grade completed by those who had a formal education is 5.25. The average highest grades completed are 5.44 and 5.11 in East Wellega and Humera, respectively. The average family size of all respondents is 5.6 persons. The family size of sesame farmers in East Wellega is 6.24 family members, while those in Humera reported only 5.16 persons, one person less per household. Regarding family members who are directly involved in agricultural activity, sesame farmers in East Wellega again reported higher figures than those in Humera (3.3 people versus 1.8), indicating that sesame production in East Wellega sesame production is more labour intensive than in Humera. This is most likely attributable to the fact that sesame production is mechanized in Humera while in East Wellega smallholder farmers usually produce sesame. 3.1.2 Land Ownership In both areas covered by this study, about 90% of the interviewed sesame farmers have land of their own. The table below shows the size of different land categories that respondents reported to have at the time of the survey. The mean cultivated land area owned by all respondents is about 4.7 hectares and the mean cultivated land area owned by sesame farmers in Humera is two hectares greater than the land owned by sesame farmers in East Wellega (for details see table below). Table 3.1: Mean land area owned by respondents by land category and region (in ha.)
24
Region
Humera East Wellega
Total Different land uses
Number Mean Number Mean Number Mean Cultivated land 805 5.50 444 3.15 1,249 4.67 Grazing land 805 0.02 443 0.18 1,249 0.07 Wood land 805 0.09 443 0.05 1,249 0.08 Fallow land 805 0.03 443 0.28 1,249 0.12 Other land uses 805 0.01 443 0.02 1,249 0.01
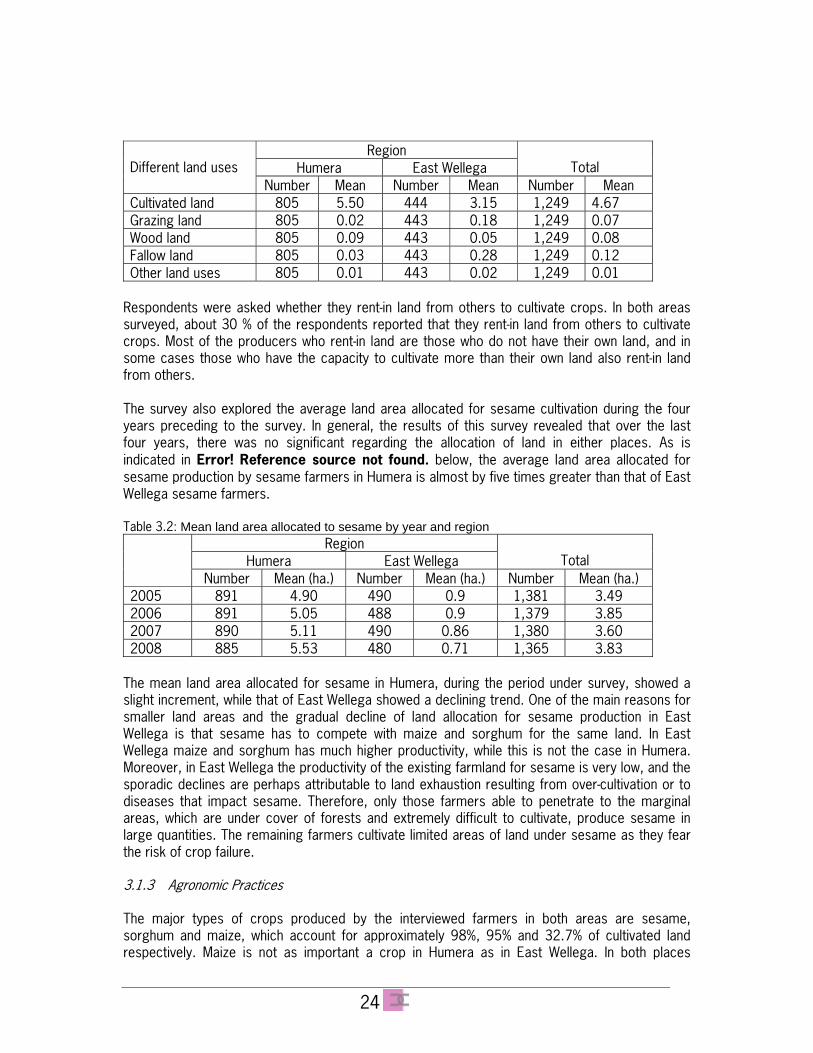
Respondents were asked whether they rent-in land from others to cultivate crops. In both areas surveyed, about 30 % of the respondents reported that they rent-in land from others to cultivate crops. Most of the producers who rent-in land are those who do not have their own land, and in some cases those who have the capacity to cultivate more than their own land also rent-in land from others. The survey also explored the average land area allocated for sesame cultivation during the four years preceding to the survey. In general, the results of this survey revealed that over the last four years, there was no significant regarding the allocation of land in either places. As is indicated in Error! Reference source not found. below, the average land area allocated for sesame production by sesame farmers in Humera is almost by five times greater than that of East Wellega sesame farmers. Table 3.2: Mean land area allocated to sesame by year and region
Region Humera East Wellega
Total
Number Mean (ha.) Number Mean (ha.) Number Mean (ha.) 2005 891 4.90 490 0.9 1,381 3.49 2006 891 5.05 488 0.9 1,379 3.85 2007 890 5.11 490 0.86 1,380 3.60 2008 885 5.53 480 0.71 1,365 3.83
The mean land area allocated for sesame in Humera, during the period under survey, showed a slight increment, while that of East Wellega showed a declining trend. One of the main reasons for smaller land areas and the gradual decline of land allocation for sesame production in East Wellega is that sesame has to compete with maize and sorghum for the same land. In East Wellega maize and sorghum has much higher productivity, while this is not the case in Humera. Moreover, in East Wellega the productivity of the existing farmland for sesame is very low, and the sporadic declines are perhaps attributable to land exhaustion resulting from over-cultivation or to diseases that impact sesame. Therefore, only those farmers able to penetrate to the marginal areas, which are under cover of forests and extremely difficult to cultivate, produce sesame in large quantities. The remaining farmers cultivate limited areas of land under sesame as they fear the risk of crop failure. 3.1.3 Agronomic Practices The major types of crops produced by the interviewed farmers in both areas are sesame, sorghum and maize, which account for approximately 98%, 95% and 32.7% of cultivated land respectively. Maize is not as important a crop in Humera as in East Wellega. In both places
25
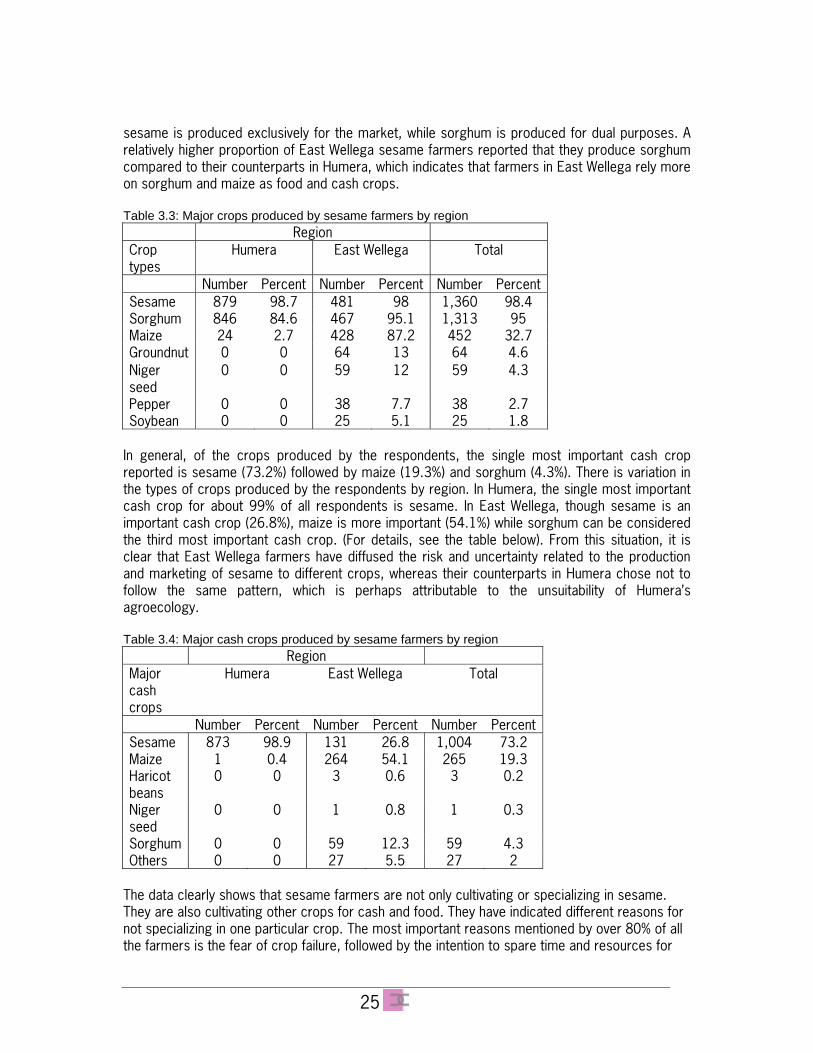
sesame is produced exclusively for the market, while sorghum is produced for dual purposes. A relatively higher proportion of East Wellega sesame farmers reported that they produce sorghum compared to their counterparts in Humera, which indicates that farmers in East Wellega rely more on sorghum and maize as food and cash crops. Table 3.3: Major crops produced by sesame farmers by region Region Crop types
Humera East Wellega Total
Number Percent Number Percent Number PercentSesame 879 98.7 481 98 1,360 98.4 Sorghum 846 84.6 467 95.1 1,313 95 Maize 24 2.7 428 87.2 452 32.7 Groundnut 0 0 64 13 64 4.6 Niger seed
0 0 59 12 59 4.3
Pepper 0 0 38 7.7 38 2.7 Soybean 0 0 25 5.1 25 1.8
In general, of the crops produced by the respondents, the single most important cash crop reported is sesame (73.2%) followed by maize (19.3%) and sorghum (4.3%). There is variation in the types of crops produced by the respondents by region. In Humera, the single most important cash crop for about 99% of all respondents is sesame. In East Wellega, though sesame is an important cash crop (26.8%), maize is more important (54.1%) while sorghum can be considered the third most important cash crop. (For details, see the table below). From this situation, it is clear that East Wellega farmers have diffused the risk and uncertainty related to the production and marketing of sesame to different crops, whereas their counterparts in Humera chose not to follow the same pattern, which is perhaps attributable to the unsuitability of Humera’s agroecology. Table 3.4: Major cash crops produced by sesame farmers by region Region Major cash crops
Humera East Wellega Total
Number Percent Number Percent Number PercentSesame 873 98.9 131 26.8 1,004 73.2 Maize 1 0.4 264 54.1 265 19.3 Haricot beans
0 0 3 0.6 3 0.2
Niger seed
0 0 1 0.8 1 0.3
Sorghum 0 0 59 12.3 59 4.3 Others 0 0 27 5.5 27 2
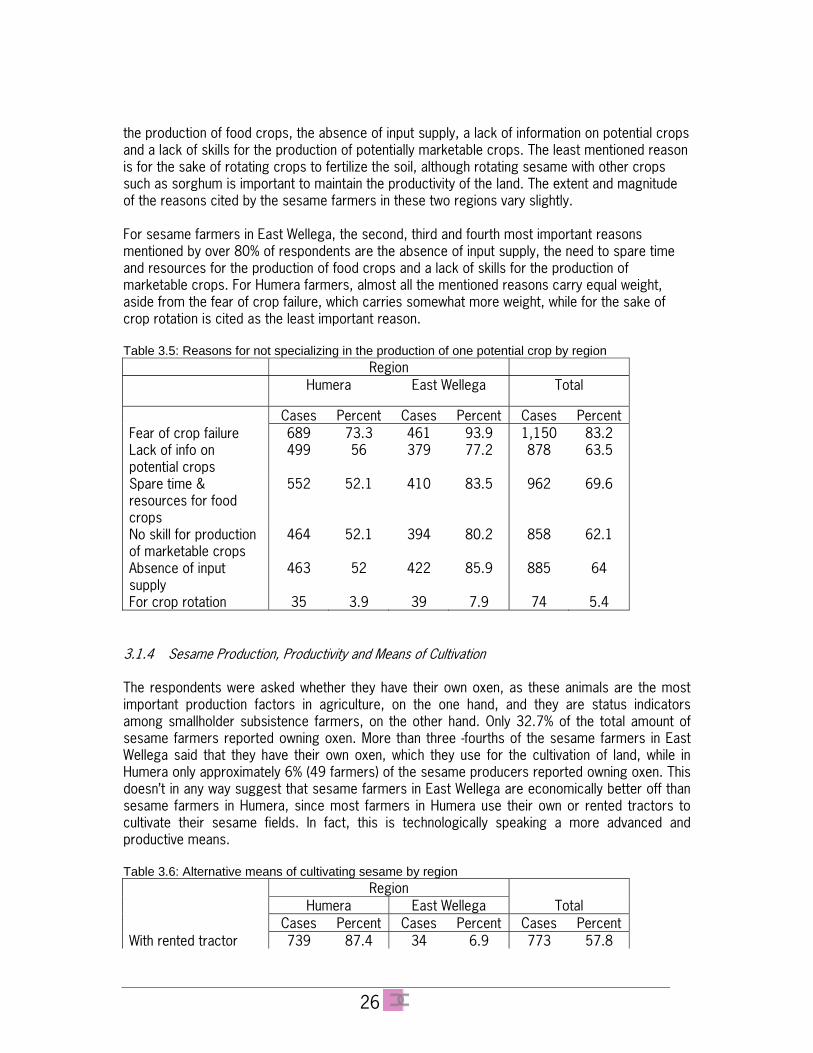
The data clearly shows that sesame farmers are not only cultivating or specializing in sesame. They are also cultivating other crops for cash and food. They have indicated different reasons for not specializing in one particular crop. The most important reasons mentioned by over 80% of all the farmers is the fear of crop failure, followed by the intention to spare time and resources for
26
the production of food crops, the absence of input supply, a lack of information on potential crops and a lack of skills for the production of potentially marketable crops. The least mentioned reason is for the sake of rotating crops to fertilize the soil, although rotating sesame with other crops such as sorghum is important to maintain the productivity of the land. The extent and magnitude of the reasons cited by the sesame farmers in these two regions vary slightly. For sesame farmers in East Wellega, the second, third and fourth most important reasons mentioned by over 80% of respondents are the absence of input supply, the need to spare time and resources for the production of food crops and a lack of skills for the production of marketable crops. For Humera farmers, almost all the mentioned reasons carry equal weight, aside from the fear of crop failure, which carries somewhat more weight, while for the sake of crop rotation is cited as the least important reason. Table 3.5: Reasons for not specializing in the production of one potential crop by region Region Humera East Wellega Total
Cases Percent Cases Percent Cases Percent Fear of crop failure 689 73.3 461 93.9 1,150 83.2 Lack of info on potential crops
499 56 379 77.2 878 63.5
Spare time & resources for food crops
552 52.1 410 83.5 962 69.6
No skill for production of marketable crops
464 52.1 394 80.2 858 62.1
Absence of input supply
463 52 422 85.9 885 64
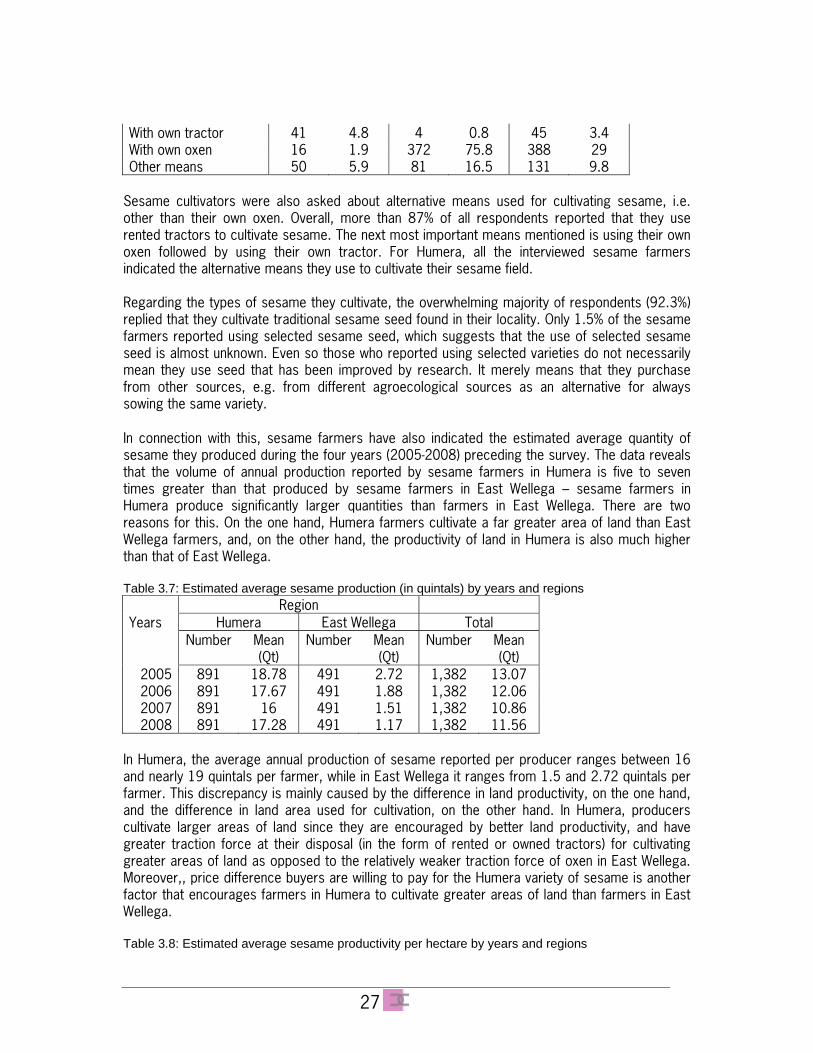
For crop rotation 35 3.9 39 7.9 74 5.4 3.1.4 Sesame Production, Productivity and Means of Cultivation The respondents were asked whether they have their own oxen, as these animals are the most important production factors in agriculture, on the one hand, and they are status indicators among smallholder subsistence farmers, on the other hand. Only 32.7% of the total amount of sesame farmers reported owning oxen. More than three -fourths of the sesame farmers in East Wellega said that they have their own oxen, which they use for the cultivation of land, while in Humera only approximately 6% (49 farmers) of the sesame producers reported owning oxen. This doesn’t in any way suggest that sesame farmers in East Wellega are economically better off than sesame farmers in Humera, since most farmers in Humera use their own or rented tractors to cultivate their sesame fields. In fact, this is technologically speaking a more advanced and productive means. Table 3.6: Alternative means of cultivating sesame by region Region Humera East Wellega Total Cases Percent Cases Percent Cases Percent With rented tractor 739 87.4 34 6.9 773 57.8
27
With own tractor 41 4.8 4 0.8 45 3.4 With own oxen 16 1.9 372 75.8 388 29 Other means 50 5.9 81 16.5 131 9.8
Sesame cultivators were also asked about alternative means used for cultivating sesame, i.e. other than their own oxen. Overall, more than 87% of all respondents reported that they use rented tractors to cultivate sesame. The next most important means mentioned is using their own oxen followed by using their own tractor. For Humera, all the interviewed sesame farmers indicated the alternative means they use to cultivate their sesame field. Regarding the types of sesame they cultivate, the overwhelming majority of respondents (92.3%) replied that they cultivate traditional sesame seed found in their locality. Only 1.5% of the sesame farmers reported using selected sesame seed, which suggests that the use of selected sesame seed is almost unknown. Even so those who reported using selected varieties do not necessarily mean they use seed that has been improved by research. It merely means that they purchase from other sources, e.g. from different agroecological sources as an alternative for always sowing the same variety. In connection with this, sesame farmers have also indicated the estimated average quantity of sesame they produced during the four years (2005-2008) preceding the survey. The data reveals that the volume of annual production reported by sesame farmers in Humera is five to seven times greater than that produced by sesame farmers in East Wellega – sesame farmers in Humera produce significantly larger quantities than farmers in East Wellega. There are two reasons for this. On the one hand, Humera farmers cultivate a far greater area of land than East Wellega farmers, and, on the other hand, the productivity of land in Humera is also much higher than that of East Wellega. Table 3.7: Estimated average sesame production (in quintals) by years and regions Region Years Humera East Wellega Total Number Mean
(Qt) Number Mean
(Qt) Number Mean
(Qt) 2005 891 18.78 491 2.72 1,382 13.07 2006 891 17.67 491 1.88 1,382 12.06 2007 891 16 491 1.51 1,382 10.86 2008 891 17.28 491 1.17 1,382 11.56
In Humera, the average annual production of sesame reported per producer ranges between 16 and nearly 19 quintals per farmer, while in East Wellega it ranges from 1.5 and 2.72 quintals per farmer. This discrepancy is mainly caused by the difference in land productivity, on the one hand, and the difference in land area used for cultivation, on the other hand. In Humera, producers cultivate larger areas of land since they are encouraged by better land productivity, and have greater traction force at their disposal (in the form of rented or owned tractors) for cultivating greater areas of land as opposed to the relatively weaker traction force of oxen in East Wellega. Moreover,, price difference buyers are willing to pay for the Humera variety of sesame is another factor that encourages farmers in Humera to cultivate greater areas of land than farmers in East Wellega. Table 3.8: Estimated average sesame productivity per hectare by years and regions
28
Region Humera East Wellega Total Number Mean Number Mean Number Mean
2005 818 4.28 365 2.92 1,226 3.87 2006 872 4 358 2 1,231 3.4 2007 871 3.68 354 2 1,225 3.19 2008 885 3.7 318 2.38 1,173 3.34
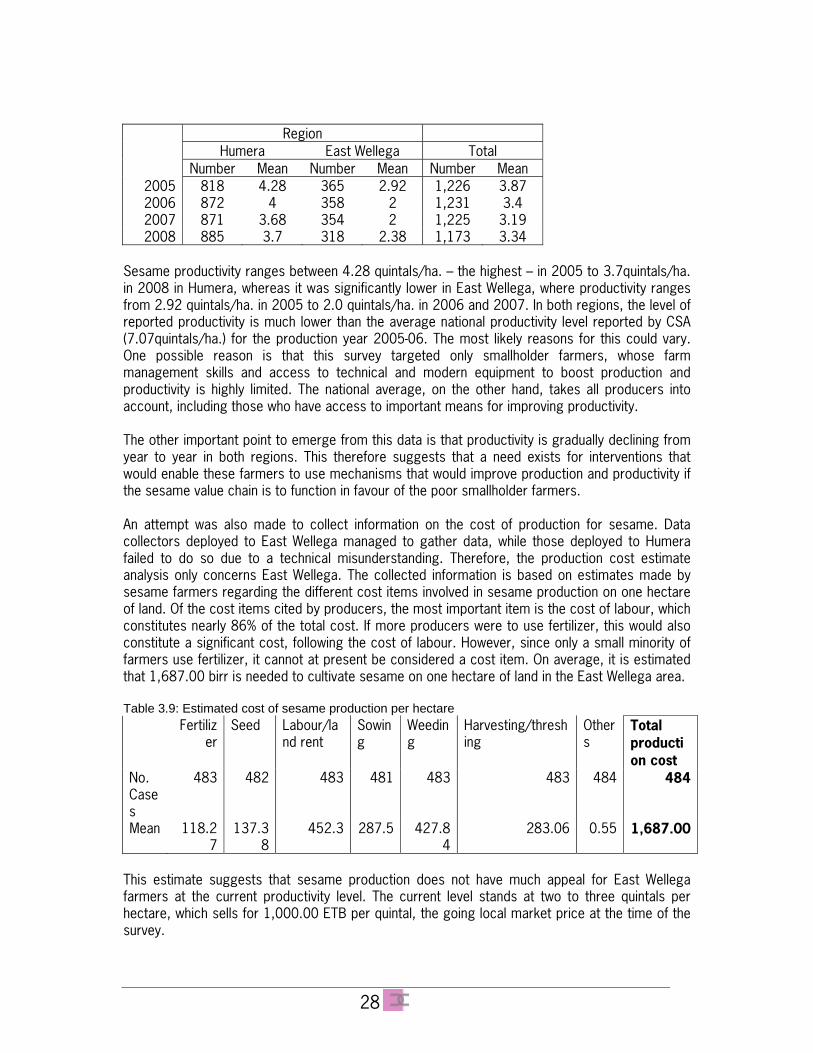
Sesame productivity ranges between 4.28 quintals/ha. – the highest – in 2005 to 3.7quintals/ha. in 2008 in Humera, whereas it was significantly lower in East Wellega, where productivity ranges from 2.92 quintals/ha. in 2005 to 2.0 quintals/ha. in 2006 and 2007. In both regions, the level of reported productivity is much lower than the average national productivity level reported by CSA (7.07quintals/ha.) for the production year 2005-06. The most likely reasons for this could vary. One possible reason is that this survey targeted only smallholder farmers, whose farm management skills and access to technical and modern equipment to boost production and productivity is highly limited. The national average, on the other hand, takes all producers into account, including those who have access to important means for improving productivity. The other important point to emerge from this data is that productivity is gradually declining from year to year in both regions. This therefore suggests that a need exists for interventions that would enable these farmers to use mechanisms that would improve production and productivity if the sesame value chain is to function in favour of the poor smallholder farmers. An attempt was also made to collect information on the cost of production for sesame. Data collectors deployed to East Wellega managed to gather data, while those deployed to Humera failed to do so due to a technical misunderstanding. Therefore, the production cost estimate analysis only concerns East Wellega. The collected information is based on estimates made by sesame farmers regarding the different cost items involved in sesame production on one hectare of land. Of the cost items cited by producers, the most important item is the cost of labour, which constitutes nearly 86% of the total cost. If more producers were to use fertilizer, this would also constitute a significant cost, following the cost of labour. However, since only a small minority of farmers use fertilizer, it cannot at present be considered a cost item. On average, it is estimated that 1,687.00 birr is needed to cultivate sesame on one hectare of land in the East Wellega area. Table 3.9: Estimated cost of sesame production per hectare
Fertilizer
Seed Labour/land rent
Sowing
Weeding
Harvesting/threshing
Others
Total production cost
No. Cases
483 482 483 481 483 483 484 484
Mean 118.27
137.38
452.3 287.5 427.84
283.06 0.55 1,687.00
This estimate suggests that sesame production does not have much appeal for East Wellega farmers at the current productivity level. The current level stands at two to three quintals per hectare, which sells for 1,000.00 ETB per quintal, the going local market price at the time of the survey.
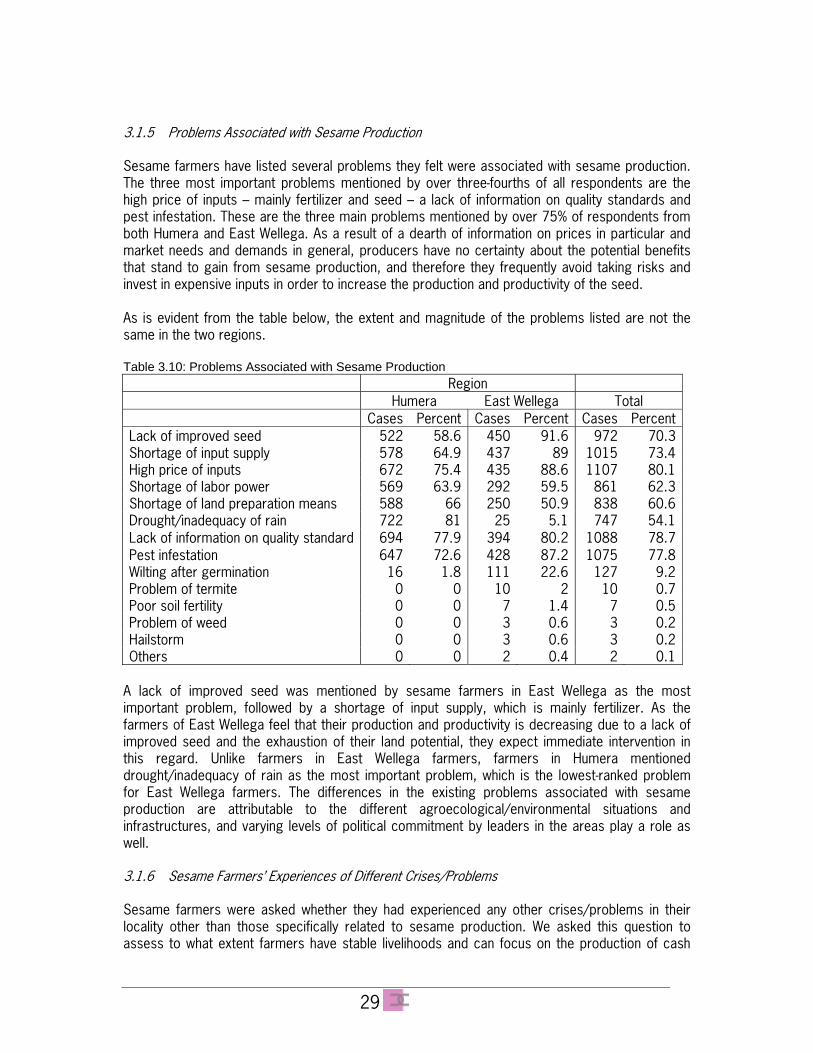
29
3.1.5 Problems Associated with Sesame Production Sesame farmers have listed several problems they felt were associated with sesame production. The three most important problems mentioned by over three-fourths of all respondents are the high price of inputs – mainly fertilizer and seed – a lack of information on quality standards and pest infestation. These are the three main problems mentioned by over 75% of respondents from both Humera and East Wellega. As a result of a dearth of information on prices in particular and market needs and demands in general, producers have no certainty about the potential benefits that stand to gain from sesame production, and therefore they frequently avoid taking risks and invest in expensive inputs in order to increase the production and productivity of the seed. As is evident from the table below, the extent and magnitude of the problems listed are not the same in the two regions. Table 3.10: Problems Associated with Sesame Production Region Humera East Wellega Total Cases Percent Cases Percent Cases PercentLack of improved seed 522 58.6 450 91.6 972 70.3Shortage of input supply 578 64.9 437 89 1015 73.4High price of inputs 672 75.4 435 88.6 1107 80.1Shortage of labor power 569 63.9 292 59.5 861 62.3Shortage of land preparation means 588 66 250 50.9 838 60.6Drought/inadequacy of rain 722 81 25 5.1 747 54.1Lack of information on quality standard 694 77.9 394 80.2 1088 78.7Pest infestation 647 72.6 428 87.2 1075 77.8Wilting after germination 16 1.8 111 22.6 127 9.2Problem of termite 0 0 10 2 10 0.7Poor soil fertility 0 0 7 1.4 7 0.5Problem of weed 0 0 3 0.6 3 0.2Hailstorm 0 0 3 0.6 3 0.2Others 0 0 2 0.4 2 0.1
A lack of improved seed was mentioned by sesame farmers in East Wellega as the most important problem, followed by a shortage of input supply, which is mainly fertilizer. As the farmers of East Wellega feel that their production and productivity is decreasing due to a lack of improved seed and the exhaustion of their land potential, they expect immediate intervention in this regard. Unlike farmers in East Wellega farmers, farmers in Humera mentioned drought/inadequacy of rain as the most important problem, which is the lowest-ranked problem for East Wellega farmers. The differences in the existing problems associated with sesame production are attributable to the different agroecological/environmental situations and infrastructures, and varying levels of political commitment by leaders in the areas play a role as well. 3.1.6 Sesame Farmers’ Experiences of Different Crises/Problems Sesame farmers were asked whether they had experienced any other crises/problems in their locality other than those specifically related to sesame production. We asked this question to assess to what extent farmers have stable livelihoods and can focus on the production of cash
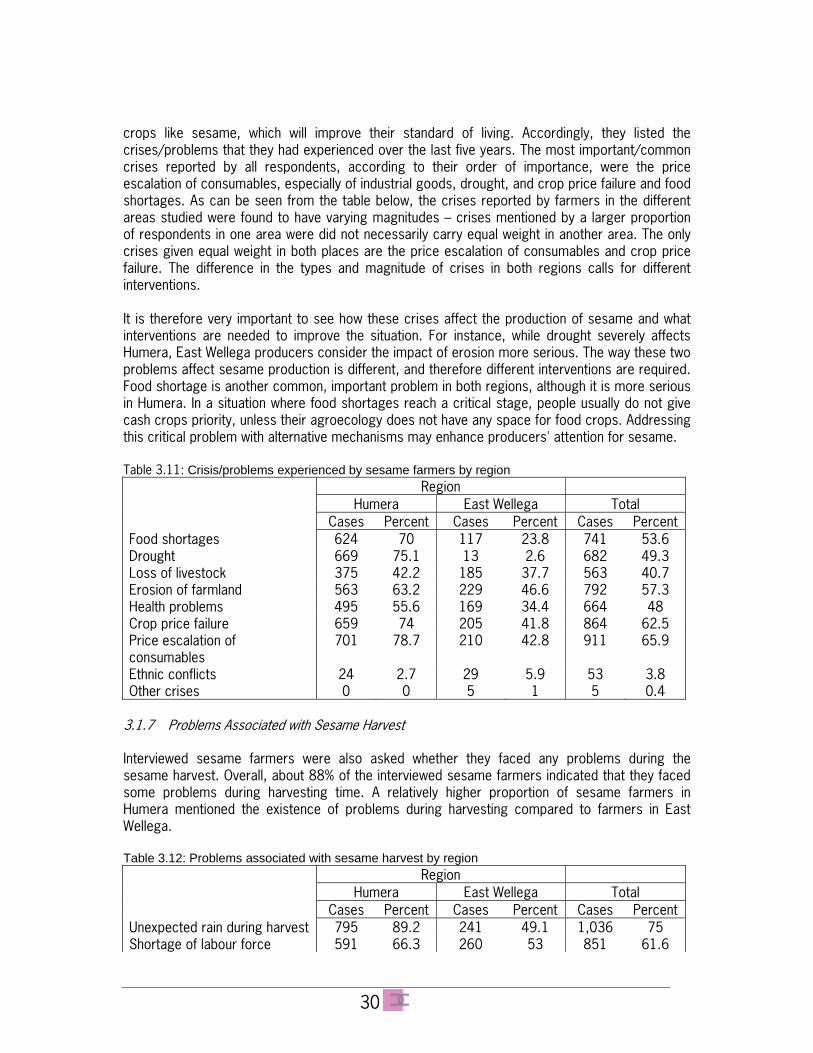
30
crops like sesame, which will improve their standard of living. Accordingly, they listed the crises/problems that they had experienced over the last five years. The most important/common crises reported by all respondents, according to their order of importance, were the price escalation of consumables, especially of industrial goods, drought, and crop price failure and food shortages. As can be seen from the table below, the crises reported by farmers in the different areas studied were found to have varying magnitudes – crises mentioned by a larger proportion of respondents in one area were did not necessarily carry equal weight in another area. The only crises given equal weight in both places are the price escalation of consumables and crop price failure. The difference in the types and magnitude of crises in both regions calls for different interventions. It is therefore very important to see how these crises affect the production of sesame and what interventions are needed to improve the situation. For instance, while drought severely affects Humera, East Wellega producers consider the impact of erosion more serious. The way these two problems affect sesame production is different, and therefore different interventions are required. Food shortage is another common, important problem in both regions, although it is more serious in Humera. In a situation where food shortages reach a critical stage, people usually do not give cash crops priority, unless their agroecology does not have any space for food crops. Addressing this critical problem with alternative mechanisms may enhance producers' attention for sesame. Table 3.11: Crisis/problems experienced by sesame farmers by region Region Humera East Wellega Total Cases Percent Cases Percent Cases PercentFood shortages 624 70 117 23.8 741 53.6 Drought 669 75.1 13 2.6 682 49.3 Loss of livestock 375 42.2 185 37.7 563 40.7 Erosion of farmland 563 63.2 229 46.6 792 57.3 Health problems 495 55.6 169 34.4 664 48 Crop price failure 659 74 205 41.8 864 62.5 Price escalation of consumables
701 78.7 210 42.8 911 65.9
Ethnic conflicts 24 2.7 29 5.9 53 3.8 Other crises 0 0 5 1 5 0.4
3.1.7 Problems Associated with Sesame Harvest Interviewed sesame farmers were also asked whether they faced any problems during the sesame harvest. Overall, about 88% of the interviewed sesame farmers indicated that they faced some problems during harvesting time. A relatively higher proportion of sesame farmers in Humera mentioned the existence of problems during harvesting compared to farmers in East Wellega. Table 3.12: Problems associated with sesame harvest by region Region Humera East Wellega Total Cases Percent Cases Percent Cases PercentUnexpected rain during harvest 795 89.2 241 49.1 1,036 75 Shortage of labour force 591 66.3 260 53 851 61.6
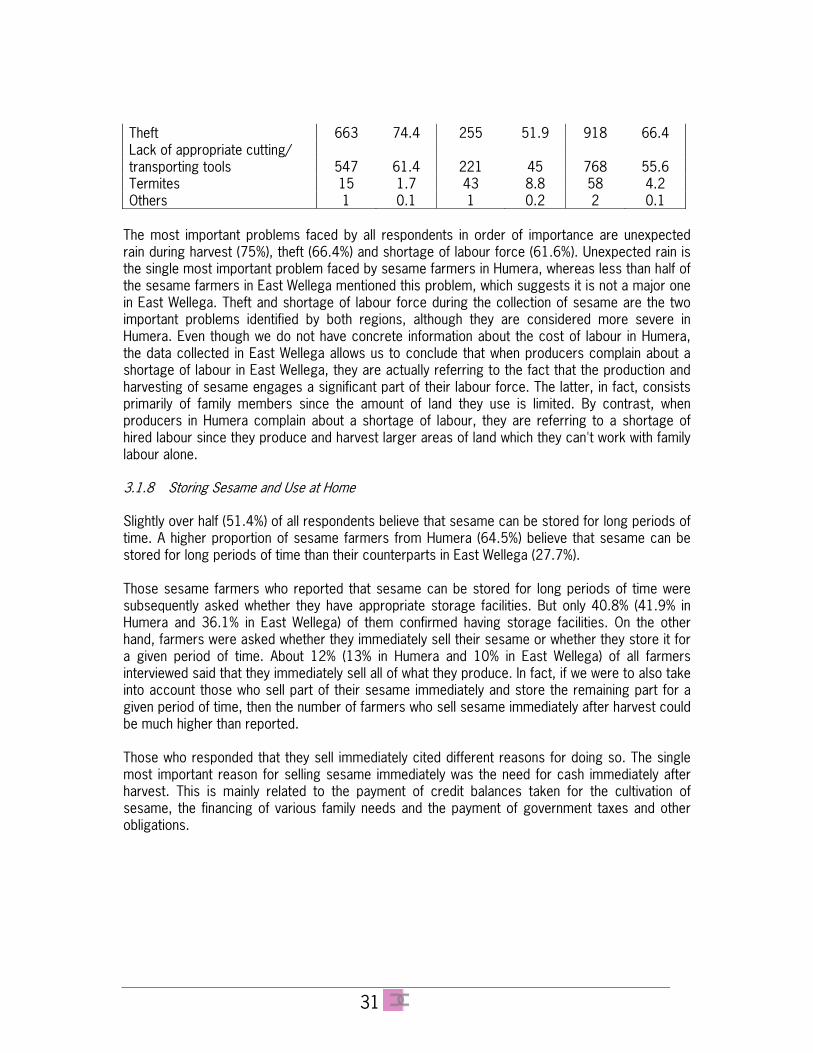
31
Theft 663 74.4 255 51.9 918 66.4 Lack of appropriate cutting/
transporting tools 547 61.4 221 45 768 55.6 Termites 15 1.7 43 8.8 58 4.2 Others 1 0.1 1 0.2 2 0.1
The most important problems faced by all respondents in order of importance are unexpected rain during harvest (75%), theft (66.4%) and shortage of labour force (61.6%). Unexpected rain is the single most important problem faced by sesame farmers in Humera, whereas less than half of the sesame farmers in East Wellega mentioned this problem, which suggests it is not a major one in East Wellega. Theft and shortage of labour force during the collection of sesame are the two important problems identified by both regions, although they are considered more severe in Humera. Even though we do not have concrete information about the cost of labour in Humera, the data collected in East Wellega allows us to conclude that when producers complain about a shortage of labour in East Wellega, they are actually referring to the fact that the production and harvesting of sesame engages a significant part of their labour force. The latter, in fact, consists primarily of family members since the amount of land they use is limited. By contrast, when producers in Humera complain about a shortage of labour, they are referring to a shortage of hired labour since they produce and harvest larger areas of land which they can't work with family labour alone. 3.1.8 Storing Sesame and Use at Home Slightly over half (51.4%) of all respondents believe that sesame can be stored for long periods of time. A higher proportion of sesame farmers from Humera (64.5%) believe that sesame can be stored for long periods of time than their counterparts in East Wellega (27.7%). Those sesame farmers who reported that sesame can be stored for long periods of time were subsequently asked whether they have appropriate storage facilities. But only 40.8% (41.9% in Humera and 36.1% in East Wellega) of them confirmed having storage facilities. On the other hand, farmers were asked whether they immediately sell their sesame or whether they store it for a given period of time. About 12% (13% in Humera and 10% in East Wellega) of all farmers interviewed said that they immediately sell all of what they produce. In fact, if we were to also take into account those who sell part of their sesame immediately and store the remaining part for a given period of time, then the number of farmers who sell sesame immediately after harvest could be much higher than reported. Those who responded that they sell immediately cited different reasons for doing so. The single most important reason for selling sesame immediately was the need for cash immediately after harvest. This is mainly related to the payment of credit balances taken for the cultivation of sesame, the financing of various family needs and the payment of government taxes and other obligations.
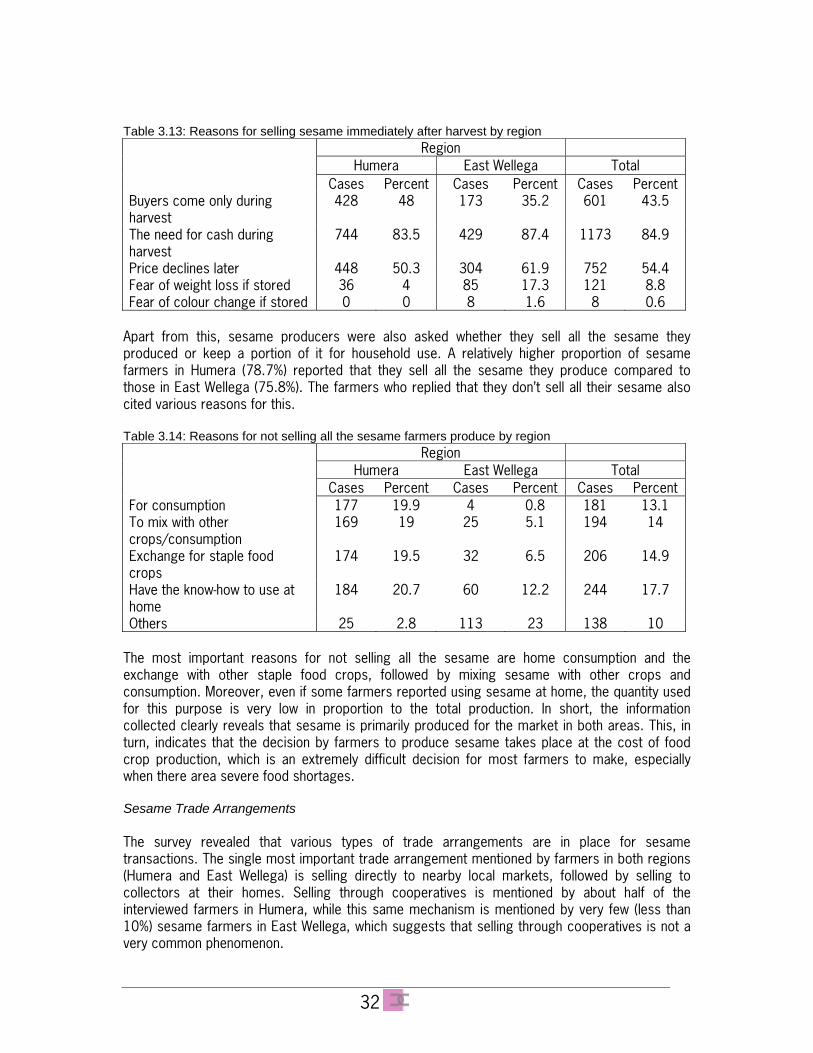
32
Table 3.13: Reasons for selling sesame immediately after harvest by region Region Humera East Wellega Total Cases Percent Cases Percent Cases PercentBuyers come only during harvest
428 48 173 35.2 601 43.5
The need for cash during harvest
744 83.5 429 87.4 1173 84.9
Price declines later 448 50.3 304 61.9 752 54.4 Fear of weight loss if stored 36 4 85 17.3 121 8.8 Fear of colour change if stored 0 0 8 1.6 8 0.6
Apart from this, sesame producers were also asked whether they sell all the sesame they produced or keep a portion of it for household use. A relatively higher proportion of sesame farmers in Humera (78.7%) reported that they sell all the sesame they produce compared to those in East Wellega (75.8%). The farmers who replied that they don’t sell all their sesame also cited various reasons for this. Table 3.14: Reasons for not selling all the sesame farmers produce by region
Region Humera East Wellega Total
Cases Percent Cases Percent Cases PercentFor consumption 177 19.9 4 0.8 181 13.1 To mix with other crops/consumption
169 19 25 5.1 194 14
Exchange for staple food crops
174 19.5 32 6.5 206 14.9
Have the know-how to use at home
184 20.7 60 12.2 244 17.7
Others 25 2.8 113 23 138 10 The most important reasons for not selling all the sesame are home consumption and the exchange with other staple food crops, followed by mixing sesame with other crops and consumption. Moreover, even if some farmers reported using sesame at home, the quantity used for this purpose is very low in proportion to the total production. In short, the information collected clearly reveals that sesame is primarily produced for the market in both areas. This, in turn, indicates that the decision by farmers to produce sesame takes place at the cost of food crop production, which is an extremely difficult decision for most farmers to make, especially when there area severe food shortages. Sesame Trade Arrangements The survey revealed that various types of trade arrangements are in place for sesame transactions. The single most important trade arrangement mentioned by farmers in both regions (Humera and East Wellega) is selling directly to nearby local markets, followed by selling to collectors at their homes. Selling through cooperatives is mentioned by about half of the interviewed farmers in Humera, while this same mechanism is mentioned by very few (less than 10%) sesame farmers in East Wellega, which suggests that selling through cooperatives is not a very common phenomenon.
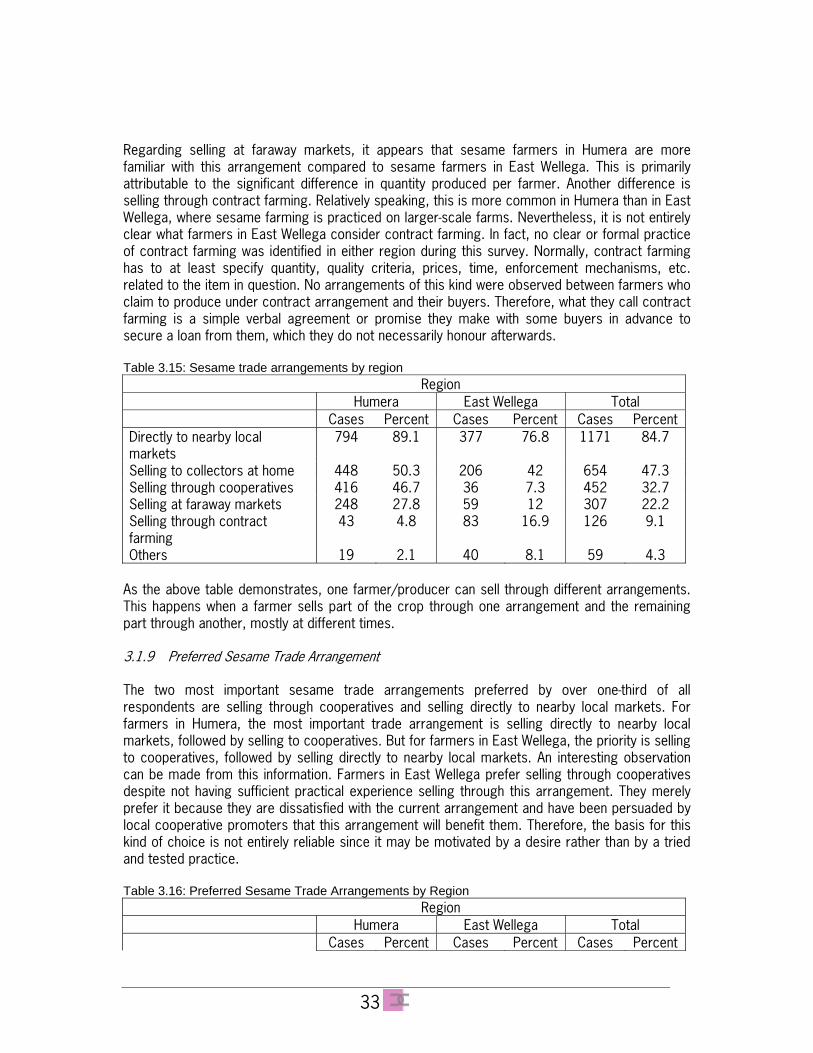
33
Regarding selling at faraway markets, it appears that sesame farmers in Humera are more familiar with this arrangement compared to sesame farmers in East Wellega. This is primarily attributable to the significant difference in quantity produced per farmer. Another difference is selling through contract farming. Relatively speaking, this is more common in Humera than in East Wellega, where sesame farming is practiced on larger-scale farms. Nevertheless, it is not entirely clear what farmers in East Wellega consider contract farming. In fact, no clear or formal practice of contract farming was identified in either region during this survey. Normally, contract farming has to at least specify quantity, quality criteria, prices, time, enforcement mechanisms, etc. related to the item in question. No arrangements of this kind were observed between farmers who claim to produce under contract arrangement and their buyers. Therefore, what they call contract farming is a simple verbal agreement or promise they make with some buyers in advance to secure a loan from them, which they do not necessarily honour afterwards. Table 3.15: Sesame trade arrangements by region Region Humera East Wellega Total Cases Percent Cases Percent Cases PercentDirectly to nearby local markets
794 89.1 377 76.8 1171 84.7
Selling to collectors at home 448 50.3 206 42 654 47.3 Selling through cooperatives 416 46.7 36 7.3 452 32.7 Selling at faraway markets 248 27.8 59 12 307 22.2 Selling through contract farming
43 4.8 83 16.9 126 9.1
Others 19 2.1 40 8.1 59 4.3 As the above table demonstrates, one farmer/producer can sell through different arrangements. This happens when a farmer sells part of the crop through one arrangement and the remaining part through another, mostly at different times. 3.1.9 Preferred Sesame Trade Arrangement The two most important sesame trade arrangements preferred by over one-third of all respondents are selling through cooperatives and selling directly to nearby local markets. For farmers in Humera, the most important trade arrangement is selling directly to nearby local markets, followed by selling to cooperatives. But for farmers in East Wellega, the priority is selling to cooperatives, followed by selling directly to nearby local markets. An interesting observation can be made from this information. Farmers in East Wellega prefer selling through cooperatives despite not having sufficient practical experience selling through this arrangement. They merely prefer it because they are dissatisfied with the current arrangement and have been persuaded by local cooperative promoters that this arrangement will benefit them. Therefore, the basis for this kind of choice is not entirely reliable since it may be motivated by a desire rather than by a tried and tested practice. Table 3.16: Preferred Sesame Trade Arrangements by Region Region Humera East Wellega Total Cases Percent Cases Percent Cases Percent
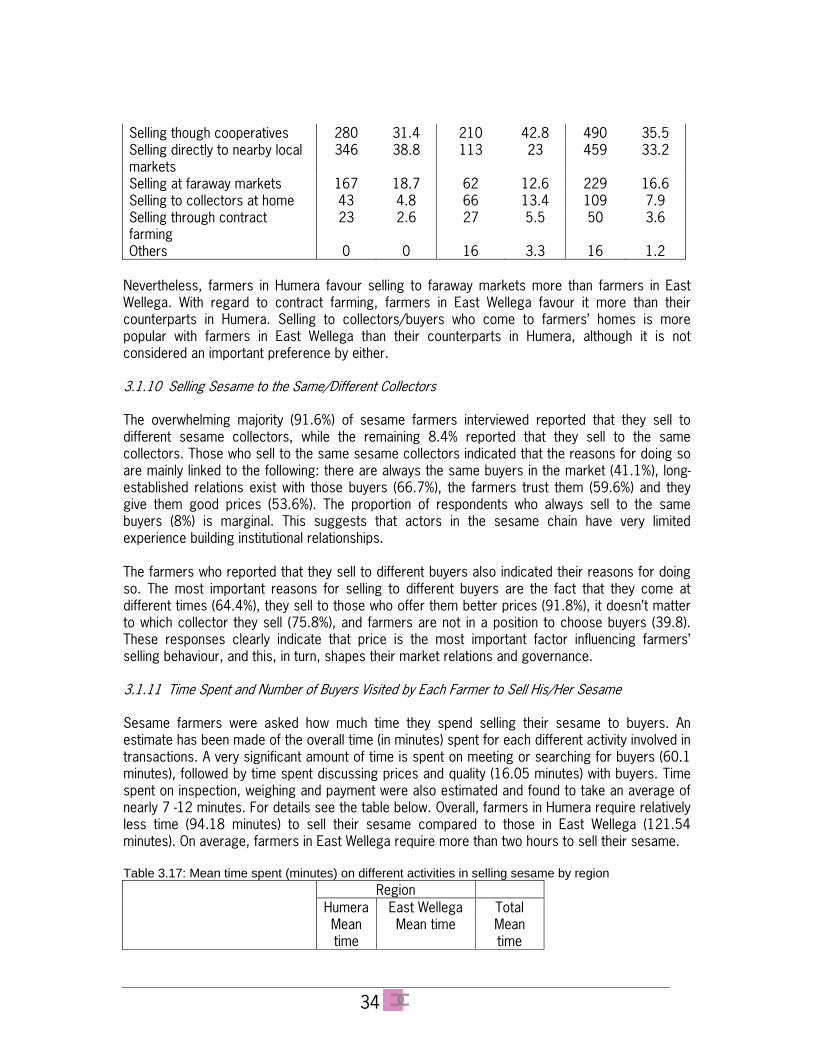
34
Selling though cooperatives 280 31.4 210 42.8 490 35.5 Selling directly to nearby local markets
346 38.8 113 23 459 33.2
Selling at faraway markets 167 18.7 62 12.6 229 16.6 Selling to collectors at home 43 4.8 66 13.4 109 7.9 Selling through contract farming
23 2.6 27 5.5 50 3.6
Others 0 0 16 3.3 16 1.2 Nevertheless, farmers in Humera favour selling to faraway markets more than farmers in East Wellega. With regard to contract farming, farmers in East Wellega favour it more than their counterparts in Humera. Selling to collectors/buyers who come to farmers’ homes is more popular with farmers in East Wellega than their counterparts in Humera, although it is not considered an important preference by either. 3.1.10 Selling Sesame to the Same/Different Collectors The overwhelming majority (91.6%) of sesame farmers interviewed reported that they sell to different sesame collectors, while the remaining 8.4% reported that they sell to the same collectors. Those who sell to the same sesame collectors indicated that the reasons for doing so are mainly linked to the following: there are always the same buyers in the market (41.1%), long-established relations exist with those buyers (66.7%), the farmers trust them (59.6%) and they give them good prices (53.6%). The proportion of respondents who always sell to the same buyers (8%) is marginal. This suggests that actors in the sesame chain have very limited experience building institutional relationships. The farmers who reported that they sell to different buyers also indicated their reasons for doing so. The most important reasons for selling to different buyers are the fact that they come at different times (64.4%), they sell to those who offer them better prices (91.8%), it doesn’t matter to which collector they sell (75.8%), and farmers are not in a position to choose buyers (39.8). These responses clearly indicate that price is the most important factor influencing farmers’ selling behaviour, and this, in turn, shapes their market relations and governance. 3.1.11 Time Spent and Number of Buyers Visited by Each Farmer to Sell His/Her Sesame Sesame farmers were asked how much time they spend selling their sesame to buyers. An estimate has been made of the overall time (in minutes) spent for each different activity involved in transactions. A very significant amount of time is spent on meeting or searching for buyers (60.1 minutes), followed by time spent discussing prices and quality (16.05 minutes) with buyers. Time spent on inspection, weighing and payment were also estimated and found to take an average of nearly 7 -12 minutes. For details see the table below. Overall, farmers in Humera require relatively less time (94.18 minutes) to sell their sesame compared to those in East Wellega (121.54 minutes). On average, farmers in East Wellega require more than two hours to sell their sesame. Table 3.17: Mean time spent (minutes) on different activities in selling sesame by region Region Humera East Wellega Total Mean
time Mean time Mean
time
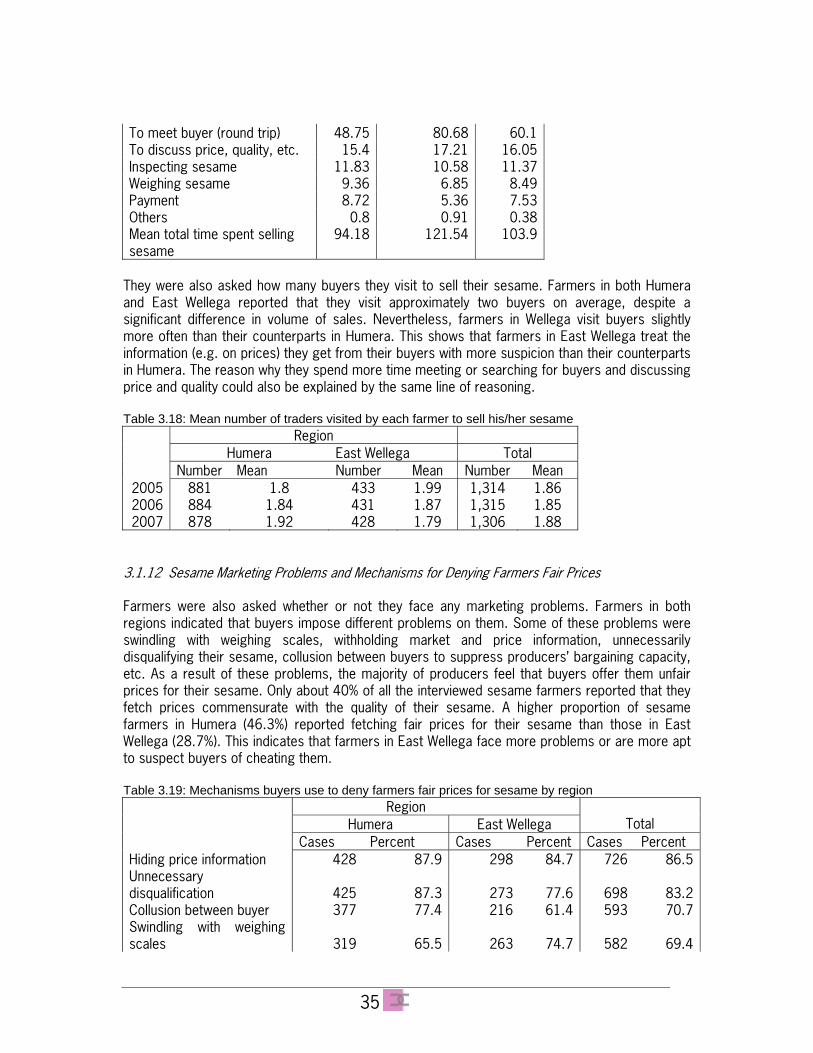
35
To meet buyer (round trip) 48.75 80.68 60.1To discuss price, quality, etc. 15.4 17.21 16.05Inspecting sesame 11.83 10.58 11.37Weighing sesame 9.36 6.85 8.49Payment 8.72 5.36 7.53Others 0.8 0.91 0.38Mean total time spent selling sesame
94.18 121.54 103.9
They were also asked how many buyers they visit to sell their sesame. Farmers in both Humera and East Wellega reported that they visit approximately two buyers on average, despite a significant difference in volume of sales. Nevertheless, farmers in Wellega visit buyers slightly more often than their counterparts in Humera. This shows that farmers in East Wellega treat the information (e.g. on prices) they get from their buyers with more suspicion than their counterparts in Humera. The reason why they spend more time meeting or searching for buyers and discussing price and quality could also be explained by the same line of reasoning. Table 3.18: Mean number of traders visited by each farmer to sell his/her sesame
Region Humera East Wellega Total
Number Mean Number Mean Number Mean 2005 881 1.8 433 1.99 1,314 1.86 2006 884 1.84 431 1.87 1,315 1.85 2007 878 1.92 428 1.79 1,306 1.88
3.1.12 Sesame Marketing Problems and Mechanisms for Denying Farmers Fair Prices Farmers were also asked whether or not they face any marketing problems. Farmers in both regions indicated that buyers impose different problems on them. Some of these problems were swindling with weighing scales, withholding market and price information, unnecessarily disqualifying their sesame, collusion between buyers to suppress producers’ bargaining capacity, etc. As a result of these problems, the majority of producers feel that buyers offer them unfair prices for their sesame. Only about 40% of all the interviewed sesame farmers reported that they fetch prices commensurate with the quality of their sesame. A higher proportion of sesame farmers in Humera (46.3%) reported fetching fair prices for their sesame than those in East Wellega (28.7%). This indicates that farmers in East Wellega face more problems or are more apt to suspect buyers of cheating them. Table 3.19: Mechanisms buyers use to deny farmers fair prices for sesame by region
Region Humera East Wellega Total
Cases Percent Cases Percent Cases Percent Hiding price information 428 87.9 298 84.7 726 86.5Unnecessary disqualification 425 87.3 273 77.6 698 83.2Collusion between buyer 377 77.4 216 61.4 593 70.7Swindling with weighing scales 319 65.5 263 74.7 582 69.4
36
Others 9 1.9 23 6.5 32 3.8N 487 352 839
The two most important mechanisms buyers use to deny farmers fair prices commensurate with the quality of their sesame are hiding price information and unnecessarily disqualifying the farmers’ sesame. The third and fourth mechanisms are collusion between buyers and swindling with weighing scales. The data shows a variation in the importance of these mechanisms of cheating by region. For farmers in Humera, since the first two factors are similar, collusion between buyers is considered more important than swindling on weighing scales, while for farmers in East Wellega swindling on weighing scales is considered more important as a third most important reason for being cheated /denied fair prices for their sesame. 3.1.13 The Extent of Sesame Marketing Problems. The interviewed sesame farmers were also asked to indicate to what extent the six identified problems affected them by using the Likert scale, with the scale ranging from 1-5 for each problem. A result was determined based on the responses of the interviewees to the six individual problems, and the total scores range from 6 to 30 for all the problems. Therefore, scores ranked between 6-12 mean the problem is considered insignificant, 13-20 equates medium significance and 21-30 equates high significance. The results of the analysis revealed that approximately 33% of all the interviewed farmers in Humera and East Wellega indicated the existence of significant problems related to sesame marketing (see the table below). However, there is variation regarding the extent of the problems indicated by the interviewed farmers from the two regions covered in this survey. A higher proportion of sesame farmers in East Wellega (about 58%) indicated that the extent of the problems is very significant, compared to only 20% for Humera. In general, in both regions, producers consider the problems as having a moderate impact on them. Table 3.20: Extent of sesame marketing problems by region
Region Humera East Wellega Total
Cases Percent Cases Percent Cases Percent Insignificant problem (6 -12) 273 30.6 21 4.3 294 21.3Medium significance (13-20) 442 49.6 185 37.8 627 45.4High significance (21 & above) 176 19.8 283 57.6 459 33.3N 891 100 489 99.7 1380 100
On the other hand, this survey also examined the extent to which farmers trust buyers when selling their sesame. The same Likert scale was employed for five individual issues. The total score for responses to the five different questions ranges from 5-25. For the sake of simplicity, the scores are grouped into three ranges. Scores raging from 5-7 signify no trust, scores ranging from 8-12 medium trust and scores ranging from1-25 signify high trust. Table 3.21: Extent to which farmers trust buyers by region
Region Humera East Wellega Total
Cases Percent Cases Percent Cases Percent No trust (6-7) 289 32.7 274 56.8 563 41.2
37
Medium trust (8-12) 295 33.3 92 19.1 387 28.3High trust (13 & above) 301 34 116 24.1 417 30.5N 885 100 482 100 1367 100
Overall, about 31% of the farmers display high trust regarding buyers in terms of honesty with weighing scale and assessing the product, providing price and market information and not colluding against them. Like the level of market problem, the level of trust also varies significantly between the two regions. Consistent with their report that there are significant high marketing problems (57.6%), producers in East Wellega indicated that their trust vis-à-vis buyers is very low (56.8%), while in Humera there is some deviation, with 34% indicating high trust versus 20% indicating significant marketing problems. 3.1.14 Sesame Sales and Mechanisms of Price Determination and Negotiation The average volume of sesame sold during the four years (2004-2007) preceding the survey indicates that there is stable situation regarding per capita sesame sales by respondents in Humera, while per capita sesame sales in East Wellega reveal a declining trend over time. This is consistent with the production situation in both regions. As already mentioned previously, sesame production is also declining in East Wellega, whereas it is relatively stable or even slightly increasing in Humera. Table 3.22: Average quintals of sesame sold by year and region Region Humera East Wellega Total Number Mean (Qt) Number Mean
(Qt) Number Mean
(Qt) 2004 804 20.15 244 4.93 1,048 16.6 2005 816 19.21 327 3.95 1,143 14.85 2006 790 18.21 309 2.86 1,099 13.89 2007 767 20.2 295 2.44 1,062 15.27
The total per capita volume of sales is a bit higher than the total per capita production reported in the previous section of the report. This is because all the interviewees were considered for per capita production, while for per capita sales only those who sold sesame during a particular year were considered. The most frequently mentioned mechanism used for sesame price determination, as mentioned by sesame farmers is that prices are determined by the quality of sesame, followed by buyers’ goodwill. The third factor, though to a lesser extent, that determines price is the quantity of sesame that a farmer supplies to a buyer. For sesame farmers in East Wellega, the most important factor determining sesame prices is the goodwill of buyers since producers do not have any power when it comes to determine prices. For producers, this means that buyers discuss price issues among themselves and fix them at a level they mutually agree on. Therefore, no matter what the quantity or quality of a farmer’s product, negotiations are difficult since buyers are unlikely to change their predetermined prices. Some farmers even complained that if they refuse to sell to their first contact and look for an alternative, subsequent contacts will further reduce the price, and the more contacts farmers approach, the more the price will be reduced.. In this sense, the concept of competition does not exist among the buyers. That is why farmers
38
believe that buyers play a determining role in fixing the price of the sesame. This is likely to be the reason why the majority of farmers in East Wellega display a low level of trust towards buyers. Table 3.23: Mechanisms of sesame price negotiation by region Region Humera East Wellega Total Cases Percent Cases Percent Cases PercentPrice is based on quality 534 60.9 210 47.1 744 56.2 Price is based on buyers’ goodwill
330 37.6 235 55.3 565 43.3
Price is based on quantity 10 1.1 97 21 107 8 Other mechanisms 5 0.6 27 6.2 32 2.4
Furthermore, farmers were asked whether buyers consider the quality of sesame when buying from them. About 66% of all the interviewed farmers reported that buyers do take the quality of sesame into account when buying. In Humera, over 85% of the farmers reported that buyers consider the quality of sesame when offering them a price, while in East Wellega, only about 33% of respondents felt that buyers take quality into account when buying sesame. In their explanation, farmers in East Wellega indicated that their buyers do not use quality as a criterion for price differentiation; instead, they only assess whether it qualifies as a product, but they do not use quality as a gauge to differentiate purchasing prices. The sesame farmers who felt that buyers do take quality into account when buying and determining prices indicated that the level of admixture is the first and most important quality indicator used by sesame collectors, followed by the colour and size of the sesame seed. Oil content is another important quality indicator. For sesame farmers in Humera, the second most important quality indicator is oil content, followed by the size of the seed. They perceive the colour of sesame to less valued, relatively speaking. However, for sesame farmers in East Wellega, the second most important quality indicator is colour, which is less valued in Humera, relatively speaking. For details see the table below. Table 3.24: Indicators of sesame quality used by sesame farmers by region
Region Humera East Wellega Total
Cases Percent Cases Percent Cases Percent Level of admixture 742 99.9 143 94.1 885 98.2Colour (homogeneity) 692 92.3 121 82.9 813 90.7Size of seed 709 94.5 92 63.9 801 89.6Oil content 711 95.1 21 15.8 732 83.1Others 159 33.3 1 1 160 27.8
3.1.15 Sesame Price Trends Farmers were asked about the average prices that traders offered for their sesame products in the three years preceding the survey. The analysis of the responses that farmers gave to these questions indicates that there was a price increase over time in both the regions included in this study.
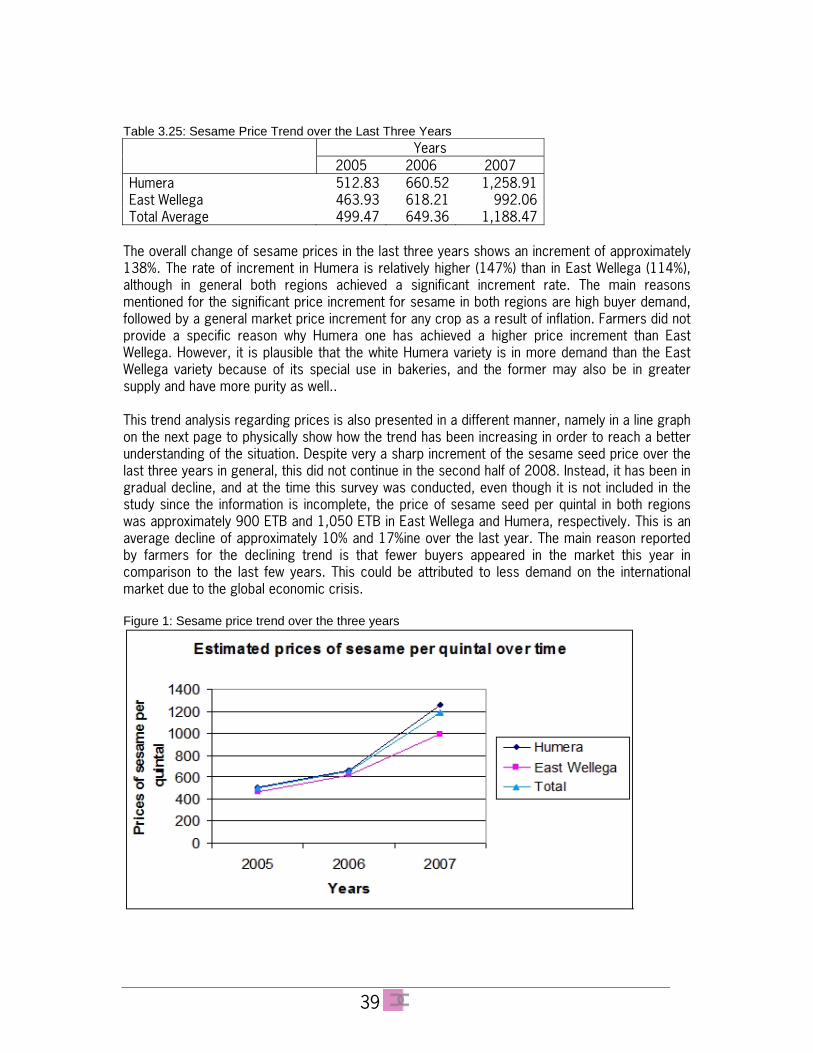
39
Table 3.25: Sesame Price Trend over the Last Three Years Years
2005 2006 2007 Humera 512.83 660.52 1,258.91East Wellega 463.93 618.21 992.06Total Average 499.47 649.36 1,188.47
The overall change of sesame prices in the last three years shows an increment of approximately 138%. The rate of increment in Humera is relatively higher (147%) than in East Wellega (114%), although in general both regions achieved a significant increment rate. The main reasons mentioned for the significant price increment for sesame in both regions are high buyer demand, followed by a general market price increment for any crop as a result of inflation. Farmers did not provide a specific reason why Humera one has achieved a higher price increment than East Wellega. However, it is plausible that the white Humera variety is in more demand than the East Wellega variety because of its special use in bakeries, and the former may also be in greater supply and have more purity as well.. This trend analysis regarding prices is also presented in a different manner, namely in a line graph on the next page to physically show how the trend has been increasing in order to reach a better understanding of the situation. Despite very a sharp increment of the sesame seed price over the last three years in general, this did not continue in the second half of 2008. Instead, it has been in gradual decline, and at the time this survey was conducted, even though it is not included in the study since the information is incomplete, the price of sesame seed per quintal in both regions was approximately 900 ETB and 1,050 ETB in East Wellega and Humera, respectively. This is an average decline of approximately 10% and 17%ine over the last year. The main reason reported by farmers for the declining trend is that fewer buyers appeared in the market this year in comparison to the last few years. This could be attributed to less demand on the international market due to the global economic crisis. Figure 1: Sesame price trend over the three years
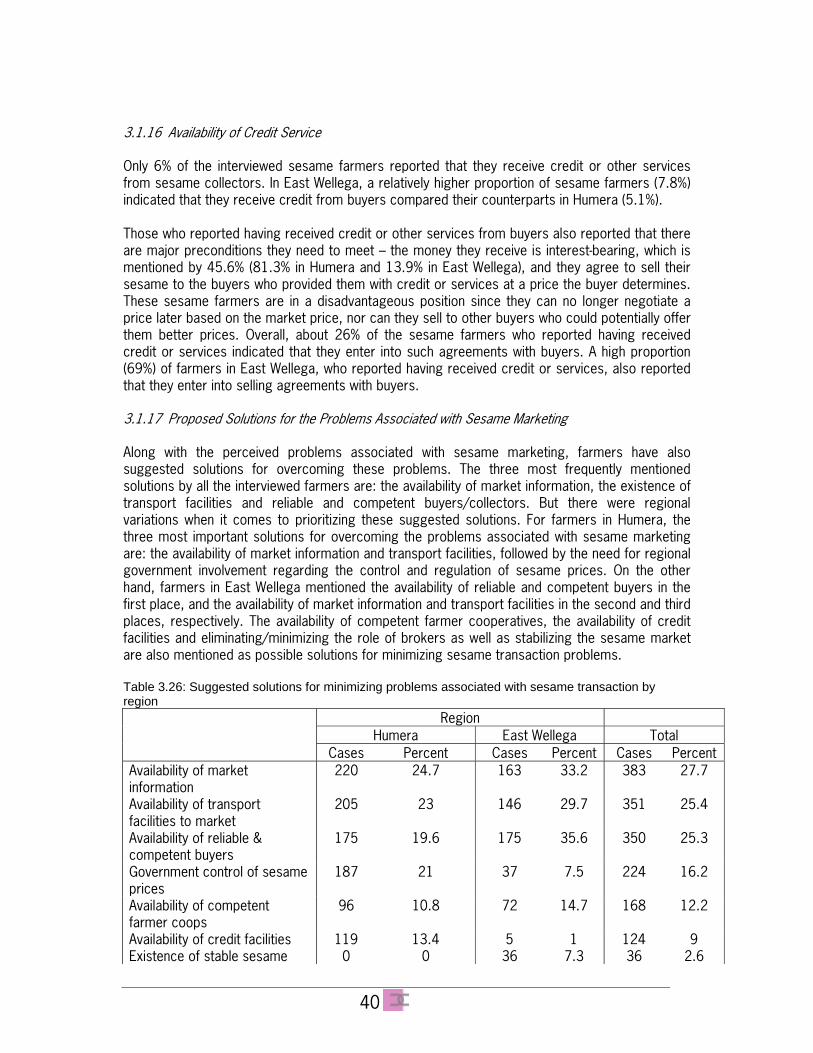
40
3.1.16 Availability of Credit Service Only 6% of the interviewed sesame farmers reported that they receive credit or other services from sesame collectors. In East Wellega, a relatively higher proportion of sesame farmers (7.8%) indicated that they receive credit from buyers compared their counterparts in Humera (5.1%). Those who reported having received credit or other services from buyers also reported that there are major preconditions they need to meet – the money they receive is interest-bearing, which is mentioned by 45.6% (81.3% in Humera and 13.9% in East Wellega), and they agree to sell their sesame to the buyers who provided them with credit or services at a price the buyer determines. These sesame farmers are in a disadvantageous position since they can no longer negotiate a price later based on the market price, nor can they sell to other buyers who could potentially offer them better prices. Overall, about 26% of the sesame farmers who reported having received credit or services indicated that they enter into such agreements with buyers. A high proportion (69%) of farmers in East Wellega, who reported having received credit or services, also reported that they enter into selling agreements with buyers. 3.1.17 Proposed Solutions for the Problems Associated with Sesame Marketing Along with the perceived problems associated with sesame marketing, farmers have also suggested solutions for overcoming these problems. The three most frequently mentioned solutions by all the interviewed farmers are: the availability of market information, the existence of transport facilities and reliable and competent buyers/collectors. But there were regional variations when it comes to prioritizing these suggested solutions. For farmers in Humera, the three most important solutions for overcoming the problems associated with sesame marketing are: the availability of market information and transport facilities, followed by the need for regional government involvement regarding the control and regulation of sesame prices. On the other hand, farmers in East Wellega mentioned the availability of reliable and competent buyers in the first place, and the availability of market information and transport facilities in the second and third places, respectively. The availability of competent farmer cooperatives, the availability of credit facilities and eliminating/minimizing the role of brokers as well as stabilizing the sesame market are also mentioned as possible solutions for minimizing sesame transaction problems. Table 3.26: Suggested solutions for minimizing problems associated with sesame transaction by region
Region Humera East Wellega Total
Cases Percent Cases Percent Cases PercentAvailability of market information
220 24.7 163 33.2 383 27.7
Availability of transport facilities to market
205 23 146 29.7 351 25.4
Availability of reliable & competent buyers
175 19.6 175 35.6 350 25.3
Government control of sesame prices
187 21 37 7.5 224 16.2
Availability of competent farmer coops
96 10.8 72 14.7 168 12.2
Availability of credit facilities 119 13.4 5 1 124 9 Existence of stable sesame 0 0 36 7.3 36 2.6
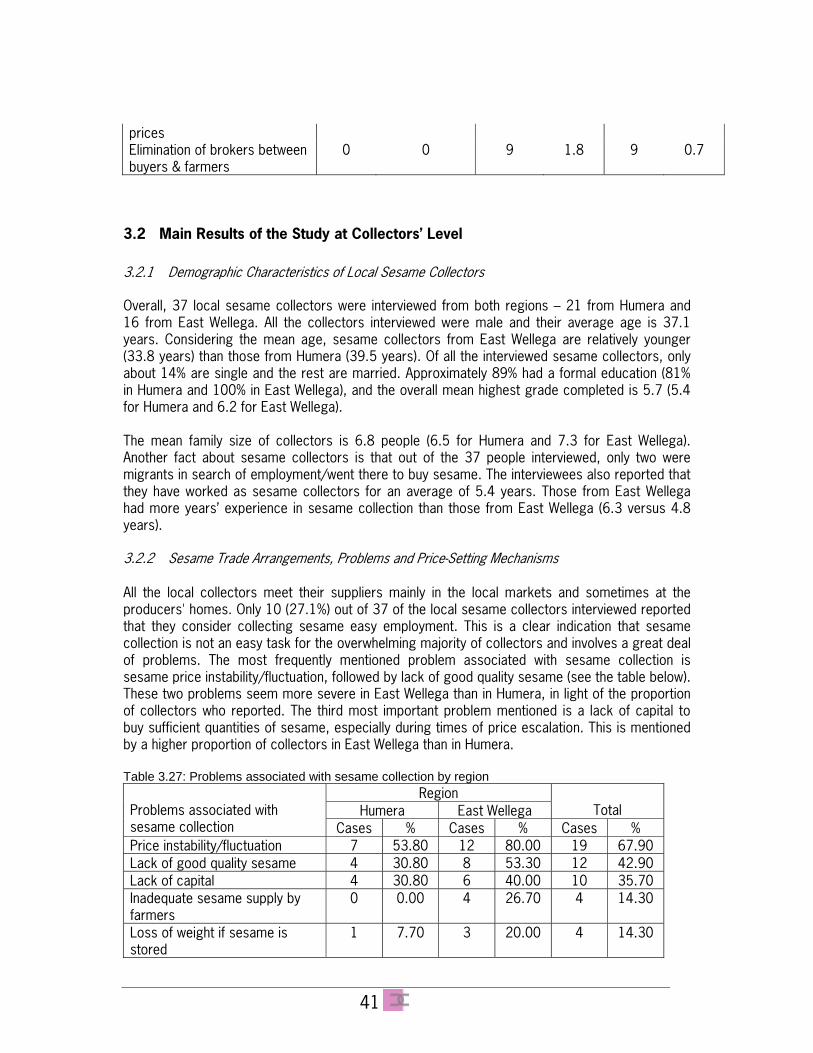
41
prices Elimination of brokers between buyers & farmers
0 0 9 1.8 9 0.7
3.2 Main Results of the Study at Collectors’ Level 3.2.1 Demographic Characteristics of Local Sesame Collectors Overall, 37 local sesame collectors were interviewed from both regions – 21 from Humera and 16 from East Wellega. All the collectors interviewed were male and their average age is 37.1 years. Considering the mean age, sesame collectors from East Wellega are relatively younger (33.8 years) than those from Humera (39.5 years). Of all the interviewed sesame collectors, only about 14% are single and the rest are married. Approximately 89% had a formal education (81% in Humera and 100% in East Wellega), and the overall mean highest grade completed is 5.7 (5.4 for Humera and 6.2 for East Wellega). The mean family size of collectors is 6.8 people (6.5 for Humera and 7.3 for East Wellega). Another fact about sesame collectors is that out of the 37 people interviewed, only two were migrants in search of employment/went there to buy sesame. The interviewees also reported that they have worked as sesame collectors for an average of 5.4 years. Those from East Wellega had more years’ experience in sesame collection than those from East Wellega (6.3 versus 4.8 years).
3.2.2 Sesame Trade Arrangements, Problems and Price-Setting Mechanisms All the local collectors meet their suppliers mainly in the local markets and sometimes at the producers' homes. Only 10 (27.1%) out of 37 of the local sesame collectors interviewed reported that they consider collecting sesame easy employment. This is a clear indication that sesame collection is not an easy task for the overwhelming majority of collectors and involves a great deal of problems. The most frequently mentioned problem associated with sesame collection is sesame price instability/fluctuation, followed by lack of good quality sesame (see the table below). These two problems seem more severe in East Wellega than in Humera, in light of the proportion of collectors who reported. The third most important problem mentioned is a lack of capital to buy sufficient quantities of sesame, especially during times of price escalation. This is mentioned by a higher proportion of collectors in East Wellega than in Humera. Table 3.27: Problems associated with sesame collection by region
Region Humera East Wellega
Total
Problems associated with sesame collection Cases % Cases % Cases % Price instability/fluctuation 7 53.80 12 80.00 19 67.90 Lack of good quality sesame 4 30.80 8 53.30 12 42.90 Lack of capital 4 30.80 6 40.00 10 35.70 Inadequate sesame supply by farmers
0 0.00 4 26.70 4 14.30
Loss of weight if sesame is stored
1 7.70 3 20.00 4 14.30
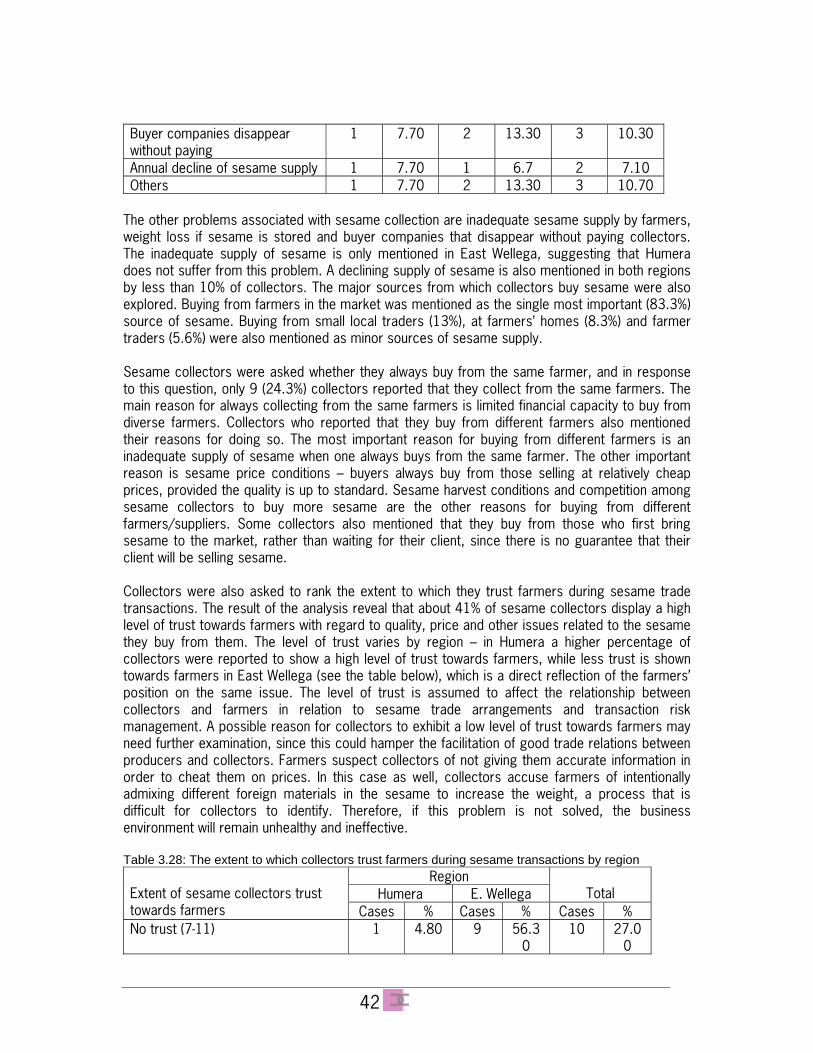
42
Buyer companies disappear without paying
1 7.70 2 13.30 3 10.30
Annual decline of sesame supply 1 7.70 1 6.7 2 7.10 Others 1 7.70 2 13.30 3 10.70
The other problems associated with sesame collection are inadequate sesame supply by farmers, weight loss if sesame is stored and buyer companies that disappear without paying collectors. The inadequate supply of sesame is only mentioned in East Wellega, suggesting that Humera does not suffer from this problem. A declining supply of sesame is also mentioned in both regions by less than 10% of collectors. The major sources from which collectors buy sesame were also explored. Buying from farmers in the market was mentioned as the single most important (83.3%) source of sesame. Buying from small local traders (13%), at farmers’ homes (8.3%) and farmer traders (5.6%) were also mentioned as minor sources of sesame supply. Sesame collectors were asked whether they always buy from the same farmer, and in response to this question, only 9 (24.3%) collectors reported that they collect from the same farmers. The main reason for always collecting from the same farmers is limited financial capacity to buy from diverse farmers. Collectors who reported that they buy from different farmers also mentioned their reasons for doing so. The most important reason for buying from different farmers is an inadequate supply of sesame when one always buys from the same farmer. The other important reason is sesame price conditions – buyers always buy from those selling at relatively cheap prices, provided the quality is up to standard. Sesame harvest conditions and competition among sesame collectors to buy more sesame are the other reasons for buying from different farmers/suppliers. Some collectors also mentioned that they buy from those who first bring sesame to the market, rather than waiting for their client, since there is no guarantee that their client will be selling sesame. Collectors were also asked to rank the extent to which they trust farmers during sesame trade transactions. The result of the analysis reveal that about 41% of sesame collectors display a high level of trust towards farmers with regard to quality, price and other issues related to the sesame they buy from them. The level of trust varies by region – in Humera a higher percentage of collectors were reported to show a high level of trust towards farmers, while less trust is shown towards farmers in East Wellega (see the table below), which is a direct reflection of the farmers’ position on the same issue. The level of trust is assumed to affect the relationship between collectors and farmers in relation to sesame trade arrangements and transaction risk management. A possible reason for collectors to exhibit a low level of trust towards farmers may need further examination, since this could hamper the facilitation of good trade relations between producers and collectors. Farmers suspect collectors of not giving them accurate information in order to cheat them on prices. In this case as well, collectors accuse farmers of intentionally admixing different foreign materials in the sesame to increase the weight, a process that is difficult for collectors to identify. Therefore, if this problem is not solved, the business environment will remain unhealthy and ineffective. Table 3.28: The extent to which collectors trust farmers during sesame transactions by region
Region Humera E. Wellega
Total
Extent of sesame collectors trust towards farmers Cases % Cases % Cases % No trust (7-11) 1 4.80 9 56.3
0 10 27.0
0
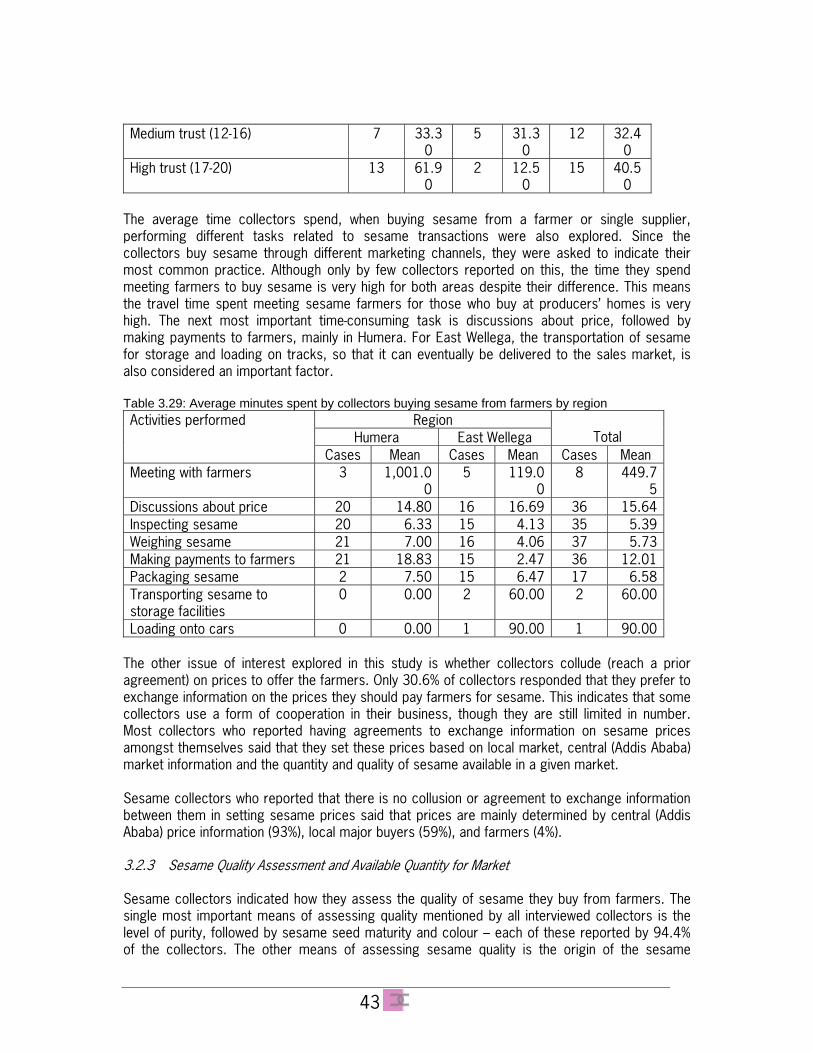
43
Medium trust (12-16) 7 33.30
5 31.30
12 32.40
High trust (17-20) 13 61.90
2 12.50
15 40.50
The average time collectors spend, when buying sesame from a farmer or single supplier, performing different tasks related to sesame transactions were also explored. Since the collectors buy sesame through different marketing channels, they were asked to indicate their most common practice. Although only by few collectors reported on this, the time they spend meeting farmers to buy sesame is very high for both areas despite their difference. This means the travel time spent meeting sesame farmers for those who buy at producers’ homes is very high. The next most important time-consuming task is discussions about price, followed by making payments to farmers, mainly in Humera. For East Wellega, the transportation of sesame for storage and loading on tracks, so that it can eventually be delivered to the sales market, is also considered an important factor. Table 3.29: Average minutes spent by collectors buying sesame from farmers by region
Region Humera East Wellega
Total
Activities performed
Cases Mean Cases Mean Cases Mean Meeting with farmers 3 1,001.0
05 119.0
08 449.7
5Discussions about price 20 14.80 16 16.69 36 15.64Inspecting sesame 20 6.33 15 4.13 35 5.39Weighing sesame 21 7.00 16 4.06 37 5.73Making payments to farmers 21 18.83 15 2.47 36 12.01Packaging sesame 2 7.50 15 6.47 17 6.58Transporting sesame to storage facilities
0 0.00 2 60.00 2 60.00
Loading onto cars 0 0.00 1 90.00 1 90.00 The other issue of interest explored in this study is whether collectors collude (reach a prior agreement) on prices to offer the farmers. Only 30.6% of collectors responded that they prefer to exchange information on the prices they should pay farmers for sesame. This indicates that some collectors use a form of cooperation in their business, though they are still limited in number. Most collectors who reported having agreements to exchange information on sesame prices amongst themselves said that they set these prices based on local market, central (Addis Ababa) market information and the quantity and quality of sesame available in a given market. Sesame collectors who reported that there is no collusion or agreement to exchange information between them in setting sesame prices said that prices are mainly determined by central (Addis Ababa) price information (93%), local major buyers (59%), and farmers (4%). 3.2.3 Sesame Quality Assessment and Available Quantity for Market Sesame collectors indicated how they assess the quality of sesame they buy from farmers. The single most important means of assessing quality mentioned by all interviewed collectors is the level of purity, followed by sesame seed maturity and colour – each of these reported by 94.4% of the collectors. The other means of assessing sesame quality is the origin of the sesame
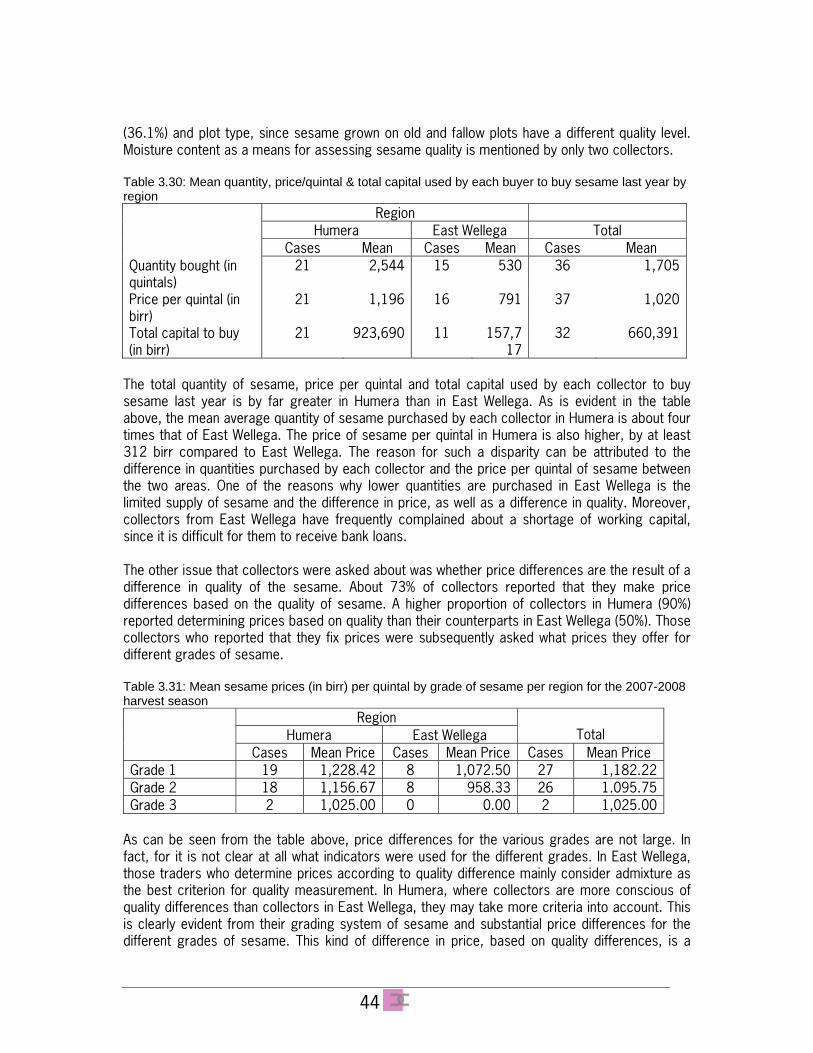
44
(36.1%) and plot type, since sesame grown on old and fallow plots have a different quality level. Moisture content as a means for assessing sesame quality is mentioned by only two collectors. Table 3.30: Mean quantity, price/quintal & total capital used by each buyer to buy sesame last year by region
Region Humera East Wellega Total
Cases Mean Cases Mean Cases Mean Quantity bought (in quintals)
21 2,544 15 530 36 1,705
Price per quintal (in birr)
21 1,196 16 791 37 1,020
Total capital to buy (in birr)
21 923,690 11 157,717
32 660,391
The total quantity of sesame, price per quintal and total capital used by each collector to buy sesame last year is by far greater in Humera than in East Wellega. As is evident in the table above, the mean average quantity of sesame purchased by each collector in Humera is about four times that of East Wellega. The price of sesame per quintal in Humera is also higher, by at least 312 birr compared to East Wellega. The reason for such a disparity can be attributed to the difference in quantities purchased by each collector and the price per quintal of sesame between the two areas. One of the reasons why lower quantities are purchased in East Wellega is the limited supply of sesame and the difference in price, as well as a difference in quality. Moreover, collectors from East Wellega have frequently complained about a shortage of working capital, since it is difficult for them to receive bank loans. The other issue that collectors were asked about was whether price differences are the result of a difference in quality of the sesame. About 73% of collectors reported that they make price differences based on the quality of sesame. A higher proportion of collectors in Humera (90%) reported determining prices based on quality than their counterparts in East Wellega (50%). Those collectors who reported that they fix prices were subsequently asked what prices they offer for different grades of sesame. Table 3.31: Mean sesame prices (in birr) per quintal by grade of sesame per region for the 2007-2008 harvest season
Region Humera East Wellega
Total
Cases Mean Price Cases Mean Price Cases Mean Price Grade 1 19 1,228.42 8 1,072.50 27 1,182.22Grade 2 18 1,156.67 8 958.33 26 1.095.75Grade 3 2 1,025.00 0 0.00 2 1,025.00
As can be seen from the table above, price differences for the various grades are not large. In fact, for it is not clear at all what indicators were used for the different grades. In East Wellega, those traders who determine prices according to quality difference mainly consider admixture as the best criterion for quality measurement. In Humera, where collectors are more conscious of quality differences than collectors in East Wellega, they may take more criteria into account. This is clearly evident from their grading system of sesame and substantial price differences for the different grades of sesame. This kind of difference in price, based on quality differences, is a
45
highly effective mechanism for ensuring a high-quality seed supply since it acts as an incentive for those farmers who produce good quality sesame, and it also discourages others. Sesame collectors who reported that they do not determine prices based on quality, also revealed their reasons for not differentiating between high-quality and low-quality sesame. The major reason expressed by 70% of them is not to lose their old clients by disqualifying their sesame. In other words, they fear offending and ultimately losing these clients by not buying their low-quality sesame. Competition among collectors to buy as large a quantity of sesame as possible to meet their central market buyers’ expectations is also mentioned as a compelling factor not to discriminate sesame based on quality. Regarding the trend of sesame prices over time, 94.4% of collectors reported that sesame prices are increasing over time, and the main reasons for this are more demand for sesame in external markets, (94.4%), a declining supply of sesame (33.3%) and more local demand for sesame (8.3%). On the other hand, collectors who reported that sesame prices are on declining over time, though they did not explicitly state it, may be referring to prices this year, as compared to prices in previous years. 3.2.4 Sesame Storage and Transaction Arrangements Applied by Collectors Collectors were asked whether they sometimes immediately sell or store the sesame they bought. About 78% of collectors replied that they immediately sell the sesame they have collected. The main reason for selling immediately is to increase turnover (87.1%), followed by the need to rapidly earn their money back (71.0%). Fear of falling sesame prices is also another important reason (22.6%) given by collectors. The market demand for immediate selling and sesame that cannot be stored are also mentioned by a minority of respondents. Three collectors reported they sell some sesame immediately and store the rest of it for some time. Five collectors reported storing sesame for some time after they bought. Those who store it all and those who store part of it explained their reasons for doing so. The major reason for storing, which is mentioned by all, is to save the sesame for the moment when prices rise higher than the current price. Storing sesame until they accumulate adequate quantities is also mentioned as a major reason for storing sesame. Sesame collectors reported that they sell the sesame they collect mainly to major local buyers (64%), to central (Addis Ababa) market (31%) and to the Ethiopian Grain Trade Enterprise or EGTE (3%). On the other hand, only three collectors reported selling the sesame they collected to the same buyer. The main reason they gave for selling to the same buyer is a long relationship with a given client and mutual trust. The collectors who reported selling the sesame they collected to different buyers also explained their reasons for doing so. Their main reasons, in order of importance, are: to sell to the buyer who offers them higher prices (93.8%), to any buyer willing to purchase their sesame (18.1%), to sell to the buyer they first met (12.5%), to creditors (9.4%) and to sell through brokers to any seller they encounter (3.1%). Sesame collectors have indicated the average minutes they spent selling their sesame to buyers. As can be observed from the table below, the average time reported by sesame collectors in Humera is at least three times greater than the average reported in East Wellega. (For details see the mean time for each region in the table below). The great disparity reported by collectors in the
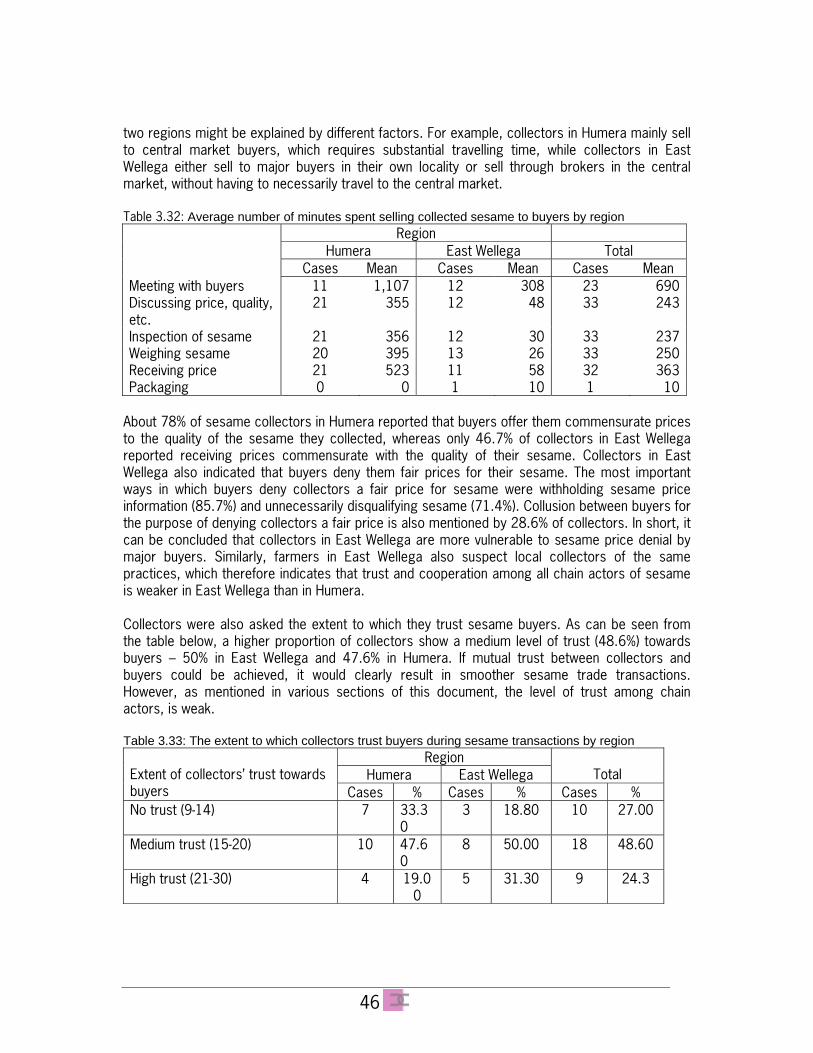
46
two regions might be explained by different factors. For example, collectors in Humera mainly sell to central market buyers, which requires substantial travelling time, while collectors in East Wellega either sell to major buyers in their own locality or sell through brokers in the central market, without having to necessarily travel to the central market. Table 3.32: Average number of minutes spent selling collected sesame to buyers by region Region Humera East Wellega Total Cases Mean Cases Mean Cases Mean Meeting with buyers 11 1,107 12 308 23 690Discussing price, quality, etc.
21 355 12 48 33 243
Inspection of sesame 21 356 12 30 33 237Weighing sesame 20 395 13 26 33 250Receiving price 21 523 11 58 32 363Packaging 0 0 1 10 1 10
About 78% of sesame collectors in Humera reported that buyers offer them commensurate prices to the quality of the sesame they collected, whereas only 46.7% of collectors in East Wellega reported receiving prices commensurate with the quality of their sesame. Collectors in East Wellega also indicated that buyers deny them fair prices for their sesame. The most important ways in which buyers deny collectors a fair price for sesame were withholding sesame price information (85.7%) and unnecessarily disqualifying sesame (71.4%). Collusion between buyers for the purpose of denying collectors a fair price is also mentioned by 28.6% of collectors. In short, it can be concluded that collectors in East Wellega are more vulnerable to sesame price denial by major buyers. Similarly, farmers in East Wellega also suspect local collectors of the same practices, which therefore indicates that trust and cooperation among all chain actors of sesame is weaker in East Wellega than in Humera. Collectors were also asked the extent to which they trust sesame buyers. As can be seen from the table below, a higher proportion of collectors show a medium level of trust (48.6%) towards buyers – 50% in East Wellega and 47.6% in Humera. If mutual trust between collectors and buyers could be achieved, it would clearly result in smoother sesame trade transactions. However, as mentioned in various sections of this document, the level of trust among chain actors, is weak. Table 3.33: The extent to which collectors trust buyers during sesame transactions by region
Region Humera East Wellega
Total
Extent of collectors’ trust towards buyers Cases % Cases % Cases % No trust (9-14) 7 33.3
0 3 18.80 10 27.00
Medium trust (15-20) 10 47.60
8 50.00 18 48.60
High trust (21-30) 4 19.00
5 31.30 9 24.3
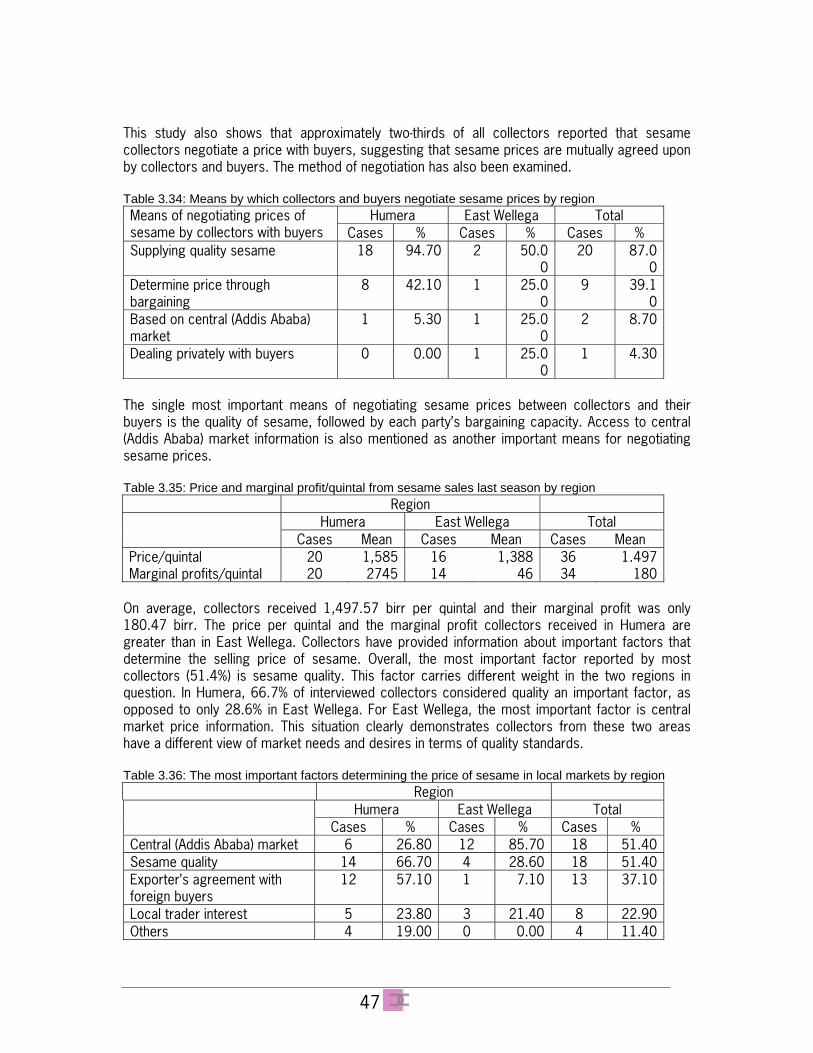
47
This study also shows that approximately two-thirds of all collectors reported that sesame collectors negotiate a price with buyers, suggesting that sesame prices are mutually agreed upon by collectors and buyers. The method of negotiation has also been examined. Table 3.34: Means by which collectors and buyers negotiate sesame prices by region
Humera East Wellega Total Means of negotiating prices of sesame by collectors with buyers Cases % Cases % Cases % Supplying quality sesame 18 94.70 2 50.0
020 87.0
0Determine price through bargaining
8 42.10 1 25.00
9 39.10
Based on central (Addis Ababa) market
1 5.30 1 25.00
2 8.70
Dealing privately with buyers 0 0.00 1 25.00
1 4.30
The single most important means of negotiating sesame prices between collectors and their buyers is the quality of sesame, followed by each party’s bargaining capacity. Access to central (Addis Ababa) market information is also mentioned as another important means for negotiating sesame prices. Table 3.35: Price and marginal profit/quintal from sesame sales last season by region Region
Humera East Wellega Total Cases Mean Cases Mean Cases Mean
Price/quintal 20 1,585 16 1,388 36 1.497Marginal profits/quintal 20 2745 14 46 34 180
On average, collectors received 1,497.57 birr per quintal and their marginal profit was only 180.47 birr. The price per quintal and the marginal profit collectors received in Humera are greater than in East Wellega. Collectors have provided information about important factors that determine the selling price of sesame. Overall, the most important factor reported by most collectors (51.4%) is sesame quality. This factor carries different weight in the two regions in question. In Humera, 66.7% of interviewed collectors considered quality an important factor, as opposed to only 28.6% in East Wellega. For East Wellega, the most important factor is central market price information. This situation clearly demonstrates collectors from these two areas have a different view of market needs and desires in terms of quality standards. Table 3.36: The most important factors determining the price of sesame in local markets by region Region
Humera East Wellega Total Cases % Cases % Cases %
Central (Addis Ababa) market 6 26.80 12 85.70 18 51.40Sesame quality 14 66.70 4 28.60 18 51.40Exporter’s agreement with foreign buyers
12 57.10 1 7.10 13 37.10
Local trader interest 5 23.80 3 21.40 8 22.90Others 4 19.00 0 0.00 4 11.40
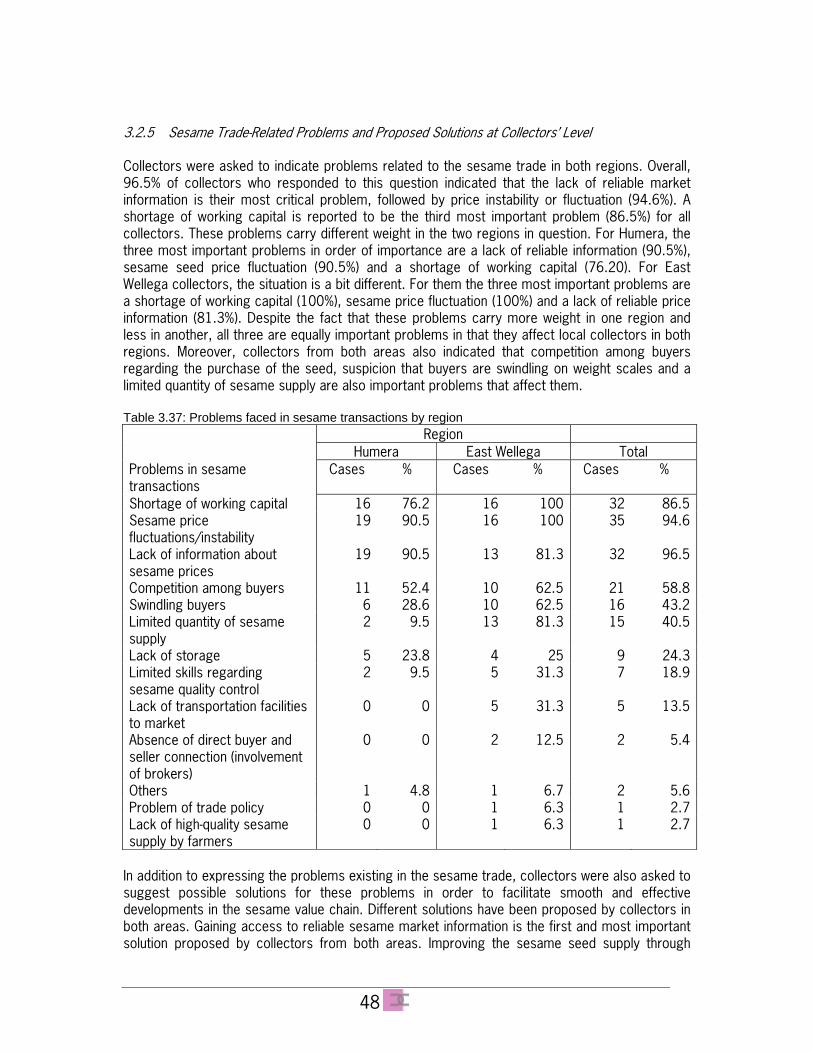
48
3.2.5 Sesame Trade-Related Problems and Proposed Solutions at Collectors’ Level Collectors were asked to indicate problems related to the sesame trade in both regions. Overall, 96.5% of collectors who responded to this question indicated that the lack of reliable market information is their most critical problem, followed by price instability or fluctuation (94.6%). A shortage of working capital is reported to be the third most important problem (86.5%) for all collectors. These problems carry different weight in the two regions in question. For Humera, the three most important problems in order of importance are a lack of reliable information (90.5%), sesame seed price fluctuation (90.5%) and a shortage of working capital (76.20). For East Wellega collectors, the situation is a bit different. For them the three most important problems are a shortage of working capital (100%), sesame price fluctuation (100%) and a lack of reliable price information (81.3%). Despite the fact that these problems carry more weight in one region and less in another, all three are equally important problems in that they affect local collectors in both regions. Moreover, collectors from both areas also indicated that competition among buyers regarding the purchase of the seed, suspicion that buyers are swindling on weight scales and a limited quantity of sesame supply are also important problems that affect them. Table 3.37: Problems faced in sesame transactions by region Region Humera East Wellega Total Problems in sesame transactions
Cases % Cases % Cases %
Shortage of working capital 16 76.2 16 100 32 86.5Sesame price fluctuations/instability
19 90.5 16 100 35 94.6
Lack of information about sesame prices
19 90.5 13 81.3 32 96.5
Competition among buyers 11 52.4 10 62.5 21 58.8Swindling buyers 6 28.6 10 62.5 16 43.2Limited quantity of sesame supply
2 9.5 13 81.3 15 40.5
Lack of storage 5 23.8 4 25 9 24.3Limited skills regarding sesame quality control
2 9.5 5 31.3 7 18.9
Lack of transportation facilities to market
0 0 5 31.3 5 13.5
Absence of direct buyer and seller connection (involvement of brokers)
0 0 2 12.5 2 5.4
Others 1 4.8 1 6.7 2 5.6Problem of trade policy 0 0 1 6.3 1 2.7Lack of high-quality sesame supply by farmers
0 0 1 6.3 1 2.7
In addition to expressing the problems existing in the sesame trade, collectors were also asked to suggest possible solutions for these problems in order to facilitate smooth and effective developments in the sesame value chain. Different solutions have been proposed by collectors in both areas. Gaining access to reliable sesame market information is the first and most important solution proposed by collectors from both areas. Improving the sesame seed supply through
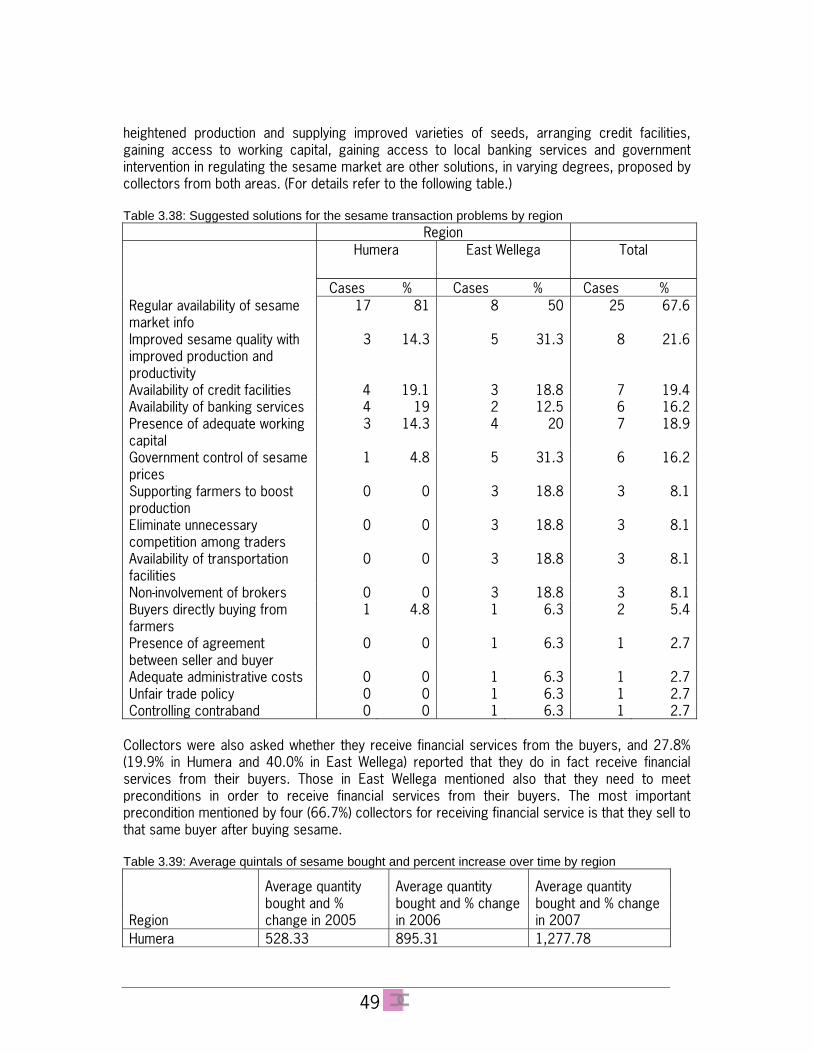
49
heightened production and supplying improved varieties of seeds, arranging credit facilities, gaining access to working capital, gaining access to local banking services and government intervention in regulating the sesame market are other solutions, in varying degrees, proposed by collectors from both areas. (For details refer to the following table.) Table 3.38: Suggested solutions for the sesame transaction problems by region Region
Humera East Wellega Total
Cases % Cases % Cases % Regular availability of sesame market info
17 81 8 50 25 67.6
Improved sesame quality with improved production and productivity
3 14.3 5 31.3 8 21.6
Availability of credit facilities 4 19.1 3 18.8 7 19.4Availability of banking services 4 19 2 12.5 6 16.2Presence of adequate working capital
3 14.3 4 20 7 18.9
Government control of sesame prices
1 4.8 5 31.3 6 16.2
Supporting farmers to boost production
0 0 3 18.8 3 8.1
Eliminate unnecessary competition among traders
0 0 3 18.8 3 8.1
Availability of transportation facilities
0 0 3 18.8 3 8.1
Non-involvement of brokers 0 0 3 18.8 3 8.1Buyers directly buying from farmers
1 4.8 1 6.3 2 5.4
Presence of agreement between seller and buyer
0 0 1 6.3 1 2.7
Adequate administrative costs 0 0 1 6.3 1 2.7Unfair trade policy 0 0 1 6.3 1 2.7Controlling contraband 0 0 1 6.3 1 2.7
Collectors were also asked whether they receive financial services from the buyers, and 27.8% (19.9% in Humera and 40.0% in East Wellega) reported that they do in fact receive financial services from their buyers. Those in East Wellega mentioned also that they need to meet preconditions in order to receive financial services from their buyers. The most important precondition mentioned by four (66.7%) collectors for receiving financial service is that they sell to that same buyer after buying sesame. Table 3.39: Average quintals of sesame bought and percent increase over time by region
Region
Average quantity bought and % change in 2005
Average quantity bought and % change in 2006
Average quantity bought and % change in 2007
Humera 528.33 895.31 1,277.78
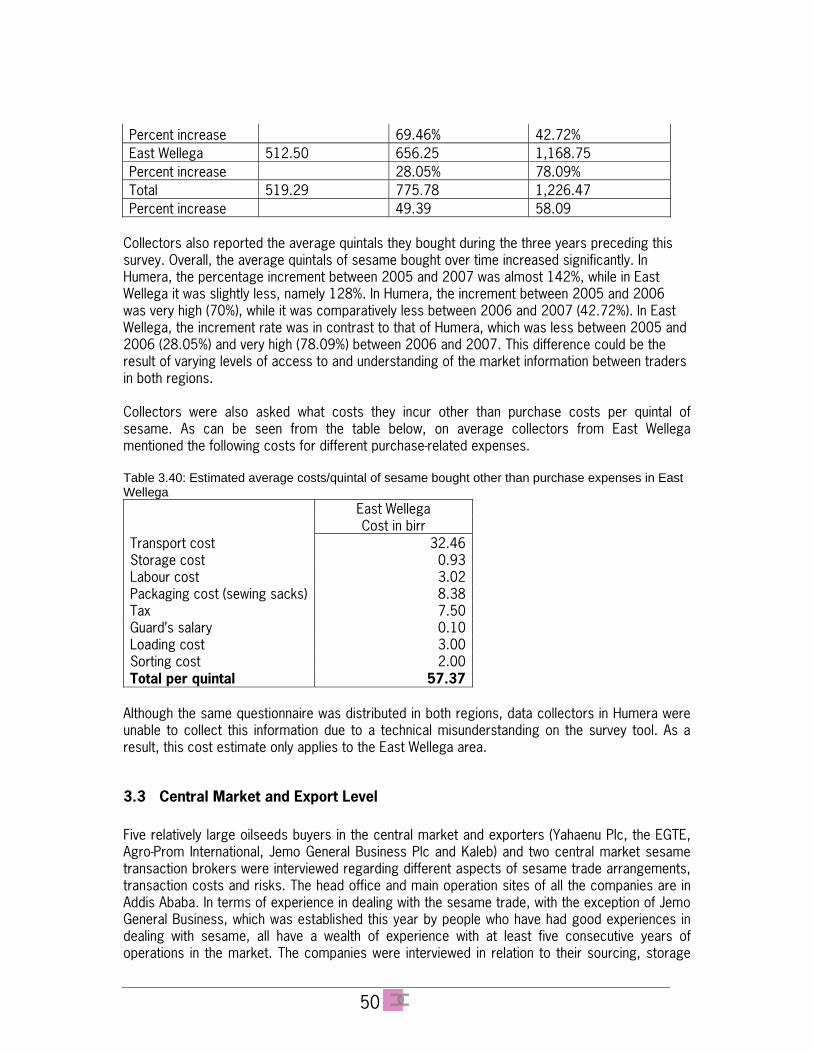
50
Percent increase 69.46% 42.72% East Wellega 512.50 656.25 1,168.75 Percent increase 28.05% 78.09% Total 519.29 775.78 1,226.47 Percent increase 49.39 58.09
Collectors also reported the average quintals they bought during the three years preceding this survey. Overall, the average quintals of sesame bought over time increased significantly. In Humera, the percentage increment between 2005 and 2007 was almost 142%, while in East Wellega it was slightly less, namely 128%. In Humera, the increment between 2005 and 2006 was very high (70%), while it was comparatively less between 2006 and 2007 (42.72%). In East Wellega, the increment rate was in contrast to that of Humera, which was less between 2005 and 2006 (28.05%) and very high (78.09%) between 2006 and 2007. This difference could be the result of varying levels of access to and understanding of the market information between traders in both regions. Collectors were also asked what costs they incur other than purchase costs per quintal of sesame. As can be seen from the table below, on average collectors from East Wellega mentioned the following costs for different purchase-related expenses. Table 3.40: Estimated average costs/quintal of sesame bought other than purchase expenses in East Wellega
East Wellega Cost in birr
Transport cost 32.46Storage cost 0.93Labour cost 3.02Packaging cost (sewing sacks) 8.38Tax 7.50Guard’s salary 0.10Loading cost 3.00Sorting cost 2.00Total per quintal 57.37
Although the same questionnaire was distributed in both regions, data collectors in Humera were unable to collect this information due to a technical misunderstanding on the survey tool. As a result, this cost estimate only applies to the East Wellega area.
3.3 Central Market and Export Level Five relatively large oilseeds buyers in the central market and exporters (Yahaenu Plc, the EGTE, Agro-Prom International, Jemo General Business Plc and Kaleb) and two central market sesame transaction brokers were interviewed regarding different aspects of sesame trade arrangements, transaction costs and risks. The head office and main operation sites of all the companies are in Addis Ababa. In terms of experience in dealing with the sesame trade, with the exception of Jemo General Business, which was established this year by people who have had good experiences in dealing with sesame, all have a wealth of experience with at least five consecutive years of operations in the market. The companies were interviewed in relation to their sourcing, storage
51
and value-adding activities, sales and overall issues of chain operation, actors’ mutual relationships and cooperation. To maintain confidentiality of some of the sensitive information that the companies provided to the study team, hereafter the names of the companies and brokers will at times be represented by letters. Detailed interview results are presented below. 3.3.1 Sourcing and Quality Control The companies mainly source their supply from Humera, Gonder (Metema), Wellega and Benishangul-Gumuz. The main suppliers or clients of the companies are private traders, commercial farms and producers’ cooperatives, in that order of importance. In fact, among the five companies, only the EGTE indicated that they buy from cooperatives. Others, on the other hand, considered cooperatives to be inefficient organizations and therefore do not want to deal with them. In relation to this, they were also asked whether they have permanent suppliers or not. In response to this question, all except Kaleb unanimously answered that they do not have suppliers with whom they have a business relationship on a contract basis, but they use some regular suppliers with whom they have established good relations and built up trust in the process doing business with them. Moreover, they buy from whomever they meet in the market, as long as their sesame seeds meet the required quality standard and agreement is reached about the price. In fact, what should be noted here is that purchase and sales activities in both local and central markets are processed through brokers. Suppliers, whether they are producers or traders, deliver their seed to a broker in the market, with which they have a business relationship and mutual trust. The broker deals with the buyers and transfers sesame to the one that offers a more attractive price. Accordingly, the brokers serve both the buyers and sellers by bringing them into contact and making the deal on behalf of one another, so that the owners of sesame and the buyers do not necessarily have to meet. Buyers check the quality of the sesame before they commit to a purchase. The most commonly checked quality indicators at purchase points are colour, type of sesame by area of origin and moisture content. Therefore, they buy from any supplier or broker whose sesame seed meets these quality conditions. This type of purchase is the most common way of purchasing for most of the companies. Kaleb has some experience – since 2006 - with contract farming with Humera farmers. Unlike most companies, it deals with organic sesame and to maintain this identity it has decided to work directly with producers through their organizations. It has worked with some six hundred producers organized in a cooperative, who supply up to 6,000 quintals per year. From 2008 onwards, the company has attempted to increase the number of its suppliers to 1,500 farmers, with the aim of sourcing up to 20,000 quintals of organic sesame per year. According to the contract, the company has agreed to pre-finance the farmers, based on pricing arrangements it has to reach with the farmers for their products. Normally, it agrees to pay a premium price on top of the market price to the farmers due to the organic nature of their product. In the process, the company has had to face the challenge of farmers’ unwillingness to accept predetermined prices. As a result, in 2007 it entered into an agreement with farmers without fixing the price at the time of agreement. However, it was bound to an agreement about prefixed prices with its buyers. Therefore, when it came time to collect from the farmers, the local price of sesame had increased exorbitantly, but it was no longer possible for the company to enforce a
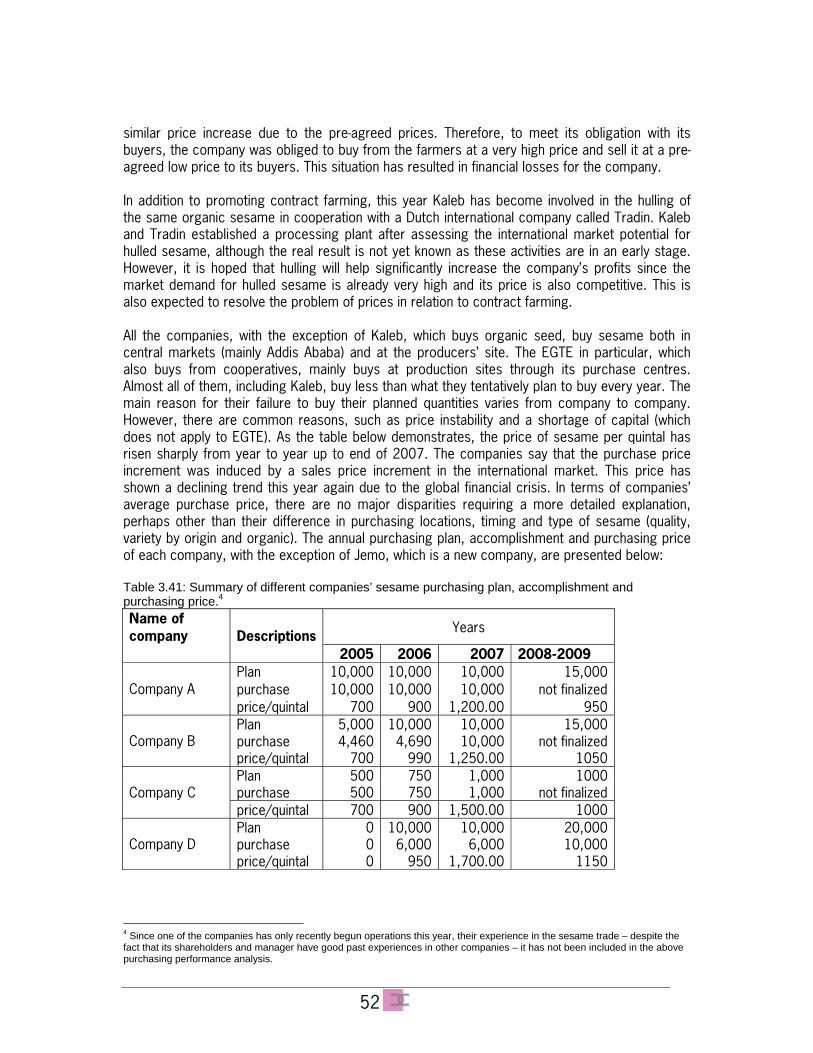
52
similar price increase due to the pre-agreed prices. Therefore, to meet its obligation with its buyers, the company was obliged to buy from the farmers at a very high price and sell it at a pre-agreed low price to its buyers. This situation has resulted in financial losses for the company. In addition to promoting contract farming, this year Kaleb has become involved in the hulling of the same organic sesame in cooperation with a Dutch international company called Tradin. Kaleb and Tradin established a processing plant after assessing the international market potential for hulled sesame, although the real result is not yet known as these activities are in an early stage. However, it is hoped that hulling will help significantly increase the company’s profits since the market demand for hulled sesame is already very high and its price is also competitive. This is also expected to resolve the problem of prices in relation to contract farming. All the companies, with the exception of Kaleb, which buys organic seed, buy sesame both in central markets (mainly Addis Ababa) and at the producers’ site. The EGTE in particular, which also buys from cooperatives, mainly buys at production sites through its purchase centres. Almost all of them, including Kaleb, buy less than what they tentatively plan to buy every year. The main reason for their failure to buy their planned quantities varies from company to company. However, there are common reasons, such as price instability and a shortage of capital (which does not apply to EGTE). As the table below demonstrates, the price of sesame per quintal has risen sharply from year to year up to end of 2007. The companies say that the purchase price increment was induced by a sales price increment in the international market. This price has shown a declining trend this year again due to the global financial crisis. In terms of companies’ average purchase price, there are no major disparities requiring a more detailed explanation, perhaps other than their difference in purchasing locations, timing and type of sesame (quality, variety by origin and organic). The annual purchasing plan, accomplishment and purchasing price of each company, with the exception of Jemo, which is a new company, are presented below: Table 3.41: Summary of different companies’ sesame purchasing plan, accomplishment and purchasing price.4 Name of company Descriptions
Years
2005 2006 2007 2008-2009 Plan 10,000 10,000 10,000 15,000 purchase 10,000 10,000 10,000 not finalized Company A price/quintal 700 900 1,200.00 950 Plan 5,000 10,000 10,000 15,000 purchase 4,460 4,690 10,000 not finalized Company B price/quintal 700 990 1,250.00 1050 Plan 500 750 1,000 1000 purchase 500 750 1,000 not finalized Company C price/quintal 700 900 1,500.00 1000 Plan 0 10,000 10,000 20,000 purchase 0 6,000 6,000 10,000 Company D price/quintal 0 950 1,700.00 1150
4 Since one of the companies has only recently begun operations this year, their experience in the sesame trade – despite the fact that its shareholders and manager have good past experiences in other companies – it has not been included in the above purchasing performance analysis.
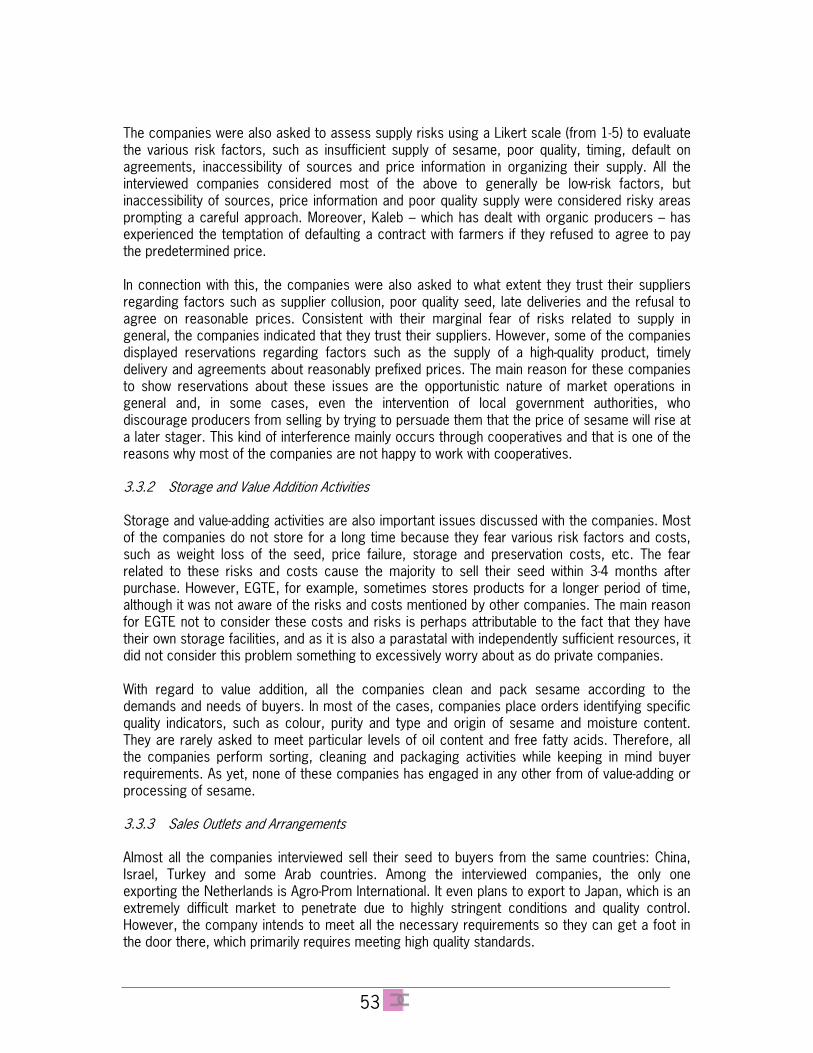
53
The companies were also asked to assess supply risks using a Likert scale (from 1-5) to evaluate the various risk factors, such as insufficient supply of sesame, poor quality, timing, default on agreements, inaccessibility of sources and price information in organizing their supply. All the interviewed companies considered most of the above to generally be low-risk factors, but inaccessibility of sources, price information and poor quality supply were considered risky areas prompting a careful approach. Moreover, Kaleb – which has dealt with organic producers – has experienced the temptation of defaulting a contract with farmers if they refused to agree to pay the predetermined price. In connection with this, the companies were also asked to what extent they trust their suppliers regarding factors such as supplier collusion, poor quality seed, late deliveries and the refusal to agree on reasonable prices. Consistent with their marginal fear of risks related to supply in general, the companies indicated that they trust their suppliers. However, some of the companies displayed reservations regarding factors such as the supply of a high-quality product, timely delivery and agreements about reasonably prefixed prices. The main reason for these companies to show reservations about these issues are the opportunistic nature of market operations in general and, in some cases, even the intervention of local government authorities, who discourage producers from selling by trying to persuade them that the price of sesame will rise at a later stager. This kind of interference mainly occurs through cooperatives and that is one of the reasons why most of the companies are not happy to work with cooperatives. 3.3.2 Storage and Value Addition Activities Storage and value-adding activities are also important issues discussed with the companies. Most of the companies do not store for a long time because they fear various risk factors and costs, such as weight loss of the seed, price failure, storage and preservation costs, etc. The fear related to these risks and costs cause the majority to sell their seed within 3-4 months after purchase. However, EGTE, for example, sometimes stores products for a longer period of time, although it was not aware of the risks and costs mentioned by other companies. The main reason for EGTE not to consider these costs and risks is perhaps attributable to the fact that they have their own storage facilities, and as it is also a parastatal with independently sufficient resources, it did not consider this problem something to excessively worry about as do private companies. With regard to value addition, all the companies clean and pack sesame according to the demands and needs of buyers. In most of the cases, companies place orders identifying specific quality indicators, such as colour, purity and type and origin of sesame and moisture content. They are rarely asked to meet particular levels of oil content and free fatty acids. Therefore, all the companies perform sorting, cleaning and packaging activities while keeping in mind buyer requirements. As yet, none of these companies has engaged in any other from of value-adding or processing of sesame. 3.3.3 Sales Outlets and Arrangements Almost all the companies interviewed sell their seed to buyers from the same countries: China, Israel, Turkey and some Arab countries. Among the interviewed companies, the only one exporting the Netherlands is Agro-Prom International. It even plans to export to Japan, which is an extremely difficult market to penetrate due to highly stringent conditions and quality control. However, the company intends to meet all the necessary requirements so they can get a foot in the door there, which primarily requires meeting high quality standards.
54
Each of the companies has 5 to 15 buyers from these importer countries. Their relationship with these buyers is based on a clientele bond, and mostly they sell to the same buyers from year to year. During the interview, the companies were asked to indicate to what extent they feel that buyer expectations are met in relation to specific factors, such as quality, quantity, timing, and honesty and transparency in their supply. All the companies replied that in general their buyers are well satisfied with them. The only limited reservation they have is regards supply quality, which they feel sometimes fails to meet buyers’ expectations. The companies feel that a failure to meet quality requirements is bound to encounter limited capacity, especially with standard cleaning machines and laboratories used for the detection of sesame that is potentially contaminated by chemicals. They also found it difficult to identify the level of oil contents of the seed. With regard to sales volume, all companies reported that they sell everything they buy in the same year unless they face special market problems, with the exception of EGTE. They have also indicated their sales price and profit margin in comparison to their purchase price, without taking into account cleaning, sorting, packaging and other transaction costs. (For details about sales, purchasing and gross margin calculations, see the following table). In addition, the companies were also asked, in the context of a variety of factors, whether they fear risks in their sales process. The factors included ‘quantity demands too high to meet’, ‘quality criteria too difficult to meet’, ‘inconvenient timing of supply’, ‘default in agreement’, ‘unreliable price information’ and ‘theft of seed in the store and on the way to the port or in the port it self’. Among these factors, the fear of sesame theft on the way to Djibouti port tops the list of greatest risk factor. Following this, unreliable price information and default in agreement are also mentioned as second and third factors carrying a risk for the companies. Table 3.42: Sales, purchase and margin calculation of the companies Name of company Descriptions
Years
2005 2006 2007Sales (birr) 1,000.00 1,100.00 1,500.00Purchase (Qty) 700 900 1,200.00Company (A) Margin (birr)/quintal 300 200 300Sales (birr) 1,000.00 1,340.00 1,500.00Purchase (Qty) 700 990 1,250.00Company (B) Margin (birr)/quintal 300 350 250Sales (birr) 1,000.00 1,200.00 2,000.00Purchase (Qty) 700 900 1,500.00Company (C) Margin (birr)/quintal 300 300 500Sales (birr) 1,200.00 1,400.00 1750purchase (Qty) - 6,000 6,000Company (D) Margin (birr)/quintal - 450 50
Moreover, the companies were asked to indicate their level of trust towards their buyers in relation to different factors, such as honesty with weighing scales, providing reliable market
55
information, offering reasonable prices and transparency for the business. In this regard as well, the companies have indicated that in general they enjoy a good level of trust, which is in fact not the highest score for any of the companies. They indicated that they have fewer trust in the market price information they are provided with, followed by reasonability of the price they offered. 3.3.4 Overall Issues of Chain Operation, Actors’ Relationship and Cooperation Regarding this topic, a variety of related issues concerning the chain’s relationship to the companies have been discussed. Accordingly, the first important issue discussed was the companies’ source of information for deciding on the quantity of their purchase and the criteria for determining prices. Each one of the companies unanimously reported that their primary sources are their international buyers. EGTE mentioned that it also receives information from the National Bank of Ethiopia and the agricultural ministries and embassies in the importer countries. Agro-Prom has also indicated that it sometimes gathers information from websites. The brokers also indicated that the supply volume from the origin of sesame depends on the level of demand on the part of international buyers. In other words, this means that when exporters increase their requests for supply, it means there is high demand in the international market for sesame and, accordingly, the price of sesame is expected to be higher. Companies were also asked to comment on the efficiency of the infrastructure and transport facilities, the access to financial and non-financial services and the legal environment for sesame trade arrangements. Most of the companies consider the roads and vehicles for the transportation of sesame to be unsatisfactory. However, all agree that the introduction of a mobile telephone service has revolutionized the whole process and contributed a great deal to the efficiency of this business. With regard to access to financial services, with the exception of EGTE, all have complained about the difficulty of securing loans on time and in sufficient quantities. Moreover, they complained about bureaucratic red tape at the National Bank and Customs Authorities, which, in turn, harms the efficiency of the business. All of the companies considered the legal environment to be adequate. However, some said that if the organs of the government fail to properly observe the rule of law, then what is written on paper has become a “paper tiger”. Furthermore, some of them suggested that because market liberalization is one of the pillars of the government’s economic development policy, its local development agents and political administrators intervene in the sesame trade process, especially by means of cooperatives. All the companies also indicated that they are members of the Ethiopian Pulses and Oil Seeds Processing and Export Association (EPOSPEA). The companies were unable to identify any significant role played by the association with regard to negotiating with the government to improve some of the bottlenecks and providing its members with necessary services. Therefore, they all hope it will gradually gain strength and assume a more significant role. Moreover, they were asked whether it would be possible for them to institutionalize their cooperation with other chain actors in their upper and lower streams in order to improve chain efficiency and competitiveness. For a majority of these companies,, this kind of arrangement is new, and they do not have sufficient experience to anticipate whether or not it will be feasible. But some of them felt that chain cooperatives are essentially an excellent idea. Nonetheless, they feel it will be very difficult. Their main argument is that the people in the business, including the traders themselves, do not have a culture of transparency and working in cooperation. On top of that, the
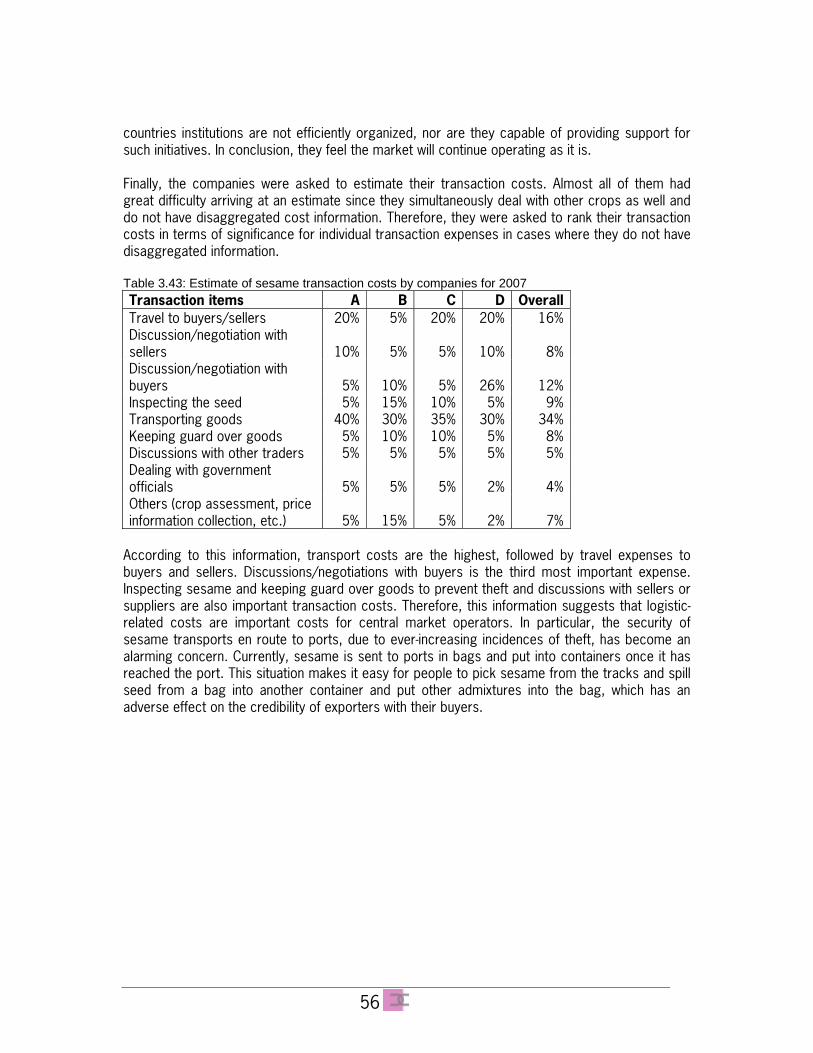
56
countries institutions are not efficiently organized, nor are they capable of providing support for such initiatives. In conclusion, they feel the market will continue operating as it is. Finally, the companies were asked to estimate their transaction costs. Almost all of them had great difficulty arriving at an estimate since they simultaneously deal with other crops as well and do not have disaggregated cost information. Therefore, they were asked to rank their transaction costs in terms of significance for individual transaction expenses in cases where they do not have disaggregated information. Table 3.43: Estimate of sesame transaction costs by companies for 2007 Transaction items A B C D OverallTravel to buyers/sellers 20% 5% 20% 20% 16%Discussion/negotiation with sellers 10% 5% 5% 10% 8%Discussion/negotiation with buyers 5% 10% 5% 26% 12%Inspecting the seed 5% 15% 10% 5% 9%Transporting goods 40% 30% 35% 30% 34%Keeping guard over goods 5% 10% 10% 5% 8%Discussions with other traders 5% 5% 5% 5% 5%Dealing with government officials 5% 5% 5% 2% 4%Others (crop assessment, price information collection, etc.) 5% 15% 5% 2% 7%
According to this information, transport costs are the highest, followed by travel expenses to buyers and sellers. Discussions/negotiations with buyers is the third most important expense. Inspecting sesame and keeping guard over goods to prevent theft and discussions with sellers or suppliers are also important transaction costs. Therefore, this information suggests that logistic-related costs are important costs for central market operators. In particular, the security of sesame transports en route to ports, due to ever-increasing incidences of theft, has become an alarming concern. Currently, sesame is sent to ports in bags and put into containers once it has reached the port. This situation makes it easy for people to pick sesame from the tracks and spill seed from a bag into another container and put other admixtures into the bag, which has an adverse effect on the credibility of exporters with their buyers.
57
4 Conclusions and recommendations In this era of globalization, the need to meet basic quality standards and minimum requirements in order to enter international markets, on the one hand, and become competitive, on the other hand, are compelling arguments in favour of sustainable businesses. As consumers become more and more conscious of health concerns, and suppliers from different sources also become more and more cost efficient, competitiveness is difficult to guarantee unless there are concerted efforts on the part of different actors to minimize transaction costs and risks, and simultaneously meet quality standards. In light of this, the Ethiopian oilseeds value chain is full of challenges, and yet it has inspiring opportunities to look forward to as well. Despite the immense potential for improving the production and productivity of the sector, and an insatiable demand for its products, the chain seems to be performing poorly nonetheless. Primary producers, especially smallholders, lack the necessary technical and material input to improve their production and productivity; trade arrangements are not well organized, nor are they regularly employed by chain actors; the necessary government policies and institutions, and the enforcement of regulations are either non-existent or functioning too ineffectively to ensure a smoothly operating chain. The Ethiopian-Dutch Public-Private Partnership project was initiated between the governments of these two countries and private chain actors of the sector with a clear understanding of the situation and a committed intention of improving it. In line with this aim, the public-private partnership committee has launched various projects and has commissioned this consultancy service (together with the DGIS funded project “Transaction risks and costs in the sesame value chain”) to establish a baseline about sesame trade arrangements that reduce transaction risks and costs. The main objectives of the baseline study were to analyze the role of key chain actors, assess existing trade arrangements, identify main bottlenecks in the chain and propose key recommendations for improvement. Two areas (Humera and East Wellega) were selected for this study among the main sesame producers of the country, based on their contribution to sesame production in general and on the number of smallholder farmers they involve in particular. The target interviewees were also identified by means of a sampling system among a number of sesame producers in the area. After the necessary data was collected with a standard interview questionnaire, it was analyzed using a renowned tool for this kind of survey data analysis called SPSS (Statistical Package for Social Science Studies). The study results differed considerably and were wide-ranging. However, the main conclusions that one may draw from the range of results can be summarized as follows:
4.1 Production Sesame production is gradually expanding to different parts of the country, and yet the dominant regions remain East Wellega, Humera and North Goner. Among the newly starting areas are Benishangul-Gumuz, the Illubabor zone of Oromiya and West Wellega. In terms of agroecology, the sesame seed grows in hot areas and areas with relatively brief spells of rainfall. For the first two
58
to three years, newly cultivated land gives excellent yield (up to 10 quintals per hectare in most cases) but then gradually decreases in productivity as crops are repetitively sown on the same field. In Humera, where for the time being there is sufficient land to expand to new fields and allow old ones to lie fallow for a given period of time so they can rejuvenate, the production and productivity of sesame is relatively good. According to the study, the average productivity is about four quintals/hectare. In East Wellega, the situation is quite different. The land in East Wellega has been over-utilized, and there is no new land to expand to. Moreover, although it was beyond the investigation of this study, either the soil is too unsuitable to properly grow sesame or there is some disease damaging the sesame during the germination and/or vegetative stages in this area. As a result, the productivity of sesame in the East Wellega area is nearly half of that of Humera (approximately two quintals/hectare). Indeed, compared to the national average for 2006-07, which is about seven quintal/hectare, productivity in both regions is significantly less. Furthermore, if compared to the estimated potential by FAO, which is about 16 quintals/hectare, providing there are improved farming techniques and more efficient management, the productivity of both regions, not to mention the national average, are extremely dismal. Significant differences exits between the farmers of both regions regarding production techniques and business orientation. In terms of technology, producers in Humera are in an advanced situation. Over 92% of the interviewed farmers reported that they cultivate their land using tractors that they either own or rent, and on average they are therefore able to cultivate about five hectares per producer. The great majority of them also indicated that they are aware of market demands and requirements in terms of quality supply, and their fear of crop failure is also limited. Moreover, there is little opportunity for them to replace sesame with other remunerative crops since Humera’s agroecology is not suitable for other crops, other than sorghum. As a result,, sesame remains the main crop for producers in Humera for their whole livelihood, including food since they sell sesame and buy their food crops as well. The situation is quite different in East Wellega. To begin with, over 92% of the farmers there depend on oxen for cultivation. The rest depend on hoe agriculture. The lack of technology in this region therefore puts them in a weak position to cultivate larger areas of land. Their fear of crop failure is also very high as they frequently face problems during the germination and vegetative stages, which significantly reduces productivity. Besides, unlike farmland in Humera, the agroecology of East Wellega is better suited for replacing sesame with other crops, such as maize and sorghum, which have better productivity and fetch attractive market prices to boot. In relation to the production and harvest of sesame, a number of problems were identified by producers from both areas. These problems include a lack of improved seed, high input prices, a lack of reliable market information in general and of market prices in particular, pest infestation at the vegetative stage, a shortage of land preparation equipment and labour during the picking, weeding and harvesting time of sesame, inadequate/excessive rainfall during the vegetative stage, unexpected rainfall during harvest and the theft of sesame in the fields. The degree of these problems varies between the two areas. For Humera, the most important problems are inadequate rainfall, inadequate market information to plan their production and determine their sales, high input prices, unexpected rainfall during harvest and the theft of sesame in the fields. In contrast to Humera, the most important problems in East Wellega are a lack of improved seed, a shortage of input supply and high input prices, pest infestation and the theft of sesame in the
59
fields. These problems are categorically related to the inadequacy of research output, the malfunctioning of the market and security problems.
4.2 Market Arrangements In both regions, sesame is mainly traded in the open market and at the central market. Both buyers and suppliers simply meet in the market without having any prior arrangement. With the exception of a few cases, both sellers and buyers do not know each other and do not repeated contact. Because of this and other reasons, actors do not trust each other. Producers in particular do not think that their buyers offer them prices commensurate with the quality of their produce. Although this problem is prevalent in both regions, it is more severe in East Wellega. Farmers suspect buyers of withholding price information, unnecessarily disqualifying their sesame, swindling on weight scales and colluding against them. Similarly, local collectors who bulk up sesame from producers identify different problems related to the sesame market. Although the degree varies between the two regions, commonly sited problems include price instability, poor quality and an inadequate quantity of supply and a shortage of working capital. In addition, central market buyers who ultimately export sesame complain that they are suffering from the poor quality of seed, the theft of sesame on the way to the port, a lack of a reliable information source and bureaucratic red tape with banks and customs. The problem of theft in particular is a recurring source of complaint and is a phenomenon that is scaring off all the exporters because of its increasing frequency.
4.3 Chain Relations and Estimated Cost and Value-Sharing among the Chain Actors
Different actors are involved in the entire supply chain, from producers to the export market. In the dominant open-market supply chain, until the product is sufficiently bulked up for delivery to the central market, a number of actors are involved in the collection of the seed, including farmer-traders, petty collectors, middle-sized collectors, etc.. Once it has reached a certain volume for delivery to the central market, brokers are usually contacted to accept the loaded seed from a transporter and sell it to the exporter. As an alternative outlet, some local collectors also sell to EGTE, which is a parastatal exporter. EGTE also buys from cooperatives, which collect sesame from their members. Some producers from the Humera area also deliver their sesame directly to the central market. After the central market, the next step in the ladder is the export market, which receives sesame after it has been cleaned and properly bagged according to the buyers’ standards. A simple relationship depicting the chain map is presented below.
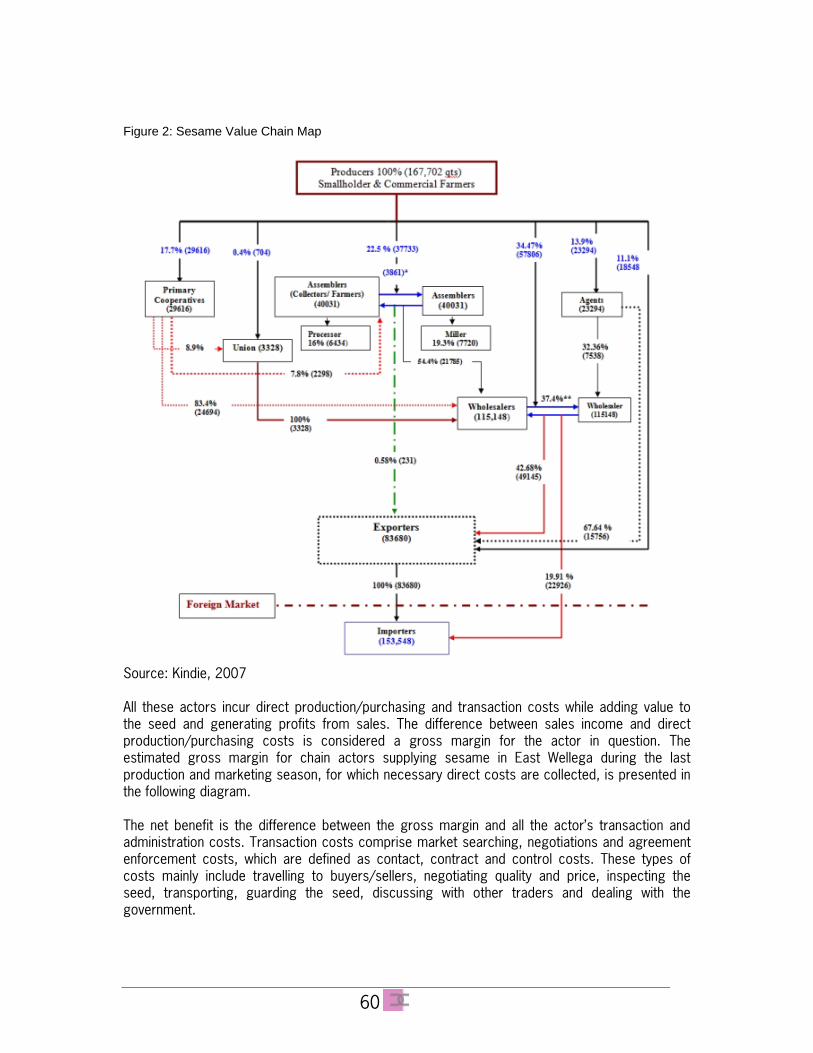
60
Figure 2: Sesame Value Chain Map
Source: Kindie, 2007 All these actors incur direct production/purchasing and transaction costs while adding value to the seed and generating profits from sales. The difference between sales income and direct production/purchasing costs is considered a gross margin for the actor in question. The estimated gross margin for chain actors supplying sesame in East Wellega during the last production and marketing season, for which necessary direct costs are collected, is presented in the following diagram. The net benefit is the difference between the gross margin and all the actor’s transaction and administration costs. Transaction costs comprise market searching, negotiations and agreement enforcement costs, which are defined as contact, contract and control costs. These types of costs mainly include travelling to buyers/sellers, negotiating quality and price, inspecting the seed, transporting, guarding the seed, discussing with other traders and dealing with the government.
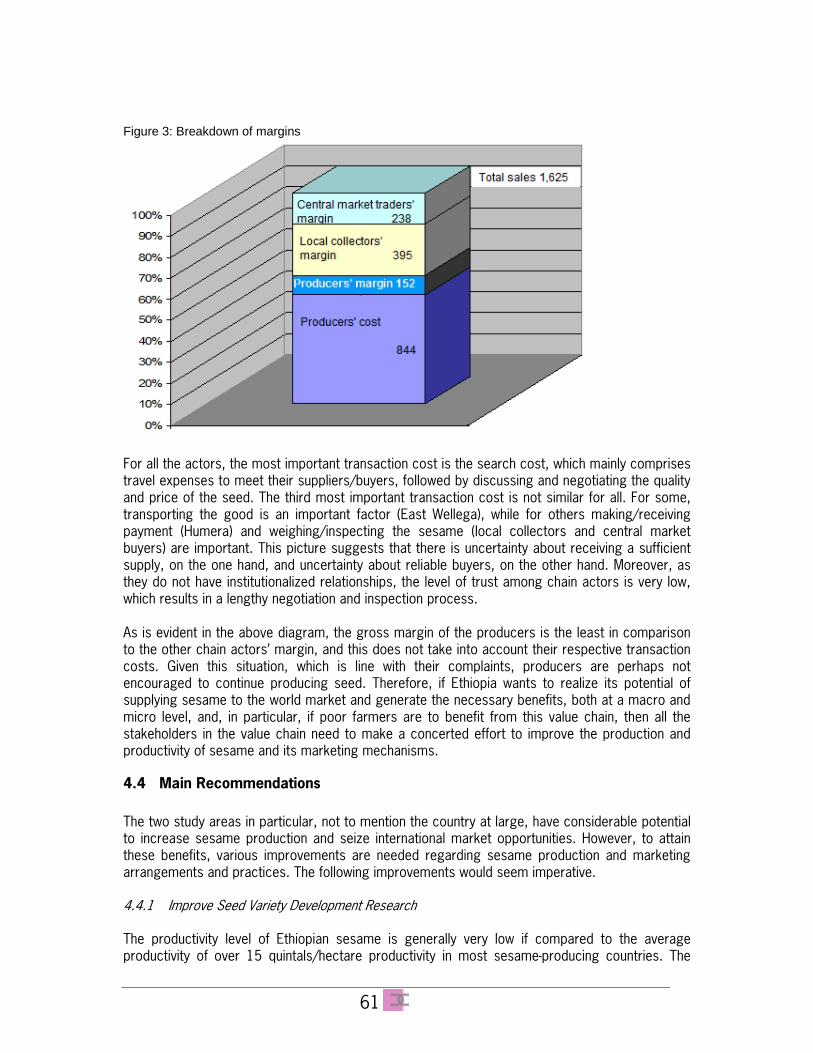
61
Figure 3: Breakdown of margins
For all the actors, the most important transaction cost is the search cost, which mainly comprises travel expenses to meet their suppliers/buyers, followed by discussing and negotiating the quality and price of the seed. The third most important transaction cost is not similar for all. For some, transporting the good is an important factor (East Wellega), while for others making/receiving payment (Humera) and weighing/inspecting the sesame (local collectors and central market buyers) are important. This picture suggests that there is uncertainty about receiving a sufficient supply, on the one hand, and uncertainty about reliable buyers, on the other hand. Moreover, as they do not have institutionalized relationships, the level of trust among chain actors is very low, which results in a lengthy negotiation and inspection process. As is evident in the above diagram, the gross margin of the producers is the least in comparison to the other chain actors’ margin, and this does not take into account their respective transaction costs. Given this situation, which is line with their complaints, producers are perhaps not encouraged to continue producing seed. Therefore, if Ethiopia wants to realize its potential of supplying sesame to the world market and generate the necessary benefits, both at a macro and micro level, and, in particular, if poor farmers are to benefit from this value chain, then all the stakeholders in the value chain need to make a concerted effort to improve the production and productivity of sesame and its marketing mechanisms.
4.4 Main Recommendations The two study areas in particular, not to mention the country at large, have considerable potential to increase sesame production and seize international market opportunities. However, to attain these benefits, various improvements are needed regarding sesame production and marketing arrangements and practices. The following improvements would seem imperative. 4.4.1 Improve Seed Variety Development Research The productivity level of Ethiopian sesame is generally very low if compared to the average productivity of over 15 quintals/hectare productivity in most sesame-producing countries. The
62
level of research and development activity to date for improving the potential of sesame is extremely low. It appears that Ethiopia has different speciality sesame varieties as a result of the country’s different agroecologies and geographical origins, which could be utilized for different purposes. If this were backed by research and necessary developments, the country in general and the poor farmers in particular could benefit from the production and marketing of the sesame seed. As things stand, producers are complaining that, after having made substantial investments and expended tremendous effort, their sesame fails during the germination and vegetative development stages due, perhaps, to diseases or pests. This situation frustrates producers and forces them to replace their sesame fields with other, less risky crops that yield better prices. 4.4.2 Devise a System for Regular Access to Market Information A lack of access to market information is a common problem cited by all chain actors. Coupled with opportunistic behaviour on the part of most of the chain actors and a lack of access to reliable and regular market information, this creates all sorts of confusion in the market. When prices begin to increase, people tend to believe it will continue to increase and consequently continue to speculate, rather than using the opportunity to supply the market. But everything has a limit, and the price of sesame price has a ceiling as well. Once that ceiling has been reached, it will either remain constant or perhaps even abruptly decline. The best example of this situation is the experience of 2007. In the first half of 2007, the export price of sesame climaxed at 2,700.00 ETB, from a low of 1,500.00 ETB in the second half of 2006. Despite these rises in the price of sesame, many exporters speculated on higher returns by storing their sesame. When this happened at the exporters’ level, the same feeling was communicated to cooperatives and other local-level actors as well. As a result, scarcity was created at all levels. Unfortunately, contrary to the expectation of the actors, the reverse occurred in no time and the price of sesame collapsed. This resulted in severe losses for many chain actors. Therefore, the provision of reliable information on a regular basis, not only in local markets but also in international markets, could help chain actors make well-informed decisions. 4.4.3 Facilitate Institutional Arrangement to Achieve Smooth Relations and Governance among Chain
Actors Business relationships between chain actors are characterized by opportunistic behaviour and governed by price. Better prices sell seeds. Therefore, in such situations, the risk of uncertainty caused by human behaviour are very high. Local buyers cannot confidently deal with their forward linkages (international buyers) since they cannot be certain about their supply. Similarly, suppliers (producers) cannot be certain about their sales since they don't know how much, under what conditions and for which price they can sell. Therefore, producers cannot be encouraged to make efforts and commit their resources for the production of the seed. As a result of this lack of coordination and lack of trust among chain actors, competitiveness in the sesame chain is limited, and the level of satisfaction among the ultimate buyers is predictably low, which in turn affects the performance of all the chain actors. 4.4.4 Improve Credit Facilities and Banking Services All the chain actors – from producers at the beginning of the process to the ultimate exporters – complain about a shortage of working capital and a lack of access to proper and efficient financial services.. Actors at the central market level and exporters in particular complain that a shortage of capital and stringent conditions imposed by banks for securing loans have deterred their
63
performance. These actors feel that Ethiopia’s banking system is not conducive for business development. Therefore, they expect the government and the public-private partnership project to study the problem and create an enabling situation so they have easier access to credit and other banking services. 4.4.5 Improve Logistical Services of the Chain Sesame supplies grow in the lowlands, where the infrastructure is not yet well developed and communication is very weak. As a result, producers frequently have no access to reliable information and are therefore targeted by home-to-home travelling brokers and local collectors. Transporting sesame from these lowlands is very expensive and often extremely difficult due to the inaccessibility of the areas. After it is transported to the centre and cleaned and stored in standard bags, sesame is transported to ports over a very long distance, during which it is exposed to theft. As a result of incidences of theft, many exporters have encountered a variety of problems with their buyers in addition to the resource they lost since the quantity will be less than what the buyer expected. For the time being, the problem has been somewhat alleviated thanks to the Federal Police, who patrol the highways. Exporters hope that the establishment of a dry port in Mojo will further minimize the problem as the bags of sesame will be stored in containers at this port. However, other, more effective logistical mechanisms are needed to ensure maximum security of sesame and safeguard its quality. 4.4.6 Encourage Local Value Addition Most of the sesame seed is exported raw to the international market. Some alternative efforts are underway. An Israeli company is striving to locally process sesame into tahini, Kaleb – a local private company – is hulling organic seed with Tradin – an international company – in their joint processing factory. It is hoped that processing sesame locally into different forms will help economic development in the country and increase the competitive power of sesame in the international market. However, since international market information is not easily accessible and the penetration of some markets remains difficult, those who took on a pioneering role have also taken great risks. Therefore, they should be provided with the necessary support and others should also be encouraged to take similar steps. 4.4.7 Facilitate Effective and Efficient Business Development Service Provisions Most of the chain actors joined the chain by chance, since the market functions on the principle of free entry and exit for actors, regardless of whether they possess standard business development and management skills. Because of this, most of them struggling with a variety of problems. Some even lack the information and ability to improve their situation. Therefore, the public-private partnership project is expected to improve the business capacity of such chain actors through business-to-business relations between Ethiopian and Dutch private companies and the creation of local capacities for the provision of market-based business development services for such chain actors. 4.4.8 Create and Enhance the Enabling Environment Without a conducive business environment, no business can be successful. As different sections of this report has mentioned, and as some of the actors in question have explicitly requested, the role of government is expected to be highly significant in regulating the business environment.
64
Business norms and standards should be established and respected. Therefore, the government is expected to put in place all the necessary institutional arrangements to effectively govern the business relations of the chain actors and enforce legal requirements.
65
5 References ADLI (Agricultural Development Lead Industrialization), 2001. Rural Development Policies and
Strategies: Department of press and Audiovisual, Ministry of Information. Addis Ababa, Ethiopia.
Cheminico International Inc. 2002, an Overview of the Nigerian Sesame Industry, Washington DC. Website material.
CSA, July 2007, Agricultural Sample Survey 2006-07, Volume I, Addis Ababa. Daniel Endale, 2008, Investigation of the Genetic Variability among Land Races of Sesame from
Ethiopia, MA Thesis, University of Hohenhein, Stuttgart, Germany. Dorward et al. 2007, Coordination Risk and Cost Impacts on Economic Development in Rural
Areas, Munich Personal RePEc Archive, website material. Eaton et al. 2008, Understanding Institutional Arrangements, Markets, Chains and Sustainable
Development Strategy and Policy Paper, Wageningen University, 2008. FDRE-CSA, 2007. Agricultural sample survey 2006-07, volume I, July 2007FFARM, February
2008, Selected Agricultural Products Chain Analysis in Guduru and Hababo Guduru of Horo-Guduru Wellega Zone, Addis Ababa.
IFPRI, 2003, An Institutional and Legal Analysis of Grain and Coffee Marketing in Ethiopia, Washinton DC.
IAR, 1991, Oilseeds Research and Development in Ethiopia, Proceeding of First National Oilseeds Workshop, Addis Ababa
Kindie, Aysheshum. 2007, Sesame Production and Marketing in Ethiopia, with particular reference to Metema area, MA Paper, Hara Maya University.
Mal Bennet, 1995, Sesame Seed, Website material. Meijerink et al. 2008, Transaction Risks in Market Chains; Strategy and Policy Brief Paper,
Wageningen University. MoARD, 2004; Market-Oriented Development Master Plan, Addis Ababa. MoFED, 2005, A Plan for Accelerated and Sustained Development to End Poverty (2005-06-2009-
10), Addis Ababa. Singer and Even, 2003, Raw Tahini Production in Ethiopia, Business Plan Document, Hayerzira. UN, ____, Comtrade database, Statistics division, website material.