Embed Size (px)
Citation preview
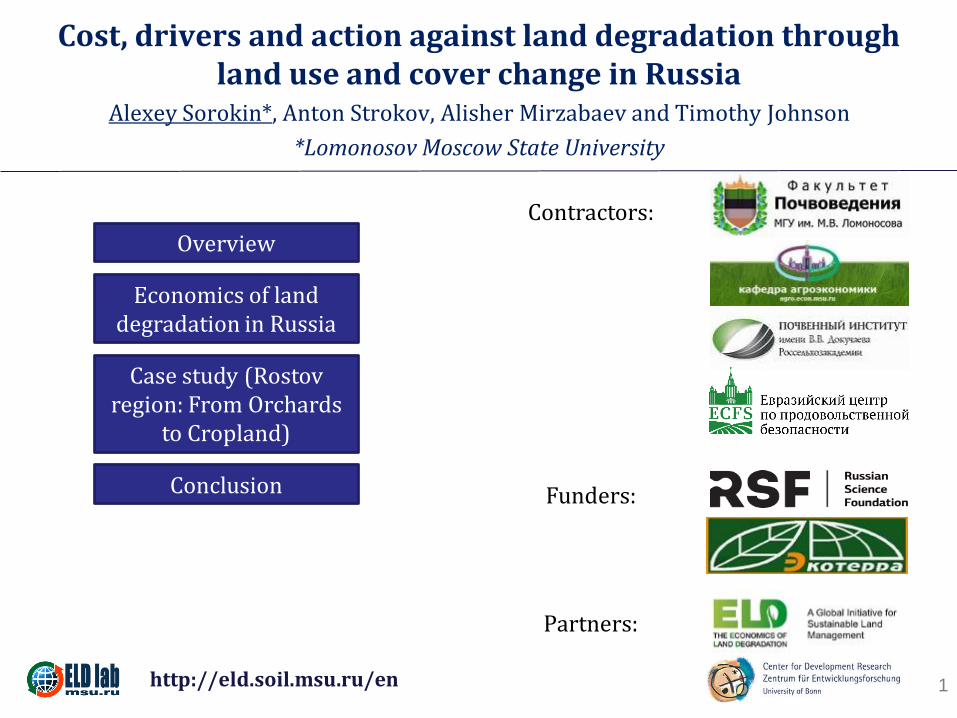
Cost, drivers and action against land degradation through land use and cover change in Russia
Alexey Sorokin*, Anton Strokov, Alisher Mirzabaev and Timothy Johnson
*Lomonosov Moscow State University
1
Overview
Economics of land degradation in Russia
Case study (Rostov region: From Orchards
to Cropland)
Conclusion
Contractors:
Funders:
Partners:
http://eld.soil.msu.ru/en
Cost, drivers and action against land degradation through land use and cover change in Russia
Alexey Sorokin*, Anton Strokov, Alisher Mirzabaev and Timothy Johnson
*Lomonosov Moscow State University
2
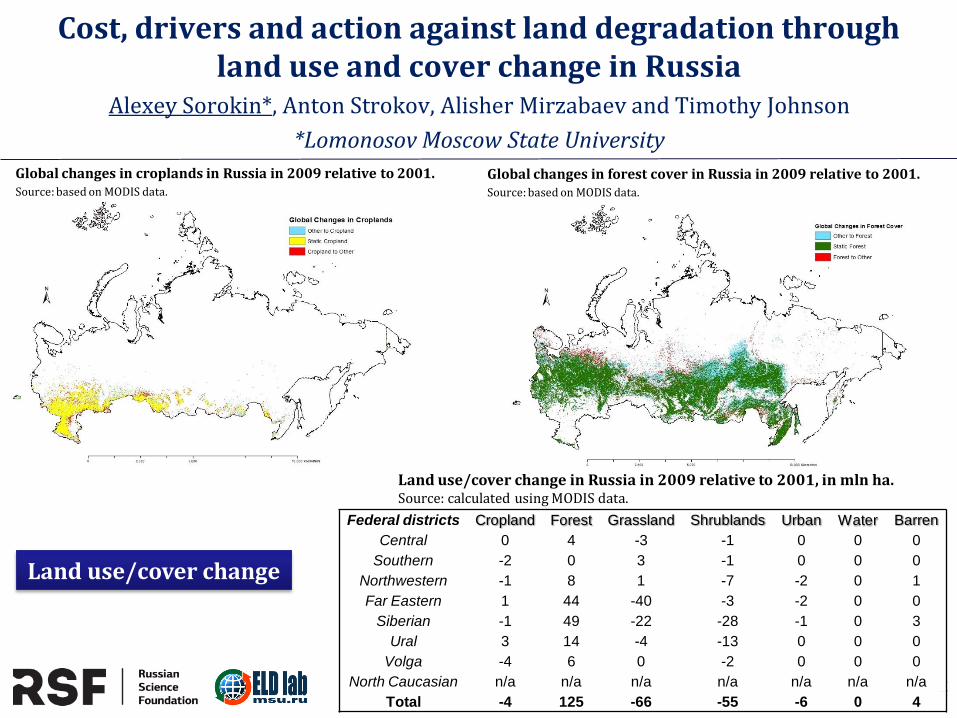
Global changes in croplands in Russia in 2009 relative to 2001. Source: based on MODIS data.
Global changes in forest cover in Russia in 2009 relative to 2001. Source: based on MODIS data.
Federal districts Cropland Forest Grassland Shrublands Urban Water Barren
Central 0 4 -3 -1 0 0 0
Southern -2 0 3 -1 0 0 0
Northwestern -1 8 1 -7 -2 0 1
Far Eastern 1 44 -40 -3 -2 0 0
Siberian -1 49 -22 -28 -1 0 3
Ural 3 14 -4 -13 0 0 0
Volga -4 6 0 -2 0 0 0
North Caucasian n/a n/a n/a n/a n/a n/a n/a
Total -4 125 -66 -55 -6 0 4
Land use/cover change in Russia in 2009 relative to 2001, in mln ha. Source: calculated using MODIS data.
Land use/cover change
Cost, drivers and action against land degradation through
land use and cover change in Russia Alexey Sorokin*, Anton Strokov, Alisher Mirzabaev and Timothy Johnson
*Lomonosov Moscow State University
3
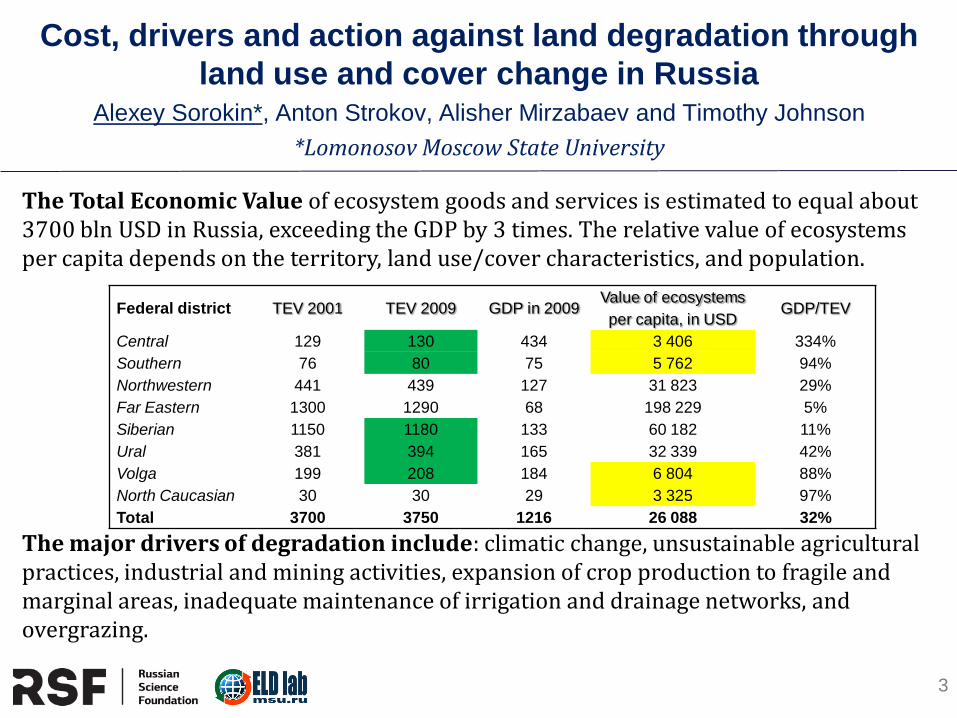
Federal district TEV 2001 TEV 2009 GDP in 2009 Value of ecosystems
per capita, in USD GDP/TEV
Central 129 130 434 3 406 334%
Southern 76 80 75 5 762 94%
Northwestern 441 439 127 31 823 29%
Far Eastern 1300 1290 68 198 229 5%
Siberian 1150 1180 133 60 182 11%
Ural 381 394 165 32 339 42%
Volga 199 208 184 6 804 88%
North Caucasian 30 30 29 3 325 97%
Total 3700 3750 1216 26 088 32%
The Total Economic Value of ecosystem goods and services is estimated to equal about 3700 bln USD in Russia, exceeding the GDP by 3 times. The relative value of ecosystems per capita depends on the territory, land use/cover characteristics, and population.
The major drivers of degradation include: climatic change, unsustainable agricultural practices, industrial and mining activities, expansion of crop production to fragile and marginal areas, inadequate maintenance of irrigation and drainage networks, and overgrazing.
Cost, drivers and action against land degradation through
land use and cover change in Russia Alexey Sorokin*, Anton Strokov, Alisher Mirzabaev and Timothy Johnson
*Lomonosov Moscow State University
4
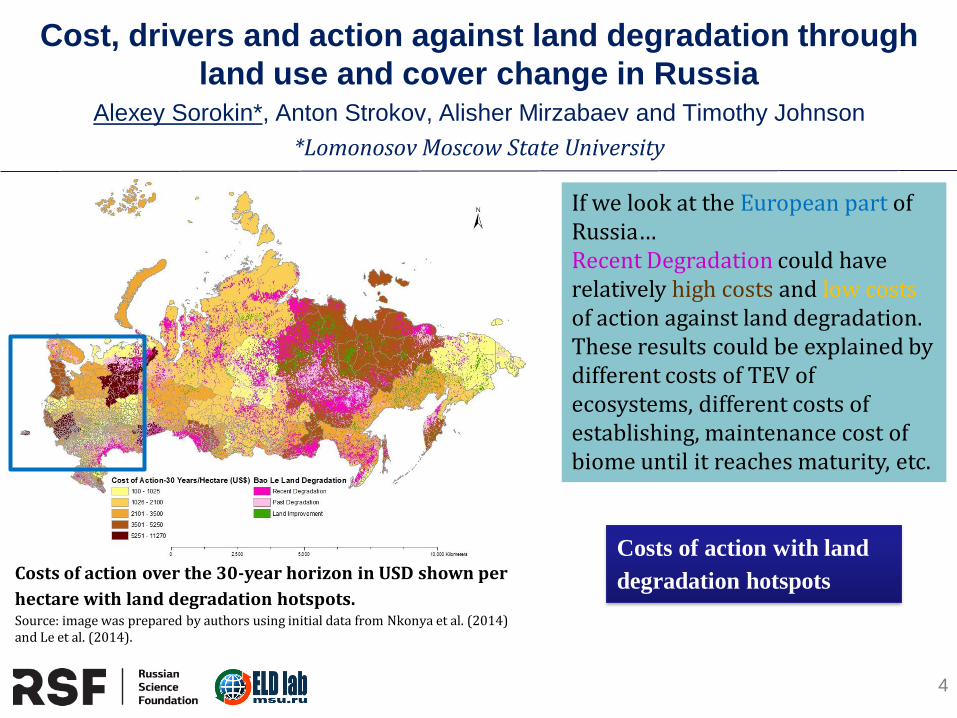
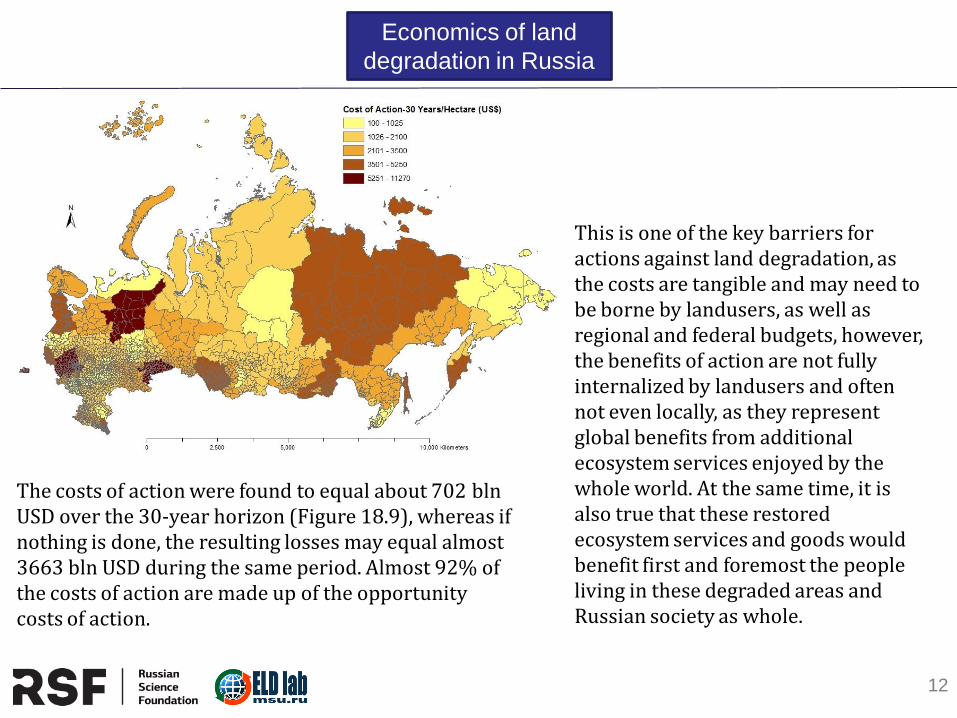
Costs of action over the 30-year horizon in USD shown per
hectare with land degradation hotspots. Source: image was prepared by authors using initial data from Nkonya et al. (2014) and Le et al. (2014).
If we look at the European part of Russia… Recent Degradation could have relatively high costs and low costs of action against land degradation. These results could be explained by different costs of TEV of ecosystems, different costs of establishing, maintenance cost of biome until it reaches maturity, etc.
Costs of action with land
degradation hotspots
Cost, drivers and action against land degradation through land use and cover change in Russia
Alexey Sorokin*, Anton Strokov, Alisher Mirzabaev and Timothy Johnson
*Lomonosov Moscow State University
5
Overview
Economics of land degradation in Russia
Case studies
Conclusion
http://eld.soil.msu.ru/en
Case study (Rostov region)
Case study (Azov district of Rostov region: From Orchards to Cropland)
Case study (The Farm level, Azov district of Rostov region)
Cost, drivers and action against land degradation through land use and cover change in Russia
Alexey Sorokin*, Anton Strokov, Alisher Mirzabaev and Timothy Johnson
*Lomonosov Moscow State University
6
For more information, please visit our website:
ELD Laboratory, Faculty of Soil Science, MSU http://eld.soil.msu.ru/en
or contact personally:
Oleg Makarov, Head of ELD Laboratory [email protected]
The the results obtained with financial assistance of Russian Scientific Foundation (RSCF) grant №14-38-00023.
Cost, drivers and action against land degradation through
land use and cover change in Russia Alexey Sorokin*, Anton Strokov, Alisher Mirzabaev and Timothy Johnson
*Lomonosov Moscow State University
7
Overview
Economics of land
degradation in Russia
Case study (Rostov
region: From Orchards
to Cropland)
Conclusion
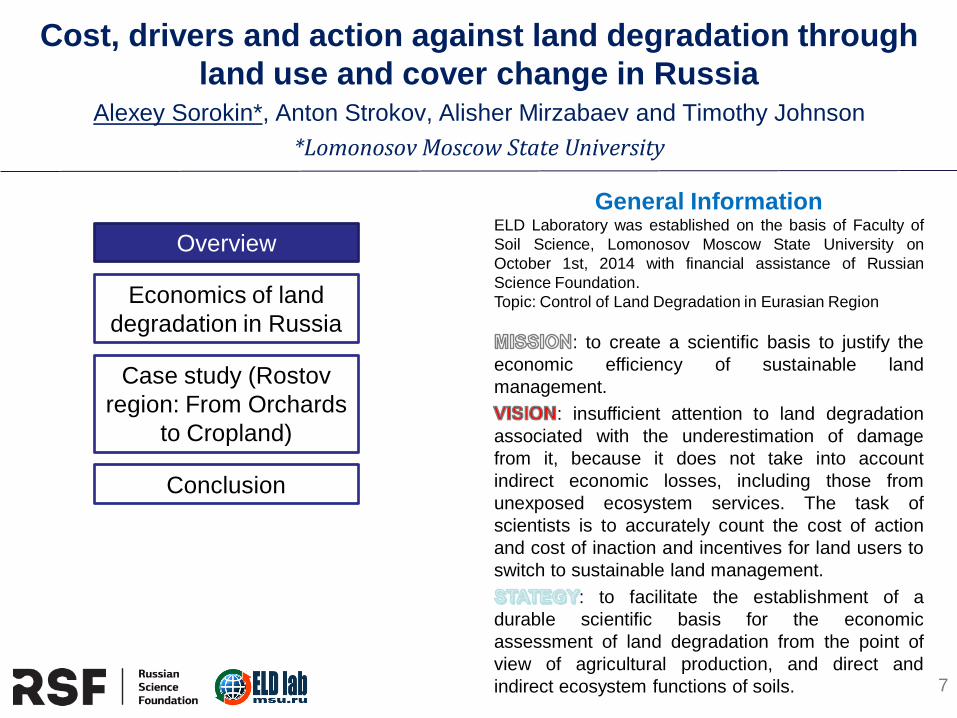
General Information ELD Laboratory was established on the basis of Faculty of
Soil Science, Lomonosov Moscow State University on
October 1st, 2014 with financial assistance of Russian
Science Foundation.
Topic: Control of Land Degradation in Eurasian Region
: to create a scientific basis to justify the
economic efficiency of sustainable land
management.
: insufficient attention to land degradation
associated with the underestimation of damage
from it, because it does not take into account
indirect economic losses, including those from
unexposed ecosystem services. The task of
scientists is to accurately count the cost of action
and cost of inaction and incentives for land users to
switch to sustainable land management.
: to facilitate the establishment of a
durable scientific basis for the economic
assessment of land degradation from the point of
view of agricultural production, and direct and
indirect ecosystem functions of soils.
8
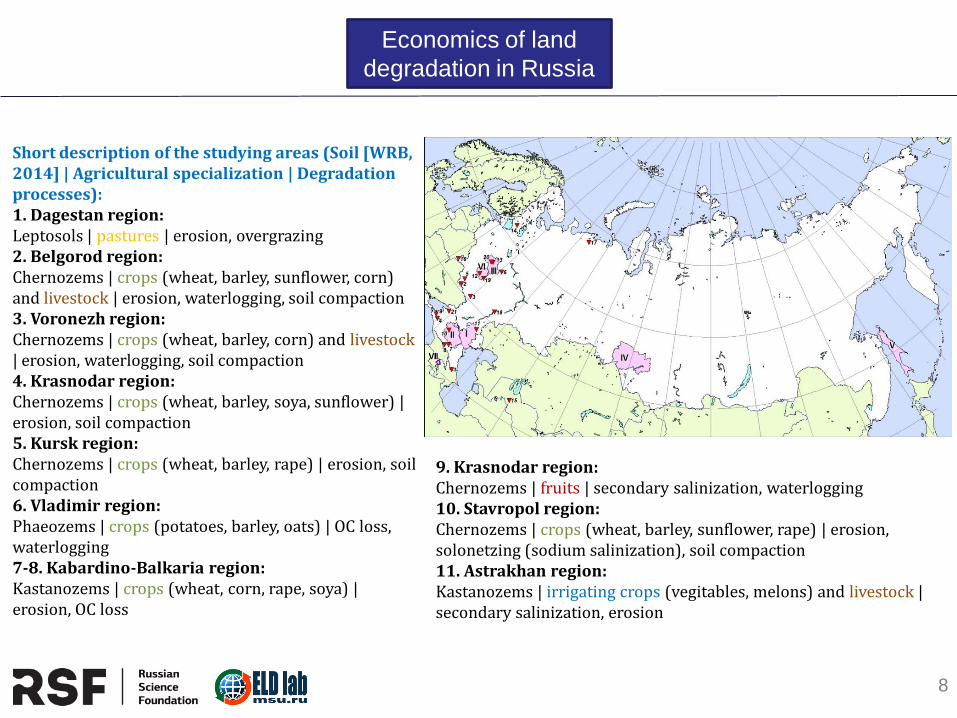
Short description of the studying areas (Soil [WRB, 2014] | Agricultural specialization | Degradation processes): 1. Dagestan region: Leptosols | pastures | erosion, overgrazing 2. Belgorod region: Chernozems | crops (wheat, barley, sunflower, corn) and livestock | erosion, waterlogging, soil compaction 3. Voronezh region: Chernozems | crops (wheat, barley, corn) and livestock | erosion, waterlogging, soil compaction 4. Krasnodar region: Chernozems | crops (wheat, barley, soya, sunflower) | erosion, soil compaction 5. Kursk region: Chernozems | crops (wheat, barley, rape) | erosion, soil compaction 6. Vladimir region: Phaeozems | crops (potatoes, barley, oats) | OC loss, waterlogging 7-8. Kabardino-Balkaria region: Kastanozems | crops (wheat, corn, rape, soya) | erosion, OC loss
9. Krasnodar region: Chernozems | fruits | secondary salinization, waterlogging 10. Stavropol region: Chernozems | crops (wheat, barley, sunflower, rape) | erosion, solonetzing (sodium salinization), soil compaction 11. Astrakhan region: Kastanozems | irrigating crops (vegitables, melons) and livestock | secondary salinization, erosion
Economics of land
degradation in Russia
9
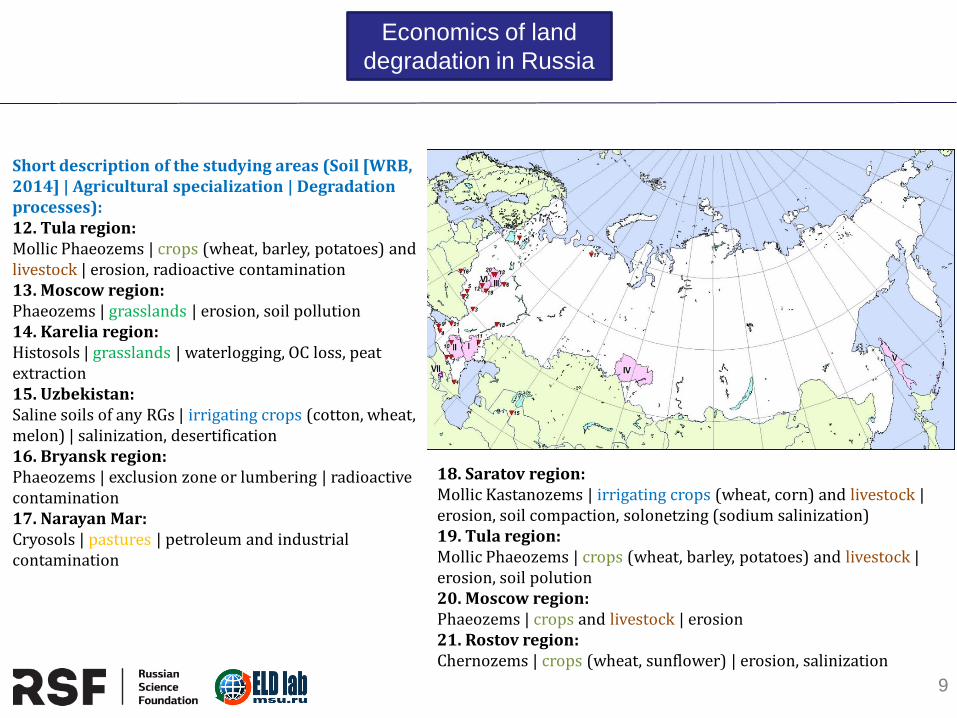
Short description of the studying areas (Soil [WRB, 2014] | Agricultural specialization | Degradation processes): 12. Tula region: Mollic Phaeozems | crops (wheat, barley, potatoes) and livestock | erosion, radioactive contamination 13. Moscow region: Phaeozems | grasslands | erosion, soil pollution 14. Karelia region: Histosols | grasslands | waterlogging, OC loss, peat extraction 15. Uzbekistan: Saline soils of any RGs | irrigating crops (cotton, wheat, melon) | salinization, desertification 16. Bryansk region: Phaeozems | exclusion zone or lumbering | radioactive contamination 17. Narayan Mar: Cryosols | pastures | petroleum and industrial contamination
18. Saratov region: Mollic Kastanozems | irrigating crops (wheat, corn) and livestock | erosion, soil compaction, solonetzing (sodium salinization) 19. Tula region: Mollic Phaeozems | crops (wheat, barley, potatoes) and livestock | erosion, soil polution 20. Moscow region: Phaeozems | crops and livestock | erosion 21. Rostov region: Chernozems | crops (wheat, sunflower) | erosion, salinization
Economics of land
degradation in Russia
10
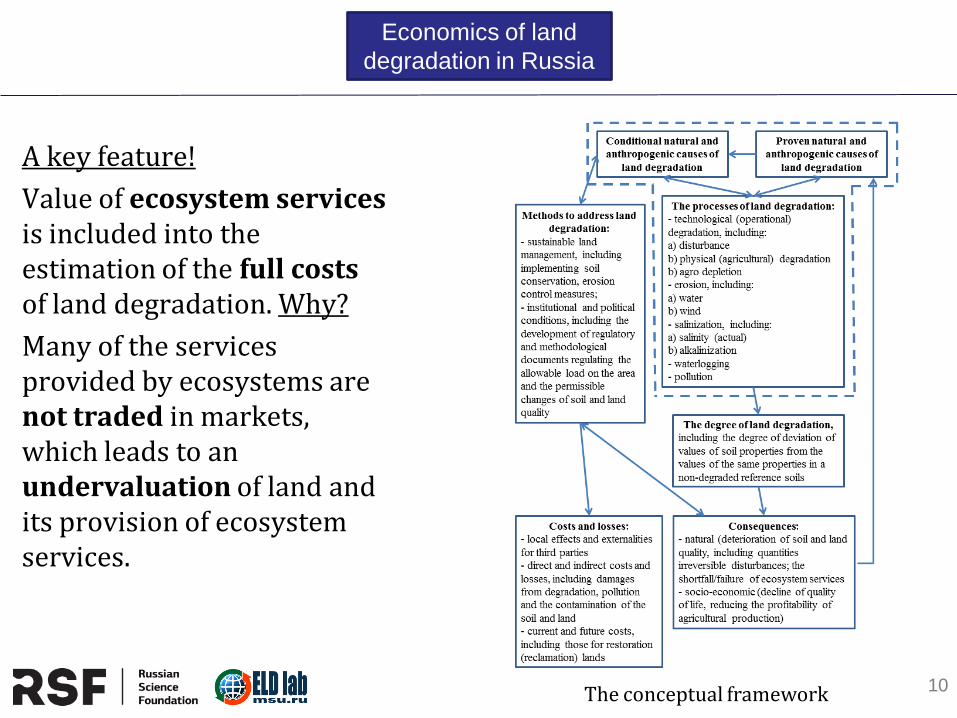
A key feature!
Value of ecosystem services is included into the estimation of the full costs of land degradation. Why?
Many of the services provided by ecosystems are not traded in markets, which leads to an undervaluation of land and its provision of ecosystem services.
The conceptual framework
Economics of land
degradation in Russia
11
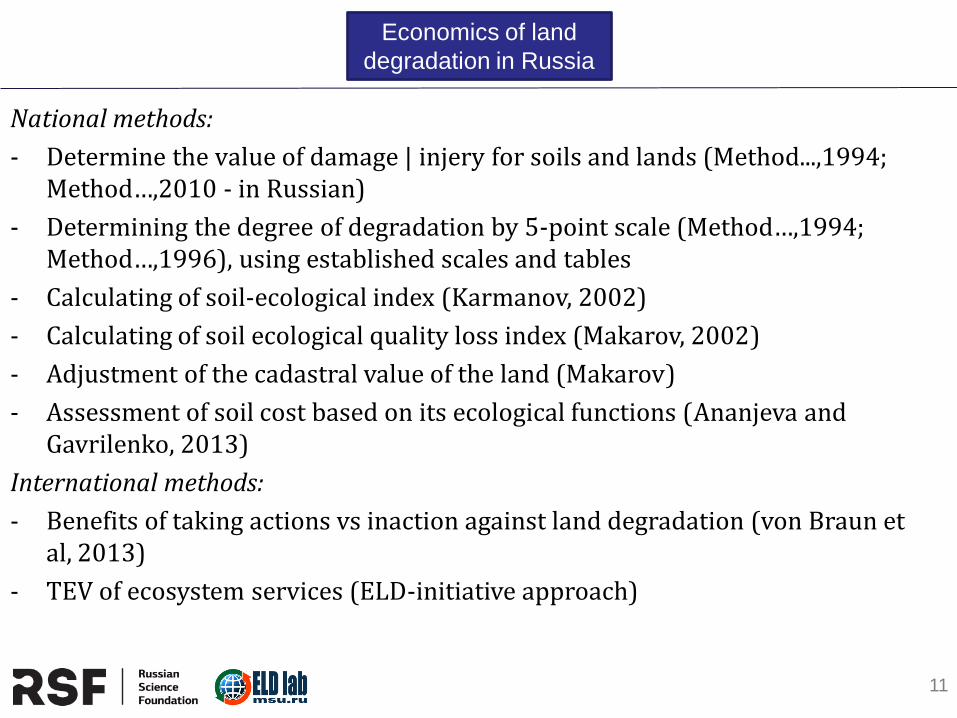
National methods:
- Determine the value of damage | injery for soils and lands (Method...,1994; Method…,2010 - in Russian)
- Determining the degree of degradation by 5-point scale (Method…,1994; Method…,1996), using established scales and tables
- Calculating of soil-ecological index (Karmanov, 2002)
- Calculating of soil ecological quality loss index (Makarov, 2002)
- Adjustment of the cadastral value of the land (Makarov)
- Assessment of soil cost based on its ecological functions (Ananjeva and Gavrilenko, 2013)
International methods:
- Benefits of taking actions vs inaction against land degradation (von Braun et al, 2013)
- TEV of ecosystem services (ELD-initiative approach)
Economics of land
degradation in Russia
12
Economics of land
degradation in Russia
This is one of the key barriers for actions against land degradation, as the costs are tangible and may need to be borne by landusers, as well as regional and federal budgets, however, the benefits of action are not fully internalized by landusers and often not even locally, as they represent global benefits from additional ecosystem services enjoyed by the whole world. At the same time, it is also true that these restored ecosystem services and goods would benefit first and foremost the people living in these degraded areas and Russian society as whole.
The costs of action were found to equal about 702 bln USD over the 30-year horizon (Figure 18.9), whereas if nothing is done, the resulting losses may equal almost 3663 bln USD during the same period. Almost 92% of the costs of action are made up of the opportunity costs of action.
13
Case study (Rostov region)
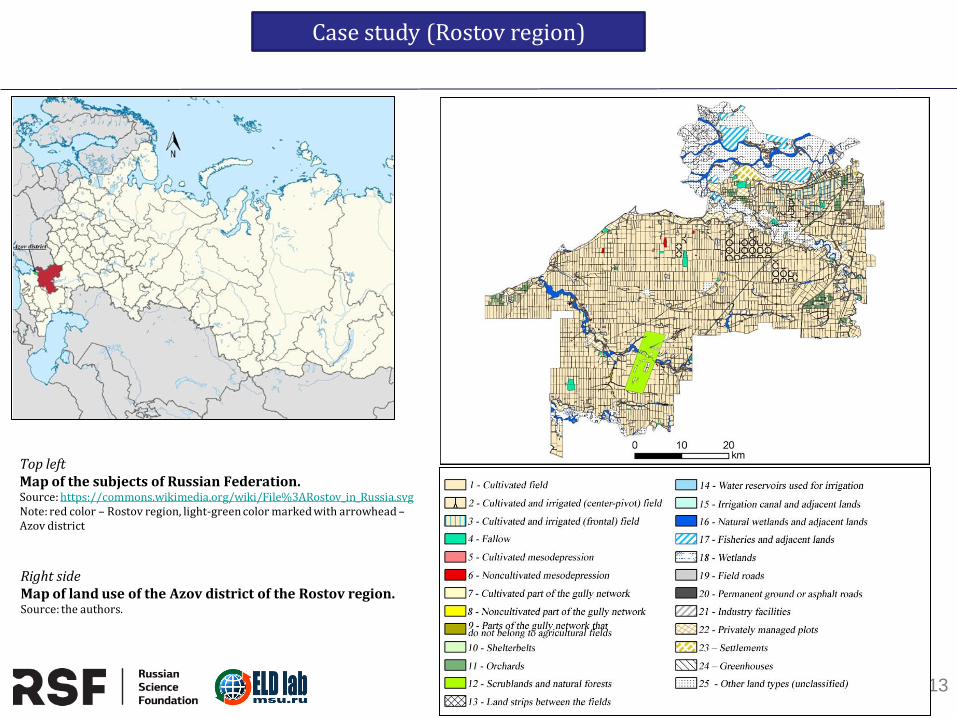
Top left Map of the subjects of Russian Federation. Source: https://commons.wikimedia.org/wiki/File%3ARostov_in_Russia.svg Note: red color – Rostov region, light-green color marked with arrowhead – Azov district
Right side Map of land use of the Azov district of the Rostov region. Source: the authors.

14
Interrelation of soil and economic indicators in Rostov region
Title: 1995 and 2006 correlation (R) matrix table, based on data of 43 districts of Rostov region
Variable
The
share of
degraded
land in
agro-
land, %
Total
amount
of
degraded
agro-
land, ha
Total
crop
growing
costs
per ha
Total
crop
output,
rub/ha
Mineral
fertilizers
costs per
ha
Share
of
fallow
land in
arable
land, %
Total
crop
area,
ha
Grain
yields,
kg per
ha
Grain
costs
per
ha
Sunflower
yields, kg
per ha
Sunflower
costs, rub
per ha
OC
content
1995 -0,52 -0,54 0,33 0,43 0,53 -0,50 -0,15 0,56 0,43 0,77 0,59
2006 0,65 0,57 0,66 -0,56 0,06 0,56 0,64 0,85 0,78
P
content
1995 -0,22 -0,50 0,57 0,54 0,36 -0,32 -0,28 0,27 0,48 0,20 0,27
2006 0,50 0,39 0,42 -0,25 -0,10 0,32 0,38 0,20 0,22
K
content
1995 -0,55 -0,13 0,44 0,51 0,18 -0,32 0,07 0,57 0,48 0,12 0,05
2006 0,46 0,39 0,39 -0,28 0,17 0,39 0,40 0,16 0,15
Outcomes: -when market reforms occurred in Russia in the mid 1990's it was better to start growing crops on most fertile lands -farmers started increasing their inputs to make efficiency grow -farmers used more fallow land mostly on less fertile soils and planted more crops in districts with more fertile soils -in a 11-year period the production switched much more on more fertile soils and became more intensive -in a 11-year period farmers continued to exploit more fertile soils by increasing fertilizer inputs
Case study (Rostov region)
15
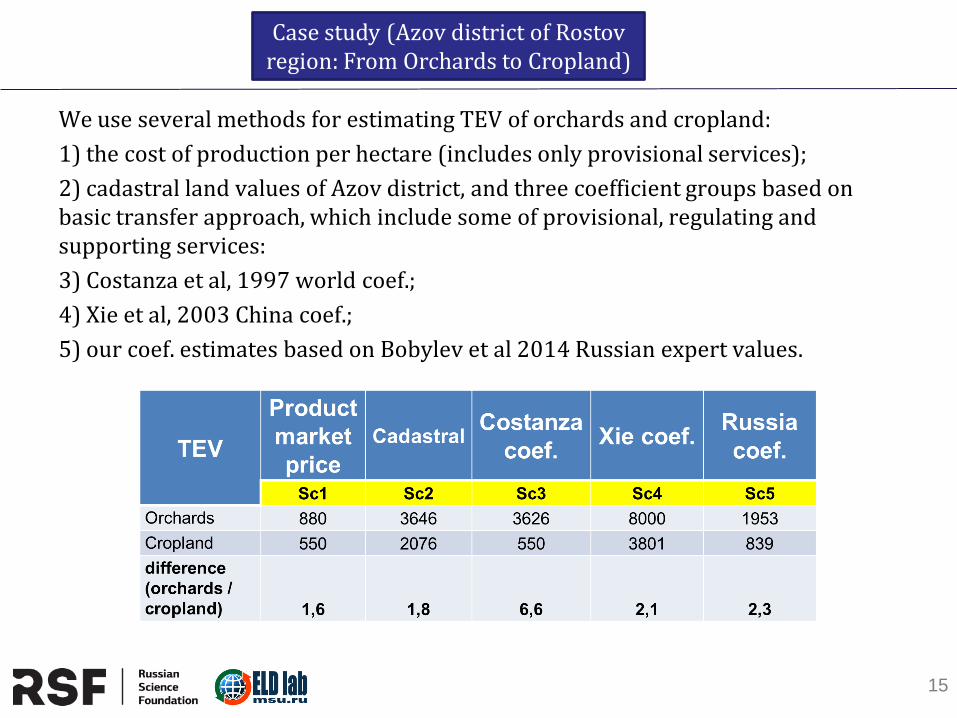
We use several methods for estimating TEV of orchards and cropland:
1) the cost of production per hectare (includes only provisional services);
2) cadastral land values of Azov district, and three coefficient groups based on basic transfer approach, which include some of provisional, regulating and supporting services:
3) Costanza et al, 1997 world coef.;
4) Xie et al, 2003 China coef.;
5) our coef. estimates based on Bobylev et al 2014 Russian expert values.
Case study (Azov district of Rostov region: From Orchards to Cropland)
16
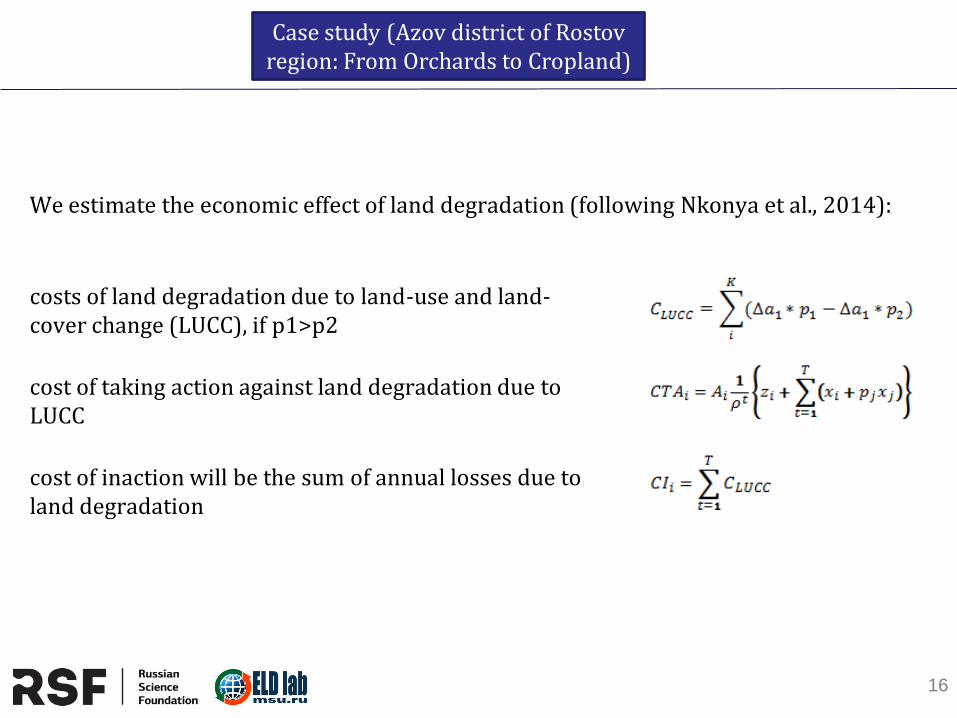
We estimate the economic effect of land degradation (following Nkonya et al., 2014):
costs of land degradation due to land-use and land-cover change (LUCC), if p1>p2
cost of taking action against land degradation due to LUCC
cost of inaction will be the sum of annual losses due to land degradation
Case study (Azov district of Rostov region: From Orchards to Cropland)
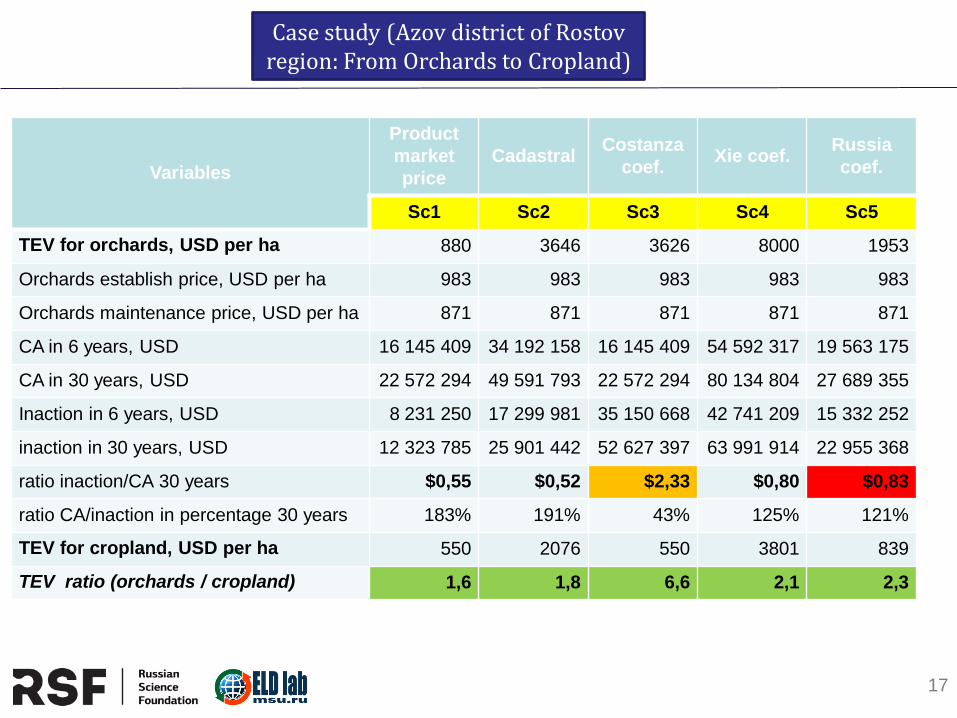
17
Variables
Product
market
price
Cadastral Costanza
coef. Xie coef.
Russia
coef.
Sc1 Sc2 Sc3 Sc4 Sc5
TEV for orchards, USD per ha 880 3646 3626 8000 1953
Orchards establish price, USD per ha 983 983 983 983 983
Orchards maintenance price, USD per ha 871 871 871 871 871
CA in 6 years, USD 16 145 409 34 192 158 16 145 409 54 592 317 19 563 175
CA in 30 years, USD 22 572 294 49 591 793 22 572 294 80 134 804 27 689 355
Inaction in 6 years, USD 8 231 250 17 299 981 35 150 668 42 741 209 15 332 252
inaction in 30 years, USD 12 323 785 25 901 442 52 627 397 63 991 914 22 955 368
ratio inaction/CA 30 years $0,55 $0,52 $2,33 $0,80 $0,83
ratio CA/inaction in percentage 30 years 183% 191% 43% 125% 121%
TEV for cropland, USD per ha 550 2076 550 3801 839
TEV ratio (orchards / cropland) 1,6 1,8 6,6 2,1 2,3
Case study (Azov district of Rostov region: From Orchards to Cropland)
18
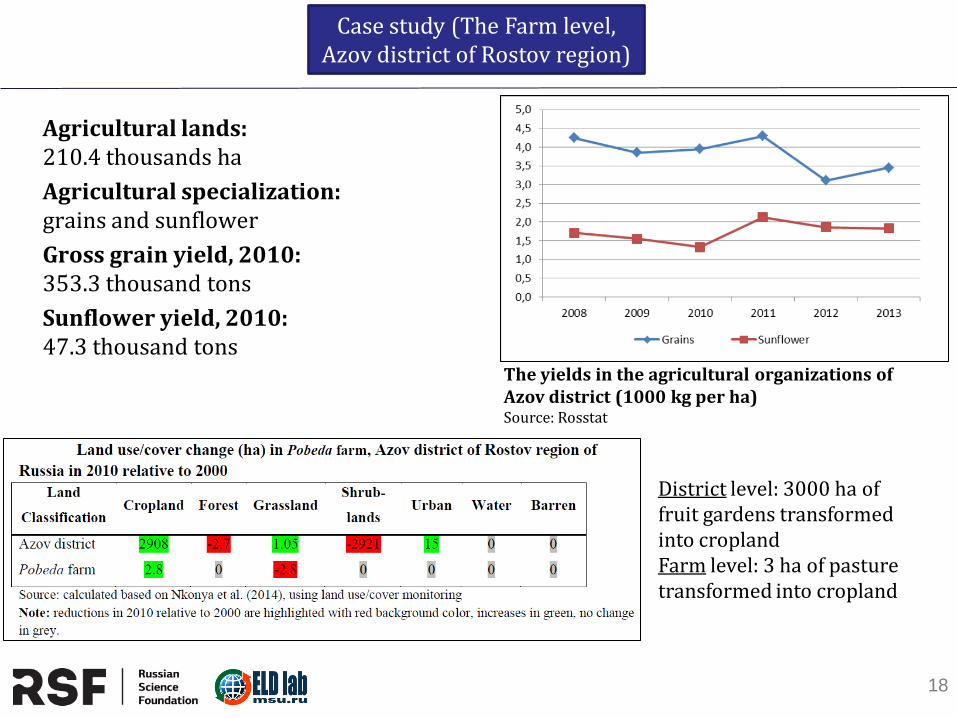
Agricultural lands: 210.4 thousands ha
Agricultural specialization: grains and sunflower
Gross grain yield, 2010: 353.3 thousand tons
Sunflower yield, 2010: 47.3 thousand tons
The yields in the agricultural organizations of Azov district (1000 kg per ha) Source: Rosstat
District level: 3000 ha of fruit gardens transformed into cropland Farm level: 3 ha of pasture transformed into cropland
Case study (The Farm level, Azov district of Rostov region)
19
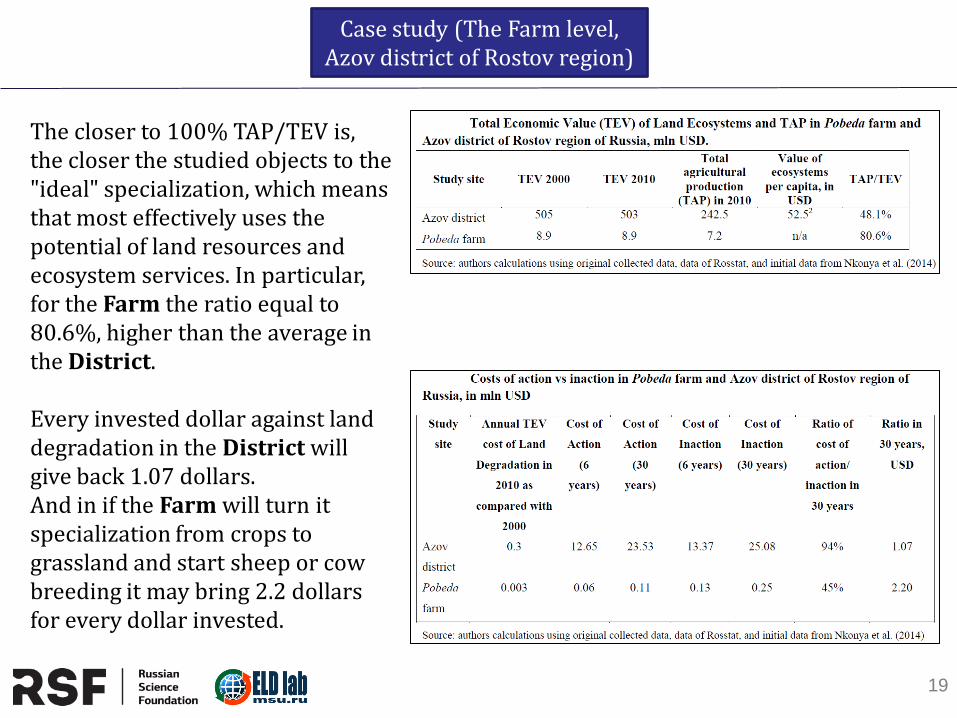
Case study (The Farm level, Azov district of Rostov region)
The closer to 100% TAP/TEV is, the closer the studied objects to the "ideal" specialization, which means that most effectively uses the potential of land resources and ecosystem services. In particular, for the Farm the ratio equal to 80.6%, higher than the average in the District. Every invested dollar against land degradation in the District will give back 1.07 dollars. And in if the Farm will turn it specialization from crops to grassland and start sheep or cow breeding it may bring 2.2 dollars for every dollar invested.
20
We recommend raising awareness on the ELD for improving the effectiveness of agricultural production, however we have to mention that the average TEV used in the calculations should be corrected with reference to local surveys and data LUCC approach does not reflect weakly expressed soil and land degradation. The results we obtained in Rostov region clearly show that crop production is the most economically efficient agricultural specialization both for Azov district and for the Farm. But, even a high level of economic specialization may be accompanied by a rational use of land resources, taking into account ecosystem services.
Conclusion
Cost, drivers and action against land degradation through land use and cover change in Russia
Alexey Sorokin*, Anton Strokov, Alisher Mirzabaev and Timothy Johnson
*Lomonosov Moscow State University
21
For more information, please visit our site: ELD Laboratory, Faculty of Soil Science, MSU
http://eld.soil.msu.ru/en
or contact: Oleg Makarov, Head of ELD Laboratory
The the results obtained with financial assistance of Russian Scientific Foundation (RSCF) grant №14-38-00023.