Embed Size (px)
Citation preview

25th Mechanical Engineering Safety Seminar
What does the future hold for mechanical
equipment?
25th Mechanical Engineering Safety Seminar Presented by: WJ Koppe – Inspector of Mechanical Engineering Resources and Energy – Mine Safety 9 & 10 September 2015

What does the future hold for mechanical equipment?
We expect equipment used at mines to: Become larger More complex Have lower factors of safety Have more sensors and warning devices Have automatic functioning Involve more electronics / computer control Require more specialised electrical and mechanical maintenance personnel Require more involvement of suppliers Be involved in future fatalities


What can be used to predict the probability of future fatalities?
A review of: Incidents including near miss events Accidents Equipment limitations Competence assessment Compliance to standards / guidelines Risk analysis / management Fatality database

What equipment has been involved in fatalities?
Surface mines and quarries Trucks Excavators Tyres Elevated Work Platforms Walkways Overhead Power lines

Underground Metal Mines
Winders Trucks Remote controlled LHD’s Raise Borer
Underground Coal Mines Gas ignitions from Brakes, friction, sparking
High Pressure hydraulics Canopies of Continuous Miners Canopies on LHD’s Drift Haulage Rail Haulage Conveyors Drill Rigs Vehicle Park Brakes

What suggests more winder fatalities may occur?
Recent incidents where winder ropes were substantially below the minimum factor of safety
A design issue where the brakes were inadequate because of reliance on braking effect of the worn reducer
The age of some of the equipment The lack of knowledge of some of the responsible
personnel The safety equipment / standards of some of the
equipment used for shaft sinking The need to have power on for some maintenance tasks The complexity of the systems

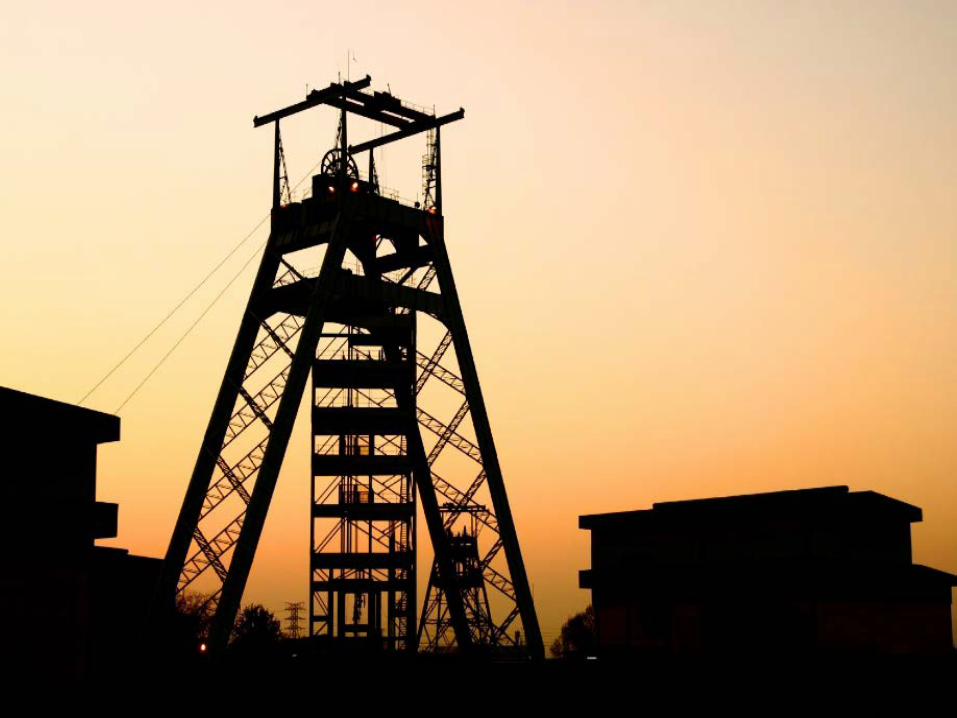
Winder Incidents
Year 2011 – 12 2012 – 13 2013 – 14 2014 – 15 Total
Coal Mine
22
13
20
12
67
Metal Mines
2
7
1
3
13
Total
24
20
21
15
80
Coal U/G
2011 – 12 2012 – 13 2013 – 14 2014 – 15 Total
Southern mine A
4
2
4
4
14
Northern mine B
1
0
0
0
1
Western mine C
1
1
0
1
3
Northern mine D
0
0
1
0
1
Western mine E
1
0
0
1
2
Western mine F
3
0
6
0
9
Northern mine G
1
0
0
0
1
Western mine H
9
7
6
4
26
Western mine I
2
2
3
1
8
Northern mine J
0
1
0
1
2
Total
22
13
20
12
67
Winder Incidents
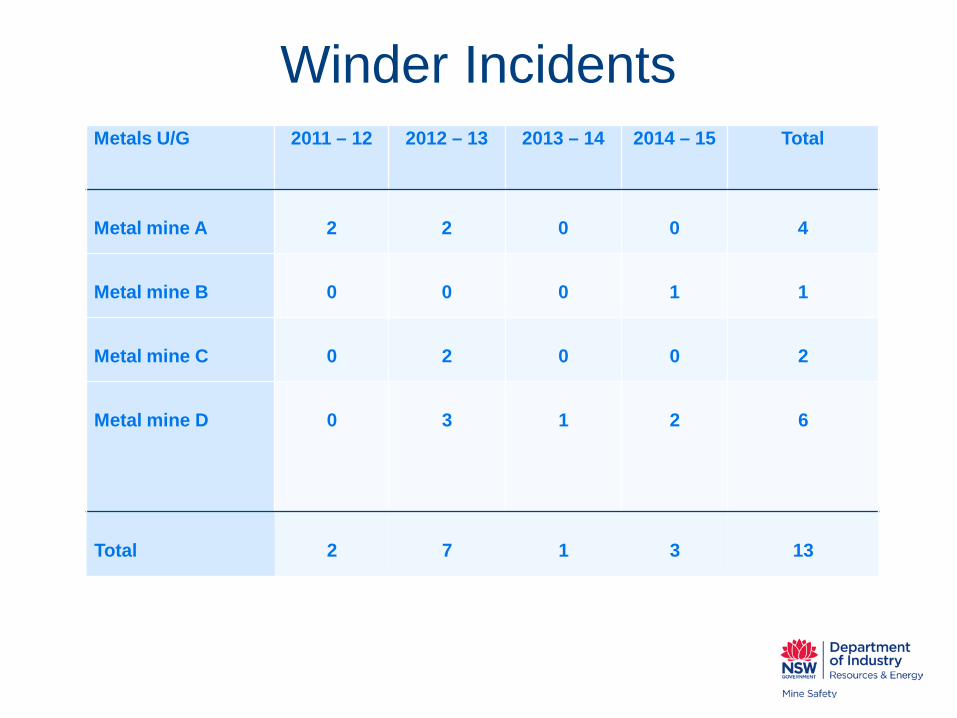
Metals U/G
2011 – 12 2012 – 13 2013 – 14 2014 – 15 Total
Metal mine A
2
2
0
0
4
Metal mine B
0
0
0
1
1
Metal mine C
0
2
0
0
2
Metal mine D
0
3
1
2
6
Total
2
7
1
3
13
Winder Incidents
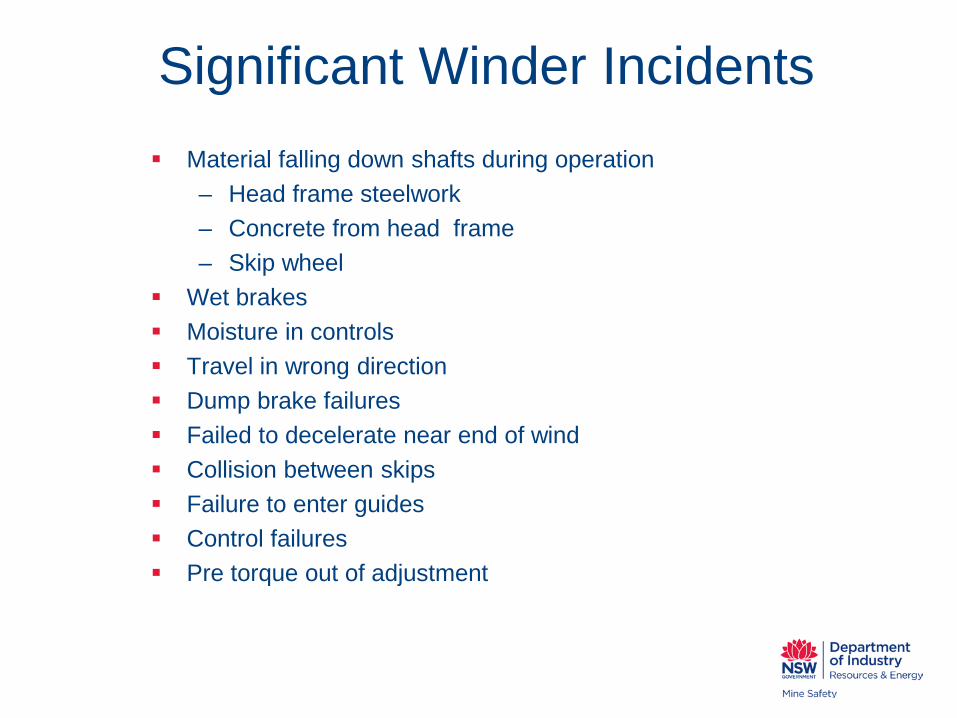
Significant Winder Incidents Material falling down shafts during operation
– Head frame steelwork – Concrete from head frame – Skip wheel
Wet brakes Moisture in controls Travel in wrong direction Dump brake failures Failed to decelerate near end of wind Collision between skips Failure to enter guides Control failures Pre torque out of adjustment

What Suggests More Gas / Coal Dust Explosion Fatalities May Occur?
Gas trips Gas exceeding 2.5% Cable arcs Failure of explosion protection (Electrical) Failure of explosion protection (Diesel engines) Fires underground More conveyors and equipment in return airways Deeper mines / higher production Frictional ignition Spontaneous combustion Higher voltage equipment on longwalls Gas outbursts on the increase


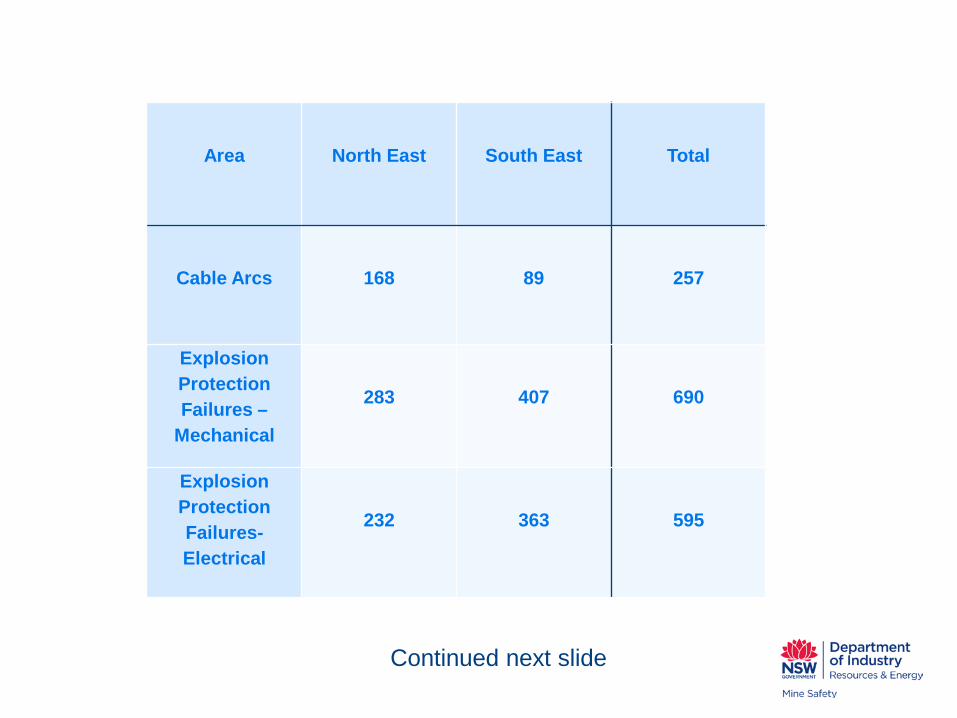
Cable Arcs
Area North East South East Total
Incidents
168
89
257

Cable Arcs
Year 2011 – 12 2012 – 13 2013 – 14 2014 – 15 Total
Incidents
70
64
70
52
257

2011 – 12 2012 – 13 2013 – 14 2014 – 15 Total
Mine A 4 7 9 4 24
Mine B 2 4 0 3 9
Mine C 1 3 2 1 7
Mine D 2 2 3 4 11
Mine E 4 5 2 5 13
Mine F 2 0 1 1 4
Mine G 1 0 0 0 1
Mine H 1 1 3 2 7
Mine I 1 2 1 1 5
Mine J 3 2 2 0 7
Mine K 2 2 7 9 20
Mine L 2 0 2 1 5
Mine M 5 1 1 0 7
Mine N 3 3 2 1 9
Mine O 5 2 0 0 7
Cable Arcs

2011 – 12 2012 – 13 2013 – 14 2014 – 15 Total
Mine P 1 1 0 1 3
Mine Q 11 9 10 13 43
Mine R 1 1 0 1 3
Mine S 5 4 13 2 24
Mine T 5 2 0 0 7
Mine U 0 5 0 0 5
Mine V 1 2 3 4 10
Mine W 0 0 2 0 2
Mine X 1 0 1 1 3
Mine Y 2 2 3 1 8
Mine Z 1 0 0 0 1
Mine AA 0 1 0 0 1
Mine AB 1 1 0 0 2
Mine AC 3 2 3 1 9
Total
70
64
70
53
257
Cable Arcs

Explosion Protection Failures - Mechanical
Area
North East
South East
Total
Incidents
283
407
690

Explosion Protection Failures - Mechanical
2011 – 12 2012 – 13 2013 – 14 2014 – 15 Total
Mobile Equipment
201
201
141
120
663
Fire Equipment
15
1
7
4
27
Total
216
202
148
124
690

2011 – 12 2012 – 13 2013 – 14 2014 – 15 Total
Mine A 9 2 3 7 12
Mine B 2 0 0 3 5
Mine C 5 12 4 2 23
Mine D 25 16 6 6 53
Mine E 11 8 2 6 27
Mine F 6 1 8 4 19
Mine G 1 0 0 0 1
Mine H 1 0 0 0 1
Mine I 1 2 0 0 3
Mine J 2 2 2 1 7
Mine K 6 2 3 0 11
Mine L 1 4 4 4 13
Mine M 19 21 8 16 64
Mine N 14 23 5 0 42
Mine O 5 5 2 1 13
Mine P 6 3 4 0 10
Explosion Protection Failures - Mechanical
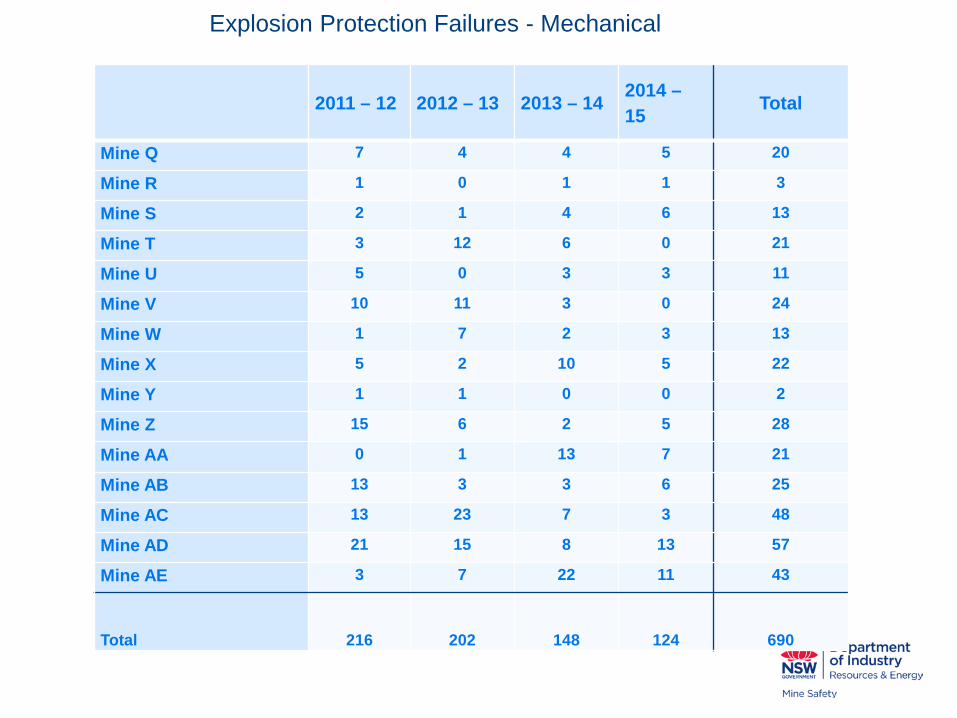
2011 – 12 2012 – 13 2013 – 14 2014 – 15
Total
Mine Q 7 4 4 5 20
Mine R 1 0 1 1 3
Mine S 2 1 4 6 13
Mine T 3 12 6 0 21
Mine U 5 0 3 3 11
Mine V 10 11 3 0 24
Mine W 1 7 2 3 13
Mine X 5 2 10 5 22
Mine Y 1 1 0 0 2
Mine Z 15 6 2 5 28
Mine AA 0 1 13 7 21
Mine AB 13 3 3 6 25
Mine AC 13 23 7 3 48
Mine AD 21 15 8 13 57
Mine AE 3 7 22 11 43
Total
216
202
148
124
690
Explosion Protection Failures - Mechanical
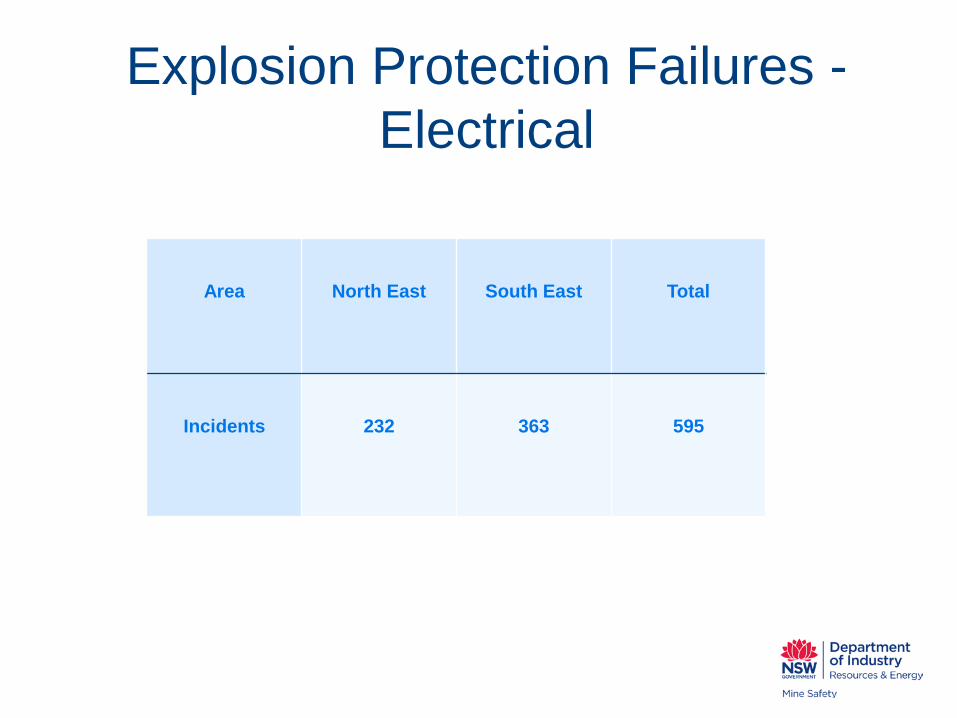
Explosion Protection Failures - Electrical
Area
North East
South East
Total
Incidents
232
363
595

Explosion Protection Failures - Electrical
2011 – 12 2012 – 13 2013 – 14 2014 – 15 Total
Incidents
92
147
173
183
595

2011 – 12 2012 – 13 2013 – 14 2014 – 15 Total
Mine A 4 2 9 3 18
Mine B 2 0 0 1 3
Mine C 5 2 3 3 13
Mine D 7 9 16 40 72
Mine E 2 0 4 3 9
Mine F 3 3 3 3 12
Mine G 1 0 0 0 1
Mine H 0 2 0 0 2
Mine I 0 9 8 14 31
Mine J 3 1 7 3 14
Mine K 0 2 0 0 2
Mine L 5 1 2 0 8
Mine M 3 11 11 18 43
Mine N 4 15 10 0 29
Mine O 12 8 8 5 33
Mine P 1 2 0 0 3
Explosion Protection Failures - Electrical

2011 – 12 2012 – 13 2013 – 14 2014 – 15 Total
Mine Q 2 15 9 12 38
Mine R 4 4 2 3 13
Mine S 0 3 5 7 15
Mine T 0 1 4 1 6
Mine U 1 9 4 2 16
Mine V 3 2 4 1 10
Mine W 1 5 5 11 22
Mine X 7 8 11 4 30
Mine Y 1 0 0 0 1
Mine Z 3 4 8 6 21
Mine AA 1 0 3 16 20
Mine AB 1 7 5 2 15
Mine AC 5 6 11 1 23
Mine AD 4 13 17 16 50
Mine AE 7 3 4 8 22
Total
92
147
173
183
595
Explosion Protection Failures - Electrical
Area
North East
South East
Total
Cable Arcs
168
89
257
Explosion Protection Failures –
Mechanical
283
407
690
Explosion Protection Failures- Electrical
232
363
595
Continued next slide

Area
North East
South East
Total
Conveyor Fires
1
4
5
Drill Rig Gas fire
1
0
1
Coal Self Heating
2
1
3
Total Reported Potential Issues
686
864
1551

Potential Ignition Sources – NOT reported
Strata support bolt failures Conveyor idler bearing failures Conveyor belt rubbing Drill flushing failures Failures detected when equipment is not in
operation
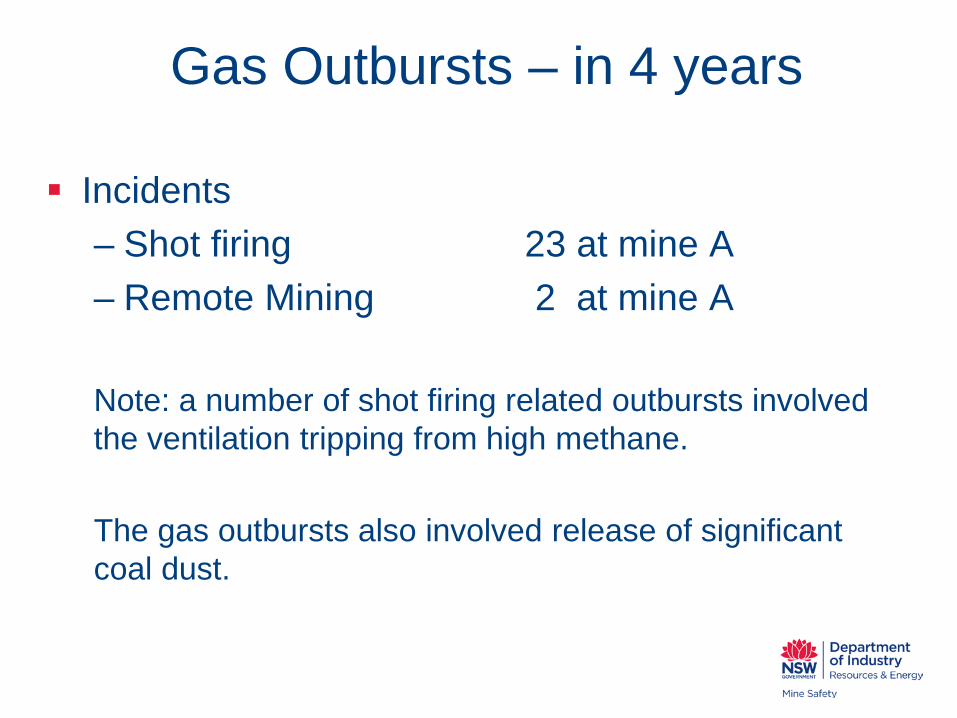
Gas Outbursts – in 4 years
Incidents – Shot firing 23 at mine A – Remote Mining 2 at mine A
Note: a number of shot firing related outbursts involved the ventilation tripping from high methane. The gas outbursts also involved release of significant coal dust.

Gas Trips - Longwall
Area
North East
South East
Total
298
359
657

Gas Trips Total
2011 – 12 2012 – 13 2013 – 14 2014 – 15 Total
285
224
222
179
910
Note: Gas trips not reportable from 1 February 2015 unless > 2.5% CH4. Rarely identified if gas concentration is in explosive range.

What has improved over 4 years?
Compliance with stone dust requirements has improved generally now + 95%.
NOT at a large gassy South Coast mine
Stone dust requirements increase on 1 November 2015

What suggests longwall automation will result in fatalities?
Experience with remote control of LHD’s at metal mines and continuous miners at coal mines
Increase on speed of chock advance Limited walkway Reliance on personnel to constantly move in order to
remain in the ‘safe zone’ Failure to provide proximity detection to ensure personnel
are not in ‘no go zone’ Failure to use proximity detection where provided

Failure to adequately control software by mines and OEM’s
Failure to adequately test and commission the controls after changes made or components changed
Failure to act on OEM safety alerts relating to identified issues
Having too many unknown ‘cooks’ making changes
Lack of competence of supervisors Production pressure

Necessary interaction between personnel and the automated equipment
Failure to adhere to basic principles covering access of personnel into automated operational equipment areas
Failure of electrical controls due to ingress of water
Wear of hydraulic components
The following accidents / incidents have occurred on operational longwalls When sprays were activated shield lowered
because solenoids were swapped

Unplanned Chock Movements Mine No
Mine A 2 Mine B 1
Mine C 3
Mine D 1
Mine E 5
Mine F 2
Mine G 1
Mine H 1
Mine I 1
Mine J 4
Mine K 4
Total 25

Management recommendations
Don’t bog down in everyday issues Identify high risk issues Learn from others Ask questions Identify trends Don’t leave everything to OEM’s Communicate Initiate improvements Monitor change Regularly review your areas