Embed Size (px)
Citation preview

Epidemic CurvesEpidemic Curves
Jen-Hsiang Chuang, M.D., Ph.D.Jen-Hsiang Chuang, M.D., Ph.D.Taiwan Centers for Disease ControlTaiwan Centers for Disease Control
[email protected]@cdc.gov.tw
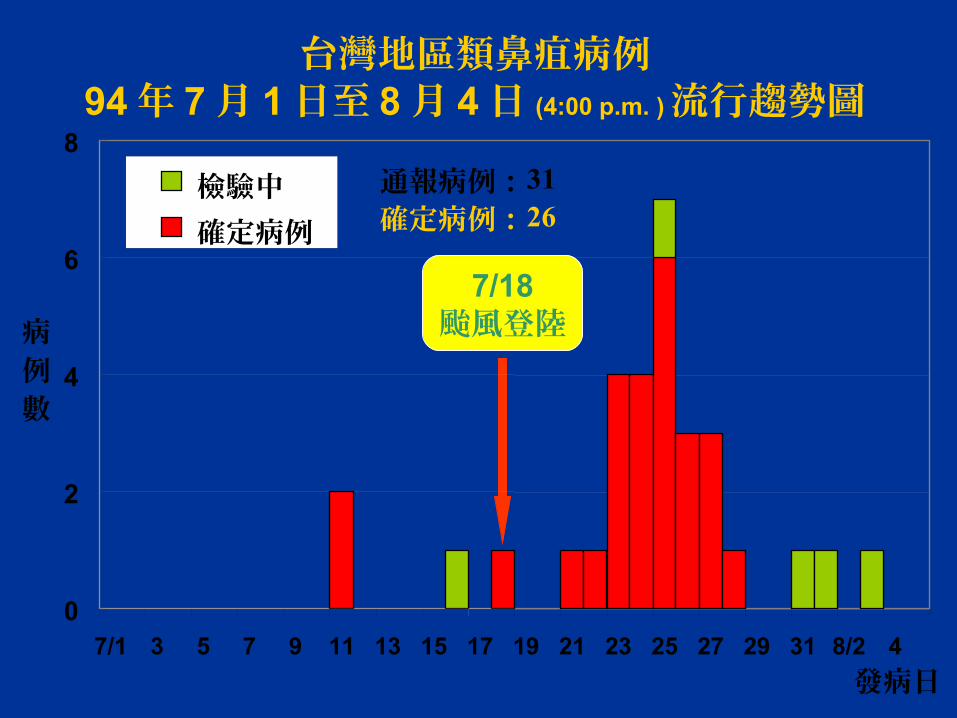
7/18颱風登陸
台灣地區類鼻疽病例94年 7月 1日至 8月 4日 (4:00 p.m. )流行趨勢圖
0
2
4
6
8
7/1 3 5 7 9 11 13 15 17 19 21 23 25 27 29 31 8/2 4
發病日
病例數
檢驗中確定病例
通報病例:31確定病例:26
What is an Epidemic Curve What is an Epidemic Curve (Epi Curve) ?(Epi Curve) ?
An epidemic curveAn epidemic curve (( a histograma histogram ) ) is a is a graphical depiction of the number of cases of graphical depiction of the number of cases of illness by the date of illness onsetillness by the date of illness onset
There should not be any space between the x-There should not be any space between the x-axis categoriesaxis categories
How Can it Help in an Outbreak?How Can it Help in an Outbreak?
An epi curve can provide information on the An epi curve can provide information on the following characteristics of an outbreak:following characteristics of an outbreak: Pattern of spreadPattern of spread MagnitudeMagnitude OutliersOutliers Time trendTime trend Exposure and/or disease incubation periodExposure and/or disease incubation period
Outbreak Pattern of SpreadOutbreak Pattern of Spread
The overall shape of the epi curve can reveal the The overall shape of the epi curve can reveal the type of outbreaktype of outbreak Common sourceCommon source Point sourcePoint source PropagatedPropagated
Common Source OutbreakCommon Source Outbreak
An outbreak due to transmission from a single An outbreak due to transmission from a single environmental or human sourceenvironmental or human source
Period of exposure may be brief or longPeriod of exposure may be brief or long Intermittent exposure often results in an epi Intermittent exposure often results in an epi
curve with irregular peaks that reflect the timing curve with irregular peaks that reflect the timing and the extent of exposure and the extent of exposure
Continuous exposure will often cause cases to Continuous exposure will often cause cases to rise gradually (and possibly to plateau, rather rise gradually (and possibly to plateau, rather than to peak)than to peak)
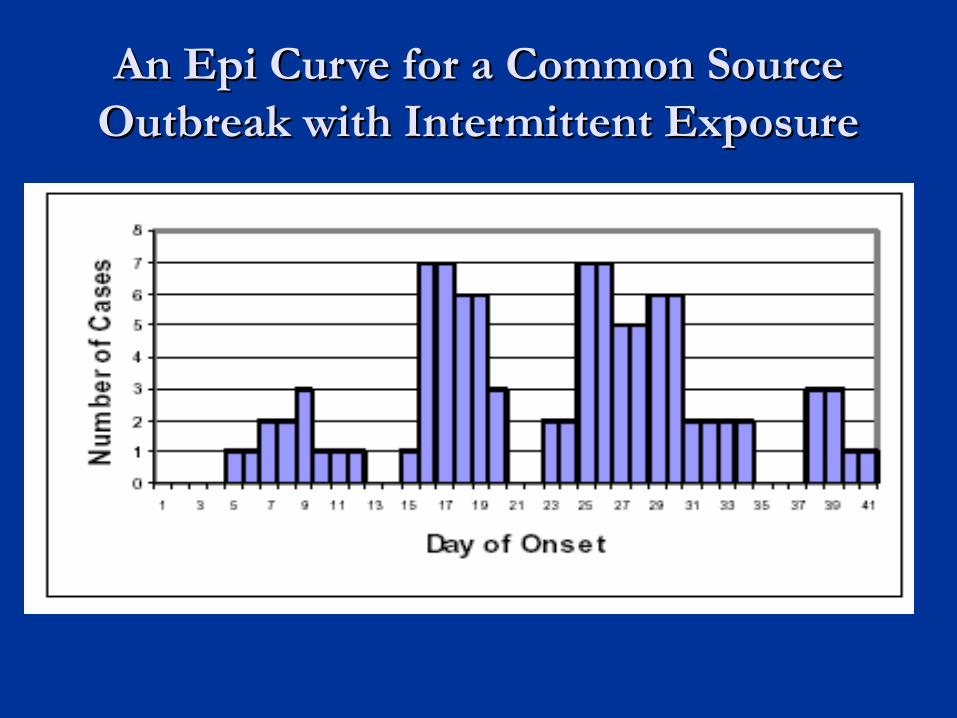
An Epi Curve for a Common Source An Epi Curve for a Common Source Outbreak with Intermittent ExposureOutbreak with Intermittent Exposure
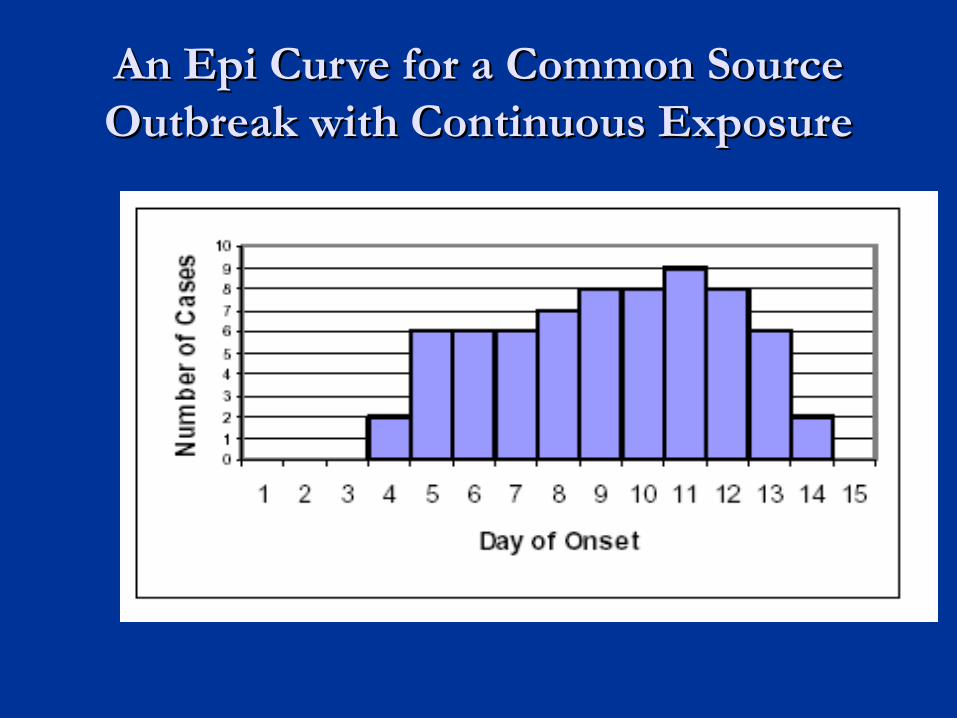
An Epi Curve for a Common Source An Epi Curve for a Common Source Outbreak with Continuous ExposureOutbreak with Continuous Exposure
Point Source Outbreak Point Source Outbreak
Typically shows a sharp upward slope and a Typically shows a sharp upward slope and a gradual downward slopegradual downward slope
Is a common source outbreak in which the Is a common source outbreak in which the period of exposure is brief, and all cases occur period of exposure is brief, and all cases occur within one incubation periodwithin one incubation period
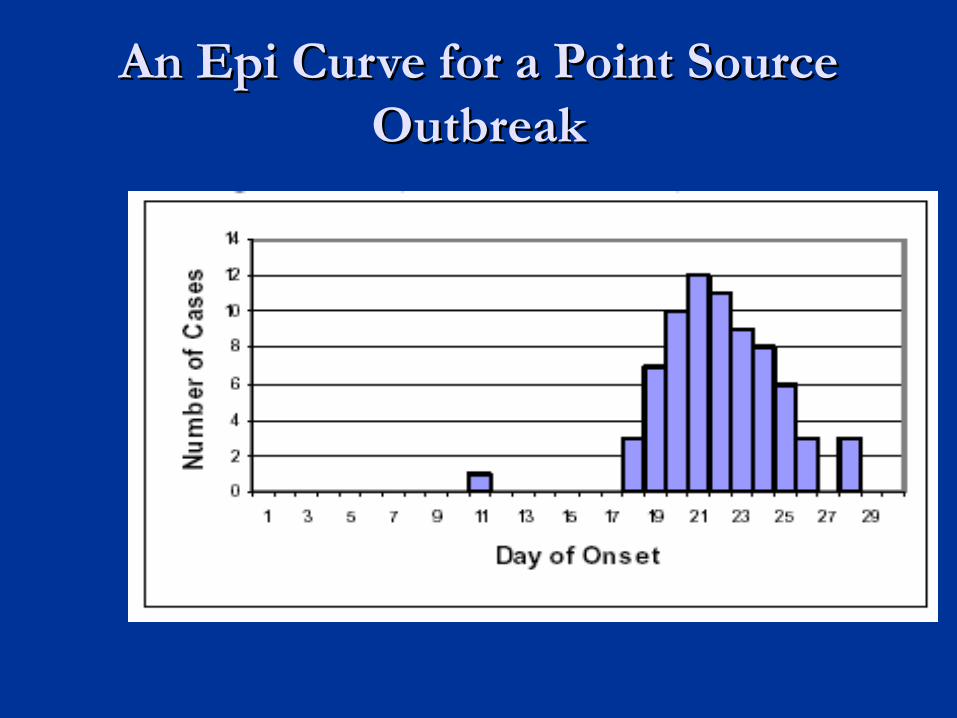
An Epi Curve for a Point Source An Epi Curve for a Point Source OutbreakOutbreak
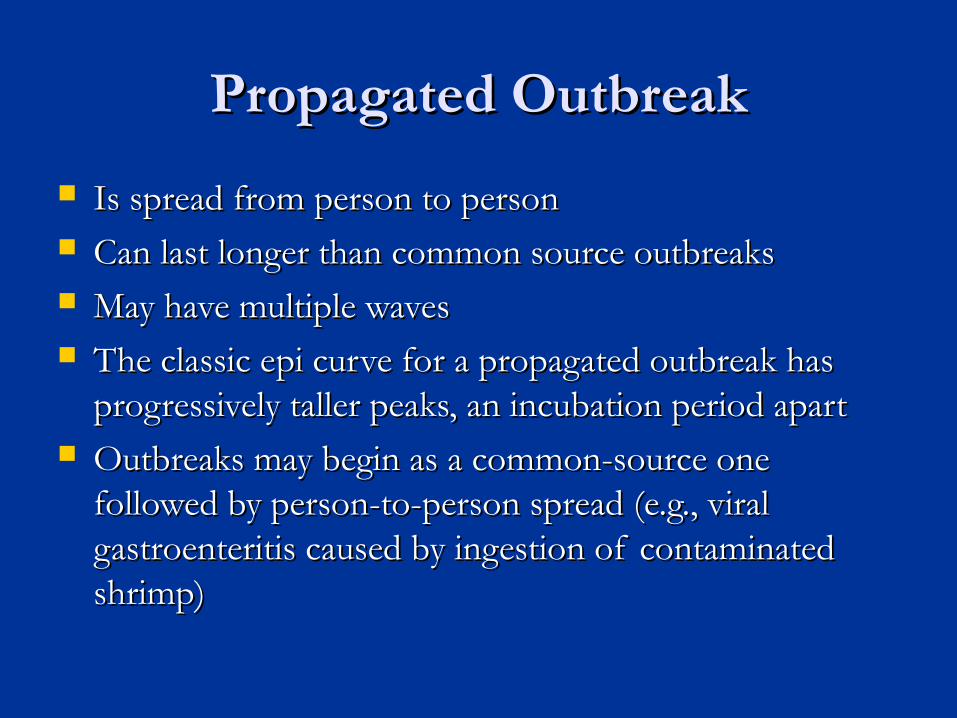
Propagated OutbreakPropagated Outbreak
Is spread from person to personIs spread from person to person Can last longer than common source outbreaksCan last longer than common source outbreaks May have multiple wavesMay have multiple waves The classic epi curve for a propagated outbreak has The classic epi curve for a propagated outbreak has
progressively taller peaks, an incubation period apartprogressively taller peaks, an incubation period apart Outbreaks may begin as a common-source one Outbreaks may begin as a common-source one
followed by person-to-person spread (e.g., viral followed by person-to-person spread (e.g., viral gastroenteritis caused by ingestion of contaminated gastroenteritis caused by ingestion of contaminated shrimp)shrimp)
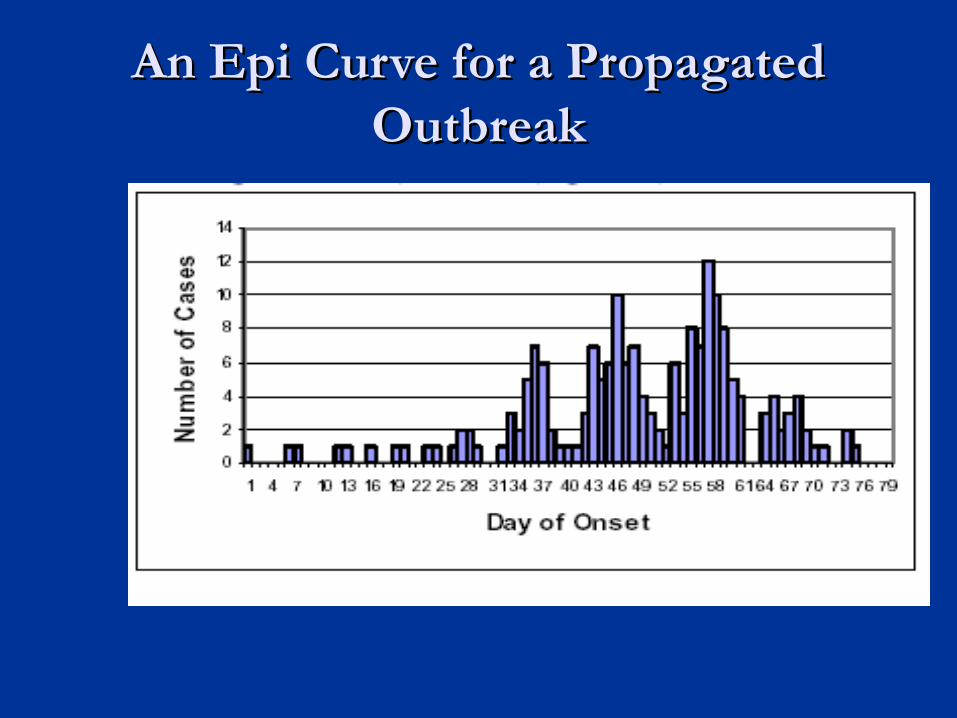
An Epi Curve for a Propagated An Epi Curve for a Propagated OutbreakOutbreak
Outbreak MagnitudeOutbreak Magnitude
Can provide a sense of the magnitude of an Can provide a sense of the magnitude of an outbreakoutbreak
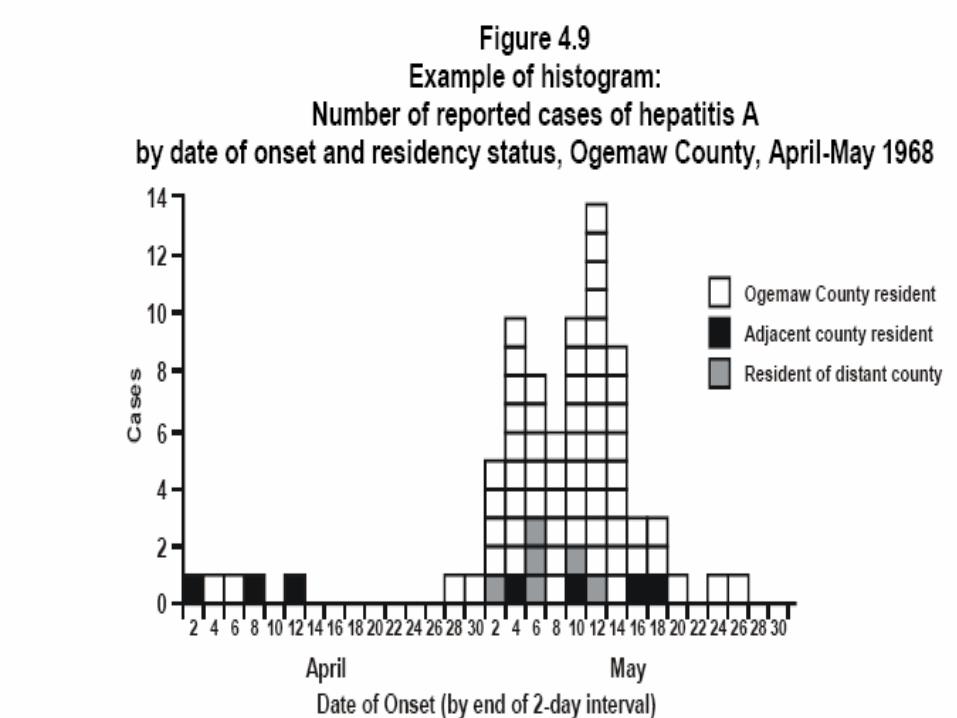
Additional information can be obtained by Additional information can be obtained by stratifying the epi curvestratifying the epi curve Separating the sample into several subsamples Separating the sample into several subsamples
according to specific criteria, e.g. age, gender, & according to specific criteria, e.g. age, gender, & geographic informationgeographic information
Outbreak Time TrendOutbreak Time Trend
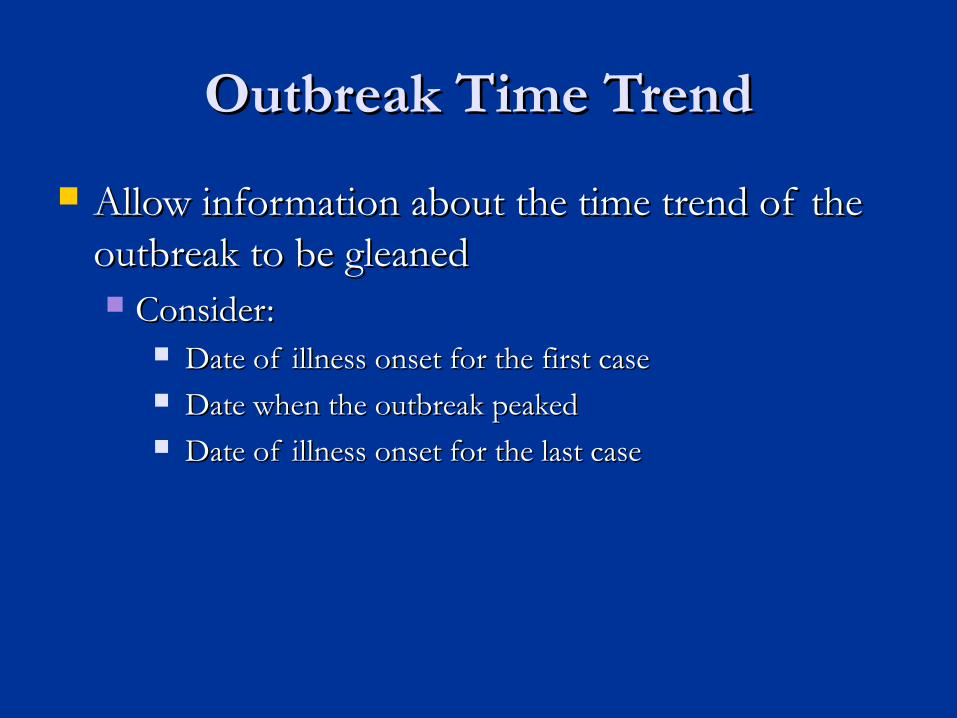
Allow information about the time trend of the Allow information about the time trend of the outbreak to be gleanedoutbreak to be gleaned Consider:Consider:
Date of illness onset for the first caseDate of illness onset for the first case Date when the outbreak peaked Date when the outbreak peaked Date of illness onset for the last caseDate of illness onset for the last case
Outbreak OutliersOutbreak Outliers
Outliers are cases at the very beginning and end Outliers are cases at the very beginning and end that may not appear to be relatedthat may not appear to be related First check to make certain they are not due to a First check to make certain they are not due to a
coding or data entry errorcoding or data entry error
Outbreak OutliersOutbreak Outliers
If they are not an error, they may representIf they are not an error, they may represent Baseline level of illnessBaseline level of illness Outbreak sourceOutbreak source A case exposed earlier than the othersA case exposed earlier than the others An unrelated caseAn unrelated case A case exposed later than the othersA case exposed later than the others A case with a long incubation periodA case with a long incubation period
0
2
4
6
8
10
1 3 5 7 9 11 13 15 17 19 21 23 25 27
Date of onset
Numb
er of
cases
of rub
ella
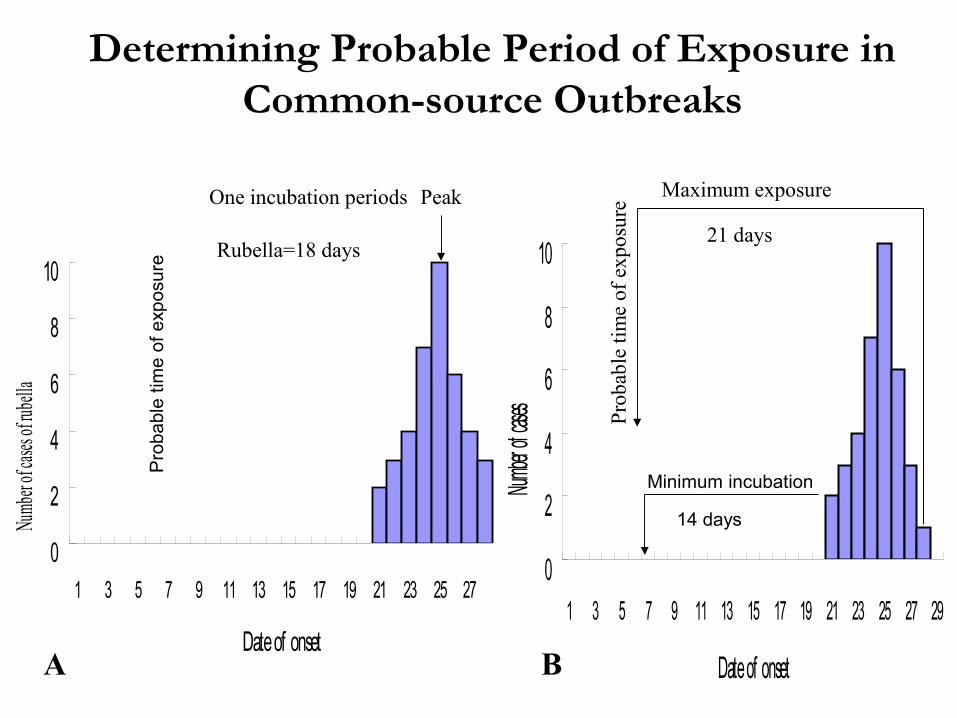
PeakOne incubation periods
Rubella=18 days
Pro
babl
e tim
e of
exp
osur
e
0
2
4
6
8
10
1 3 5 7 9 11 13 15 17 19 21 23 25 27 29
Date of onset
Number
of cases
Minimum incubation
14 days
Maximum exposure
21 days
Pro
babl
e ti
me
of e
xpos
ure
Determining Probable Period of Exposure in Common-source Outbreaks
A B
How do I Make an Epi Curve?How do I Make an Epi Curve?
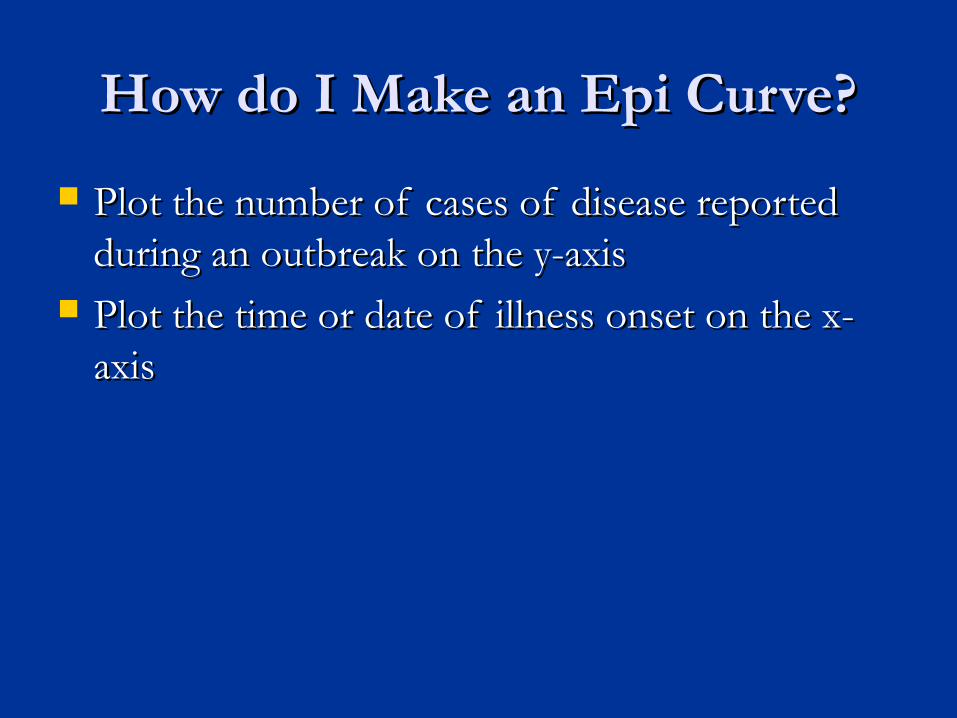
Plot the number of cases of disease reported Plot the number of cases of disease reported during an outbreak on the y-axisduring an outbreak on the y-axis
Plot the time or date of illness onset on the x-Plot the time or date of illness onset on the x-axisaxis
How do I Make an Epi Curve?How do I Make an Epi Curve?
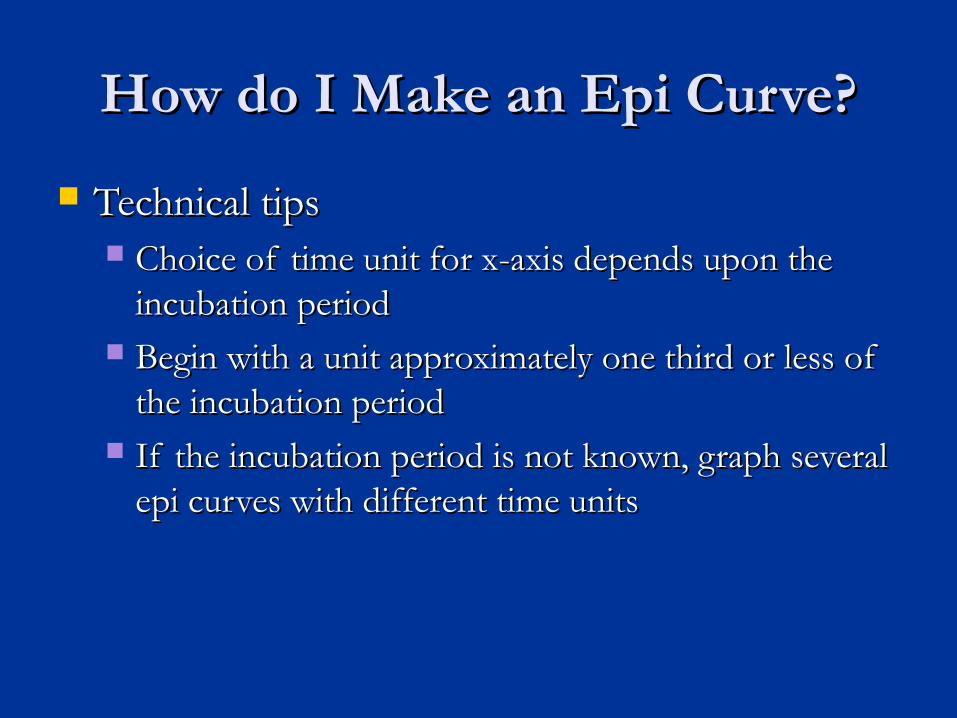
Technical tipsTechnical tips Choice of time unit for x-axis depends upon the Choice of time unit for x-axis depends upon the
incubation periodincubation period Begin with a unit approximately one third or less of Begin with a unit approximately one third or less of
the incubation periodthe incubation period If the incubation period is not known, graph several If the incubation period is not known, graph several
epi curves with different time units epi curves with different time units
How do I Make an Epi Curve?How do I Make an Epi Curve?
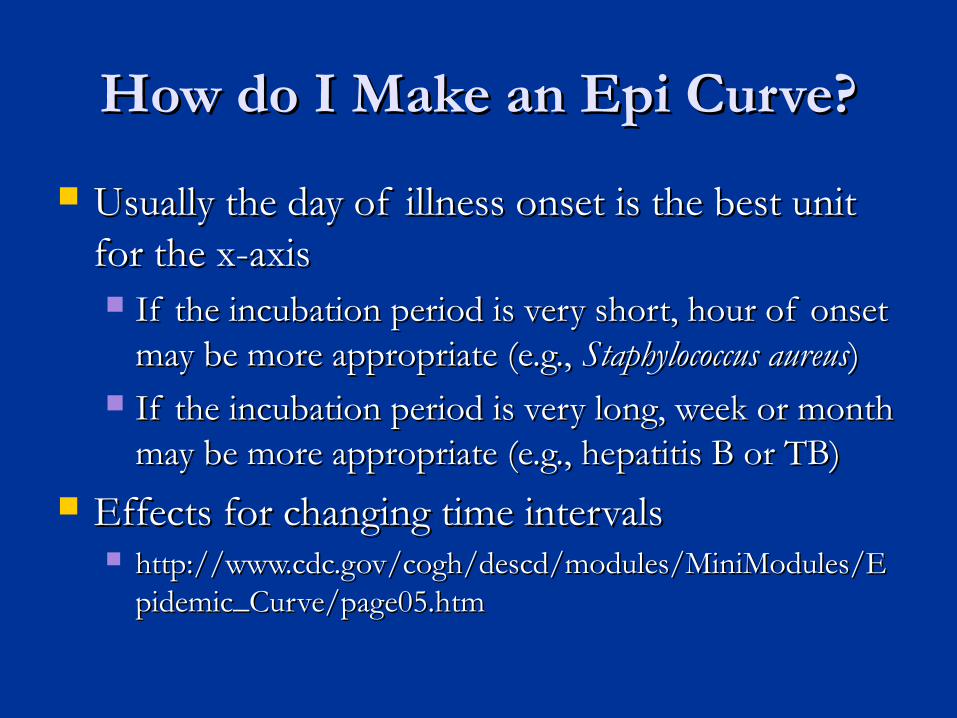
Usually the day of illness onset is the best unit Usually the day of illness onset is the best unit for the x-axis for the x-axis If the incubation period is very short, hour of onset If the incubation period is very short, hour of onset
may be more appropriate (e.g., may be more appropriate (e.g., Staphylococcus aureusStaphylococcus aureus)) If the incubation period is very long, week or month If the incubation period is very long, week or month
may be more appropriate (e.g., hepatitis B or TB)may be more appropriate (e.g., hepatitis B or TB)
Effects for changing time intervalsEffects for changing time intervals http://www.cdc.gov/cogh/descd/modules/MiniModules/Ehttp://www.cdc.gov/cogh/descd/modules/MiniModules/E
pidemic_Curve/page05.htmpidemic_Curve/page05.htm
How do I Make an Epi Curve?How do I Make an Epi Curve?
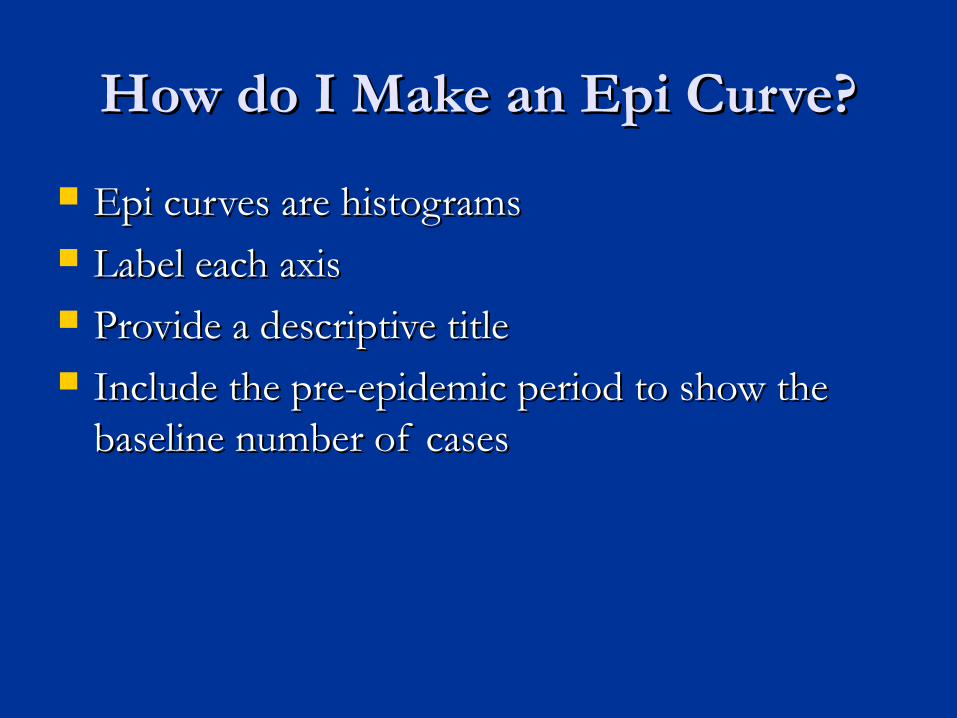
Epi curves are histogramsEpi curves are histograms Label each axis Label each axis Provide a descriptive titleProvide a descriptive title Include the pre-epidemic period to show the Include the pre-epidemic period to show the
baseline number of casesbaseline number of cases
ConclusionConclusion
Epi curves are useful in outbreaks toEpi curves are useful in outbreaks to Identify the pattern of spreadIdentify the pattern of spread Assess the magnitude Assess the magnitude Evaluate time trendsEvaluate time trends Examine OutliersExamine Outliers Estimate the exposure periodEstimate the exposure period
ReferencesReferences
1.1. CDC. Epidemic CurveCDC. Epidemic Curve http://www.cdc.gov/cogh/descd/modules/MiniModules/http://www.cdc.gov/cogh/descd/modules/MiniModules/
Epidemic_Curve/page01.htmEpidemic_Curve/page01.htm
1.1. North Carolina Center for Public Health North Carolina Center for Public Health Preparedness. Epidemic Curves AheadPreparedness. Epidemic Curves Ahead
http://www.sph.unc.edu/nccphp/focus/vol1/issue5/indexhttp://www.sph.unc.edu/nccphp/focus/vol1/issue5/index.htm.htm
1.1. CDC. Principles of Epidemiology, 2nd Edition. CDC. Principles of Epidemiology, 2nd Edition. Atlanta, GA: Public Health Practice Program Office, Atlanta, GA: Public Health Practice Program Office, 1992.1992.
http://www.phppo.cdc.gov/PHTN/catalog/pdf-http://www.phppo.cdc.gov/PHTN/catalog/pdf-file/Epi_Course.pdffile/Epi_Course.pdf