Embed Size (px)
DESCRIPTION
Citation preview

Health and Community Design
Health and Community Design

Overweight is EpidemicRates in Adults
Overweight is EpidemicRates in Adults
2/3rds of American adults are overweight
In 1991 rates were 45% (almost 50% increase in 15 yrs)
(
Obesity Trends* Among U.S. AdultsBRFSS, 1985
Obesity Trends* Among U.S. AdultsBRFSS, 1985
No Data <10% 10%–14%
(*BMI ≥30, or ~ 30 lbs overweight for 5’ 4” person)
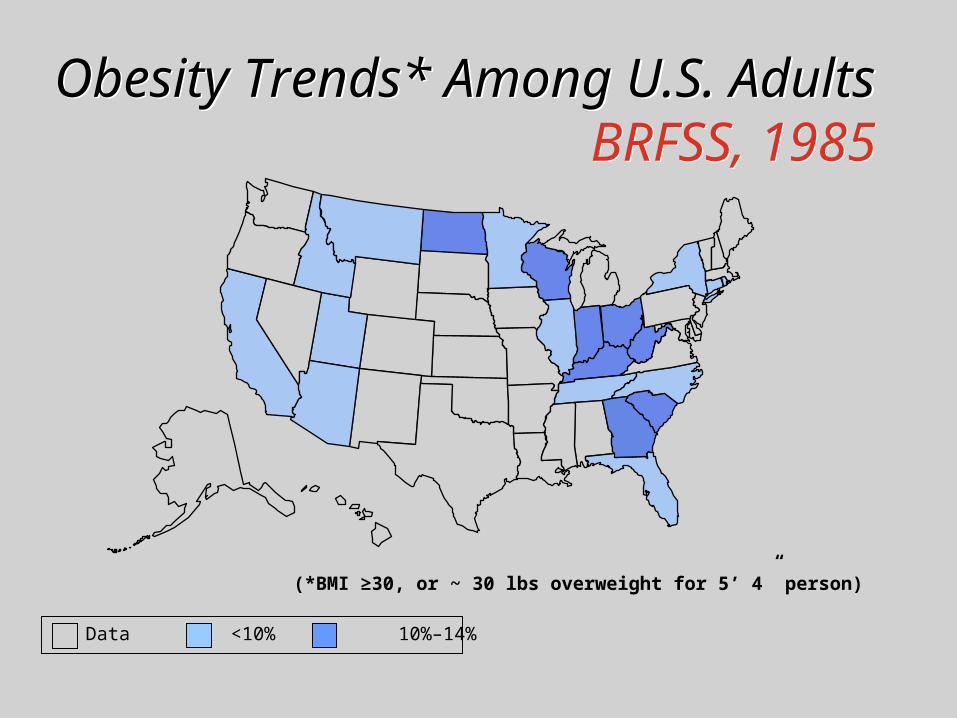
Obesity Trends* Among U.S. Adults
BRFSS, 1989
Obesity Trends* Among U.S. Adults
BRFSS, 1989
No Data <10% 10%–14%
(*BMI ≥30, or ~ 30 lbs overweight for 5’ 4” person)
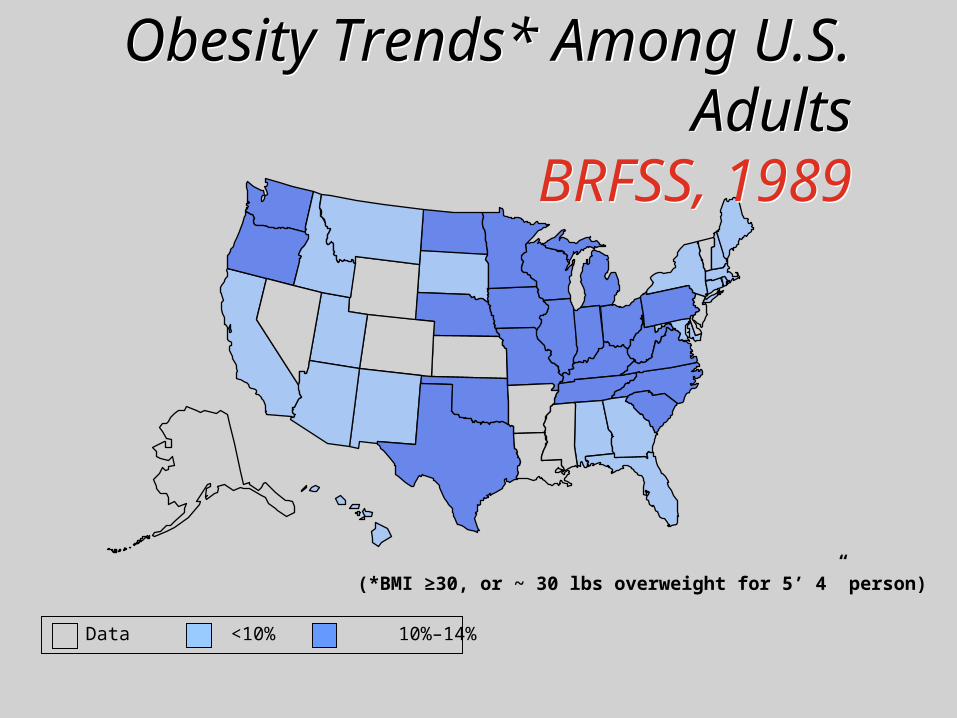
Obesity Trends* Among U.S. Adults
BRFSS, 1993
Obesity Trends* Among U.S. Adults
BRFSS, 1993
No Data <10% 10%–14% 15%–19%
(*BMI ≥30, or ~ 30 lbs overweight for 5’ 4” person)
Obesity Trends* Among U.S. Adults
BRFSS, 1997
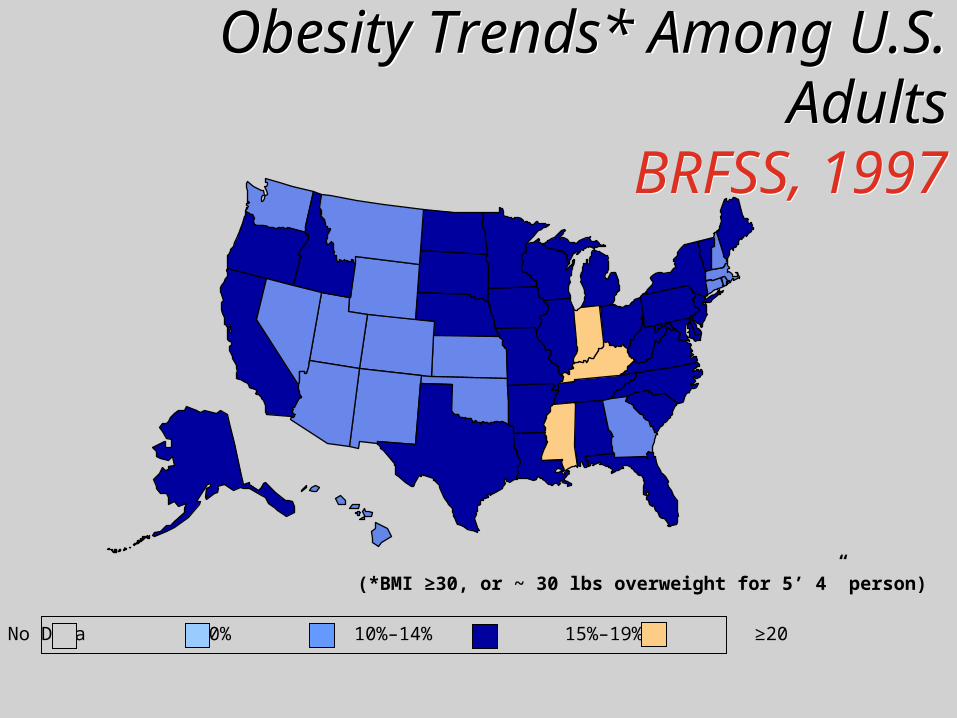
Obesity Trends* Among U.S. Adults
BRFSS, 1997
No Data <10% 10%–14% 15%–19% ≥20
(*BMI ≥30, or ~ 30 lbs overweight for 5’ 4” person)

Obesity Trends* Among U.S. Adults
BRFSS, 2000
Obesity Trends* Among U.S. Adults
BRFSS, 2000
No Data <10% 10%–14% 15%–19% ≥20
(*BMI ≥30, or ~ 30 lbs overweight for 5’ 4” person)
(*BMI 30, or ~ 30 lbs overweight for 5’4” person)
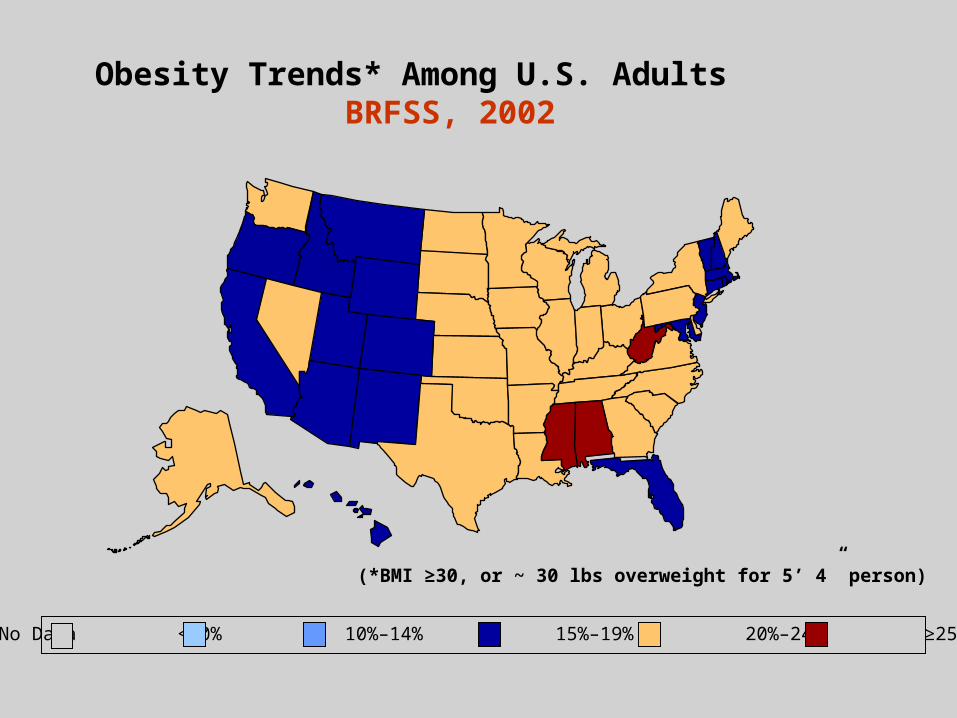
No Data <10% 10%–14% 15%–19% 20%–24% ≥25%
(*BMI ≥30, or ~ 30 lbs overweight for 5’ 4” person)
Obesity Trends* Among U.S. Adults BRFSS, 2002
Obesity Trends* Among U.S. Adults
BRFSS, 2004
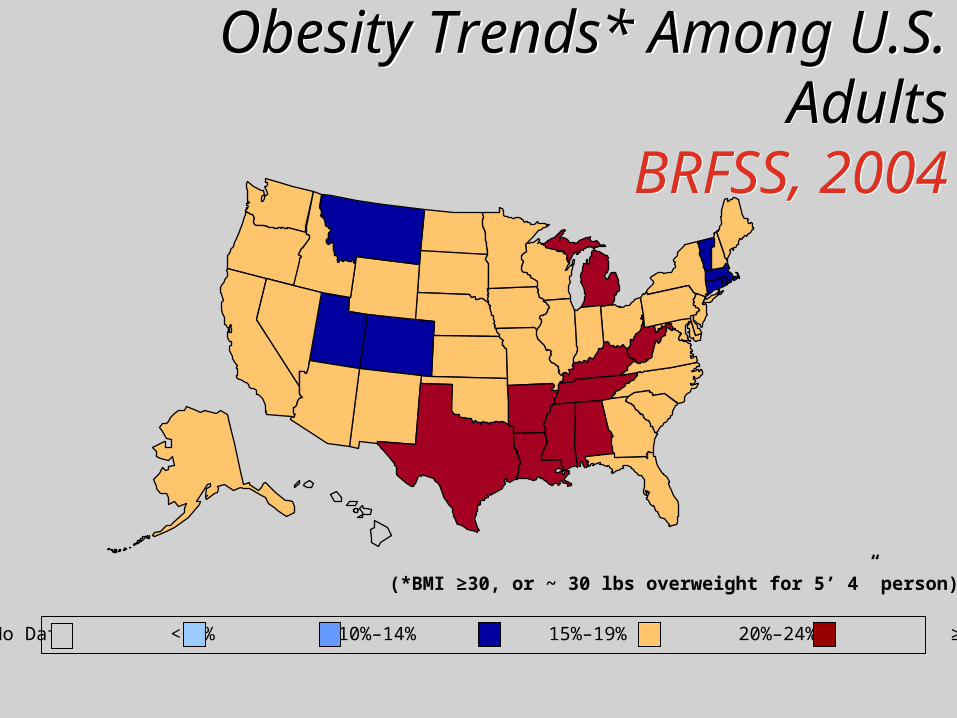
Obesity Trends* Among U.S. Adults
BRFSS, 2004
No Data <10% 10%–14% 15%–19% 20%–24% ≥25%
(*BMI ≥30, or ~ 30 lbs overweight for 5’ 4” person)

OBESITY Risk Factors for the Chronic Disease
OBESITY Risk Factors for the Chronic Disease
Cardiovascular Stroke Endocrine Orthopedic Pulmonary Hepatic Psychosocial
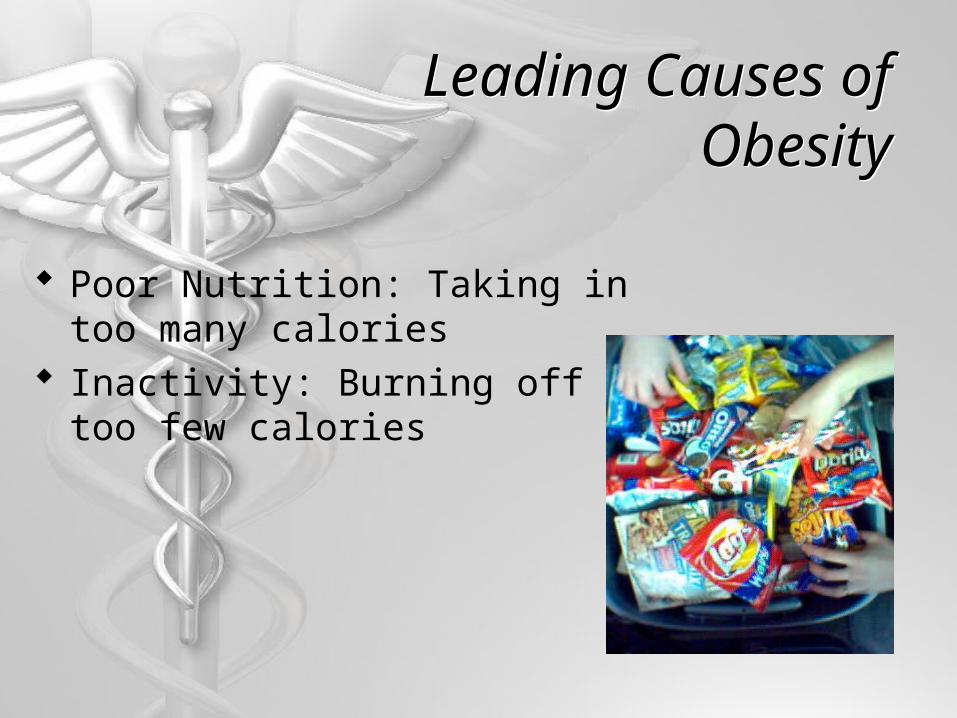
Leading Causes of ObesityLeading Causes of Obesity
Poor Nutrition: Taking in too many calories
Inactivity: Burning off too few calories

Poor NutritionPoor Nutrition
Fast Food Five-fold increase since 1970 1/3 of US kids eat daily
Super-size me Portion sizes
Sugars and Refined Flours Soda consumption has doubled in 20 years
Processed Foods Higher in calories, fat and salt
Irregular Meal Patterns

Physical InactivityPhysical
Inactivity
25% of adults are sedentary
60% of adults not active enough
78% of kids don’t meet physical activity requirements.
Electronic Media & Kids 5 ½ hrs/day 2 hrs more if
computer/TV in room
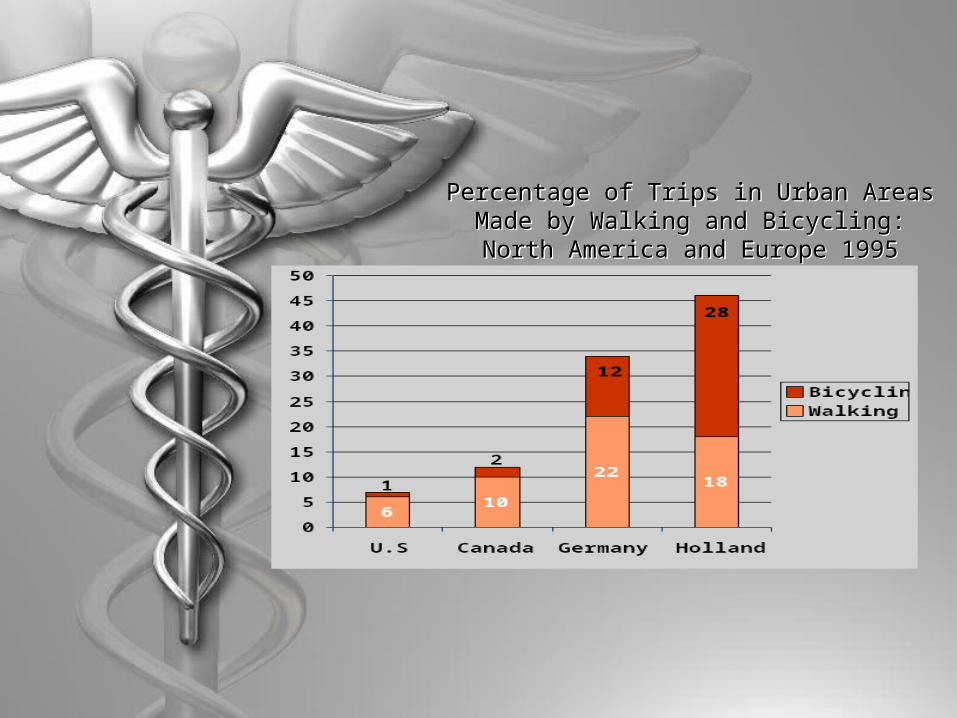
Percentage of Trips in Urban Areas Made by Walking and Bicycling: North America and
Europe 1995
Percentage of Trips in Urban Areas Made by Walking and Bicycling: North America and
Europe 1995
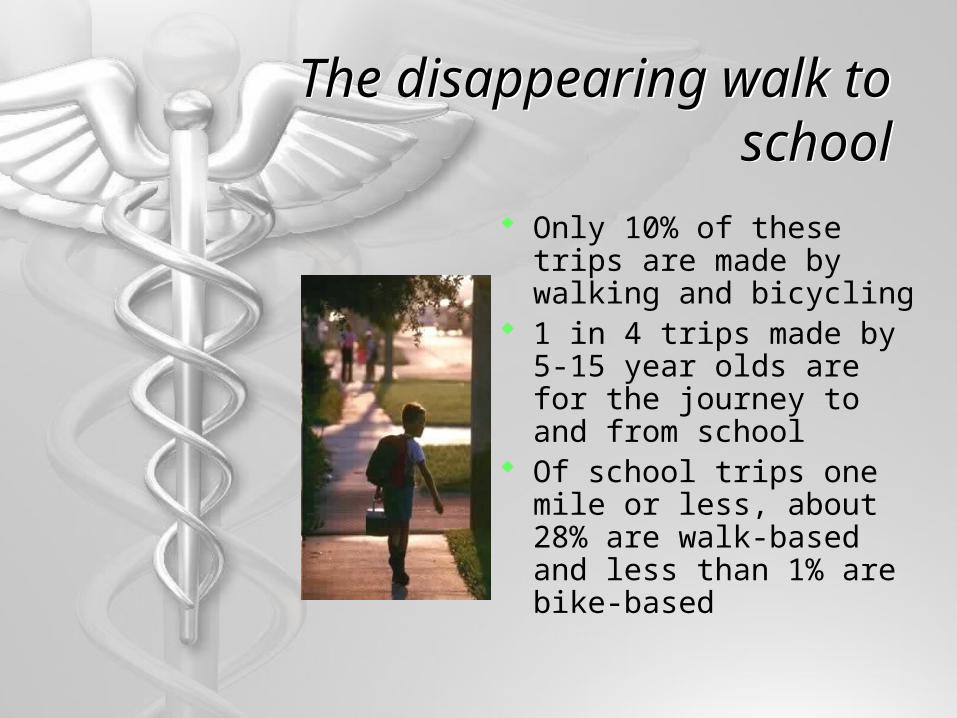
The disappearing walk to school
The disappearing walk to school
Only 10% of these trips are made by walking and bicycling
1 in 4 trips made by 5-15 year olds are for the journey to and from school
Of school trips one mile or less, about 28% are walk-based and less than 1% are bike-based

Parents feel that streets aretoo dangerous
Parents drive theirchildren to school
Traffic increases
Parents feel that streets aretoo dangerous
Traffic increases
Fewer children walk andbicycle to school
The Vicious Cycle
20% to 30% of morning peak traffic is parents driving kids to school
20% to 30% of morning peak traffic is parents driving kids to school

Increasing Vehicle Travel
Increasing Vehicle Travel
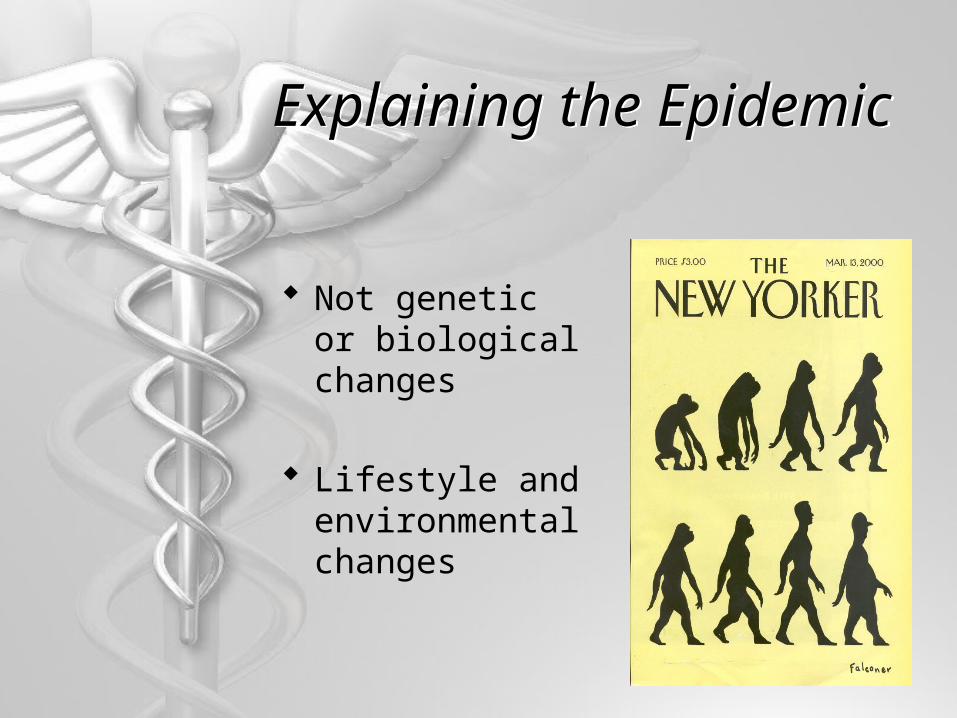
Explaining the Epidemic
Explaining the Epidemic
Not genetic or biological changes
Lifestyle and environmental changes


Improving Health through
Community Design
Improving Health through
Community Design
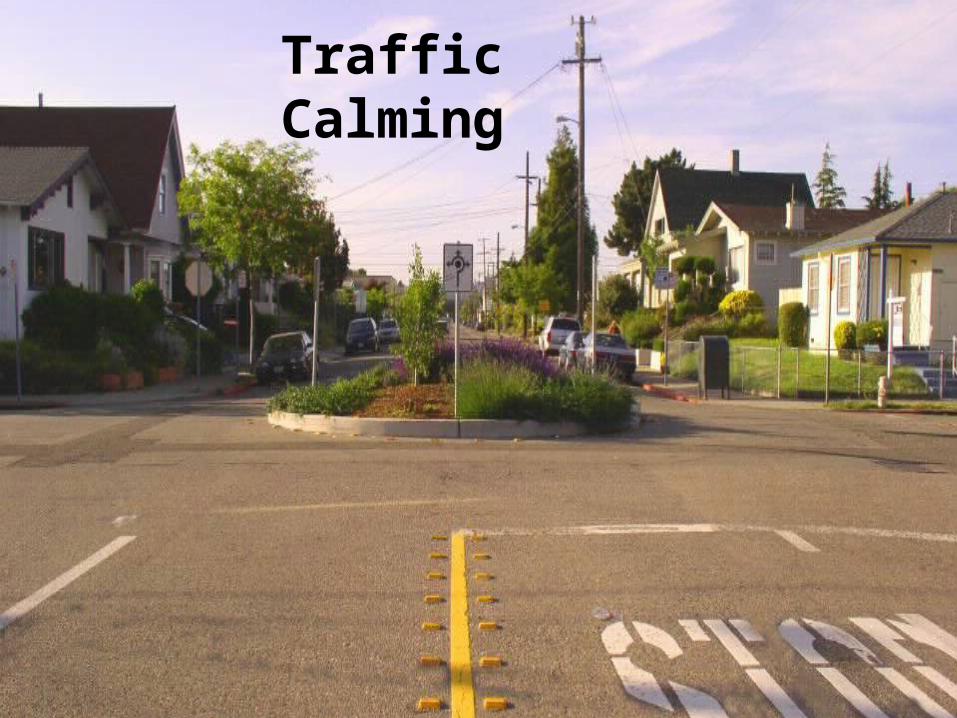
Traffic Calming

Street Lighting
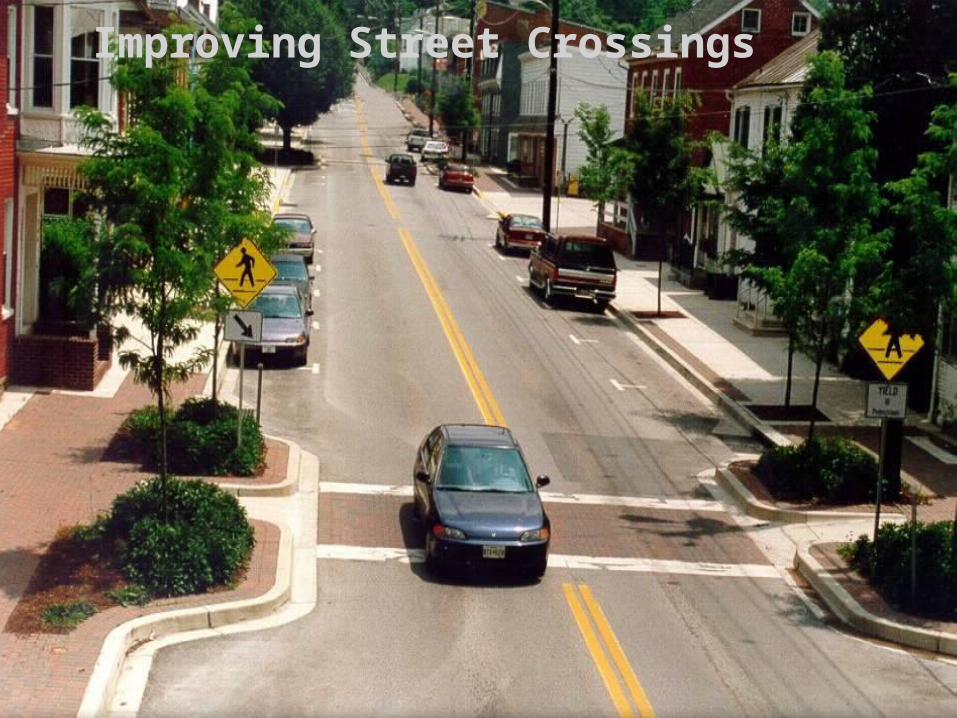
Improving Street Crossings
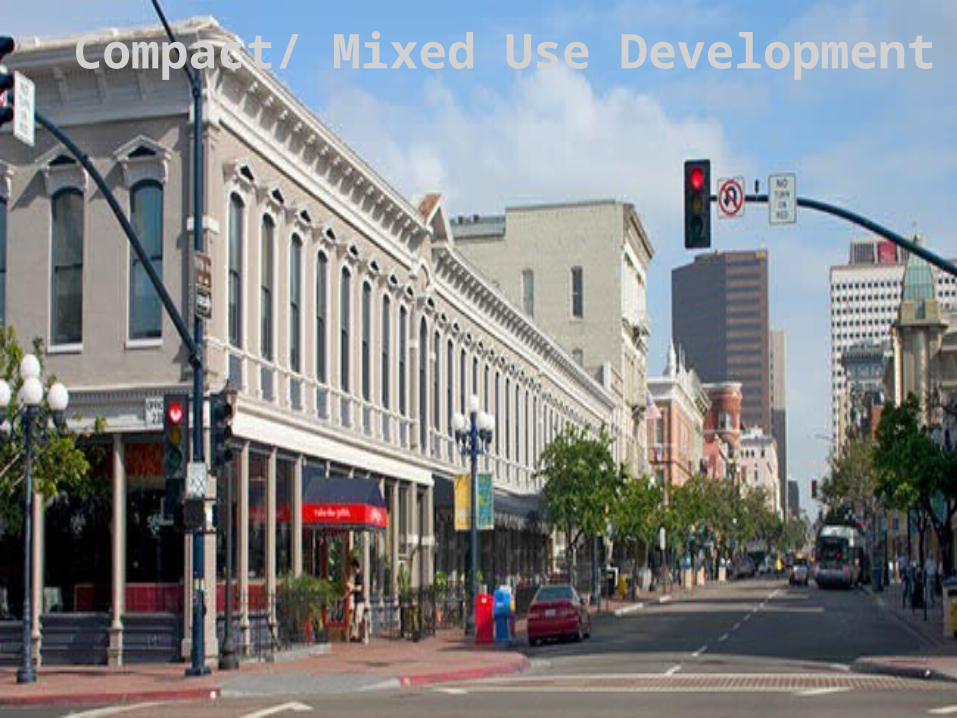
Compact/ Mixed Use Development
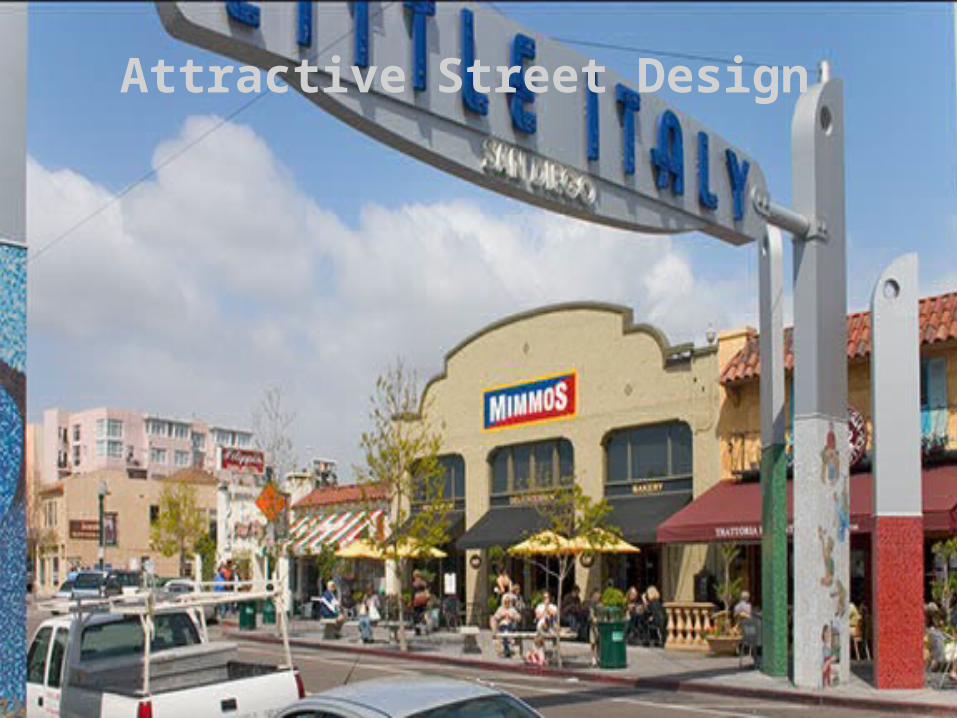
Attractive Street Design

Street Design & Connectivity
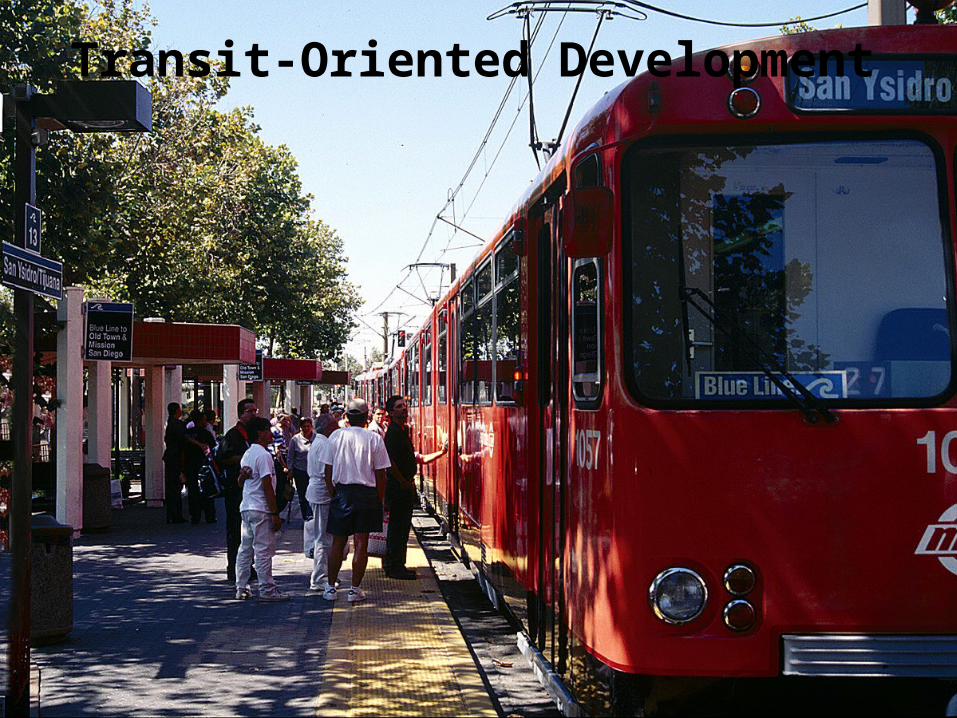
Transit-Oriented Development
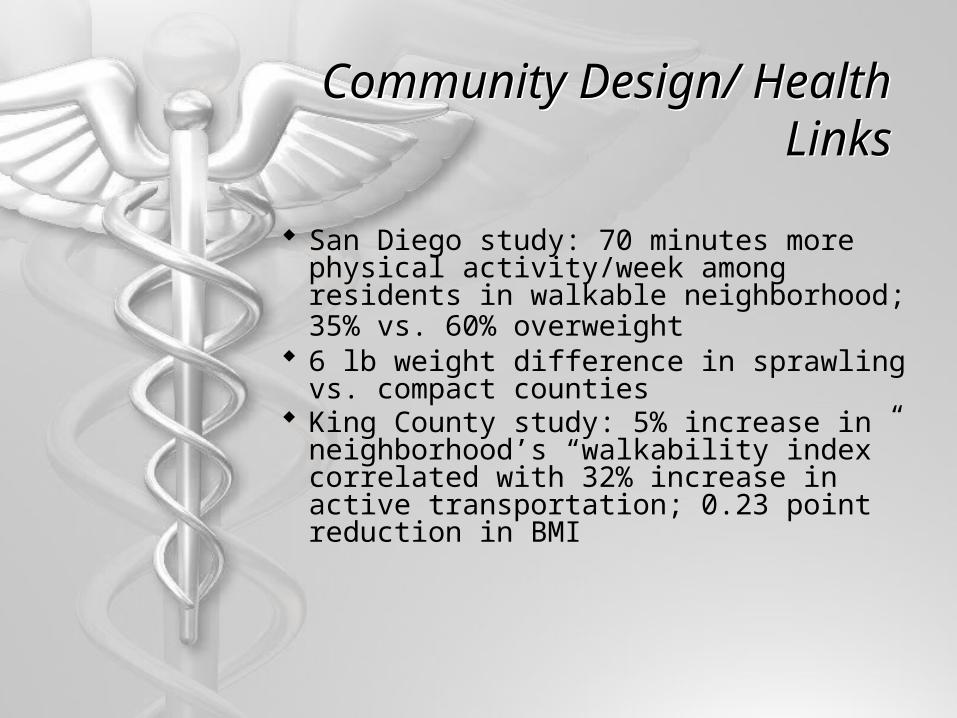
Community Design/ Health Links
Community Design/ Health Links
San Diego study: 70 minutes more physical activity/week among residents in walkable neighborhood; 35% vs. 60% overweight
6 lb weight difference in sprawling vs. compact counties
King County study: 5% increase in neighborhood’s “walkability index” correlated with 32% increase in active transportation; 0.23 point reduction in BMI
Expanding our Roles and Vision
Urban planners, Transportation Engineers and Architects:
Have a critical role in public health
**************
Public Health needs to appreciate the built environment influences public health as much as vaccines or water quality.
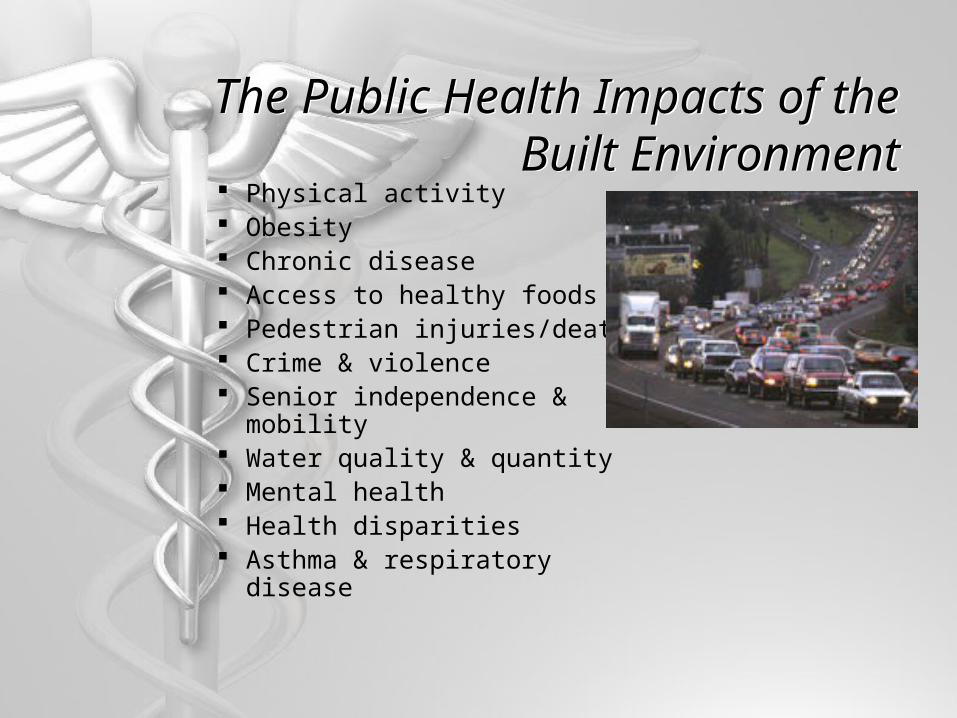
The Public Health Impacts of the Built Environment
The Public Health Impacts of the Built Environment
Physical activity Obesity Chronic disease Access to healthy foods Pedestrian injuries/death Crime & violence Senior independence & mobility Water quality & quantity Mental health Health disparities Asthma & respiratory disease
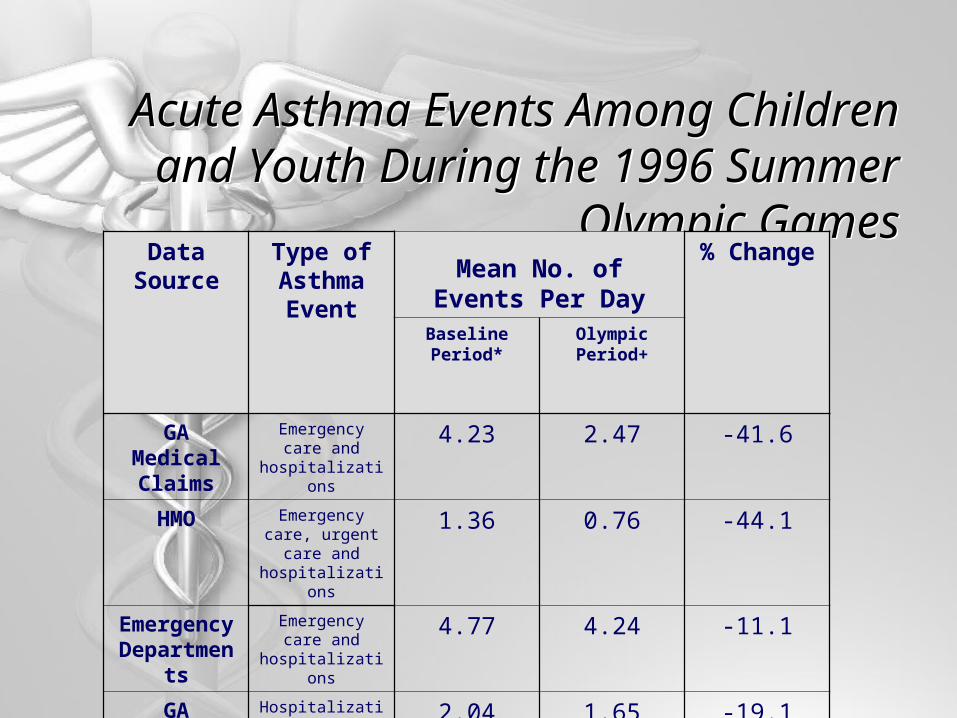
Acute Asthma Events Among Children and Youth During the 1996 Summer Olympic
Games
Acute Asthma Events Among Children and Youth During the 1996 Summer Olympic
GamesData
SourceType of Asthma Event
Mean No. of Events Per Day
% Change
Baseline Period*
Olympic Period+
GA Medical Claims
Emergency care and
hospitalizations
4.23 2.47 -41.6
HMO Emergency care, urgent care and hospitalizations
1.36 0.76 -44.1
Emergency Department
s
Emergency care and
hospitalizations
4.77 4.24 -11.1
GA Hospital Discharges
Hospitalizations 2.04 1.65 -19.1

Best Practices Best Practices

King County, WashingtonKing County, Washington
King County pursues aggressive “smart growth: strategies:
Land Use- combating sprawl and building healthier communities.
Public transportation- getting more people onto leaner, greener busses.
Environmental management- turning waste into energy
Clean energy future- stimulating climate-friendly fuel and technology markets for a prosperous, sustainable economy.
Ron Sims, King County Executive

Health & Transportation departments collaborated
Commissioned study on health/transportation links
The first Comprehensive Plan with physical activity/health as a goal and policies in the Urban Form and Transportation Elements
Seattle, Washington
Health as a General Plan Goal in King County, WA
Health as a General Plan Goal in King County, WA

Los Angeles CountyLos Angeles County LAC Public Health and Regional Planning
Directors have agreed to have their staff work collaboratively on General Plan
Policies supporting healthy, livable communities have been incorporated into the Draft Preliminary General Plan
Review/revise zoning ordinances to ensure they are in support of new general plan
Public Health input into proposed new developments at Regional Planning’s subdivision committee meetings and EIR reviews
What Can Cities Do? What Can Cities Do?
Include health objectives in general plans
Add a health element to the general plan
Get Public Health input projects and updates
Update zoning codes to allow compact, mixed use
Update street design standards
Dedicate/Increase funds for active transportation
Integrate Health into General Plan
Integrate Health into General Plan
Health as explicit goal
Provide comprehensive definition of health
Link health and policies that support walkable, livable communities and smart growth

Models in CaliforniaModels in California
Chula Vista
Richmond
Chino
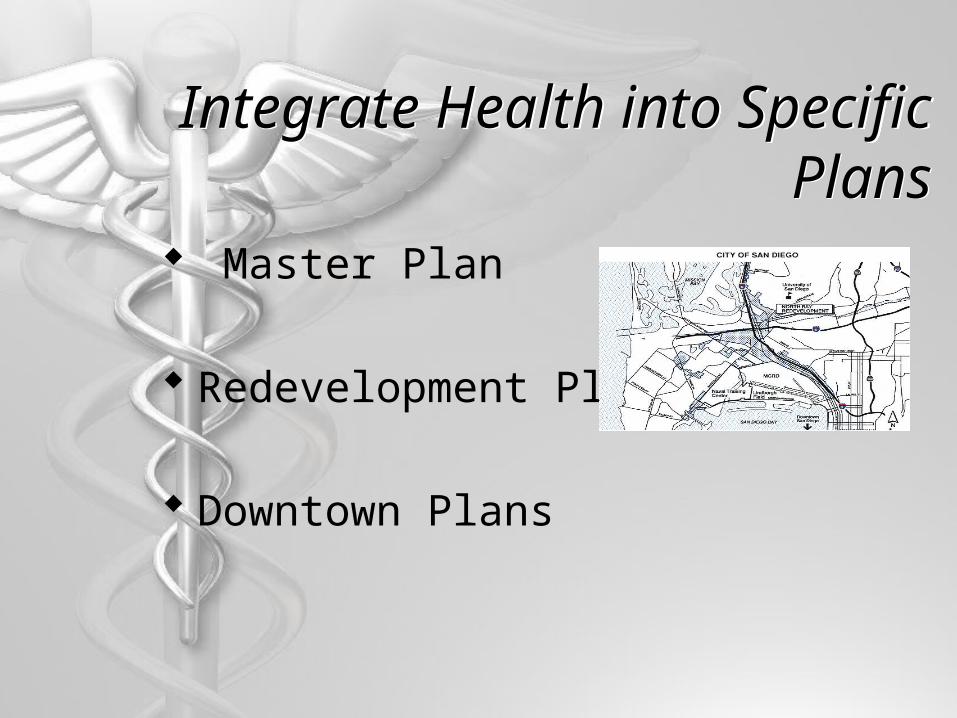
Integrate Health into Specific Plans
Integrate Health into Specific Plans
Master Plan
Redevelopment Plans
Downtown Plans

California Assembly Bill 437
California Assembly Bill 437
Authorizes the county health officer to provide assistance to cities and
counties with local land use planning and transportation planning processes
as they relate to public health.