Embed Size (px)
Citation preview
Creating a Map usingGIS WebsitesEstephanie Mosquera-Ortiz
Explanation of Slides to Come On the following slides we will see two
different maps zoomed in on Central Florida.
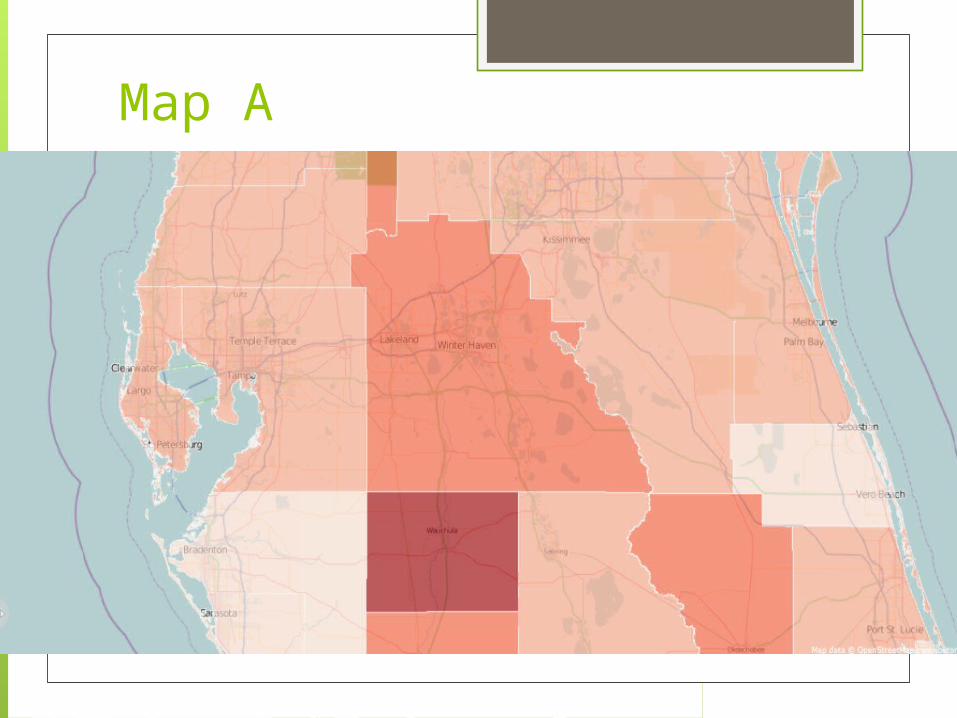
Map A will show you the percentage of the population that are obese in the each county.
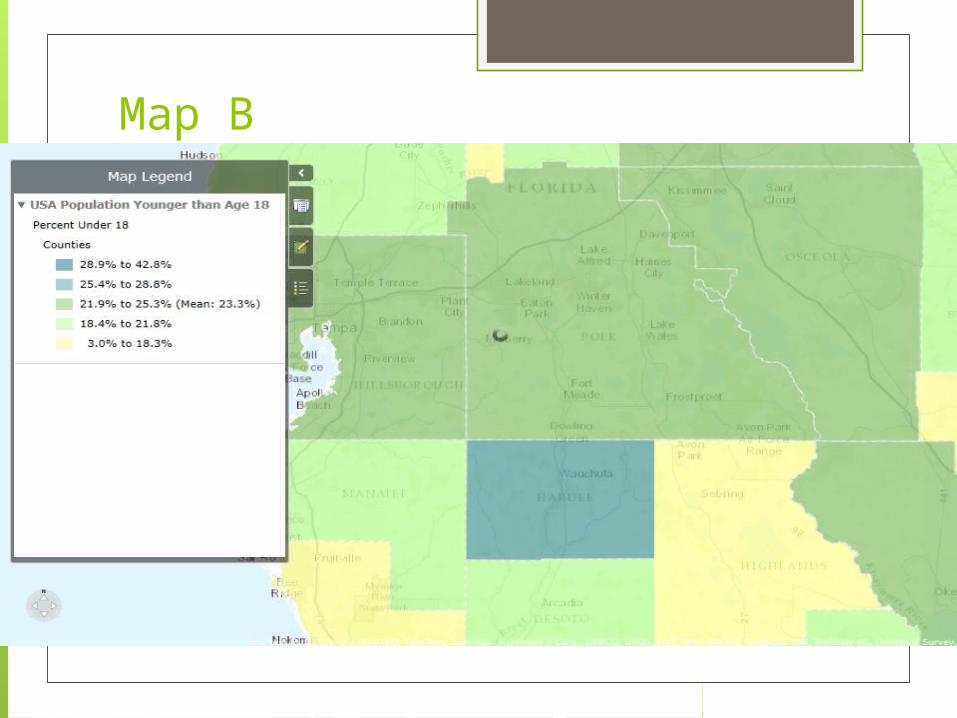
Map B will show you the percentage of the population that are under age 18 in the same counties…
Map A
Map B
Summary Upon analyzing both maps one can draw several
conclusions relating to health conditions of this area. It appears to be that the county with the highest
population of people age 18 and under is also the population that struggles the most with obesity.
Another analysis that can be made is that the counties further from the center of Florida (such as counties close to the shore) have a smaller obesity rate.
Finally one can also conclude that children may be a significant part of the population that faces obesity because in the majority of counties at least 18.4-21.8% of the population are under age 18.


![Assign Warga Tua- Edit[1]](https://img.pdfslide.tips/doc/110x75/55cf9bd2550346d033a77ef0/assign-warga-tua-edit1.jpg)