Embed Size (px)
Citation preview

1
Q4 2015 Earnings Conference Call

3
Safe Harbor
Forward-Looking Statements
All presentations contain certain forward-looking information within the meaning of the Private Securities Litigation Reform
Act of 1995. The words “may,” “will,” “expect,” “intend,” “estimate,” “anticipate,” “aspiration,” “objective,” “project,” “believe,”
“continue,” “on track” or “target” or the negative thereof and similar expressions, among others, identify forward-looking
statements. All forward looking statements are based on information currently available to management. Such forward-
looking statements are subject to certain risks and uncertainties that could cause events and the Company’s actual results to
differ materially from those expressed or implied. Please see the disclosure regarding forward-looking statements
immediately preceding Part I of the Company’s Annual Report on the most recently filed Form 10-K. The company assumes no
obligation to update any forward-looking statements.
Regulation G
These presentations may include certain non-GAAP financial measures like EBITDA and other measures that exclude special
items such as restructuring and other unusual charges and gains that are volatile from period to period. Management of the
company uses the non-GAAP measures to evaluate ongoing operations and believes that these non-GAAP measures are
useful to enable investors to perform meaningful comparisons of current and historical performance of the company. All non-
GAAP data in the presentation are indicated by footnotes. Tables showing the reconciliation between GAAP and non-GAAP
measures are available at the end of this presentation and on the Greif website at www.greif.com.
3

4
Agenda
Q4 and Full Year 2015 Overview & Transformation Highlights
Business Performance
Financial Results
2016 guidance
4
5
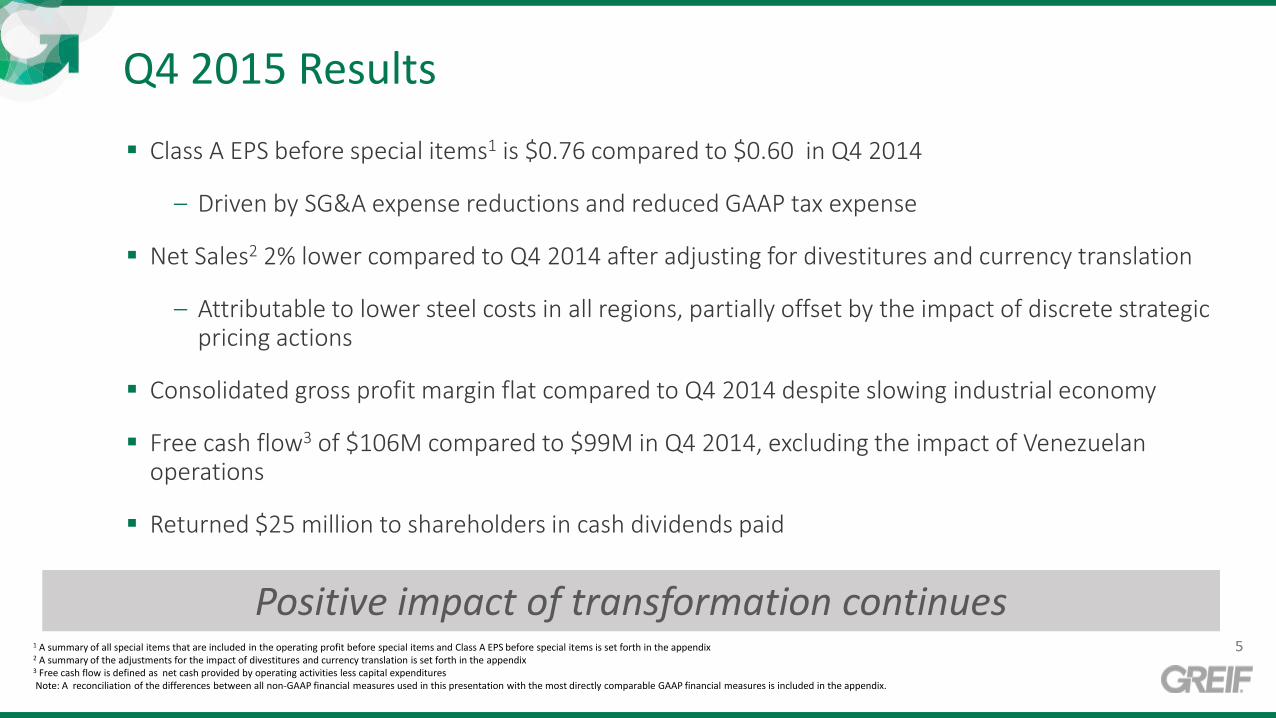
Q4 2015 Results
Class A EPS before special items1 is $0.76 compared to $0.60 in Q4 2014
‒ Driven by SG&A expense reductions and reduced GAAP tax expense
Net Sales2 2% lower compared to Q4 2014 after adjusting for divestitures and currency translation
‒ Attributable to lower steel costs in all regions, partially offset by the impact of discrete strategic pricing actions
Consolidated gross profit margin flat compared to Q4 2014 despite slowing industrial economy
Free cash flow3 of $106M compared to $99M in Q4 2014, excluding the impact of Venezuelan operations
Returned $25 million to shareholders in cash dividends paid
Positive impact of transformation continues
1 A summary of all special items that are included in the operating profit before special items and Class A EPS before special items is set forth in the appendix 2 A summary of the adjustments for the impact of divestitures and currency translation is set forth in the appendix 3 Free cash flow is defined as net cash provided by operating activities less capital expenditures Note: A reconciliation of the differences between all non-GAAP financial measures used in this presentation with the most directly comparable GAAP financial measures is included in the appendix.
5

6
Full Year 2015 Results
Class A EPS before special items1 is $2.18 compared to $2.23 in 2014
Net Sales2 flat compared to 2014 after adjusting for divestitures and currency translation
SG&A expense reduced $84M compared to 2014
Significantly decreased GAAP tax expense
Free cash flow3 of $80M compared to $119M in 2014, excluding the impact of Venezuelan operations
‒ Reduced by cash payment of taxes of approximately $20M related to prior year business sale
Returned $99 million to shareholders in cash dividends paid
Laying the foundation to generate enhanced returns 6
1 A summary of all special items that are included in the operating profit before special items and Class A EPS before special items is set forth in the appendix 2 A summary of the adjustments for the impact of divestitures and currency translation is set forth in the appendix 3 Free cash flow is defined as net cash provided by operating activities less capital expenditures Note: A reconciliation of the differences between all non-GAAP financial measures used in this presentation with the most directly comparable GAAP financial measures is included in the appendix.
7
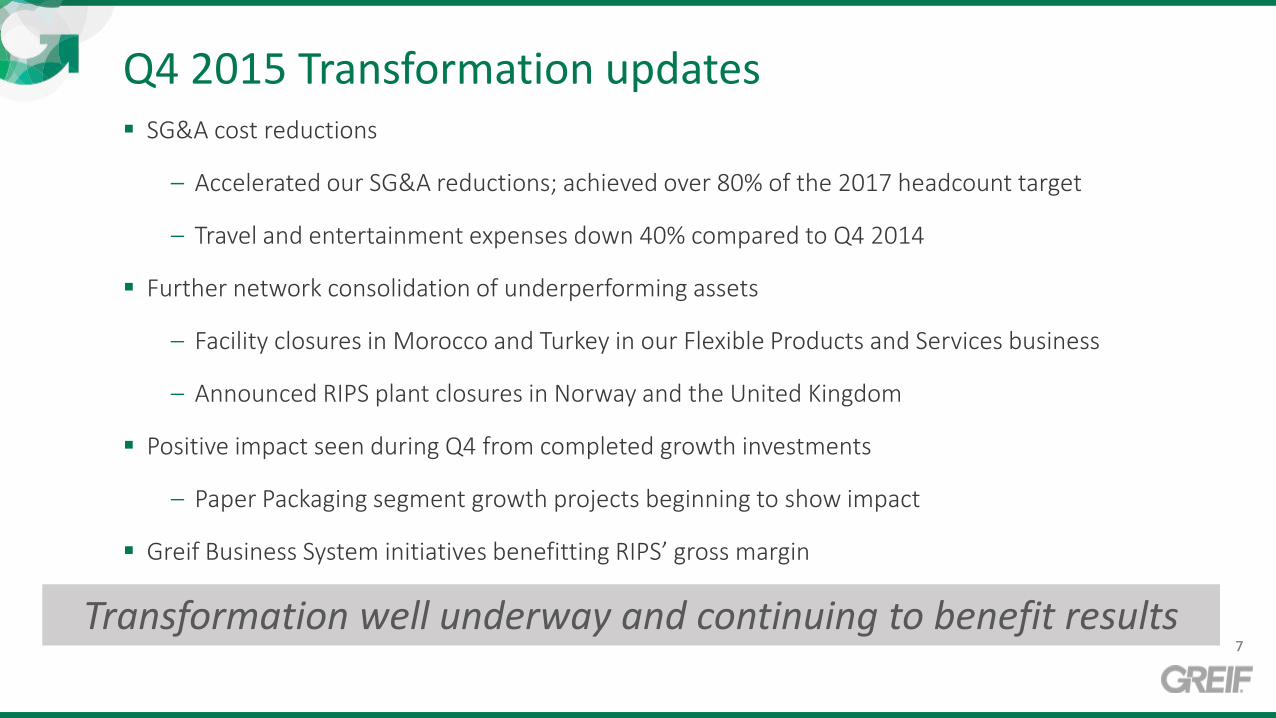
Q4 2015 Transformation updates SG&A cost reductions
‒ Accelerated our SG&A reductions; achieved over 80% of the 2017 headcount target
‒ Travel and entertainment expenses down 40% compared to Q4 2014
Further network consolidation of underperforming assets
‒ Facility closures in Morocco and Turkey in our Flexible Products and Services business
‒ Announced RIPS plant closures in Norway and the United Kingdom
Positive impact seen during Q4 from completed growth investments
‒ Paper Packaging segment growth projects beginning to show impact
Greif Business System initiatives benefitting RIPS’ gross margin
7
Transformation well underway and continuing to benefit results
8
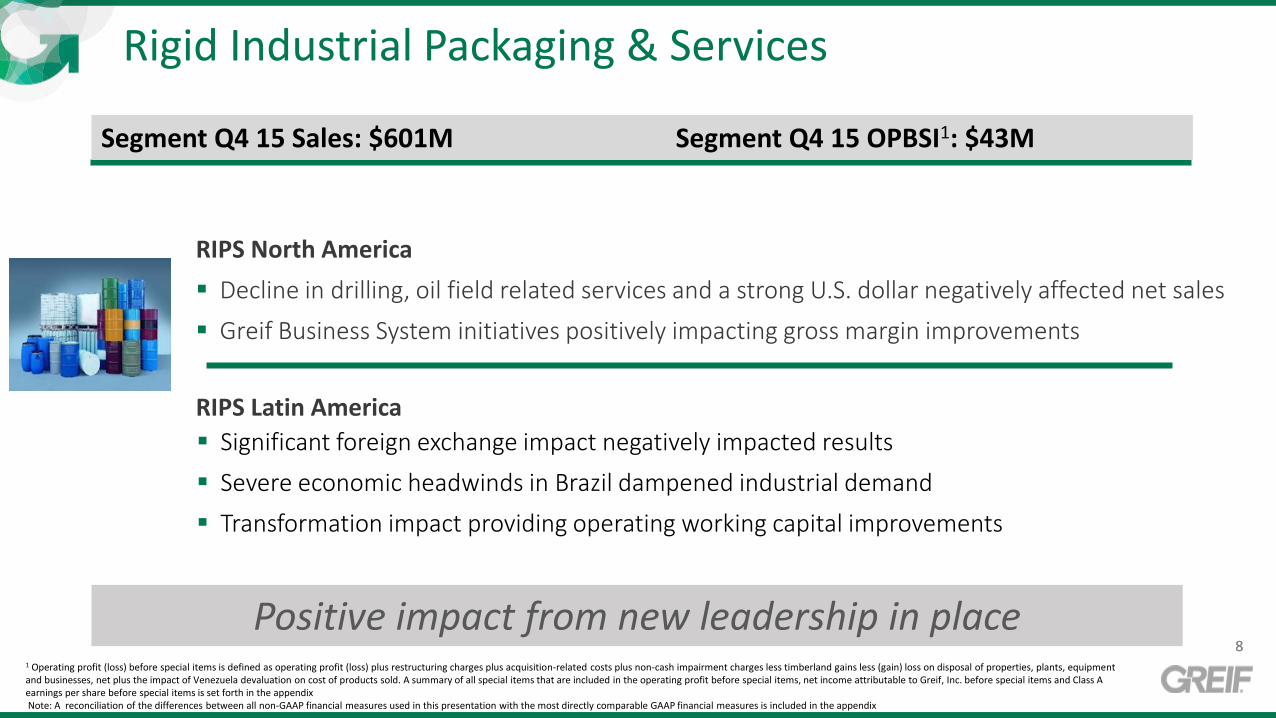
Significant foreign exchange impact negatively impacted results
Severe economic headwinds in Brazil dampened industrial demand
Transformation impact providing operating working capital improvements
RIPS North America
Decline in drilling, oil field related services and a strong U.S. dollar negatively affected net sales
Greif Business System initiatives positively impacting gross margin improvements
Rigid Industrial Packaging & Services
Segment Q4 15 Sales: $601M Segment Q4 15 OPBSI1: $43M
1 Operating profit (loss) before special items is defined as operating profit (loss) plus restructuring charges plus acquisition-related costs plus non-cash impairment charges less timberland gains less (gain) loss on disposal of properties, plants, equipment and businesses, net plus the impact of Venezuela devaluation on cost of products sold. A summary of all special items that are included in the operating profit before special items, net income attributable to Greif, Inc. before special items and Class A earnings per share before special items is set forth in the appendix Note: A reconciliation of the differences between all non-GAAP financial measures used in this presentation with the most directly comparable GAAP financial measures is included in the appendix
RIPS Latin America
Positive impact from new leadership in place 8
9
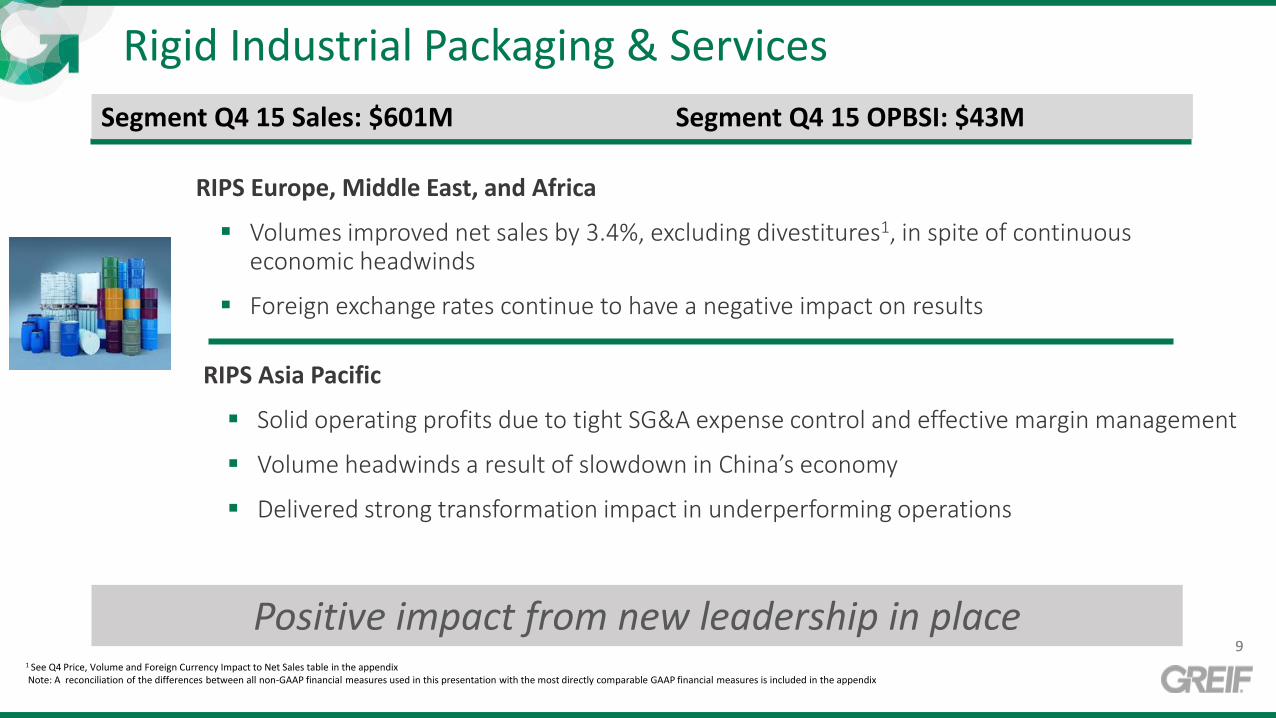
Rigid Industrial Packaging & Services
RIPS Europe, Middle East, and Africa
Volumes improved net sales by 3.4%, excluding divestitures1, in spite of continuous economic headwinds
Foreign exchange rates continue to have a negative impact on results
RIPS Asia Pacific
Solid operating profits due to tight SG&A expense control and effective margin management
Volume headwinds a result of slowdown in China’s economy
Delivered strong transformation impact in underperforming operations
Segment Q4 15 Sales: $601M Segment Q4 15 OPBSI: $43M
Positive impact from new leadership in place 9
1 See Q4 Price, Volume and Foreign Currency Impact to Net Sales table in the appendix Note: A reconciliation of the differences between all non-GAAP financial measures used in this presentation with the most directly comparable GAAP financial measures is included in the appendix
10
Paper Packaging
Growth investments will reduce operating costs and increase volume
Volumes improved net sales by 2.8%, excluding divestitures1
Sheet feeder volume increased due to expansion of corrugator network
Mill volumes lower due to Massillon mill annual scheduled maintenance downtime (conducted Q4 this year versus during Q3 2014)
Segment Q4 15 Sales: $180M Segment Q4 15 OPBSI: $33M
10 1 See Q4 Price, Volume and Foreign Currency Impact to Net Sales table in the appendix Note: A reconciliation of the differences between all non-GAAP financial measures used in this presentation with the most directly comparable GAAP financial measures is included in the appendix
11
Flexible Products & Services
Executed on network consolidation - Morocco and Dudullu, Turkey plants closed
SG&A savings ahead of schedule
Executing on turnaround plans
Segment Q4 15 Sales: $73M Segment Q4 15 OPBSI: $(5)M
11 Note: A reconciliation of the differences between all non-GAAP financial measures used in this presentation with the most directly comparable GAAP financial measures is included in the appendix
12
Land Management
Completed sale of all Canadian timber holdings
Segment Q4 15 Sales: $14M Segment Q4 15 OPBSI: $2M
12 Note: A reconciliation of the differences between all non-GAAP financial measures used in this presentation with the most directly comparable GAAP financial measures is included in the appendix
13
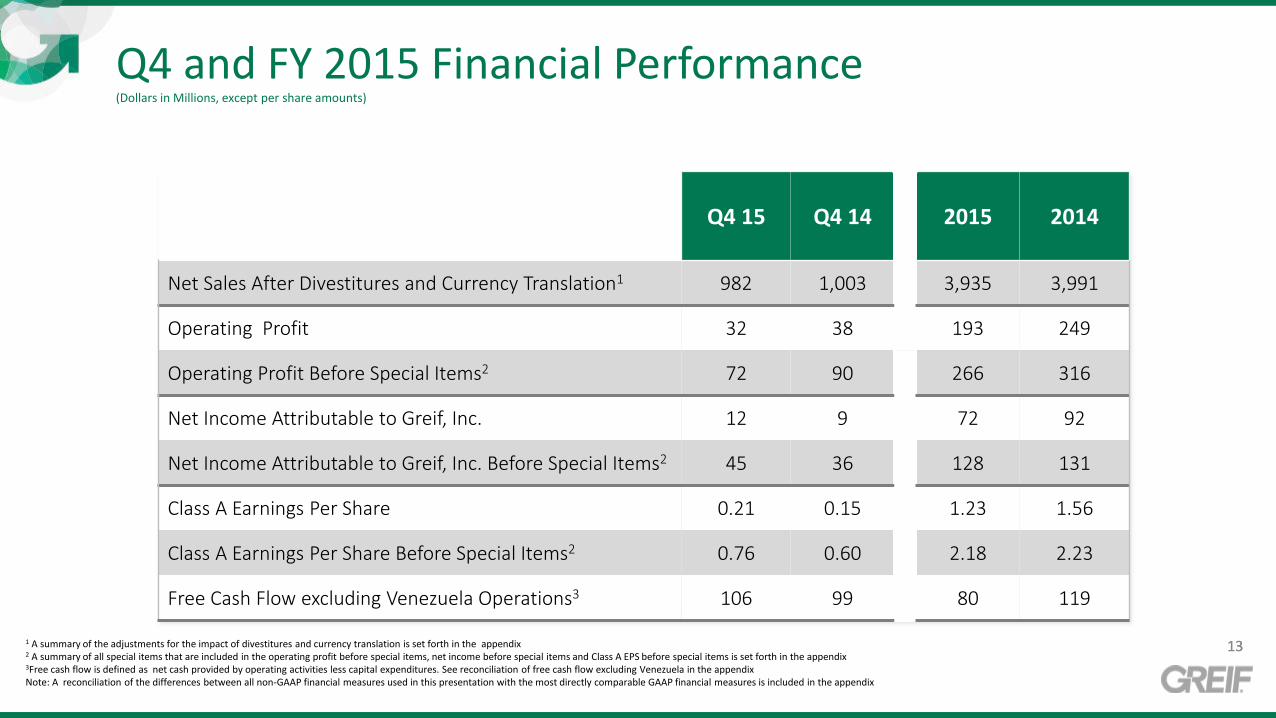
Q4 15 Q4 14 2015 2014
Net Sales After Divestitures and Currency Translation1 982 1,003 3,935 3,991
Operating Profit 32 38 193 249
Operating Profit Before Special Items2 72 90 266 316
Net Income Attributable to Greif, Inc. 12 9 72 92
Net Income Attributable to Greif, Inc. Before Special Items2 45 36 128 131
Class A Earnings Per Share 0.21 0.15 1.23 1.56
Class A Earnings Per Share Before Special Items2 0.76 0.60 2.18 2.23
Free Cash Flow excluding Venezuela Operations3 106 99 80 119
Q4 and FY 2015 Financial Performance (Dollars in Millions, except per share amounts)
13 1 A summary of the adjustments for the impact of divestitures and currency translation is set forth in the appendix 2 A summary of all special items that are included in the operating profit before special items, net income before special items and Class A EPS before special items is set forth in the appendix 3Free cash flow is defined as net cash provided by operating activities less capital expenditures. See reconciliation of free cash flow excluding Venezuela in the appendix Note: A reconciliation of the differences between all non-GAAP financial measures used in this presentation with the most directly comparable GAAP financial measures is included in the appendix
14
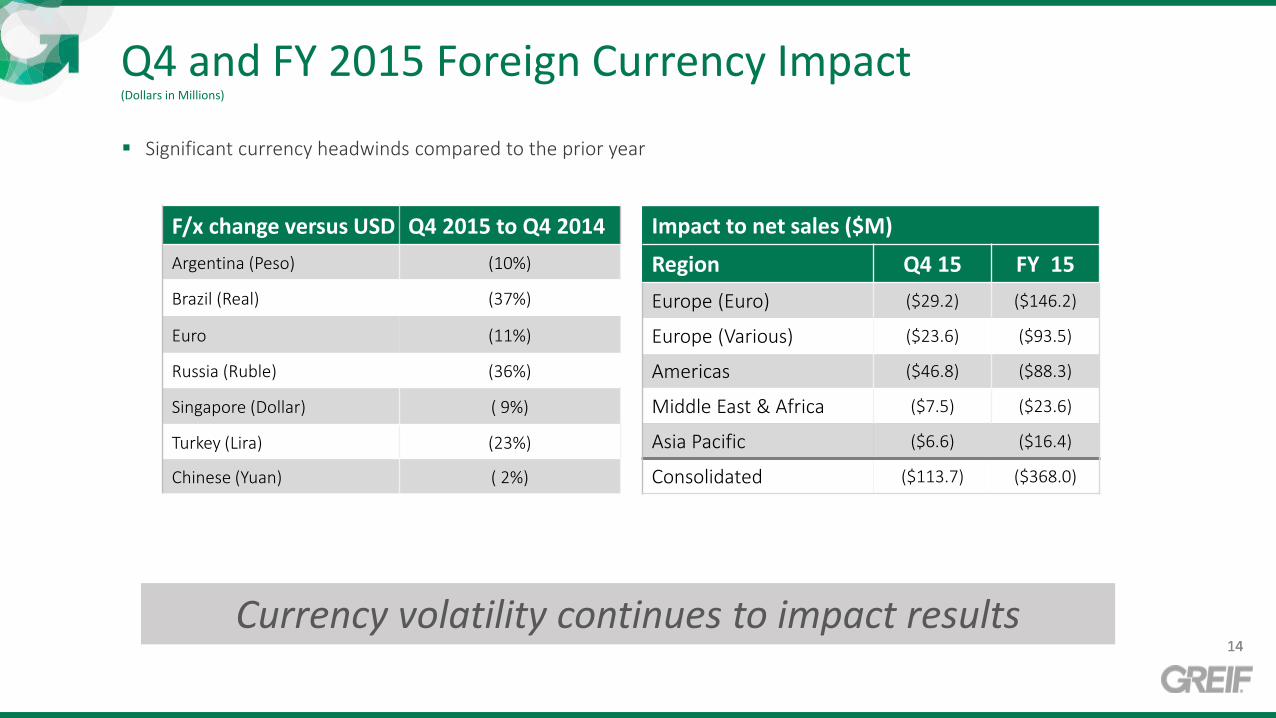
Q4 and FY 2015 Foreign Currency Impact (Dollars in Millions)
Significant currency headwinds compared to the prior year
Impact to net sales ($M)
Region Q4 15 FY 15
Europe (Euro) ($29.2) ($146.2)
Europe (Various) ($23.6) ($93.5)
Americas ($46.8) ($88.3)
Middle East & Africa ($7.5) ($23.6)
Asia Pacific ($6.6) ($16.4)
Consolidated ($113.7) ($368.0)
Currency volatility continues to impact results 14
F/x change versus USD Q4 2015 to Q4 2014
Argentina (Peso) (10%)
Brazil (Real) (37%)
Euro (11%)
Russia (Ruble) (36%)
Singapore (Dollar) ( 9%)
Turkey (Lira) (23%)
Chinese (Yuan) ( 2%)

15
Macro Factors
Foreign currency markets continue to adversely impact results
Deflationary pressures driving commodities lower
Growth in U.S. industrial production remains anemic, particularly when excluding the automotive sector, and is under pressure from weaker global demand and a stronger U.S. dollar
‒ Institute of Supply Management’s U.S. manufacturing index fell to its weakest reading since June 2009 and into contraction territory for the first time since November 2012
Europe’s economic recovery remains slow with GDP growth of 0.3% in Q3 2015
‒ Industrial production in the Eurozone declined in September more than expected
China’s manufacturing activity decreased to its lowest level since August 2012
15
16
Fiscal 2016 Class A EPS Guidance
In fiscal year 2016, the Company’s results are expected to benefit from further implementation of our transformation efforts
These improvements are expected to be achieved despite the continuation of a sluggish global industrial economy and continued strengthening of the U.S. dollar relative to other currencies adversely impacting our results
We anticipate that our fiscal year 2016 Class A earnings per share will be between $2.05 - $2.35 per share, excluding gains and losses on the sales of businesses, timberland and property, plant and equipment, acquisition costs and restructuring and impairment charges
16
Underlying performance is improving

Appendix
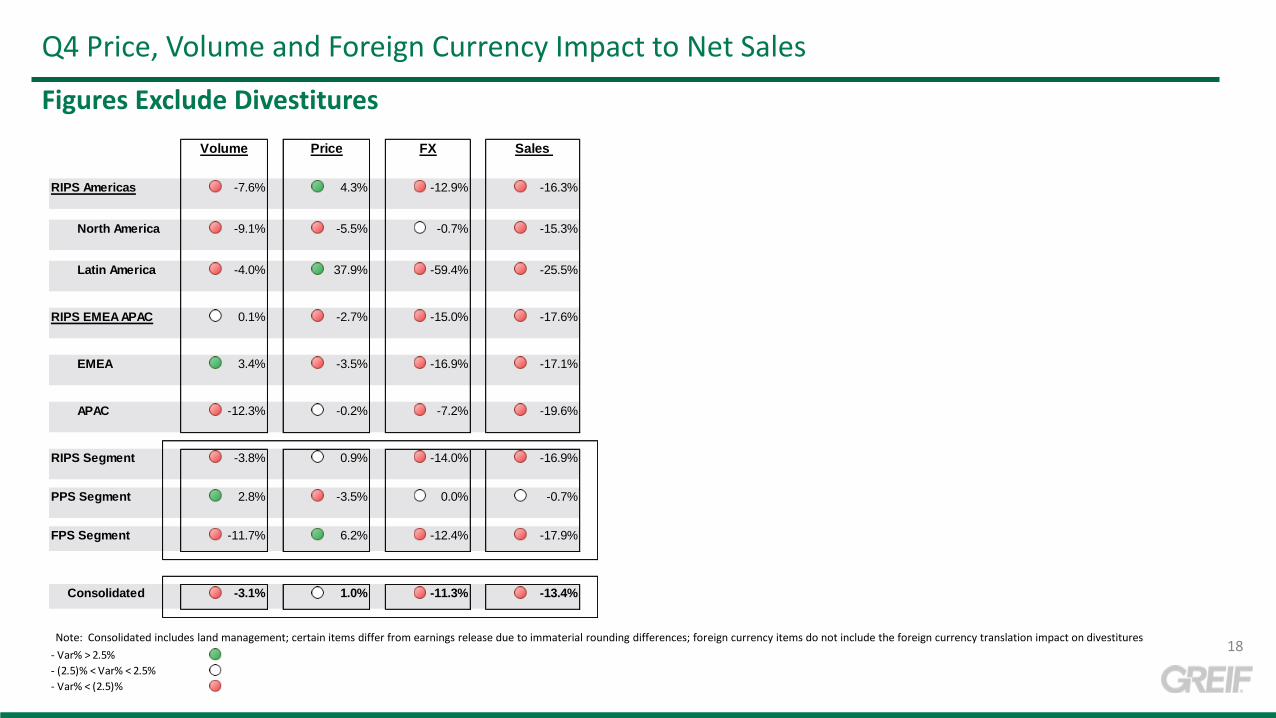
Q4 Price, Volume and Foreign Currency Impact to Net Sales
Figures Exclude Divestitures
18
RIPS Americas -7.6% 4.3% -12.9% -16.3%
North America -9.1% -5.5% -0.7% -15.3%
Latin America -4.0% 37.9% -59.4% -25.5%
RIPS EMEA APAC 0.1% -2.7% -15.0% -17.6%
EMEA 3.4% -3.5% -16.9% -17.1%
APAC -12.3% -0.2% -7.2% -19.6%
RIPS Segment -3.8% 0.9% -14.0% -16.9%
PPS Segment 2.8% -3.5% 0.0% -0.7%
FPS Segment -11.7% 6.2% -12.4% -17.9%
Consolidated -3.1% 1.0% -11.3% -13.4%
Volume Price FX Sales
Note: Consolidated includes land management; certain items differ from earnings release due to immaterial rounding differences; foreign currency items do not include the foreign currency translation impact on divestitures
- Var% > 2.5%
- (2.5)% < Var% < 2.5%
- Var% < (2.5)%
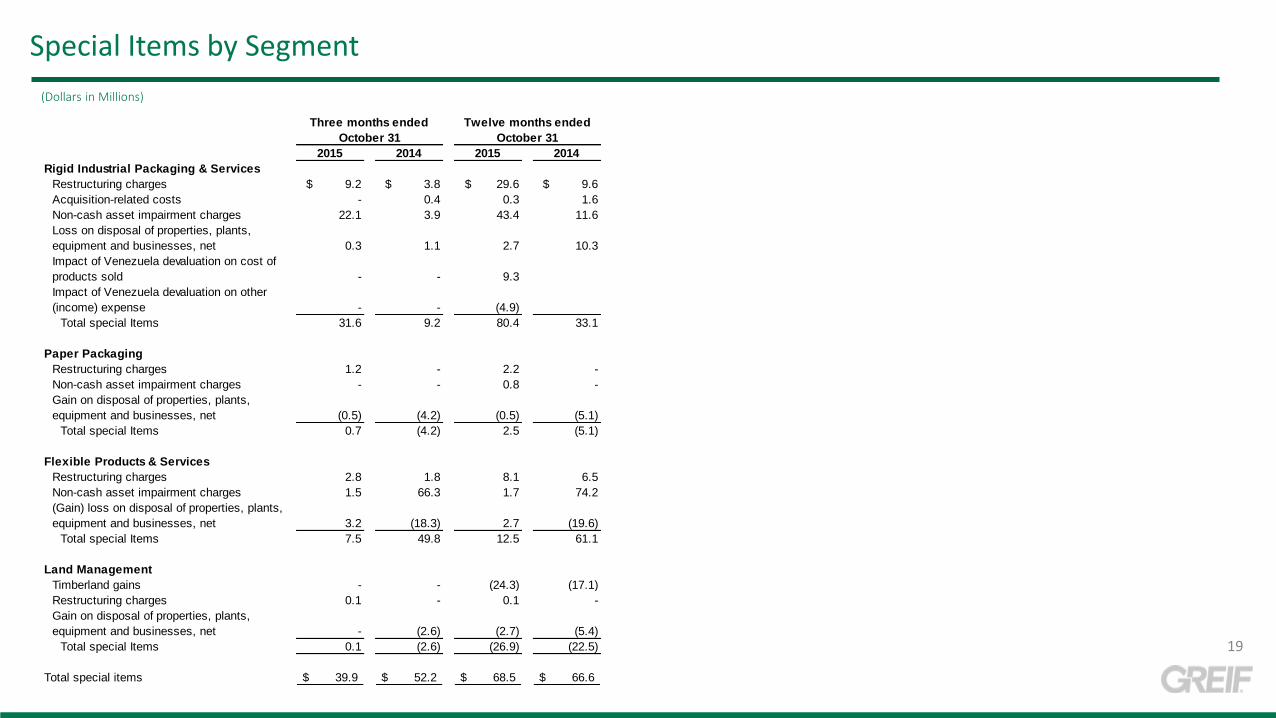
(Dollars in Millions)
Special Items by Segment
19
2015 2014 2015 2014
Rigid Industrial Packaging & Services
Restructuring charges $ 9.2 $ 3.8 $ 29.6 $ 9.6
Acquisition-related costs - 0.4 0.3 1.6
Non-cash asset impairment charges 22.1 3.9 43.4 11.6
Loss on disposal of properties, plants,
equipment and businesses, net 0.3 1.1 2.7 10.3
Impact of Venezuela devaluation on cost of
products sold - - 9.3
Impact of Venezuela devaluation on other
(income) expense - - (4.9)
Total special Items 31.6 9.2 80.4 33.1
Paper Packaging
Restructuring charges 1.2 - 2.2 -
Non-cash asset impairment charges - - 0.8 -
Gain on disposal of properties, plants,
equipment and businesses, net (0.5) (4.2) (0.5) (5.1)
Total special Items 0.7 (4.2) 2.5 (5.1)
Flexible Products & Services
Restructuring charges 2.8 1.8 8.1 6.5
Non-cash asset impairment charges 1.5 66.3 1.7 74.2
(Gain) loss on disposal of properties, plants,
equipment and businesses, net 3.2 (18.3) 2.7 (19.6)
Total special Items 7.5 49.8 12.5 61.1
Land Management
Timberland gains - - (24.3) (17.1)
Restructuring charges 0.1 - 0.1 -
Gain on disposal of properties, plants,
equipment and businesses, net - (2.6) (2.7) (5.4)
Total special Items 0.1 (2.6) (26.9) (22.5)
Total special items 39.9$ 52.2$ 68.5$ 66.6$
October 31 October 31
Three months ended Twelve months ended
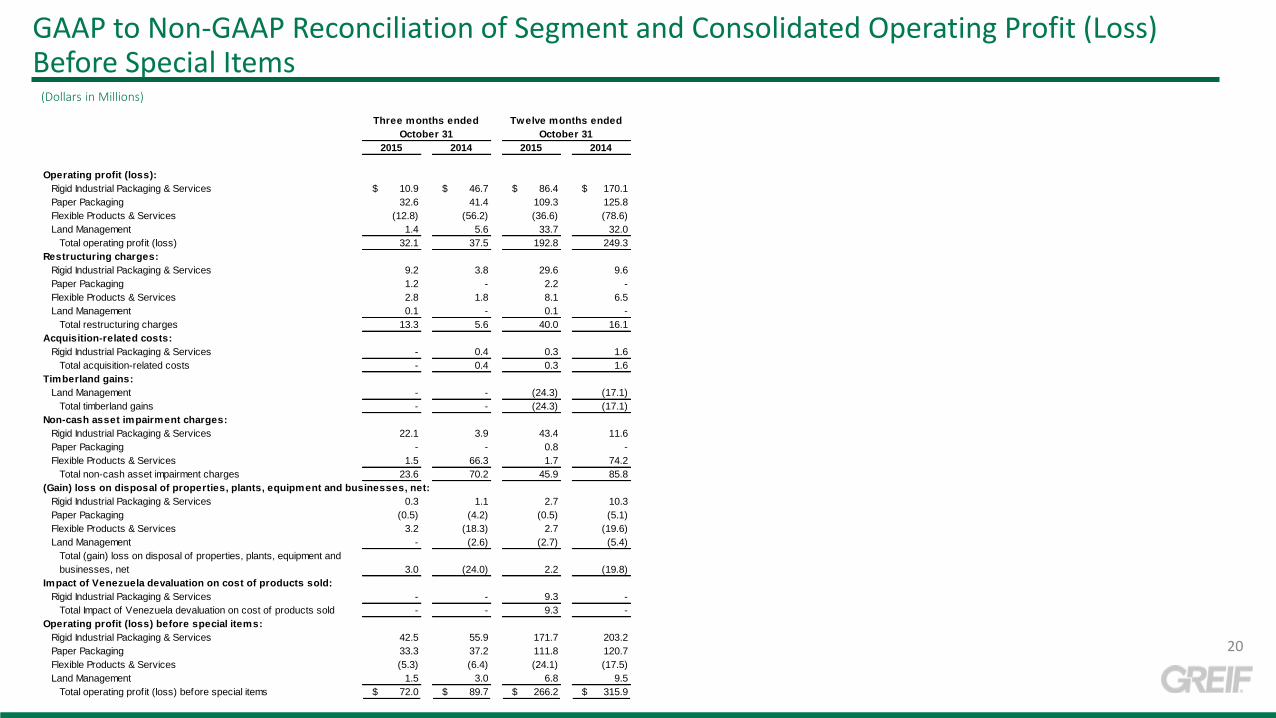
GAAP to Non-GAAP Reconciliation of Segment and Consolidated Operating Profit (Loss) Before Special Items
(Dollars in Millions)
20
2015 2014 2015 2014
Operating profit (loss):
Rigid Industrial Packaging & Services $ 10.9 $ 46.7 $ 86.4 $ 170.1
Paper Packaging 32.6 41.4 109.3 125.8
Flexible Products & Services (12.8) (56.2) (36.6) (78.6)
Land Management 1.4 5.6 33.7 32.0
Total operating profit (loss) 32.1 37.5 192.8 249.3
Restructuring charges:
Rigid Industrial Packaging & Services 9.2 3.8 29.6 9.6
Paper Packaging 1.2 - 2.2 -
Flexible Products & Services 2.8 1.8 8.1 6.5
Land Management 0.1 - 0.1 -
Total restructuring charges 13.3 5.6 40.0 16.1
Acquisition-related costs:
Rigid Industrial Packaging & Services - 0.4 0.3 1.6
Total acquisition-related costs - 0.4 0.3 1.6
Timberland gains:
Land Management - - (24.3) (17.1)
Total timberland gains - - (24.3) (17.1)
Non-cash asset impairment charges:
Rigid Industrial Packaging & Services 22.1 3.9 43.4 11.6
Paper Packaging - - 0.8 -
Flexible Products & Services 1.5 66.3 1.7 74.2
Total non-cash asset impairment charges 23.6 70.2 45.9 85.8
(Gain) loss on disposal of properties, plants, equipment and businesses, net:
Rigid Industrial Packaging & Services 0.3 1.1 2.7 10.3
Paper Packaging (0.5) (4.2) (0.5) (5.1)
Flexible Products & Services 3.2 (18.3) 2.7 (19.6)
Land Management - (2.6) (2.7) (5.4)
Total (gain) loss on disposal of properties, plants, equipment and
businesses, net 3.0 (24.0) 2.2 (19.8)
Impact of Venezuela devaluation on cost of products sold:
Rigid Industrial Packaging & Services - - 9.3 -
Total Impact of Venezuela devaluation on cost of products sold - - 9.3 -
Operating profit (loss) before special items:
Rigid Industrial Packaging & Services 42.5 55.9 171.7 203.2
Paper Packaging 33.3 37.2 111.8 120.7
Flexible Products & Services (5.3) (6.4) (24.1) (17.5)
Land Management 1.5 3.0 6.8 9.5
Total operating profit (loss) before special items $ 72.0 $ 89.7 $ 266.2 $ 315.9
Three months ended Twelve months ended
October 31 October 31
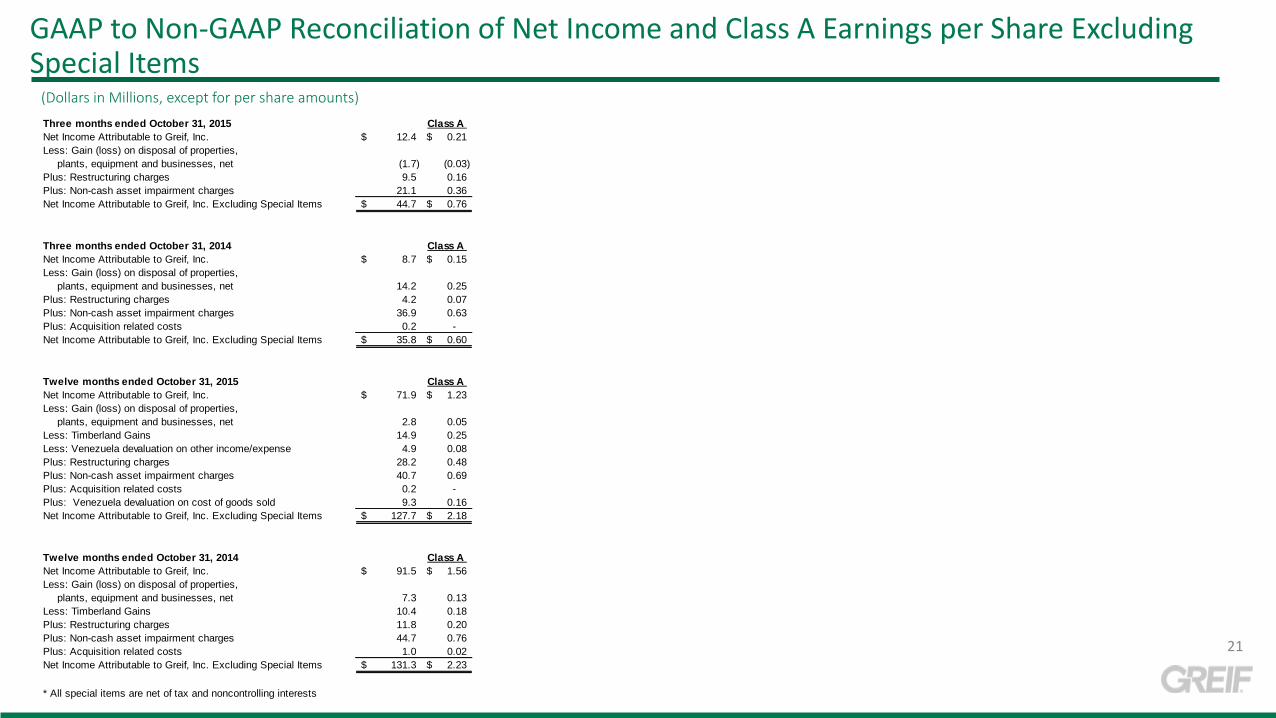
GAAP to Non-GAAP Reconciliation of Net Income and Class A Earnings per Share Excluding Special Items
(Dollars in Millions, except for per share amounts)
21
Three months ended October 31, 2015 Class A
Net Income Attributable to Greif, Inc. 12.4$ 0.21$
Less: Gain (loss) on disposal of properties,
plants, equipment and businesses, net (1.7) (0.03)
Plus: Restructuring charges 9.5 0.16
Plus: Non-cash asset impairment charges 21.1 0.36
Net Income Attributable to Greif, Inc. Excluding Special Items 44.7$ 0.76$
Three months ended October 31, 2014 Class A
Net Income Attributable to Greif, Inc. 8.7$ 0.15$
Less: Gain (loss) on disposal of properties,
plants, equipment and businesses, net 14.2 0.25
Plus: Restructuring charges 4.2 0.07
Plus: Non-cash asset impairment charges 36.9 0.63
Plus: Acquisition related costs 0.2 -
Net Income Attributable to Greif, Inc. Excluding Special Items 35.8$ 0.60$
Twelve months ended October 31, 2015 Class A
Net Income Attributable to Greif, Inc. 71.9$ 1.23$
Less: Gain (loss) on disposal of properties,
plants, equipment and businesses, net 2.8 0.05
Less: Timberland Gains 14.9 0.25
Less: Venezuela devaluation on other income/expense 4.9 0.08
Plus: Restructuring charges 28.2 0.48
Plus: Non-cash asset impairment charges 40.7 0.69
Plus: Acquisition related costs 0.2 -
Plus: Venezuela devaluation on cost of goods sold 9.3 0.16
Net Income Attributable to Greif, Inc. Excluding Special Items 127.7$ 2.18$
Twelve months ended October 31, 2014 Class A
Net Income Attributable to Greif, Inc. 91.5$ 1.56$
Less: Gain (loss) on disposal of properties,
plants, equipment and businesses, net 7.3 0.13
Less: Timberland Gains 10.4 0.18
Plus: Restructuring charges 11.8 0.20
Plus: Non-cash asset impairment charges 44.7 0.76
Plus: Acquisition related costs 1.0 0.02
Net Income Attributable to Greif, Inc. Excluding Special Items 131.3$ 2.23$
* All special items are net of tax and noncontrolling interests
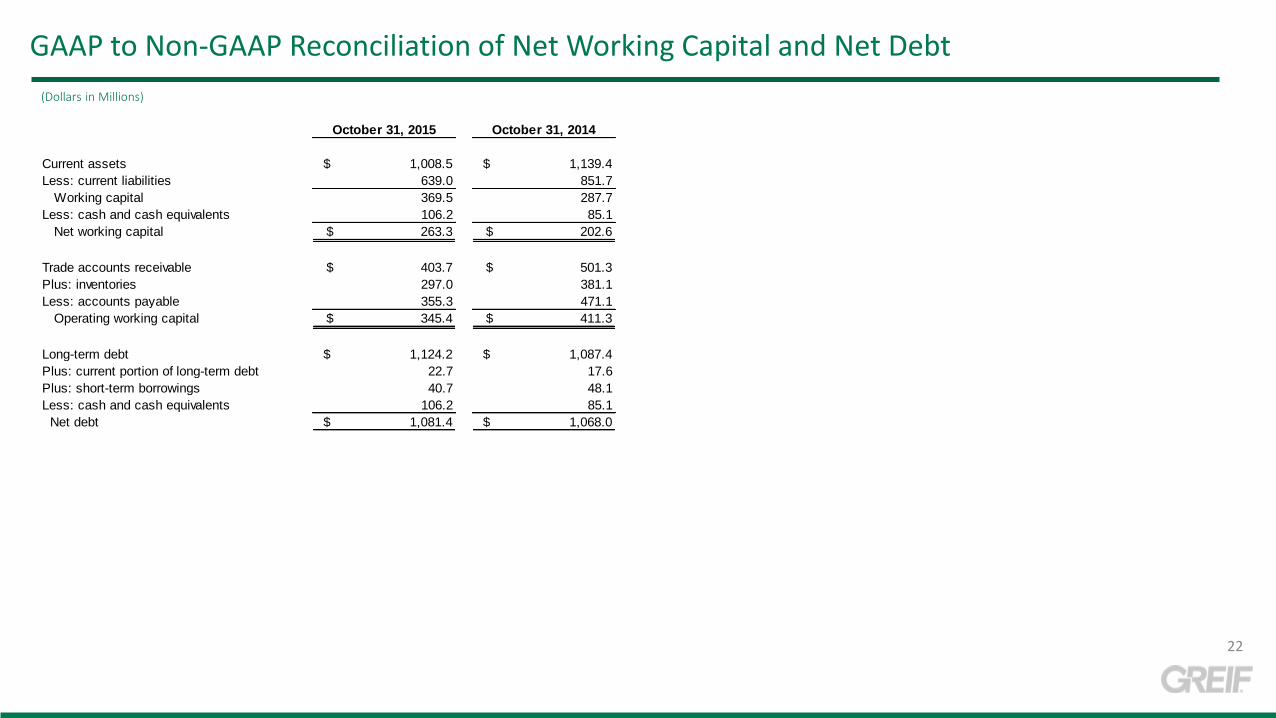
(Dollars in Millions)
GAAP to Non-GAAP Reconciliation of Net Working Capital and Net Debt
22
October 31, 2015 October 31, 2014
Current assets $ 1,008.5 $ 1,139.4
Less: current liabilities 639.0 851.7
Working capital 369.5 287.7
Less: cash and cash equivalents 106.2 85.1
Net working capital $ 263.3 $ 202.6
Trade accounts receivable $ 403.7 $ 501.3
Plus: inventories 297.0 381.1
Less: accounts payable 355.3 471.1
Operating working capital $ 345.4 $ 411.3
Long-term debt $ 1,124.2 $ 1,087.4
Plus: current portion of long-term debt 22.7 17.6
Plus: short-term borrowings 40.7 48.1
Less: cash and cash equivalents 106.2 85.1
Net debt $ 1,081.4 $ 1,068.0
(Dollars in Millions)
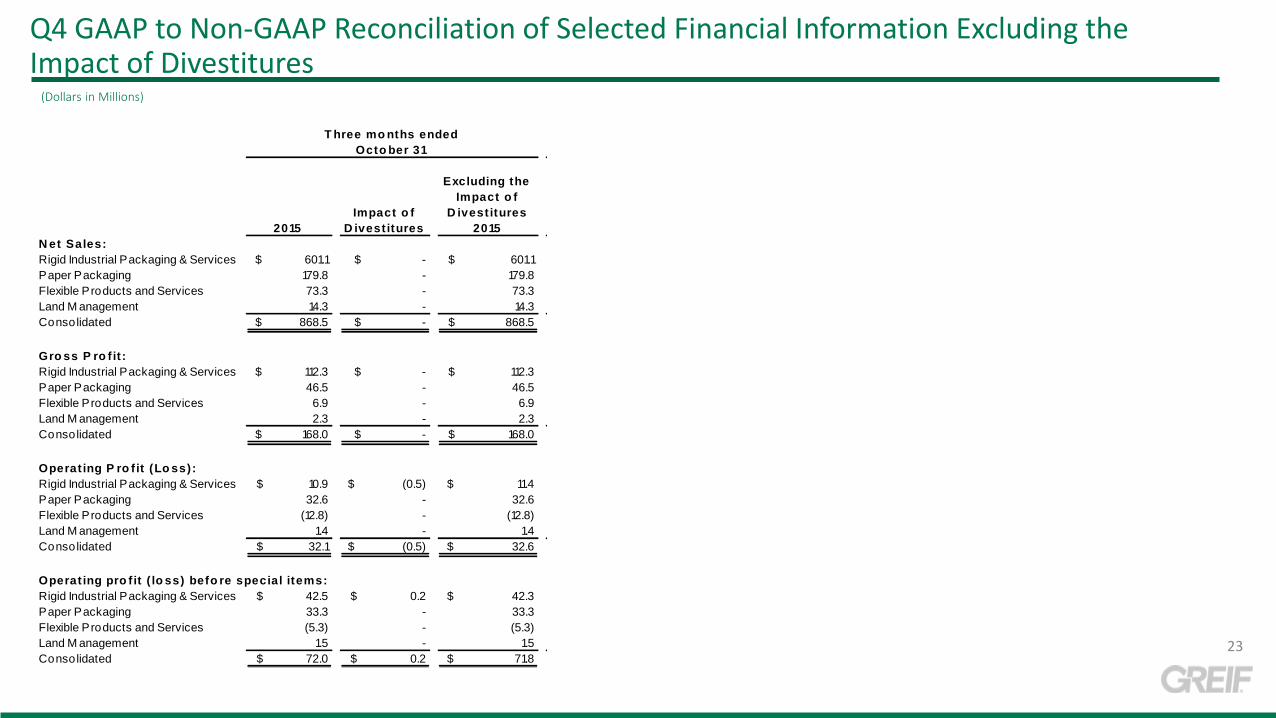
Q4 GAAP to Non-GAAP Reconciliation of Selected Financial Information Excluding the Impact of Divestitures
23
2015
Impact o f
D ivest itures
Excluding the
Impact o f
D ivest itures
2015
N et Sales:
Rigid Industrial Packaging & Services $ 601.1 $ - $ 601.1
Paper Packaging 179.8 - 179.8
Flexible Products and Services 73.3 - 73.3
Land M anagement 14.3 - 14.3
Consolidated $ 868.5 $ - $ 868.5
Gro ss P ro f it :
Rigid Industrial Packaging & Services $ 112.3 $ - $ 112.3
Paper Packaging 46.5 - 46.5
Flexible Products and Services 6.9 - 6.9
Land M anagement 2.3 - 2.3
Consolidated $ 168.0 $ - $ 168.0
Operat ing P ro f it (Lo ss):
Rigid Industrial Packaging & Services $ 10.9 $ (0.5) $ 11.4
Paper Packaging 32.6 - 32.6
Flexible Products and Services (12.8) - (12.8)
Land M anagement 1.4 - 1.4
Consolidated $ 32.1 $ (0.5) $ 32.6
Operat ing pro f it ( lo ss) befo re special items:
Rigid Industrial Packaging & Services $ 42.5 $ 0.2 $ 42.3
Paper Packaging 33.3 - 33.3
Flexible Products and Services (5.3) - (5.3)
Land M anagement 1.5 - 1.5
Consolidated $ 72.0 $ 0.2 $ 71.8
T hree mo nths ended
Octo ber 31
(Dollars in Millions)
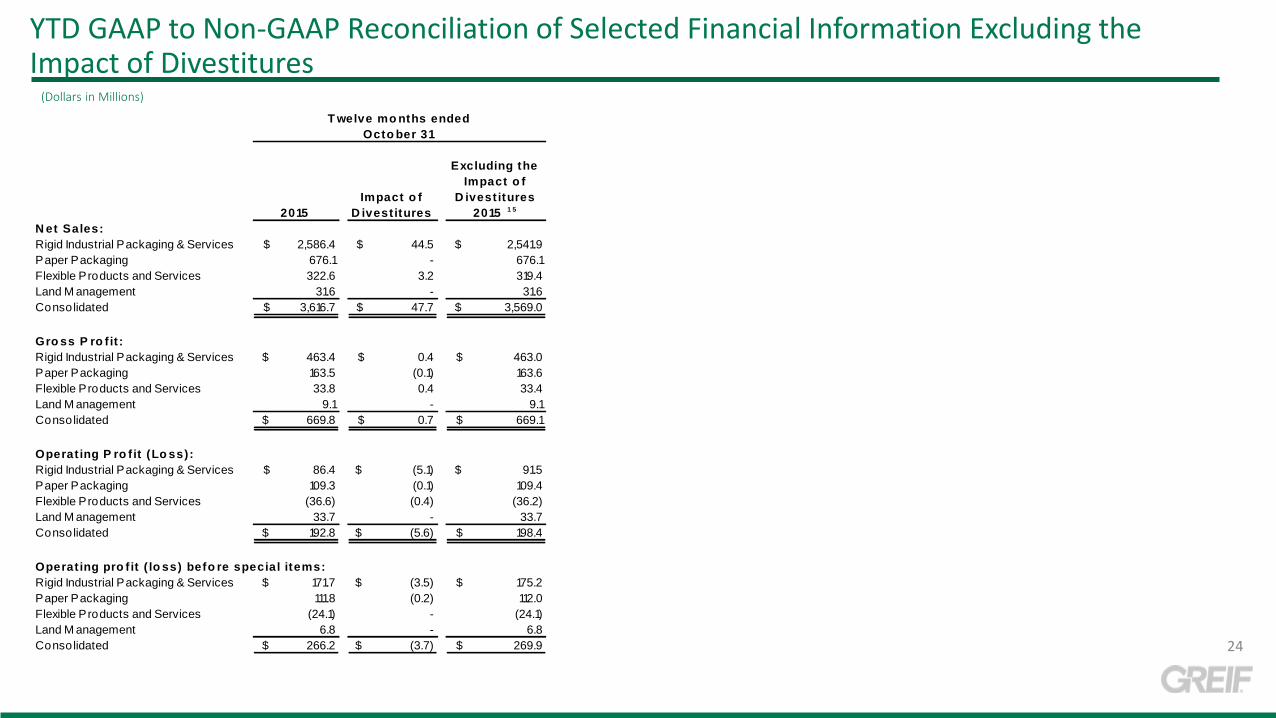
YTD GAAP to Non-GAAP Reconciliation of Selected Financial Information Excluding the Impact of Divestitures
24
2015
Impact o f
D ivest itures
Excluding the
Impact o f
D ivest itures
2015 1 5
N et Sales:
Rigid Industrial Packaging & Services $ 2,586.4 $ 44.5 $ 2,541.9
Paper Packaging 676.1 - 676.1
Flexible Products and Services 322.6 3.2 319.4
Land M anagement 31.6 - 31.6
Consolidated $ 3,616.7 $ 47.7 $ 3,569.0
Gro ss P ro f it :
Rigid Industrial Packaging & Services $ 463.4 $ 0.4 $ 463.0
Paper Packaging 163.5 (0.1) 163.6
Flexible Products and Services 33.8 0.4 33.4
Land M anagement 9.1 - 9.1
Consolidated $ 669.8 $ 0.7 $ 669.1
Operat ing P ro f it (Lo ss):
Rigid Industrial Packaging & Services $ 86.4 $ (5.1) $ 91.5
Paper Packaging 109.3 (0.1) 109.4
Flexible Products and Services (36.6) (0.4) (36.2)
Land M anagement 33.7 - 33.7
Consolidated $ 192.8 $ (5.6) $ 198.4
Operat ing pro f it ( lo ss) befo re special items:
Rigid Industrial Packaging & Services $ 171.7 $ (3.5) $ 175.2
Paper Packaging 111.8 (0.2) 112.0
Flexible Products and Services (24.1) - (24.1)
Land M anagement 6.8 - 6.8
Consolidated $ 266.2 $ (3.7) $ 269.9
T welve mo nths ended
Octo ber 31
(Dollars in Millions)
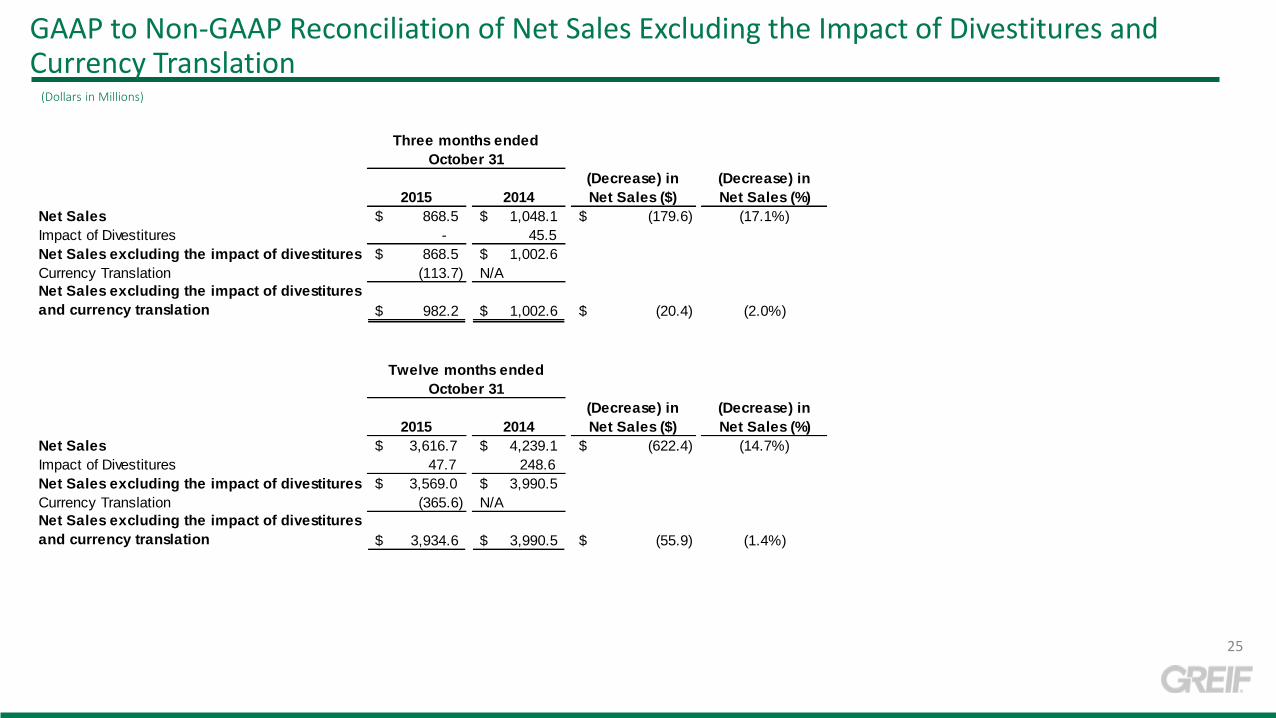
GAAP to Non-GAAP Reconciliation of Net Sales Excluding the Impact of Divestitures and Currency Translation
25
2015 2014
(Decrease) in
Net Sales ($)
(Decrease) in
Net Sales (%)
Net Sales $ 868.5 $ 1,048.1 (179.6)$ (17.1%)
Impact of Divestitures - 45.5
Net Sales excluding the impact of divestitures $ 868.5 $ 1,002.6
Currency Translation (113.7) N/A
Net Sales excluding the impact of divestitures
and currency translation 982.2$ 1,002.6$ (20.4)$ (2.0%)
2015 2014
(Decrease) in
Net Sales ($)
(Decrease) in
Net Sales (%)
Net Sales $ 3,616.7 $ 4,239.1 (622.4)$ (14.7%)
Impact of Divestitures 47.7 248.6
Net Sales excluding the impact of divestitures $ 3,569.0 $ 3,990.5
Currency Translation (365.6) N/A
Net Sales excluding the impact of divestitures
and currency translation 3,934.6$ 3,990.5$ (55.9)$ (1.4%)
Three months ended
October 31
Twelve months ended
October 31

GAAP to Non-GAAP Reconciliation Free Cash Flow
26
2015 2014 2015 2014
Net cash provided by operating activities $ 132.9 $ 145.0 $ 206.3 $ 261.8
Less: Capital expenditures (27.6) (43.9) (135.8) (137.9)
Free Cash Flow $ 105.3 $ 101.1 $ 70.5 $ 123.9
2015 2014 2015 2014
Net cash provided by operating activities $ 133.1 $ 142.7 $ 202.2 $ 256.9
Less: Capital expenditures (27.6) (43.9) (121.8) (137.9)
Free Cash Flow $ 105.5 $ 98.8 $ 80.4 $ 119.0
FREE CASH FLOW EXCLUDING THE IMPACT OF VENEZUELA OPERATIONS
Three months Twelve months
October 31 October 31
Three months Twelve months
October 31 October 31