Embed Size (px)
Citation preview
1Q16 Earnings ReleaseC f C llConference CallMay, 11th 2016May, 11 2016
Highlights
The Bank’s leverage reached its turning point and the loan portfolio tends to maintain its current levels and, depending on a
favorable political and economic environment, could potentially expand.
Liquid balance sheet with a cash position of R$1.5 billion, equivalent to 53% of time deposits.
Excess capital, with a BIS ratio of 15.1%, being 14.7% in Tier I Capital.
Loan portfolio coverage ratio at around 5% as a result of a significant increase in provisions in the periods.
R t ti f 14 9% i l d d i i t ti i i fl ti i Retraction of 14.9% in personnel and administrative expenses, even in an inflationary scenario.
Continuous liability management with a diversified portfolio and adequate terms.
2/17Investor Relations | 1Q16 |A parte de imagem com identificação de relação rId27 não foi encontrada no arquivo.
Financial Highlights
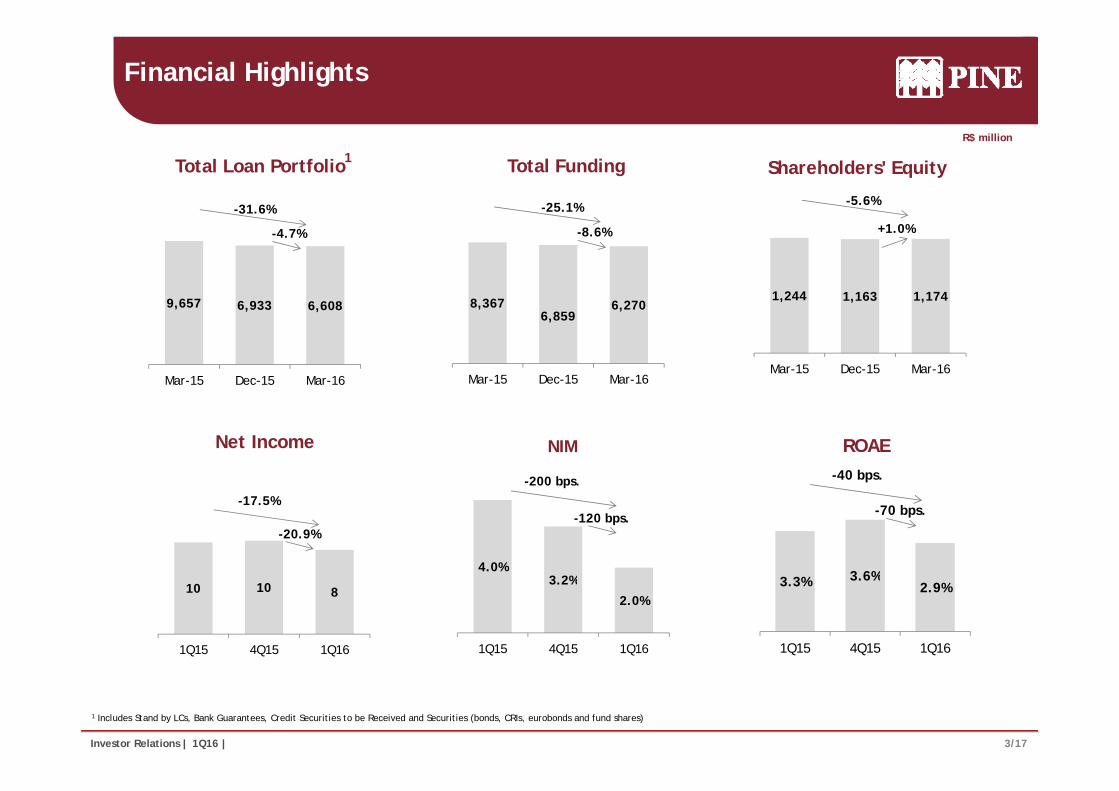
-5.6%-25.1%
Total FundingTotal Loan Portfolio1Shareholders' Equity
R$ million
-31.6%
1,244 1,163 1,174
+1.0%
8,367 6 270
-8.6%
9,657 6 933 6 608
-4.7%
Mar-15 Dec-15 Mar-16
8,3676,859
6,270
Mar-15 Dec-15 Mar-16
9,657 6,933 6,608
Mar-15 Dec-15 Mar-16
-200 bps. -40 bps.
ROAENIM Net Income
4.0%3 2%
-120 bps.
200 bps.
3 6%
-70 bps.-17.5%
-20.9%
3.2%
2.0%
1Q15 4Q15 1Q16
3.3% 3.6%2.9%
1Q15 4Q15 1Q16
10 10 8
1Q15 4Q15 1Q16
3/17Investor Relations | 1Q16 |A parte de imagem com identificação de relação rId27 não foi encontrada no arquivo.
1 Includes Stand by LCs, Bank Guarantees, Credit Securities to be Received and Securities (bonds, CRIs, eurobonds and fund shares)
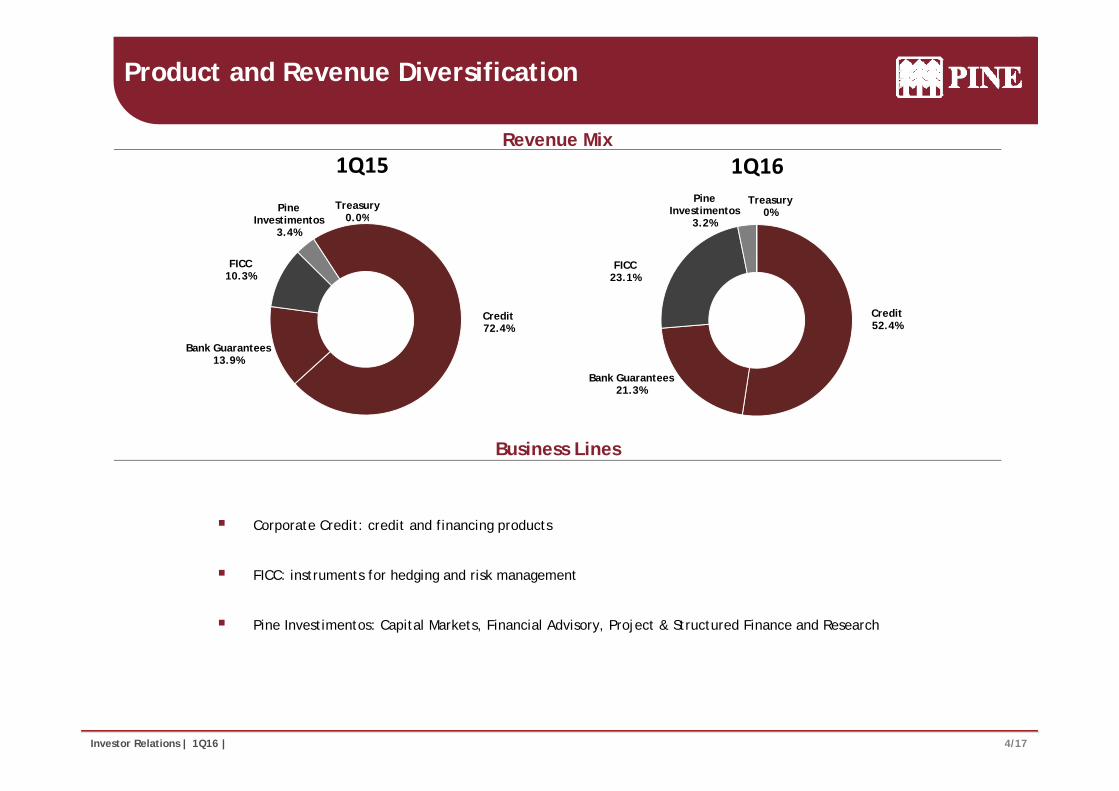
Product and Revenue Diversification
Pine Investimentos
Treasury0%
1Q16
Pine I i
Treasury0 0%
1Q15Revenue Mix
FICC23.1%
3.2%
FICC10.3%
Investimentos3.4%
0.0%
Credit52.4%
Bank Guarantees 21.3%
Credit72.4%
Bank Guarantees 13.9%
Business Lines
Corporate Credit: credit and financing products
FICC: instruments for hedging and risk management FICC: instruments for hedging and risk management
Pine Investimentos: Capital Markets, Financial Advisory, Project & Structured Finance and Research
4/17Investor Relations | 1Q16 |A parte de imagem com identificação de relação rId27 não foi encontrada no arquivo.
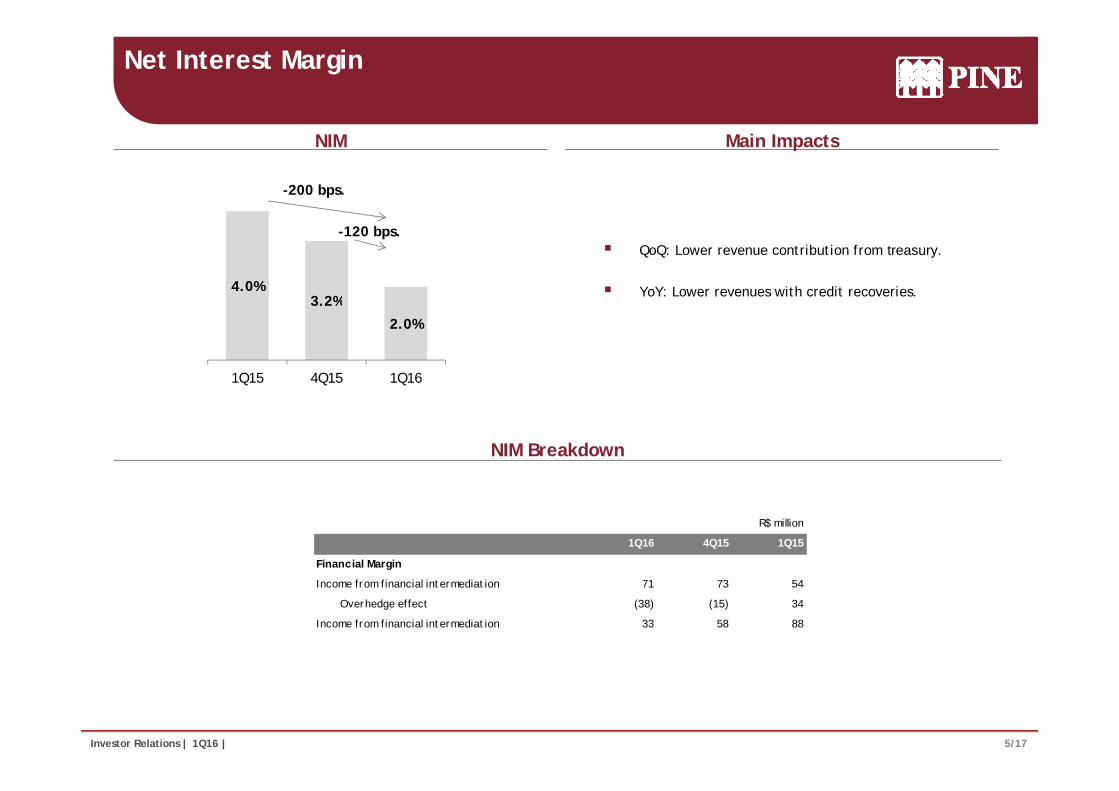
Net Interest Margin
-200 bps.
NIM Main Impacts
4.0%3.2%
-120 bps. QoQ: Lower revenue contribution from treasury.
YoY: Lower revenues with credit recoveries.3. %
2.0%
1Q15 4Q15 1Q16
NIM Breakdown
R$ million
1Q16 4Q15 1Q15
Financial Margin
Income from financial intermediation 71 73 54
Overhedge effect (38) (15) 34
Income from financial intermediation 33 58 88
5/17Investor Relations | 1Q16 |A parte de imagem com identificação de relação rId27 não foi encontrada no arquivo.
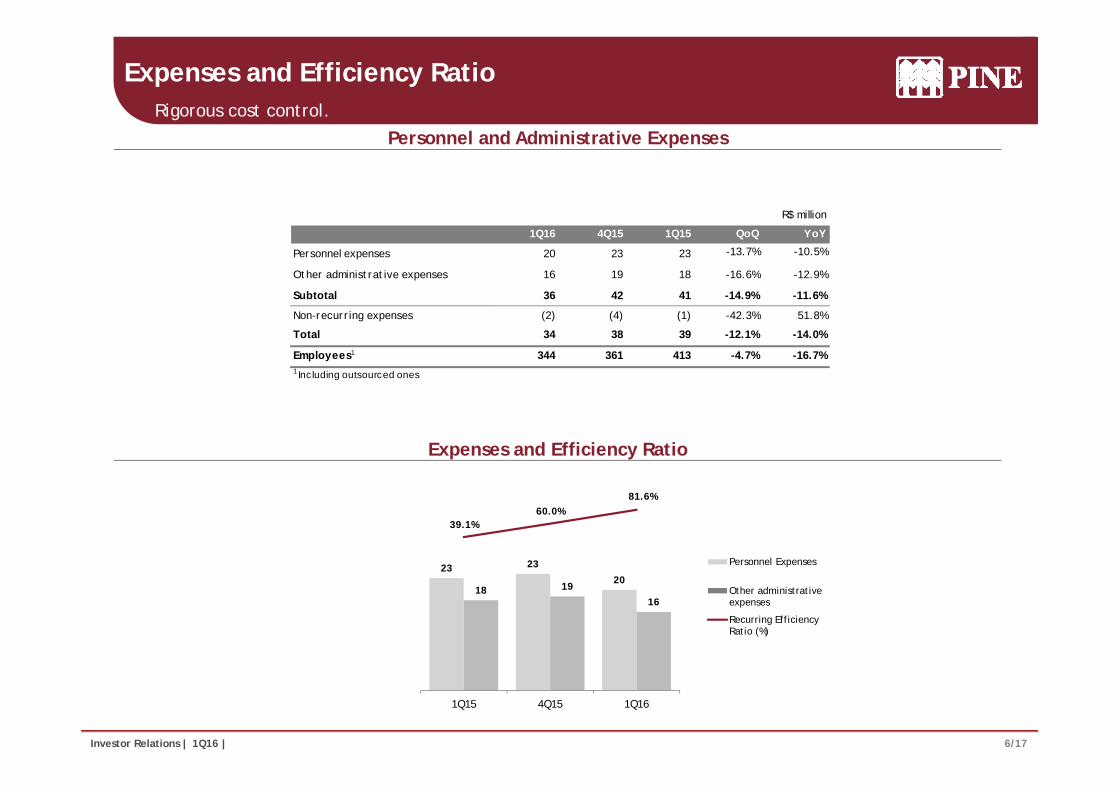
Expenses and Efficiency RatioRigorous cost control.
Personnel and Administrative Expenses
R$ millionR$ million
1Q16 4Q15 1Q15 QoQ YoY
Personnel expenses 20 23 23 -13.7% -10.5%
Other administrative expenses 16 19 18 -16.6% -12.9%
Subtotal 36 42 41 -14.9% -11.6%
Non-recurring expenses (2) (4) (1) -42.3% 51.8%
Total 34 38 39 -12.1% -14.0%
Employees1 344 361 413 -4.7% -16.7%1 Including outsourced ones
Expenses and Efficiency Ratio
23 23
39.1%60.0%
81.6%
00%
50%
100%
25
30
35
40
Personnel Expenses
2018 19
16
-150%
-100%
-50%
10
15
20 Other administrativeexpenses
Recurring EfficiencyRatio (%)
6/17Investor Relations | 1Q16 |A parte de imagem com identificação de relação rId27 não foi encontrada no arquivo.
-200%0
5
1Q15 4Q15 1Q16
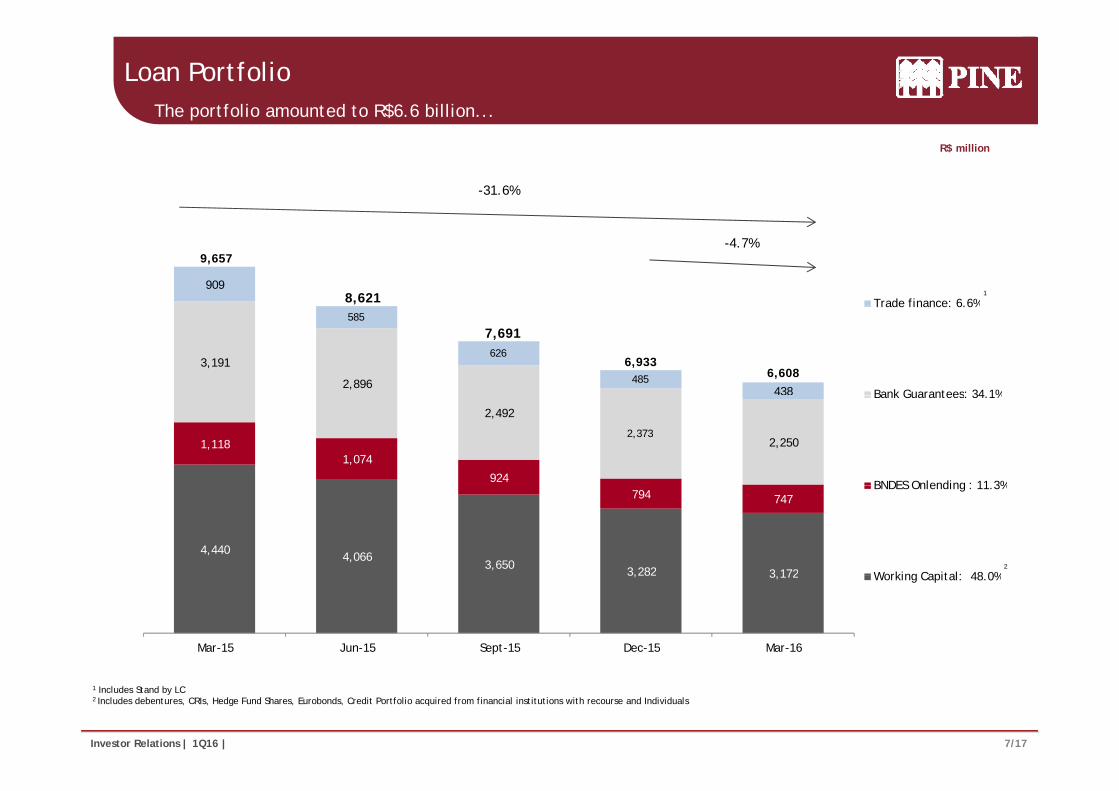
Loan PortfolioThe portfolio amounted to R$6.6 billion...
R$ million
-31.6%
1
-4.7%
909
Trade finance: 6.6%8,621
9,657
3,191
2,896
585
626
485438
Trade finance: 6.6%
Bank Guarantees: 34 1%
7,691
6,9336,608
1,1181,074
924
2,492
2,3732,250
Bank Guarantees: 34.1%
BNDES Onlending : 11 3%
48 0%2
4,440 4,0663,650 3,282 3 172
794 747BNDES Onlending : 11.3%
Working Capital: 48.0%3,282 3,172
Mar-15 Jun-15 Sept-15 Dec-15 Mar-16
Working Capital:
7/17Investor Relations | 1Q16 |A parte de imagem com identificação de relação rId27 não foi encontrada no arquivo.
1 Includes Stand by LC2 Includes debentures, CRIs, Hedge Fund Shares, Eurobonds, Credit Portfolio acquired from financial institutions with recourse and Individuals
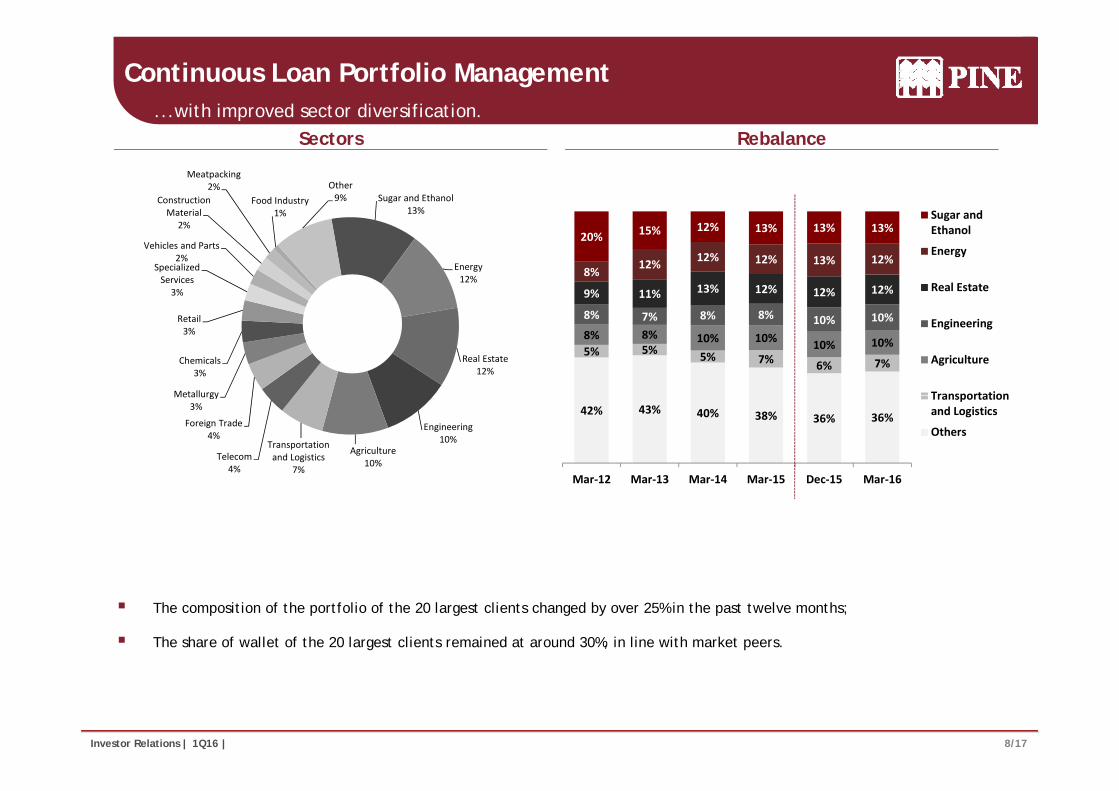
Continuous Loan Portfolio Management...with improved sector diversification.
Sugar andSugar and Ethanol
13%Construction Material
Meatpacking2%
Food Industry1%
Other9%
Sectors Rebalance
12%12%12%13%11%9%
12%13%12%12%12%8%
13%13%13%12%15%20%
Sugar andEthanol
Energy
Real Estate
Energy12%
Specialized Services
3%
Vehicles and Parts2%
2%1%
7%6%7%5%5%5%10%10%10%10%8%8%10%10%8%8%7%8%
Engineering
Agriculture
Transportation
Real Estate12%
Metallurgy
Chemicals3%
Retail3%
36%36%38%40%43%42%
Mar‐16Dec‐15Mar‐15Mar‐14Mar‐13Mar‐12
Transportationand Logistics
OthersEngineering10%
Agriculture10%
Transportation and Logistics
7%Telecom
4%
Foreign Trade4%
Metallurgy3%
The composition of the portfolio of the 20 largest clients changed by over 25% in the past twelve months;
The share of wallet of the 20 largest clients remained at around 30%, in line with market peers.
8/17Investor Relations | 1Q16 |A parte de imagem com identificação de relação rId27 não foi encontrada no arquivo.
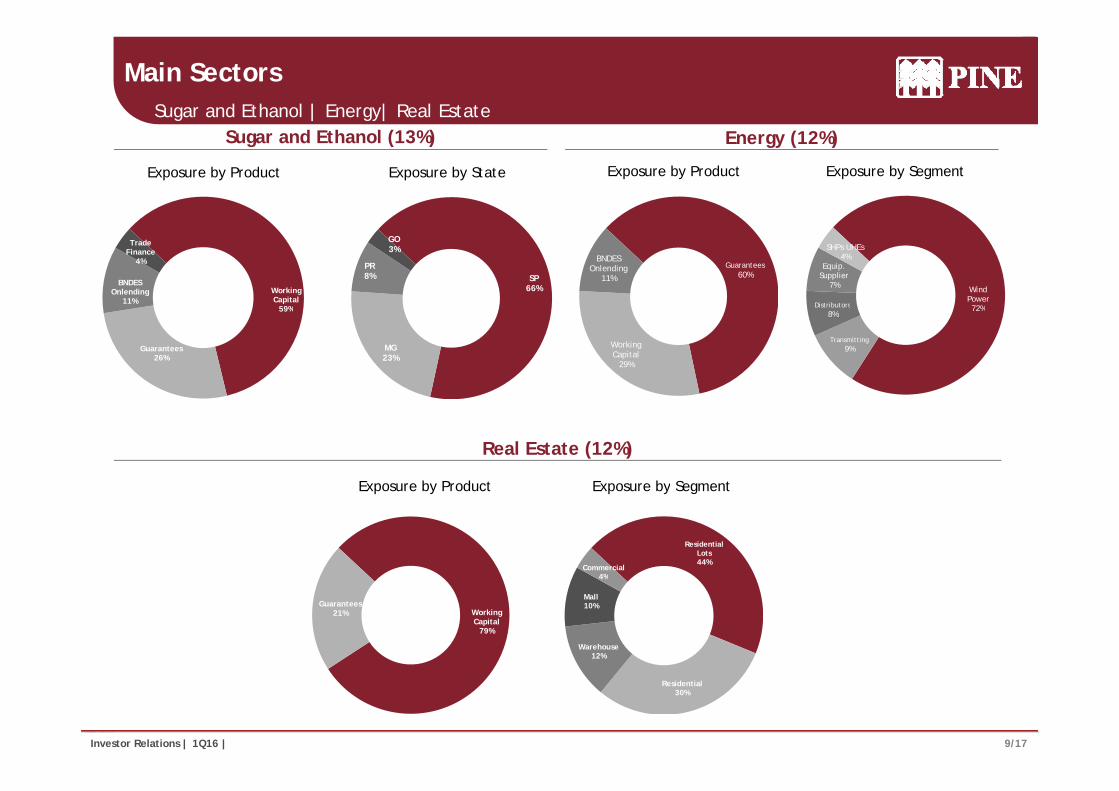
Main SectorsSugar and Ethanol | Energy| Real Estate
Sugar and Ethanol (13%) Energy (12%)
Exposure by Product Exposure by State Exposure by Product Exposure by Segment
Guarantees60%
BNDES Onlending
11%Wind Power72%Distributors
Equip. Supplier
7%
SHPs UHEs4%
SP66%
PR8%
GO3%
Working Capital
59%
BNDES Onlending
11%
Trade Finance
4%
Working Capital
29%
72%
Transmitting9%
Distributors8%
MG23%
59%
Guarantees26%
Real Estate (12%)
Exposure by Product Exposure by Segment
Residential Lots44%
Commercial4%
Exposure by Product Exposure by Segment
Working Capital
79%
Guarantees21%
Warehouse12%
Mall10%
4%
9/17Investor Relations | 1Q16 |A parte de imagem com identificação de relação rId27 não foi encontrada no arquivo.
Residential30%
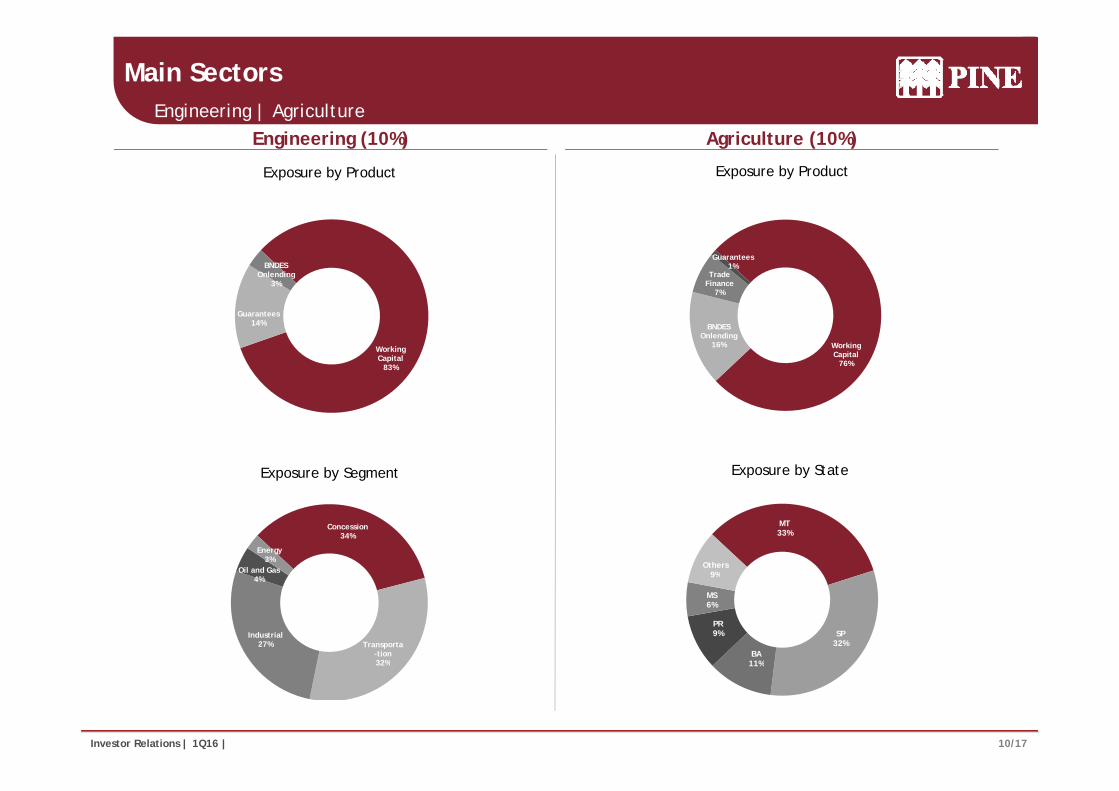
Main SectorsEngineering | Agriculture
Engineering (10%) Agriculture (10%)
Exposure by Product Exposure by Product
Trade Finance
7%
Guarantees1%BNDES
Onlending3%
Working Capital
76%
BNDES Onlending
16%Working Capital
83%
Guarantees14%
Exposure by StateExposure by Segment
MT33%
Others9%
Concession34%
Oil and Gas
Energy3%
SP32%
BA11%
PR9%
MS6%
9%
Transporta-tion32%
Industrial27%
4%
10/17Investor Relations | 1Q16 |A parte de imagem com identificação de relação rId27 não foi encontrada no arquivo.
11%32%
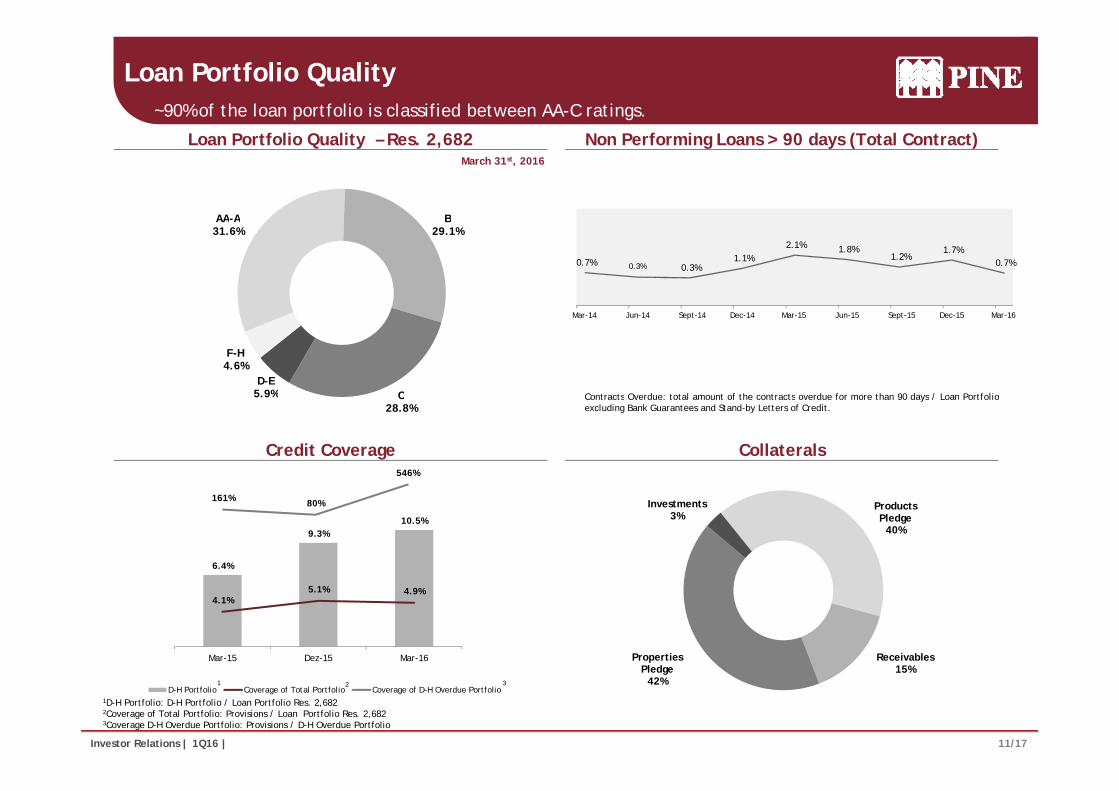
Loan Portfolio Quality~90% of the loan portfolio is classified between AA-C ratings.
AA A B
March 31st, 2016
Loan Portfolio Quality – Res. 2,682 Non Performing Loans > 90 days (Total Contract)
AA-A31.6%
B29.1%
0.7% 0.3% 0.3%1.1%
2.1% 1.8%1.2%
1.7%0.7%
CD-E
5.9%
F-H4.6%
Contracts Overdue: total amount of the contracts overdue for more than 90 days / Loan Portfolio
Mar-14 Jun-14 Sept-14 Dec-14 Mar-15 Jun-15 Sept-15 Dec-15 Mar-16
C28.8%
5.9%
546%550 0%
1050.0%
Contracts Overdue: total amount of the contracts overdue for more than 90 days / Loan Portfolioexcluding Bank Guarantees and Stand-by Letters of Credit.
Credit Coverage Collaterals
6.4%
9.3%10.5%
08%
10%
12%
07%
09%
11%
161% 80%50.0%
550.0%
Products Pledge
40%
Investments3%
4.1%5.1% 4.9%
00%
02%
04%
06%
‐01%
01%
03%
05%
Mar-15 Dez-15 Mar-16 ReceivablesProperties l d
11/17Investor Relations | 1Q16 |A parte de imagem com identificação de relação rId27 não foi encontrada no arquivo.
1D-H Portfolio: D-H Portfolio / Loan Portfolio Res. 2,6822Coverage of Total Portfolio: Provisions / Loan Portfolio Res. 2,682 3Coverage D-H Overdue Portfolio: Provisions / D-H Overdue Portfolio
D-H Portfolio Coverage of Total Portfolio Coverage of D-H Overdue Portfolio
15%Pledge42%1 2 3
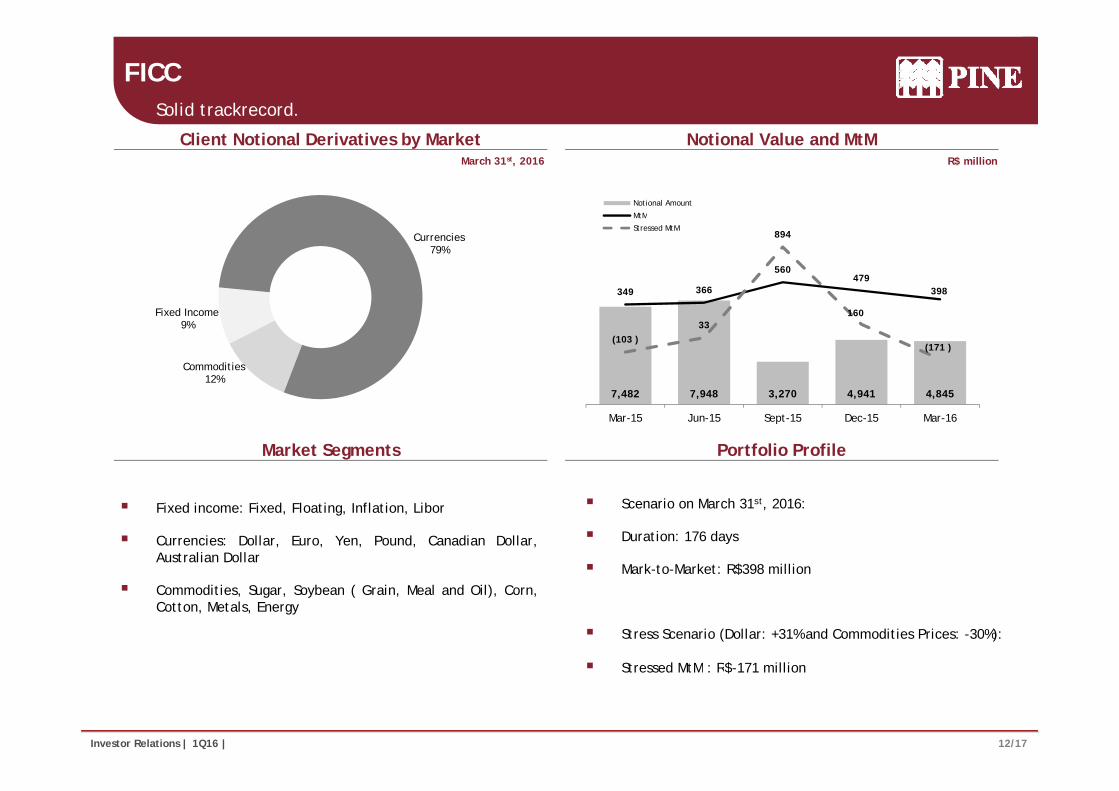
FICCSolid trackrecord.
Notional Amount
MtM
March 31st, 2016 R$ million
Client Notional Derivatives by Market Notional Value and MtM
Currencies79%
349 366
560479
398
894
MtM
Stressed MtM
Commodities12%
Fixed Income9%
7 482 7 948 3 270 4 941 4 845
(103 )33
160
(171 )
7,482 7,948 3,270 4,941 4,845
Mar-15 Jun-15 Sept-15 Dec-15 Mar-16
Market Segments Portfolio Profile
Fixed income: Fixed, Floating, Inflation, Libor
Currencies: Dollar, Euro, Yen, Pound, Canadian Dollar,Australian Dollar
Scenario on March 31st, 2016:
Duration: 176 days
Mark-to-Market: R$398 million
Commodities, Sugar, Soybean ( Grain, Meal and Oil), Corn,Cotton, Metals, Energy
$
Stress Scenario (Dollar: +31% and Commodities Prices: -30%):
St d MtM R$ 171 illi
12/17Investor Relations | 1Q16 |A parte de imagem com identificação de relação rId27 não foi encontrada no arquivo.
Stressed MtM : R$-171 million
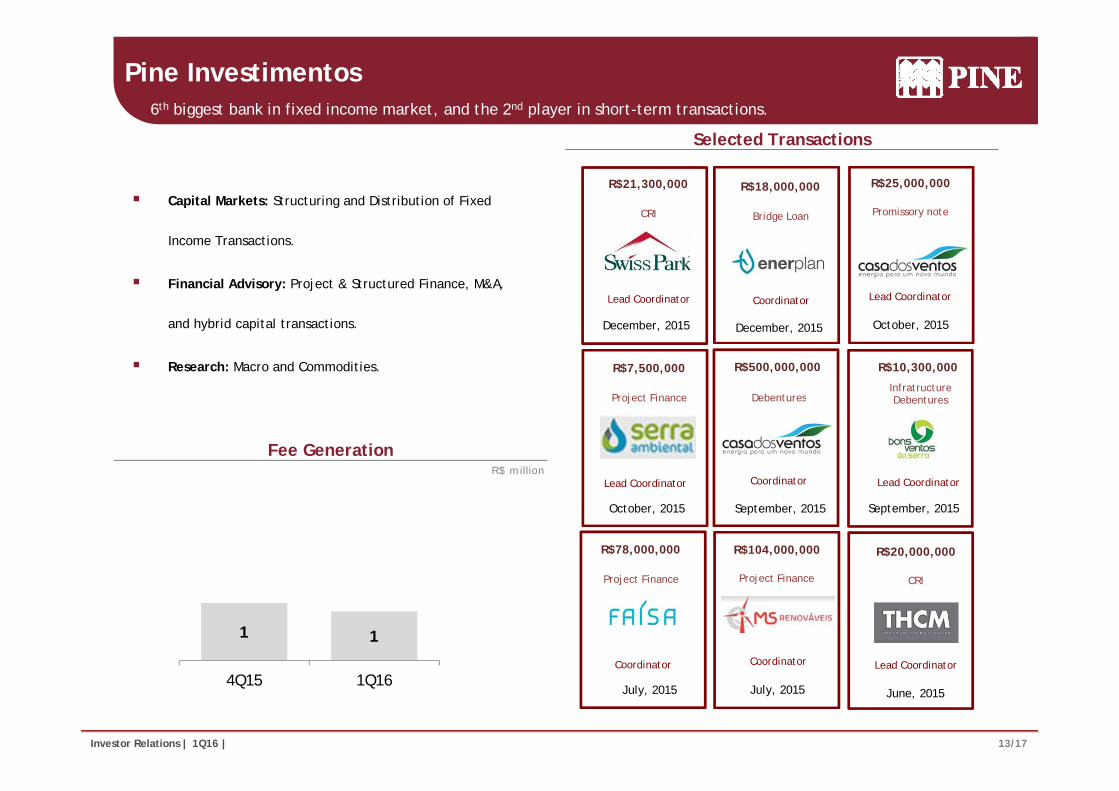
Pine Investimentos6th biggest bank in fixed income market, and the 2nd player in short-term transactions.
R$25,000,000
Promissory note
Selected Transactions
Capital Markets: Structuring and Distribution of Fixed CRI
R$21,300,000
Bridge Loan
R$18,000,000
y
Lead Coordinator
Income Transactions.
Financial Advisory: Project & Structured Finance, M&A,
CRI
Lead Coordinator
Bridge Loan
Coordinator
October, 2015
Infratructure
R$10,300,000
and hybrid capital transactions.
Research: Macro and Commodities.
December, 2015 December, 2015
P j t Fi
R$7,500,000
Debent res
R$500,000,000
Debentures
Lead CoordinatorR$ million
Fee Generation
Lead Coordinator
Project Finance Debentures
Coordinator
P j t Fi
R$104,000,000
September, 2015
Lead CoordinatorLead Coordinator
October, 2015
P j Fi
R$78,000,000
September, 2015
R$20,000,000
Project Finance
Coordinator
Project Finance
Coordinator
CRI
Lead Coordinator
1 1
13/17Investor Relations | 1Q16 |A parte de imagem com identificação de relação rId27 não foi encontrada no arquivo.
July, 2015
Coo d ato
July, 2015
Coordinator
June, 2015
Lead Coordinator
4Q15 1Q16
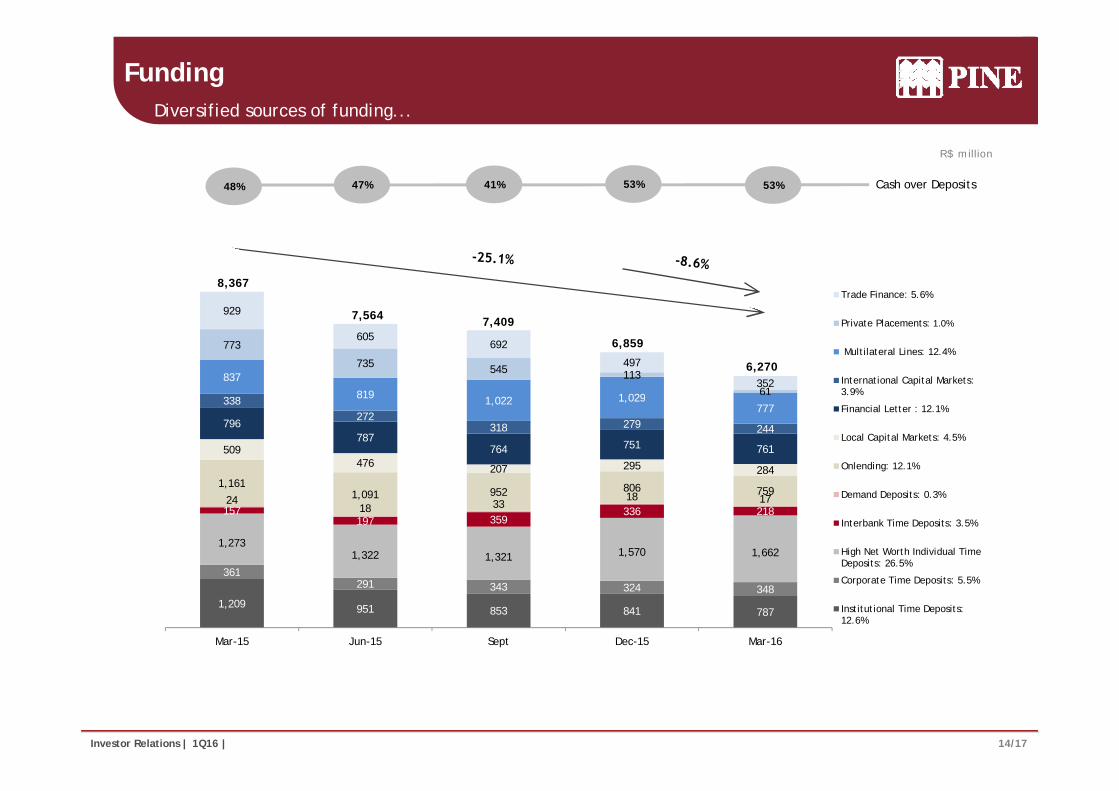
FundingDiversified sources of funding...
R$ million
48% 47% 41% 53% 53% Cash over Deposits
8,367Trade Finance: 5.6%
837
819 1 029
773
735 545 113
61
929
605692
497
352
7,564 7,409
6,859
6,270
Private Placements: 1%
Multilateral Lines: 12.4%
International Capital Markets:3.9%
1.0%
1 161 806
509476 207 295 284
796787
764 751 761
338272
318 279 244
819 1,022 1,029777 Financial Letter : 12.1%
Local Capital Markets: 4.5%
Onlending: 12.1%
361
1,2731,322 1,321 1,570 1,662
157197 359
336 21824
18 3318 17
1,1611,091 952 806 759 Demand Deposits: 0.3%
Interbank Time Deposits: 3.5%
High Net Worth Individual TimeDeposits: 26.5%
1,209 951 853 841 787
361291 343 324 348
Mar-15 Jun-15 Sept Dec-15 Mar-16
Corporate Time Deposits: 5.5%
Institutional Time Deposits:12.6%
14/17Investor Relations | 1Q16 |A parte de imagem com identificação de relação rId27 não foi encontrada no arquivo.
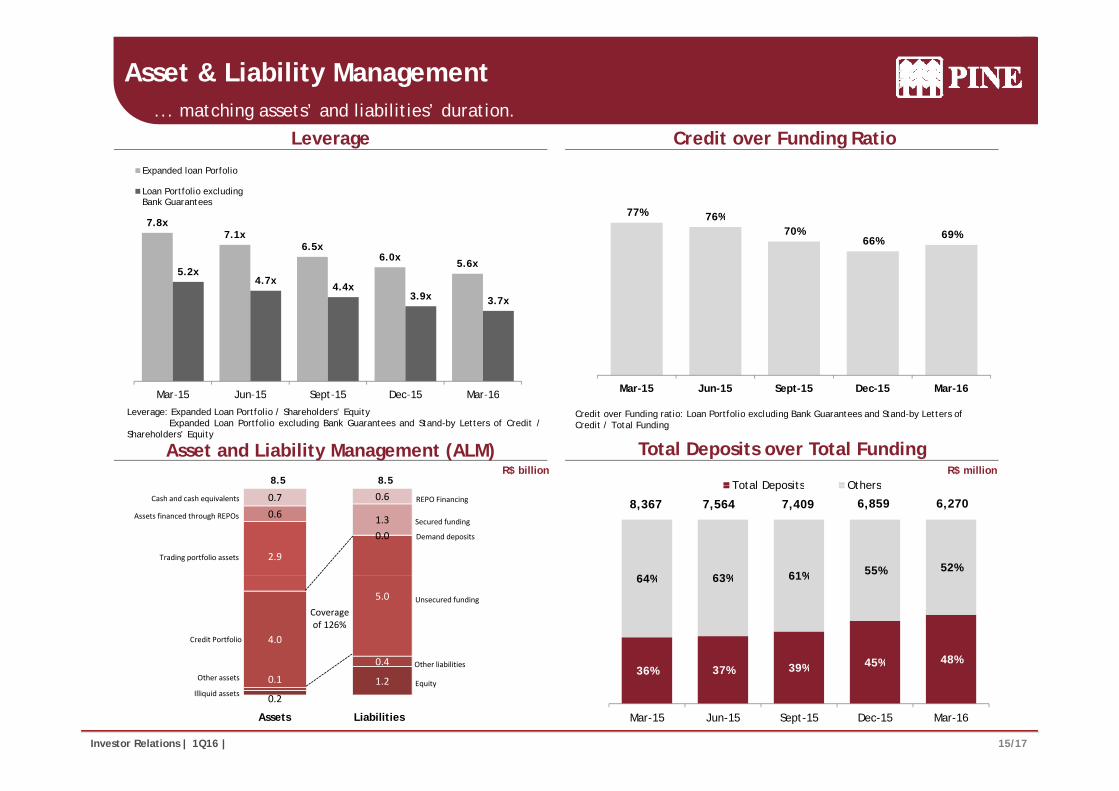
Asset & Liability Management... matching assets’ and liabilities’ duration.
77% 76% 9.00
10.00
Expanded loan Porfolio
Loan Portfolio excludingBank Guarantees
Leverage Credit over Funding Ratio
76%70%
66% 69%7.8x
7.1x6.5x
6.0x5.6x
5.2x4.7x
4.4x3.9x 3.7x
4.00
5.00
6.00
7.00
8.00
Mar-15 Jun-15 Sept-15 Dec-15 Mar-16 ‐
1.00
2.00
3.00
Mar-15 Jun-15 Sept-15 Dec-15 Mar-16
8.5 8.5 Total Deposits Others
Mar 15 Jun 15 Sept 15 Dec 15 Mar 16
Leverage: Expanded Loan Portfolio / Shareholders’ EquityExpanded Loan Portfolio excluding Bank Guarantees and Stand-by Letters of Credit /
Shareholders’ Equity
Credit over Funding ratio: Loan Portfolio excluding Bank Guarantees and Stand-by Letters ofCredit / Total Funding
Total Deposits over Total FundingR$ millionR$ billion
Asset and Liability Management (ALM)
0.01.3
0.6
2.9
0.60.7Cash and cash equivalents
Assets financed through REPOs
Trading portfolio assets
Secured funding
Demand deposits
REPO Financing
64% 63% 61% 55% 52%
Total Deposits Others
6,8598,367 7,564 7,409 6,270
0.4
5.0
4.0
Coverage of 126%
Credit Portfolio
Other liabilities
Unsecured funding
39% 45% 48%
64% 63% 61%
15/17Investor Relations | 1Q16 |A parte de imagem com identificação de relação rId27 não foi encontrada no arquivo.
1.2
0.4
Assets
0.2
0.1
Liabilities
Other assets
Illiquid assets
Other liabilities
Equity36% 37% 39% 45%
Mar-15 Jun-15 Sept-15 Dec-15 Mar-16
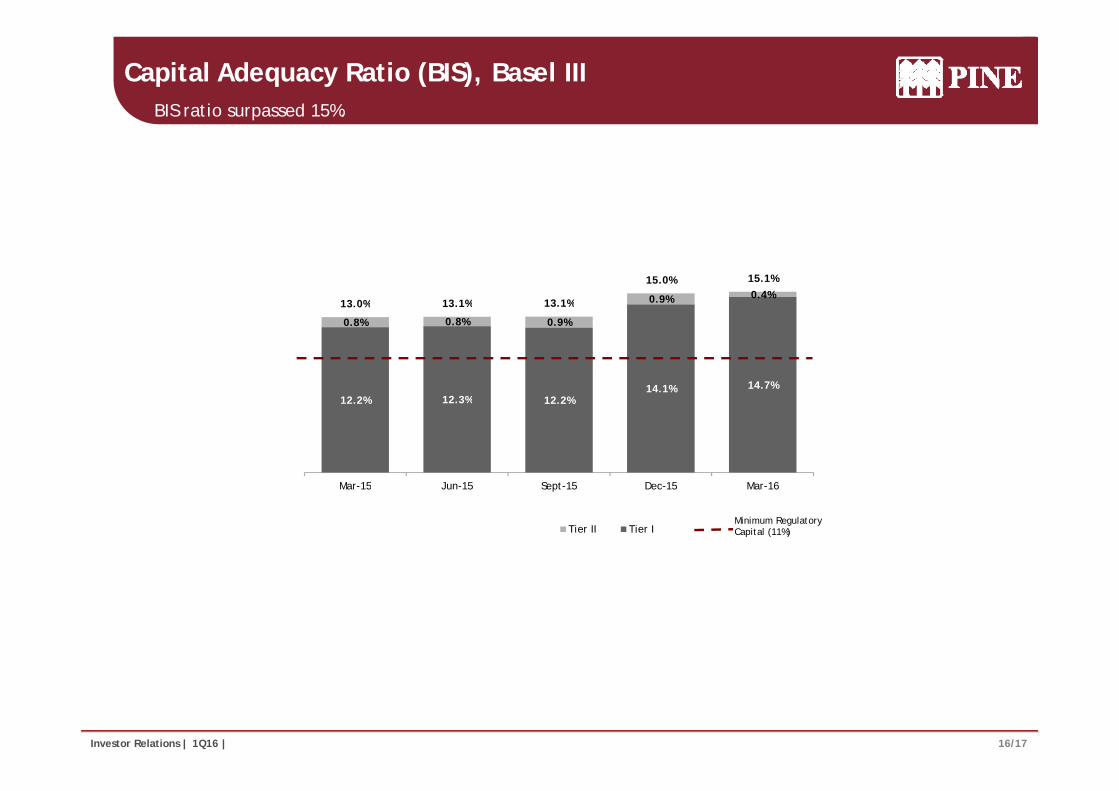
Capital Adequacy Ratio (BIS), Basel III BIS ratio surpassed 15%.
0.9% 0.4%13.0% 13.1% 13.1%
15.0% 15.1%
12 3%14.1% 14.7%
0.8% 0.8% 0.9%
13.0% 13.1% 13.1%
12.2% 12.3% 12.2%
Mar 15 Jun 15 Sept 15 Dec 15 Mar 16Mar-15 Jun-15 Sept-15 Dec-15 Mar-16
Tier II Tier IMinimum Regulatory Capital (11%)
16/17Investor Relations | 1Q16 |A parte de imagem com identificação de relação rId27 não foi encontrada no arquivo.
Investor Relations
Norberto Zaiet Junior
CEO
João BritoCFO
Raquel Varela BastosHead of Investor Relations, Funding & Distribution, Marketing & Press
Luiz MaximoInvestor Relations Coordinator
Gabriel NettoInvestor Relations Analyst
Phone: (55 11) 3372-5343
17/17Investor Relations | 1Q16 |A parte de imagem com identificação de relação rId27 não foi encontrada no arquivo.
This report may contain forward-looking statements concerning the business prospects, projections of operating and financial results and growth outlook of PINE. These are merely projections and as suchare based solely on management’s expectations regarding the future of the business. These statements depend substantially on market conditions, the performance of the sector and the Brazilian economy(political and economic changes, volatility in interest and exchange rates, technological changes, inflation, financial disintermediation, competitive pressures on products and prices and changes in taxlegislation) and therefore are subject to change without prior notice.