Embed Size (px)
Citation preview

NYSE: NLSN
TUESDAY JULY 26, 2016 8:00AM ET
2ND QUARTER 2016 RESULTS
Co
pyr
igh
t ©
2016
Th
e N
iels
en C
om
pan
y.
2NLSN 2Q 2016 Results
SAFE HARBOR FOR FORWARD-LOOKING STATEMENTS
The following discussion contains forward-looking statements, including those about Nielsen’s outlook and
prospects, that relate to the Private Securities Litigation Reform Act of 1995. Forward-looking statements
are those which are not historical facts. These and other statements that relate to future results and
events are based on Nielsen’s current expectations as of July 26, 2016.
Our actual results in future periods may differ materially from those currently expected because of a
number of risks and uncertainties. The risks and uncertainties that we believe are material are outlined in
our disclosure filings and materials, which you can find on http://ir.nielsen.com. Please consult these
documents for a more complete understanding of these risks and uncertainties. We disclaim any intention
or obligation to update or revise any forward-looking statements, whether as a result of new information,
future events or otherwise, except as may be required by law.
Our outlook is provided for the purpose of providing information about current expectations for 2016. This
information may not be appropriate for other purposes.
MITCH BARNSCHIEF EXECUTIVE OFFICER

Co
pyr
igh
t ©
2016
Th
e N
iels
en C
om
pan
y.
4NLSN 2Q 2016 Results
SECOND QUARTER 2016 OVERVIEW
CONSISTENT, RESILIENT BUSINESS MODEL DELIVERING SOLID GROWTH AND PROFITABILITY
• Another quarter of steady, consistent performance
- Revenue of $1.6 billion…up 4.5% constant currency
- Adjusted EBITDA of $490 million…up 6.5% constant currency
- Adjusted net income per share of $0.71…up 9.2% constant currency
• Executing on our balanced capital allocation framework
- ~$550 million remaining under existing share repurchase authorization as of June 30th
• Reiterating 2016 guidance
Co
pyr
igh
t ©
2016
Th
e N
iels
en C
om
pan
y.
5NLSN 2Q 2016 Results
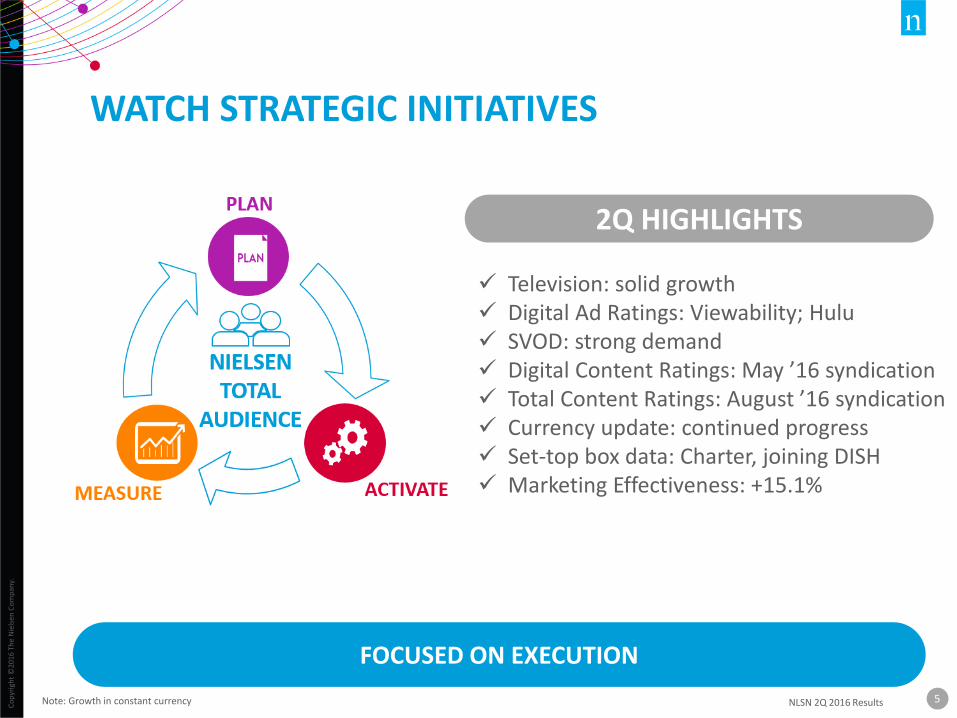
WATCH STRATEGIC INITIATIVES
2Q HIGHLIGHTS
Television: solid growth Digital Ad Ratings: Viewability; Hulu SVOD: strong demand Digital Content Ratings: May ’16 syndication Total Content Ratings: August ’16 syndication Currency update: continued progress Set-top box data: Charter, joining DISH Marketing Effectiveness: +15.1%
FOCUSED ON EXECUTION
Note: Growth in constant currency
Co
pyr
igh
t ©
2016
Th
e N
iels
en C
om
pan
y.
6NLSN 2Q 2016 Results
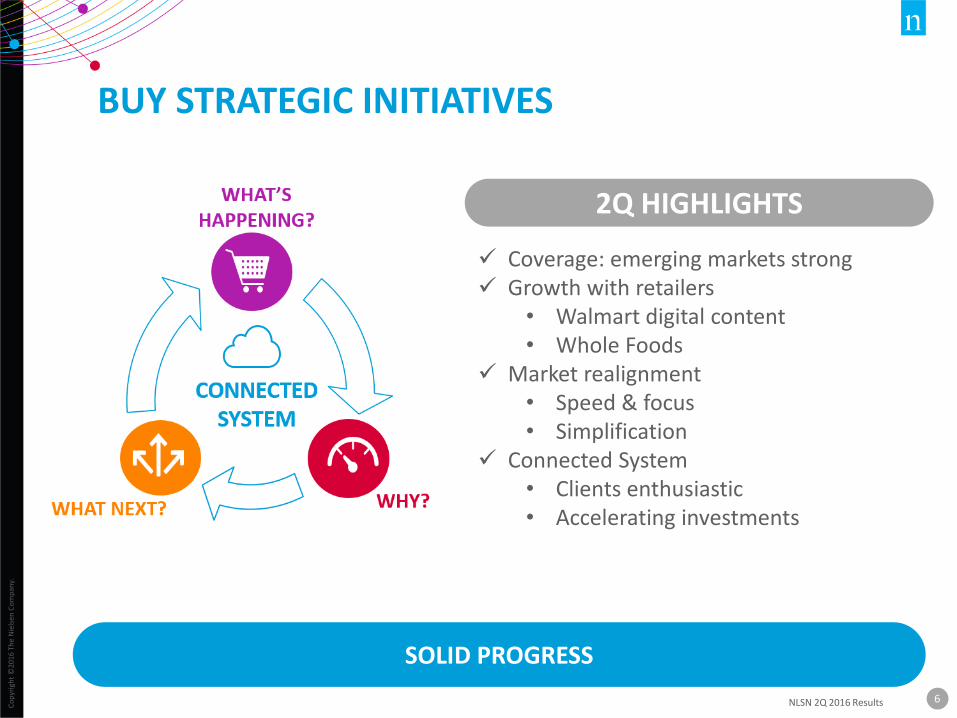
BUY STRATEGIC INITIATIVES
2Q HIGHLIGHTS
Coverage: emerging markets strong Growth with retailers
• Walmart digital content• Whole Foods
Market realignment• Speed & focus• Simplification
Connected System• Clients enthusiastic• Accelerating investments
SOLID PROGRESS
JAMERE JACKSONCHIEF FINANCIAL OFFICER
Co
pyr
igh
t ©
2016
Th
e N
iels
en C
om
pan
y.
8NLSN 2Q 2016 Results
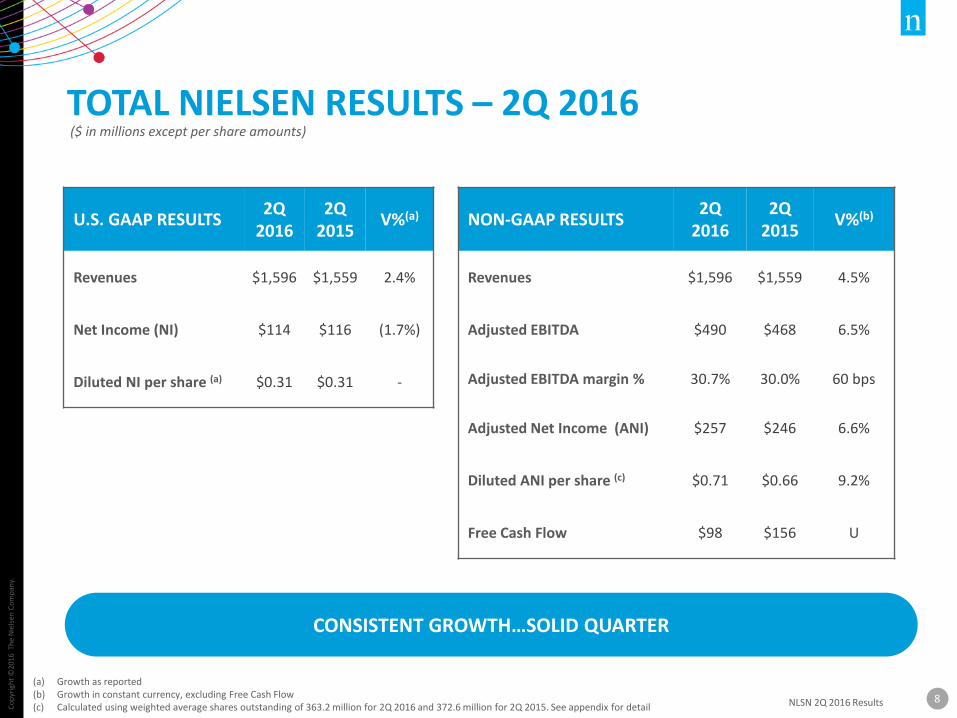
TOTAL NIELSEN RESULTS – 2Q 2016($ in millions except per share amounts)
NON-GAAP RESULTS2Q
20162Q
2015V%(b)
Revenues $1,596 $1,559 4.5%
Adjusted EBITDA $490 $468 6.5%
Adjusted EBITDA margin % 30.7% 30.0% 60 bps
Adjusted Net Income (ANI) $257 $246 6.6%
Diluted ANI per share (c) $0.71 $0.66 9.2%
Free Cash Flow $98 $156 U
(a) Growth as reported(b) Growth in constant currency, excluding Free Cash Flow(c) Calculated using weighted average shares outstanding of 363.2 million for 2Q 2016 and 372.6 million for 2Q 2015. See appendix for detail
U.S. GAAP RESULTS2Q
20162Q
2015V%(a)
Revenues $1,596 $1,559 2.4%
Net Income (NI) $114 $116 (1.7%)
Diluted NI per share (a) $0.31 $0.31 -
CONSISTENT GROWTH…SOLID QUARTER
Co
pyr
igh
t ©
2016
Th
e N
iels
en C
om
pan
y.
9NLSN 2Q 2016 Results
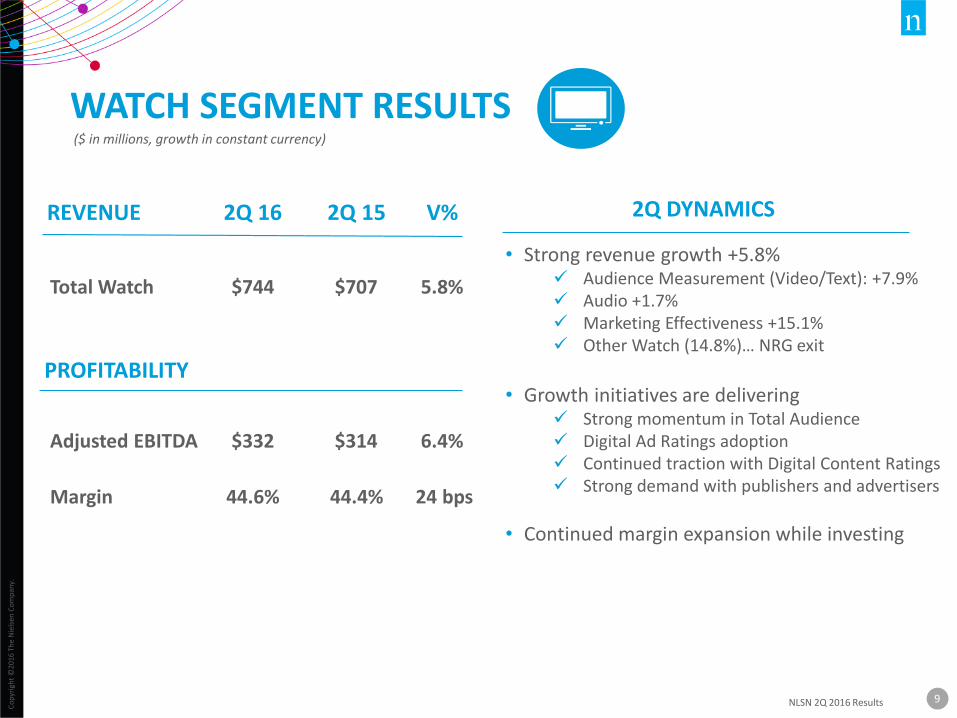
WATCH SEGMENT RESULTS ($ in millions, growth in constant currency)
REVENUE
PROFITABILITY
2Q DYNAMICS
Total Watch
Adjusted EBITDA
Margin
$744
$332
44.6%
2Q 16
$707
$314
44.4%
2Q 15
5.8%
6.4%
24 bps
V%
• Strong revenue growth +5.8% Audience Measurement (Video/Text): +7.9% Audio +1.7% Marketing Effectiveness +15.1% Other Watch (14.8%)… NRG exit
• Growth initiatives are delivering Strong momentum in Total Audience Digital Ad Ratings adoption Continued traction with Digital Content Ratings Strong demand with publishers and advertisers
• Continued margin expansion while investing
Co
pyr
igh
t ©
2016
Th
e N
iels
en C
om
pan
y.
10NLSN 2Q 2016 Results
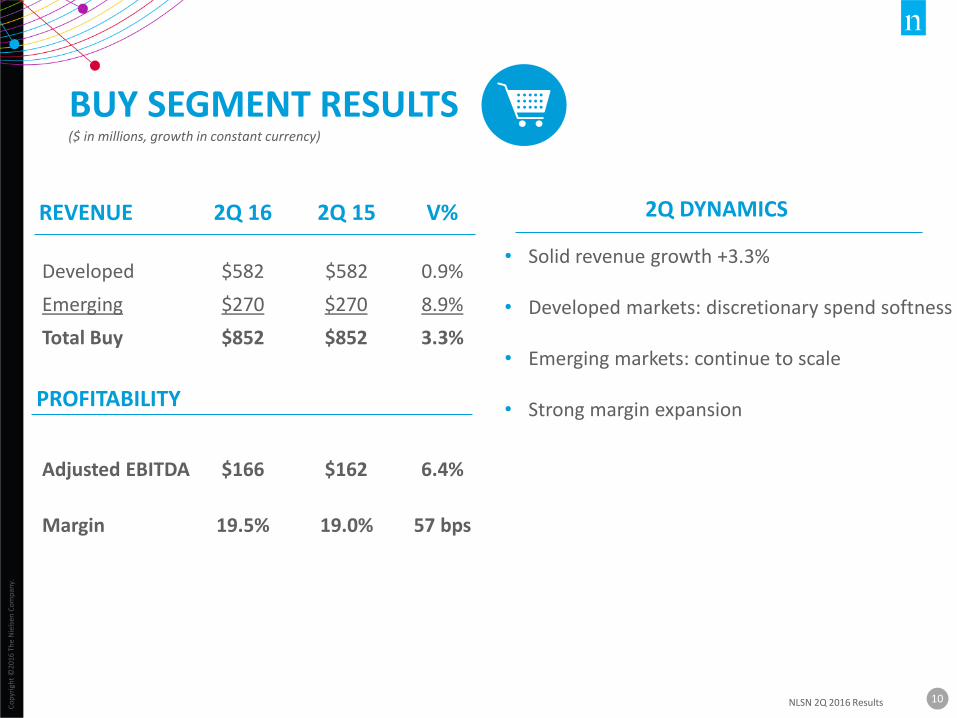
BUY SEGMENT RESULTS ($ in millions, growth in constant currency)
REVENUE
PROFITABILITY
2Q DYNAMICS
Developed
Adjusted EBITDA
Margin
$582
$166
19.5%
2Q 16
$582
$162
19.0%
2Q 15
0.9%
6.4%
57 bps
V%
Emerging $270 $270 8.9%
Total Buy $852 $852 3.3%
• Solid revenue growth +3.3%
• Developed markets: discretionary spend softness
• Emerging markets: continue to scale
• Strong margin expansion
Co
pyr
igh
t ©
2016
Th
e N
iels
en C
om
pan
y.
11NLSN 2Q 2016 Results
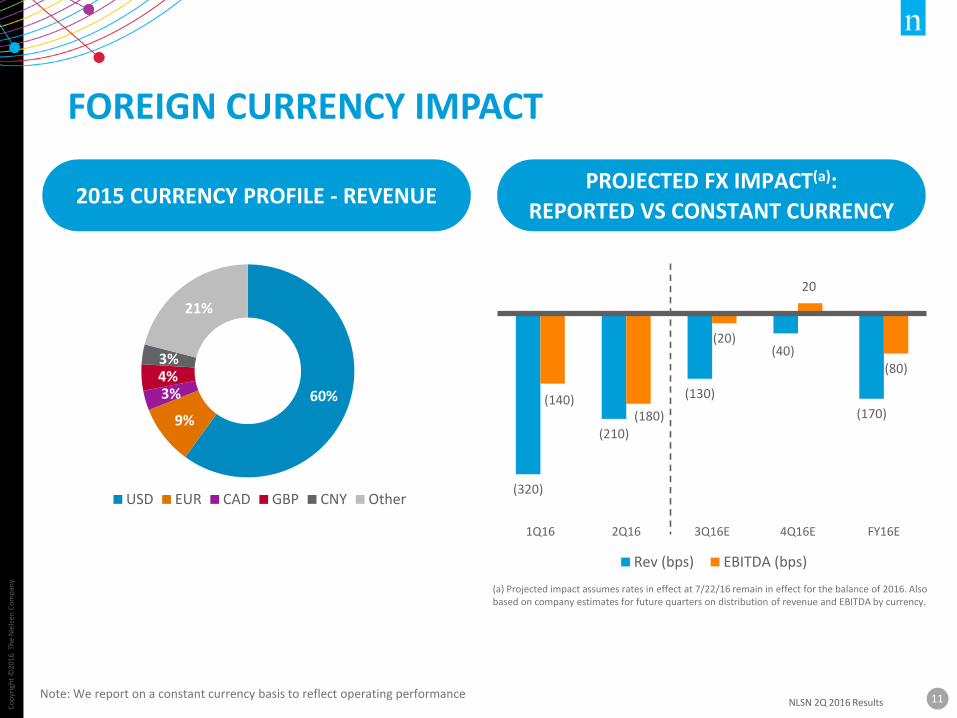
FOREIGN CURRENCY IMPACT
(a) Projected impact assumes rates in effect at 7/22/16 remain in effect for the balance of 2016. Also based on company estimates for future quarters on distribution of revenue and EBITDA by currency.
Note: We report on a constant currency basis to reflect operating performance
60%
9%
3%4%3%
21%
USD EUR CAD GBP CNY Other
2015 CURRENCY PROFILE - REVENUEPROJECTED FX IMPACT(a):
REPORTED VS CONSTANT CURRENCY
(320)
(210)
(130)
(40)
(170)(140)
(180)
(20)
20
(80)
1Q16 2Q16 3Q16E 4Q16E FY16E
Rev (bps) EBITDA (bps)
Co
pyr
igh
t ©
2016
Th
e N
iels
en C
om
pan
y.
12NLSN 2Q 2016 Results
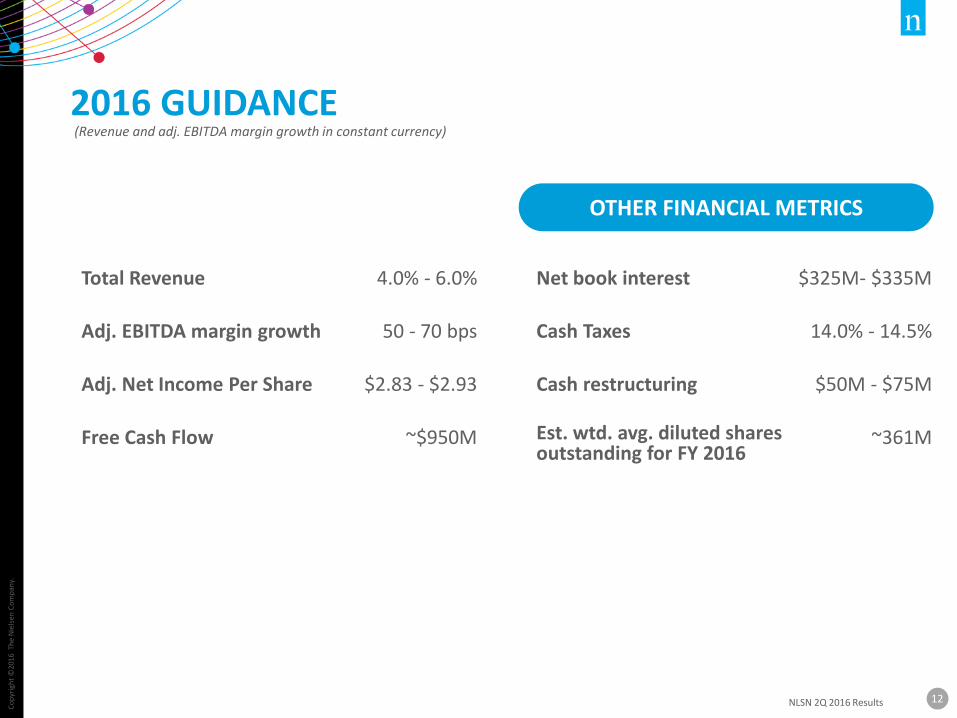
2016 GUIDANCE(Revenue and adj. EBITDA margin growth in constant currency)
OTHER FINANCIAL METRICS
Total Revenue 4.0% - 6.0%
Adj. EBITDA margin growth 50 - 70 bps
Adj. Net Income Per Share $2.83 - $2.93
Free Cash Flow ~$950M
Net book interest $325M- $335M
Cash Taxes 14.0% - 14.5%
Cash restructuring $50M - $75M
Est. wtd. avg. diluted shares outstanding for FY 2016
~361M

Co
pyr
igh
t ©
2016
Th
e N
iels
en C
om
pan
y.
13NLSN 2Q 2016 Results
&
APPENDIX
Co
pyr
igh
t ©
2016
Th
e N
iels
en C
om
pan
y.
15NLSN 2Q 2016 Results
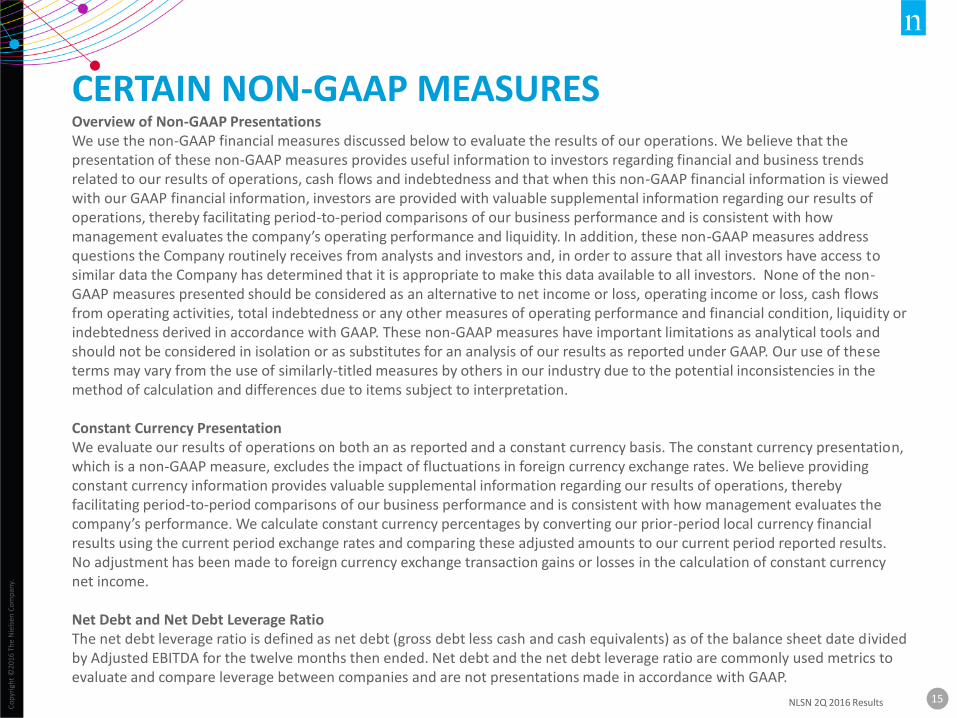
CERTAIN NON-GAAP MEASURESOverview of Non-GAAP PresentationsWe use the non-GAAP financial measures discussed below to evaluate the results of our operations. We believe that the presentation of these non-GAAP measures provides useful information to investors regarding financial and business trends related to our results of operations, cash flows and indebtedness and that when this non-GAAP financial information is viewed with our GAAP financial information, investors are provided with valuable supplemental information regarding our results of operations, thereby facilitating period-to-period comparisons of our business performance and is consistent with how management evaluates the company’s operating performance and liquidity. In addition, these non-GAAP measures address questions the Company routinely receives from analysts and investors and, in order to assure that all investors have access to similar data the Company has determined that it is appropriate to make this data available to all investors. None of the non-GAAP measures presented should be considered as an alternative to net income or loss, operating income or loss, cash flows from operating activities, total indebtedness or any other measures of operating performance and financial condition, liquidity or indebtedness derived in accordance with GAAP. These non-GAAP measures have important limitations as analytical tools and should not be considered in isolation or as substitutes for an analysis of our results as reported under GAAP. Our use of these terms may vary from the use of similarly-titled measures by others in our industry due to the potential inconsistencies in the method of calculation and differences due to items subject to interpretation.
Constant Currency PresentationWe evaluate our results of operations on both an as reported and a constant currency basis. The constant currency presentation, which is a non-GAAP measure, excludes the impact of fluctuations in foreign currency exchange rates. We believe providing constant currency information provides valuable supplemental information regarding our results of operations, thereby facilitating period-to-period comparisons of our business performance and is consistent with how management evaluates the company’s performance. We calculate constant currency percentages by converting our prior-period local currency financial results using the current period exchange rates and comparing these adjusted amounts to our current period reported results. No adjustment has been made to foreign currency exchange transaction gains or losses in the calculation of constant currency net income.
Net Debt and Net Debt Leverage RatioThe net debt leverage ratio is defined as net debt (gross debt less cash and cash equivalents) as of the balance sheet date divided by Adjusted EBITDA for the twelve months then ended. Net debt and the net debt leverage ratio are commonly used metrics to evaluate and compare leverage between companies and are not presentations made in accordance with GAAP.

Co
pyr
igh
t ©
2016
Th
e N
iels
en C
om
pan
y.
16NLSN 2Q 2016 Results
CERTAIN NON-GAAP MEASURES(continued)
Adjusted EBITDA
We define Adjusted EBITDA as net income or loss from our consolidated statements of operations before interest income and expense, income taxes, depreciation and amortization, restructuring charges, stock-based compensation expense and other non-operating items from our consolidated statements of operations as well as certain other items considered unusual or non-recurring in nature. We use Adjusted EBITDA to measure our performance from period to period both at the consolidated level as well as within our operating segments, to evaluate and fund incentive compensation programs and to compare our results to those of our competitors.
Adjusted Net Income
We define Adjusted Net Income as net income or loss from our consolidated statements of operations before income taxes, depreciation and amortization associated with acquired tangible and intangible assets, restructuring charges, other non-operating items from our consolidated statements of operations and certain other items considered unusual or non-recurring in nature, reduced by cash paid for income taxes.
Free Cash FlowWe define free cash flow as net cash provided by operating activities, plus contributions to the Nielsen Foundation, less capital expenditures, net. We believe providing free cash flow information provides valuable supplemental liquidity information regarding the cash flow that may be available for discretionary use by us in areas such as the distributions of dividends, repurchase of common stock, voluntary repayment of debt obligations or to fund our strategic initiatives, including acquisitions, if any. However, free cash flow does not represent residual cash flows entirely available for discretionary purposes; for example, the repayment of principal amounts borrowed is not deducted from free cash flow. Key limitations of the free cash flow measure include the assumptions that we will be able to refinance our existing debt when it matures and meet other cash flow obligations from financing activities, such as principal payments on debt. Free cash flow is not a presentation made in accordance with GAAP.
Co
pyr
igh
t ©
2016
Th
e N
iels
en C
om
pan
y.
17NLSN 2Q 2016 Results
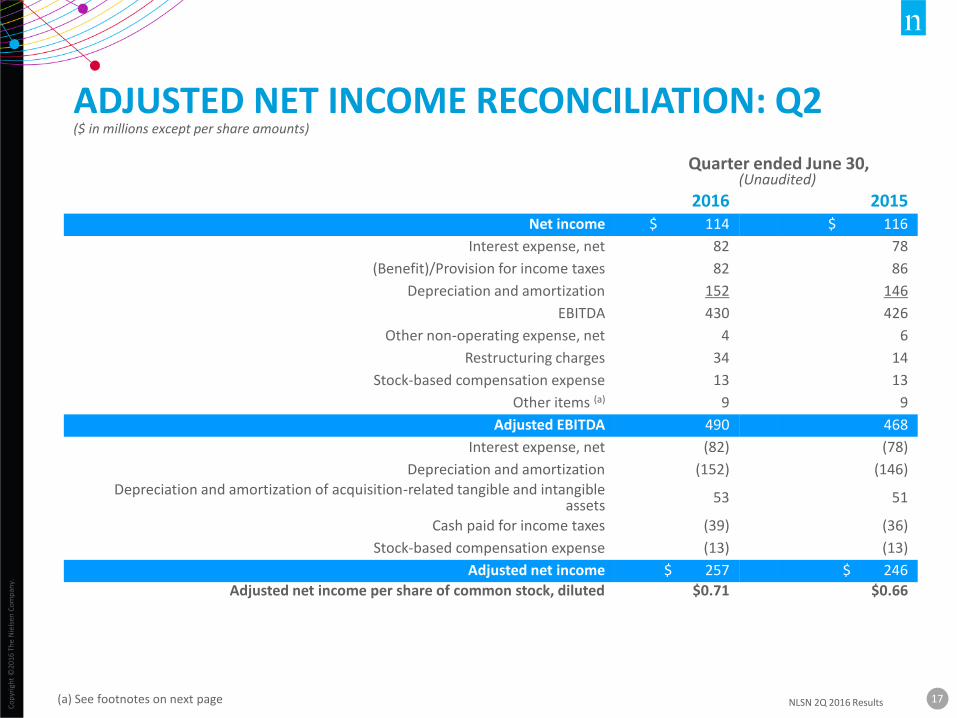
ADJUSTED NET INCOME RECONCILIATION: Q2($ in millions except per share amounts)
(a) See footnotes on next page
Quarter ended June 30,(Unaudited)
2016 2015Net income $ 114 $ 116
Interest expense, net 82 78
(Benefit)/Provision for income taxes 82 86
Depreciation and amortization 152 146
EBITDA 430 426
Other non-operating expense, net 4 6
Restructuring charges 34 14
Stock-based compensation expense 13 13
Other items (a) 9 9
Adjusted EBITDA 490 468
Interest expense, net (82) (78)
Depreciation and amortization (152) (146)
Depreciation and amortization of acquisition-related tangible and intangible assets 53 51
Cash paid for income taxes (39) (36)
Stock-based compensation expense (13) (13)
Adjusted net income $ 257 $ 246
Adjusted net income per share of common stock, diluted $0.71 $0.66
Co
pyr
igh
t ©
2016
Th
e N
iels
en C
om
pan
y.
18NLSN 2Q 2016 Results
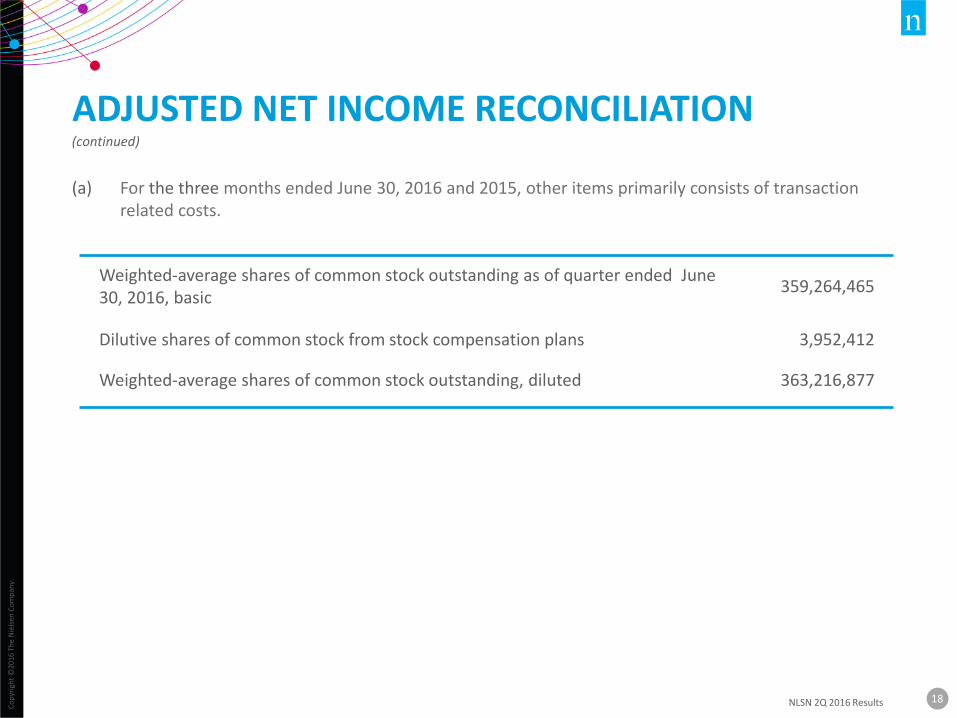
ADJUSTED NET INCOME RECONCILIATION(continued)
(a) For the three months ended June 30, 2016 and 2015, other items primarily consists of transaction related costs.
Weighted-average shares of common stock outstanding as of quarter ended June 30, 2016, basic
359,264,465
Dilutive shares of common stock from stock compensation plans 3,952,412
Weighted-average shares of common stock outstanding, diluted 363,216,877
Co
pyr
igh
t ©
2016
Th
e N
iels
en C
om
pan
y.
19NLSN 2Q 2016 Results
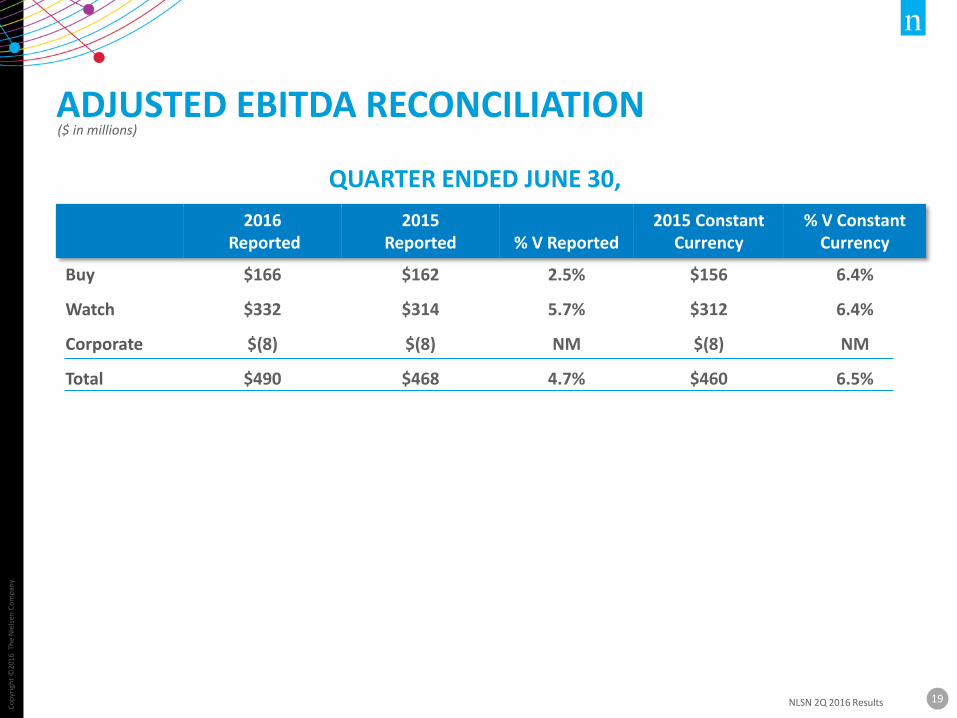
($ in millions) ADJUSTED EBITDA RECONCILIATION
2016Reported
2015Reported % V Reported
2015 Constant Currency
% V Constant Currency
Buy $166 $162 2.5% $156 6.4%
Watch $332 $314 5.7% $312 6.4%
Corporate $(8) $(8) NM $(8) NM
Total $490 $468 4.7% $460 6.5%
QUARTER ENDED JUNE 30,
Co
pyr
igh
t ©
2016
Th
e N
iels
en C
om
pan
y.
20NLSN 2Q 2016 Results
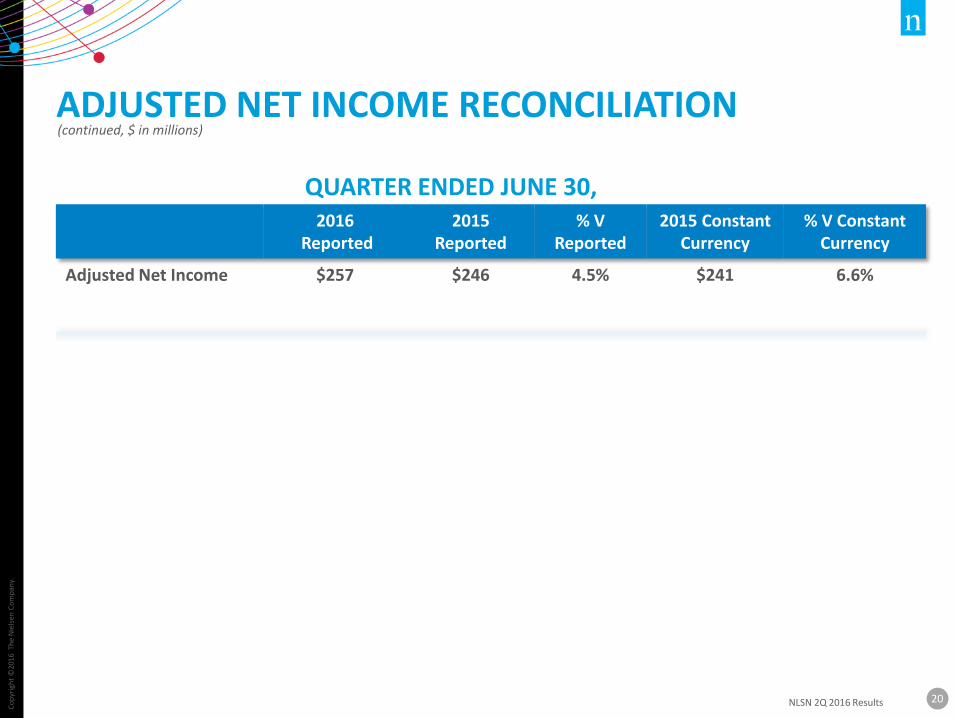
(continued, $ in millions)ADJUSTED NET INCOME RECONCILIATION
2016Reported
2015Reported
% VReported
2015 Constant Currency
% V Constant Currency
Adjusted Net Income $257 $246 4.5% $241 6.6%
QUARTER ENDED JUNE 30,
Co
pyr
igh
t ©
2016
Th
e N
iels
en C
om
pan
y.
21NLSN 2Q 2016 Results
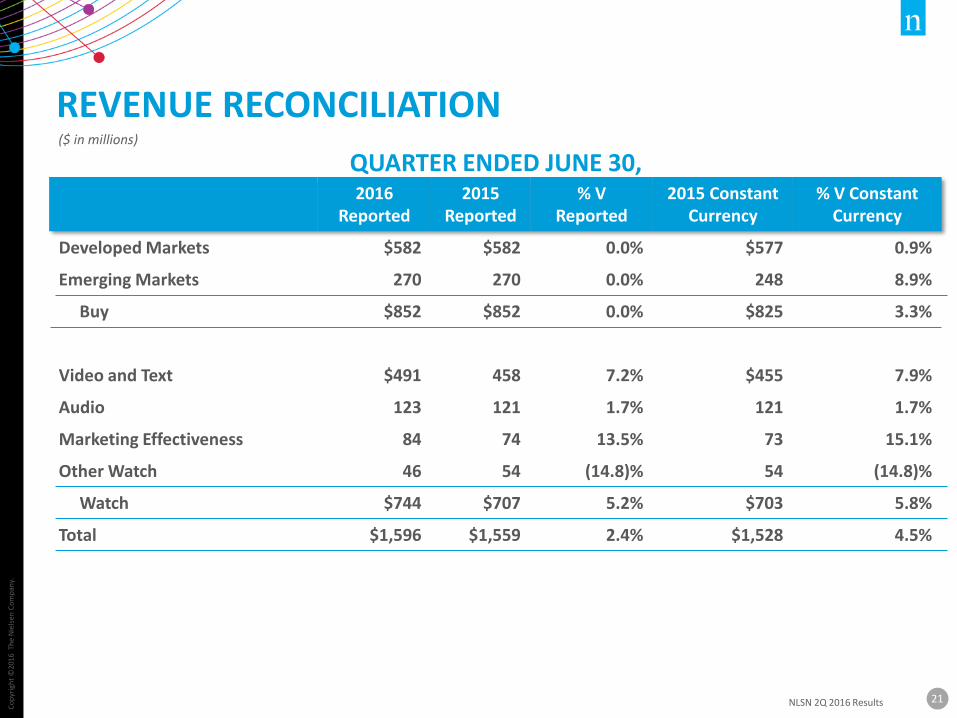
2016Reported
2015 Reported
% VReported
2015 Constant Currency
% V Constant Currency
Developed Markets $582 $582 0.0% $577 0.9%
Emerging Markets 270 270 0.0% 248 8.9%
Buy $852 $852 0.0% $825 3.3%
Video and Text $491 458 7.2% $455 7.9%
Audio 123 121 1.7% 121 1.7%
Marketing Effectiveness 84 74 13.5% 73 15.1%
Other Watch 46 54 (14.8)% 54 (14.8)%
Watch $744 $707 5.2% $703 5.8%
Total $1,596 $1,559 2.4% $1,528 4.5%
REVENUE RECONCILIATION
QUARTER ENDED JUNE 30,($ in millions)
Co
pyr
igh
t ©
2016
Th
e N
iels
en C
om
pan
y.
22NLSN 2Q 2016 Results
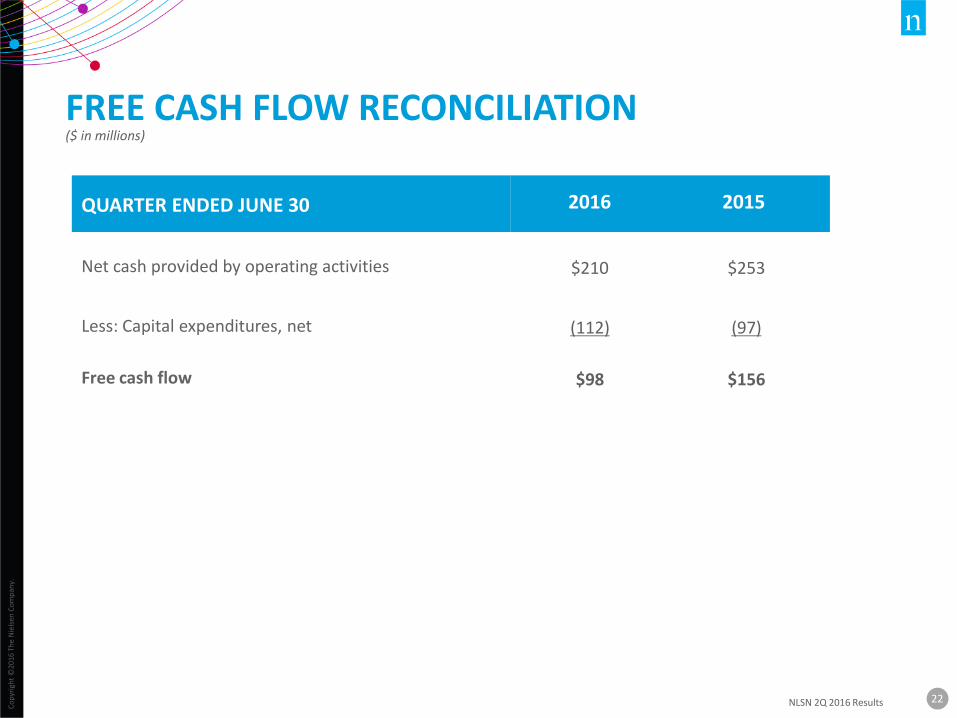
FREE CASH FLOW RECONCILIATION($ in millions)
QUARTER ENDED JUNE 30 2016 2015
Net cash provided by operating activities $210 $253
Less: Capital expenditures, net (112) (97)
Free cash flow $98 $156
Co
pyr
igh
t ©
2016
Th
e N
iels
en C
om
pan
y.
23NLSN 2Q 2016 Results
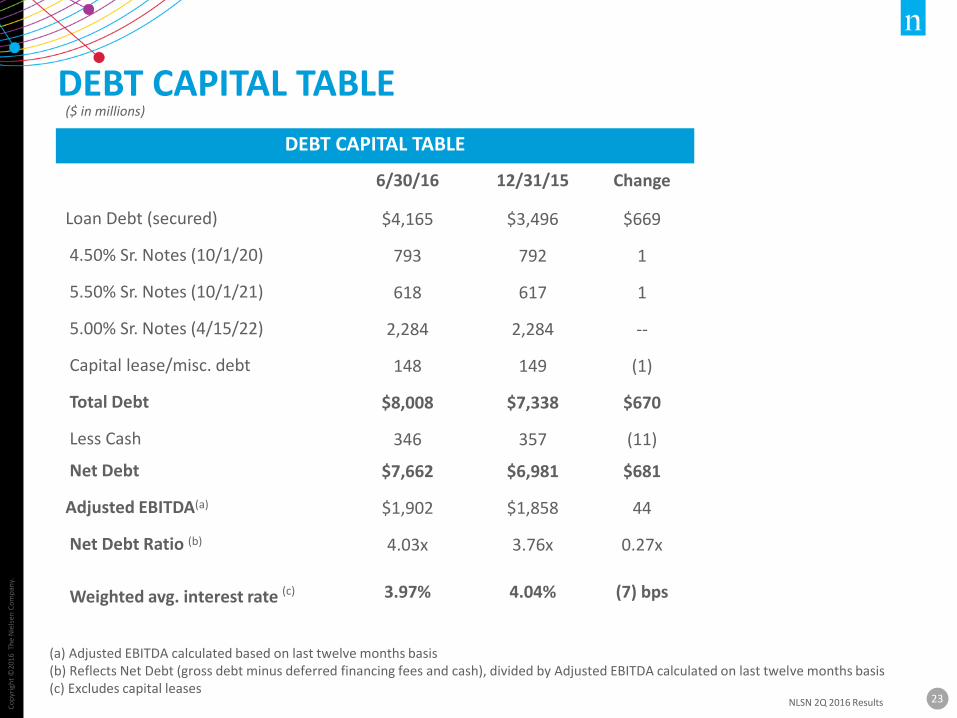
DEBT CAPITAL TABLE
(a) Adjusted EBITDA calculated based on last twelve months basis(b) Reflects Net Debt (gross debt minus deferred financing fees and cash), divided by Adjusted EBITDA calculated on last twelve months basis (c) Excludes capital leases
DEBT CAPITAL TABLE
6/30/16 12/31/15 Change
Loan Debt (secured) $4,165 $3,496 $669
4.50% Sr. Notes (10/1/20) 793 792 1
5.50% Sr. Notes (10/1/21) 618 617 1
5.00% Sr. Notes (4/15/22) 2,284 2,284 --
Capital lease/misc. debt 148 149 (1)
Total Debt $8,008 $7,338 $670
Less Cash 346 357 (11)
Net Debt $7,662 $6,981 $681
Adjusted EBITDA(a) $1,902 $1,858 44
Net Debt Ratio (b) 4.03x 3.76x 0.27x
Weighted avg. interest rate (c) 3.97% 4.04% (7) bps
($ in millions)
Co
pyr
igh
t ©
2016
Th
e N
iels
en C
om
pan
y.
24NLSN 2Q 2016 Results
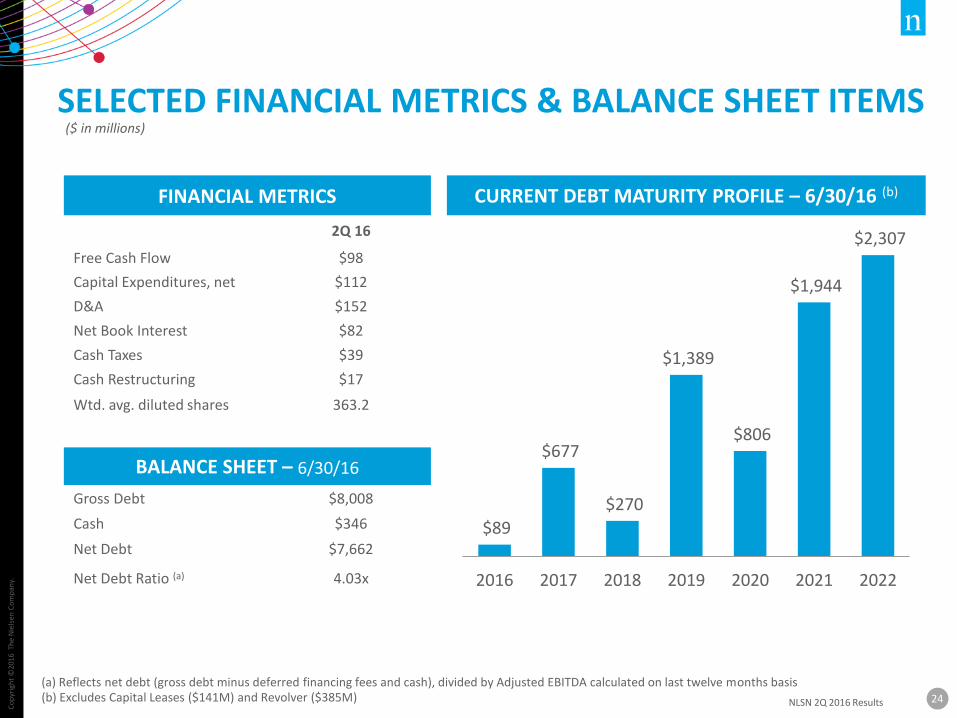
SELECTED FINANCIAL METRICS & BALANCE SHEET ITEMS
FINANCIAL METRICS
2Q 16
Free Cash Flow $98
Capital Expenditures, net $112
D&A $152
Net Book Interest $82
Cash Taxes $39
Cash Restructuring $17
Wtd. avg. diluted shares 363.2
BALANCE SHEET – 6/30/16
Gross Debt $8,008
Cash $346
Net Debt $7,662
Net Debt Ratio (a) 4.03x
CURRENT DEBT MATURITY PROFILE – 6/30/16 (b)
(a) Reflects net debt (gross debt minus deferred financing fees and cash), divided by Adjusted EBITDA calculated on last twelve months basis(b) Excludes Capital Leases ($141M) and Revolver ($385M)
($ in millions)
$89
$677
$270
$1,389
$806
$1,944
$2,307
2016 2017 2018 2019 2020 2021 2022

+1.646.654.4602
http://ir.nielsen.com
Follow Nielsen
NIELSEN INVESTOR RELATIONS


![RASRV06Q-Q2 RASRV07Q-Q2 RASRK07Q-Q2 RASR07Q-Q2 … · 7~ g^oj 537d :\7d {[K3o 5EZo6 5EZo6 .Xd YHZY]=CX ;co5J_p;AI](https://img.pdfslide.tips/doc/110x75/5fe4be6bd31a312efe7d5bd6/rasrv06q-q2-rasrv07q-q2-rasrk07q-q2-rasr07q-q2-7-goj-537d-7d-k3o-5ezo6-5ezo6.jpg)