Embed Size (px)
Citation preview
HMH Earnings Call
November 5, 2015
Third Quarter 2015
FORWARD LOOKING STATEMENTS AND NON-GAAP MEASURES
This presentation and oral statements made in connection with this presentation contain certain statements that are not historical
facts, including information regarding our intentions, beliefs or current expectations concerning, among other things, our results of
operations, including billings, net sales, deferred revenue and recognition thereof; financial condition; pre-publication or content
development costs; liquidity; financing activities and use of proceeds; products, including product mix and format; prospects; growth;
adjacent markets; strategies, including with respect to capital allocation; the market, including market size and share, and industry in
which we operate and potential business decisions. Those statements constitute “forward-looking statements” within the meaning of
the Private Securities Litigation Reform Act of 1995. Forward-looking statements involve known and unknown risks, uncertainties
and other factors that could cause our actual results to differ materially from the results express in or implied by our forward-looking
statements, including, but not limited to, those identified under the caption “Forward-Looking Statements” in our news release issued
on November 5, 2015 and in the “Special Note Regarding Forward-Looking Statements” and “Risk Factors” in our most recent
Annual Report on Form 10-K and our Quarterly Reports on Form 10-Q. We undertake no obligation, and do not expect, to publicly
update or publicly revise any forward-looking statement, whether as a result of new information, future events or otherwise.
In addition, this presentation and oral statements made in connection with this presentation reference non-GAAP financial measures,
such as adjusted EBITDA, adjusted cash EBITDA , billings and free cash flow. The use of these non-GAAP measures are limited as
they include and/ or do not include certain items not included and/or included in the most directly comparable GAAP measure. A
reconciliation of non-GAAP financial measures to the most directly comparable GAAP financial measures is provided in the appendix
to this presentation and in our news release issued on November 5, 2015, which are posted on hmhco.com under the Investor
Relations section.
hmhco.com / 2

Agenda
Welcome/Introductions
Business Update
Financial Overview
Questions and Answers
hmhco.com / 3

Business Update
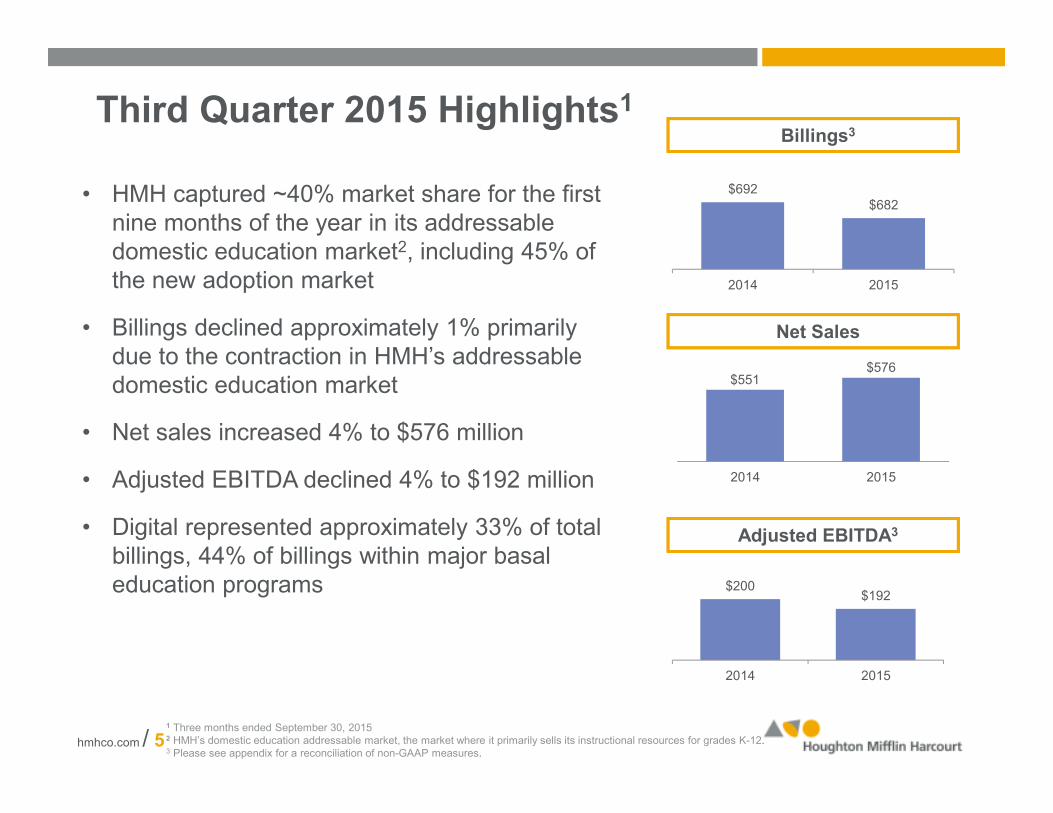
Third Quarter 2015 Highlights1
• HMH captured ~40% market share for the first nine months of the year in its addressable domestic education market2, including 45% of the new adoption market
• Billings declined approximately 1% primarily due to the contraction in HMH’s addressable domestic education market
• Net sales increased 4% to $576 million
• Adjusted EBITDA declined 4% to $192 million
• Digital represented approximately 33% of total billings, 44% of billings within major basal education programs
hmhco.com / 51 Three months ended September 30, 20152 HMH’s domestic education addressable market, the market where it primarily sells its instructional resources for grades K-12.3 Please see appendix for a reconciliation of non-GAAP measures.
$200 $192
2014 2015
$692$682
2014 2015
2014 2015
Adjusted EBITDA3
Billings3
Net Sales
$576$551
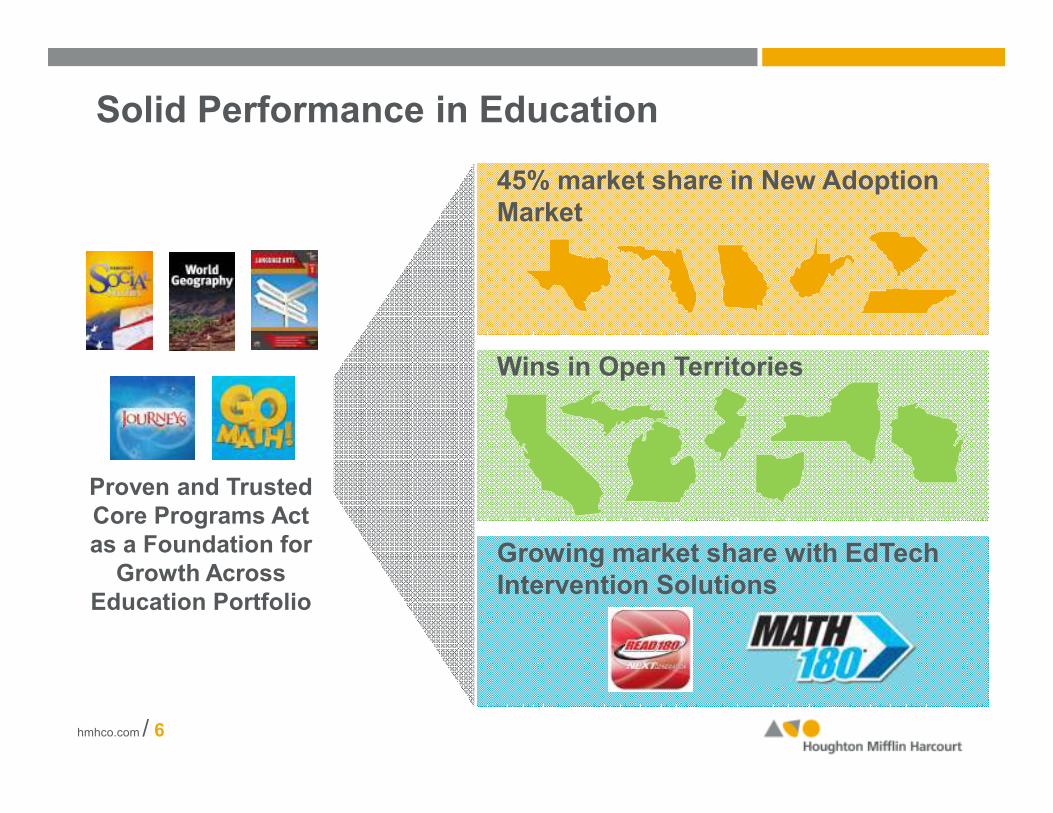
45% market share in New Adoption Market
Solid Performance in Education
Proven and Trusted Core Programs Act as a Foundation for
Growth Across Education Portfolio
Growing market share with EdTechIntervention Solutions
hmhco.com / 6
Wins in Open Territories

Curious World: “The Netflix for Learning”
• Recent launch moves offering from a simple app to a robust content service
• Subscription-based interactive service for $9.99/month or $79.99/year
• All content mapped to 8 key learning areas as defined by HMH’s Early Learning experts
• Full dashboard and complementary website for parents
• Offers children ages three to seven an ever-expanding collection of games, videos, and eBooks mapped to key learning areas
7hmhco.com / 7
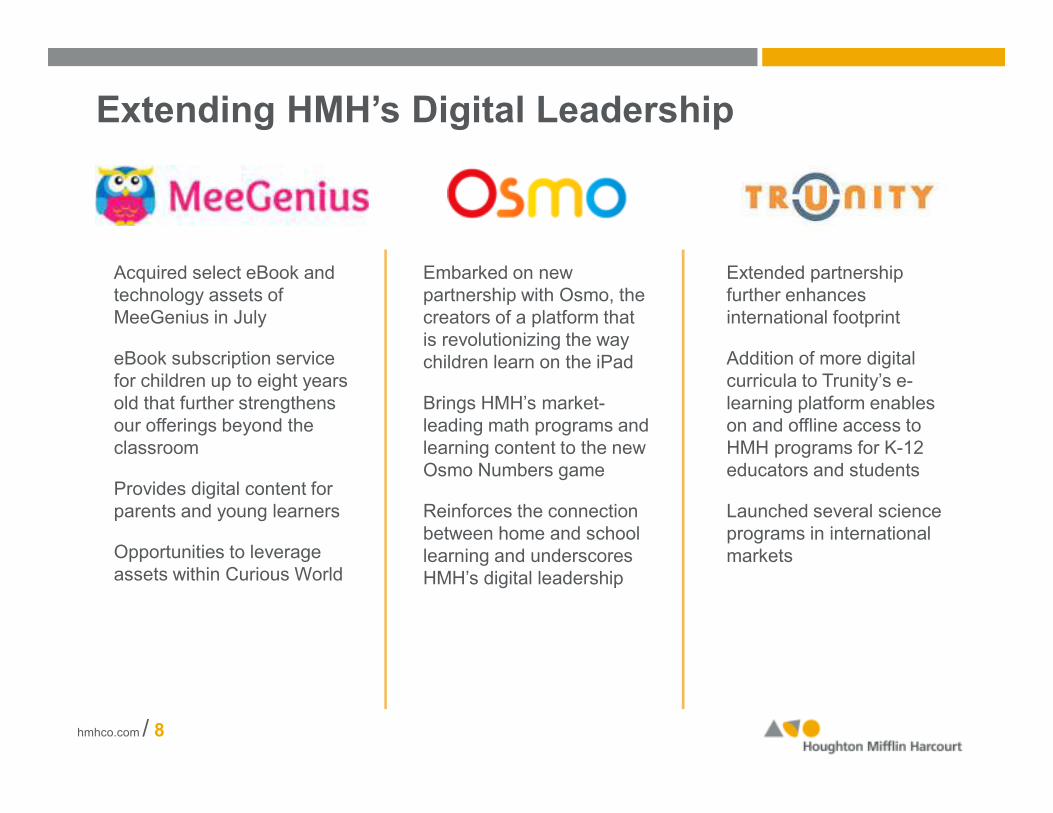
Extending HMH’s Digital Leadership
hmhco.com / 8
Acquired select eBook and technology assets of MeeGenius in July
eBook subscription service for children up to eight years old that further strengthens our offerings beyond the classroom
Provides digital content for parents and young learners
Opportunities to leverage assets within Curious World
Extended partnership further enhances international footprint
Addition of more digital curricula to Trunity’s e-learning platform enables on and offline access to HMH programs for K-12 educators and students
Launched several science programs in international markets
Embarked on new partnership with Osmo, the creators of a platform that is revolutionizing the way children learn on the iPad
Brings HMH’s market-leading math programs and learning content to the new Osmo Numbers game
Reinforces the connection between home and school learning and underscores HMH’s digital leadership

Highlights in Trade Publishing
hmhco.com / 9
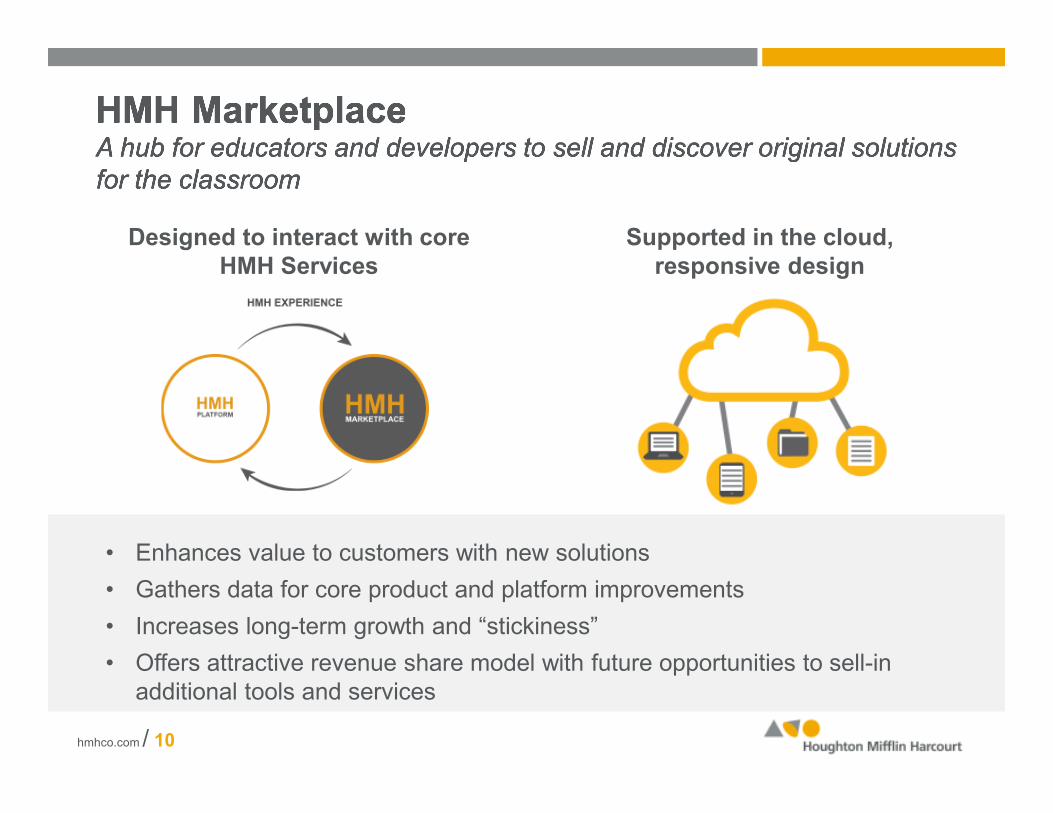
Supported in the cloud, responsive design
Designed to interact with core HMH Services
• Enhances value to customers with new solutions
• Gathers data for core product and platform improvements
• Increases long-term growth and “stickiness”
• Offers attractive revenue share model with future opportunities to sell-in additional tools and services
hmhco.com / 10
61%
10%
4%
7%
9%
6%
2%
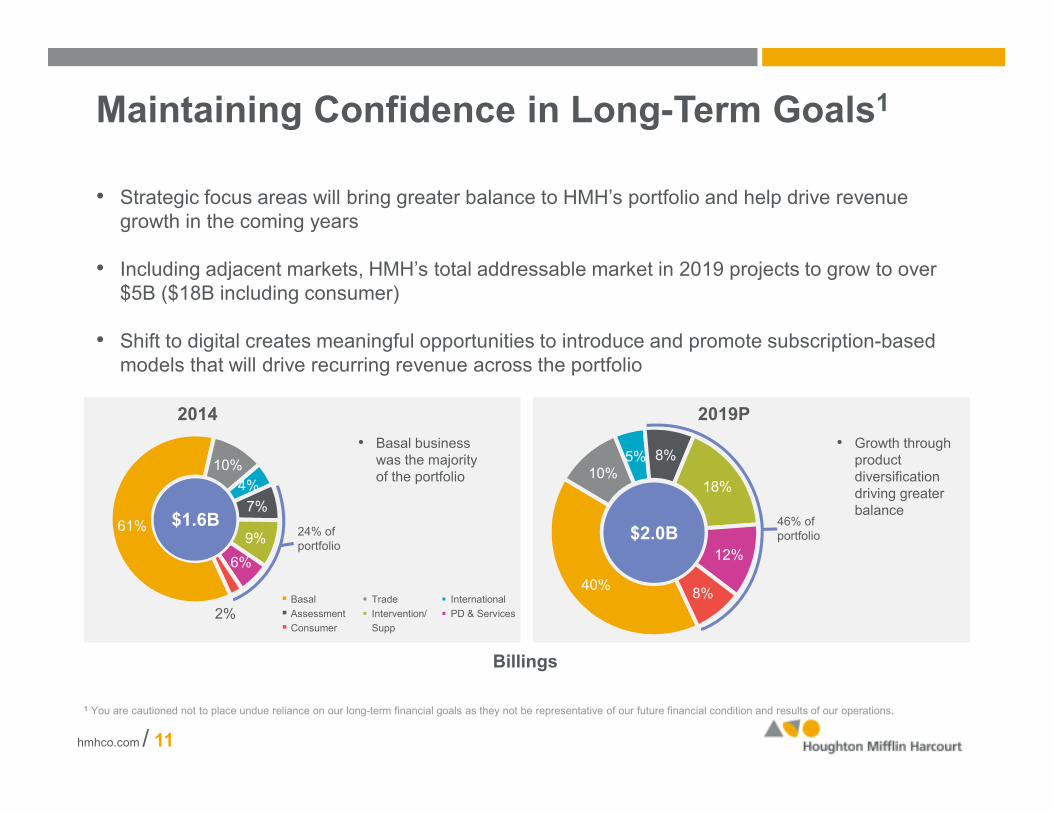
Maintaining Confidence in Long-Term Goals1
• Strategic focus areas will bring greater balance to HMH’s portfolio and help drive revenue growth in the coming years
• Including adjacent markets, HMH’s total addressable market in 2019 projects to grow to over $5B ($18B including consumer)
• Shift to digital creates meaningful opportunities to introduce and promote subscription-based models that will drive recurring revenue across the portfolio
2014
24% of portfolio
• Basal business was the majority of the portfolio
$1.6B
40%
10%5% 8%
18%
12%
8%
2019P
46% of portfolio
• Growth through product diversification driving greater balance
$2.0B
� Basal
� Assessment
� Consumer
� Trade
� Intervention/
Supp
� International
� PD & Services
hmhco.com / 11
1 You are cautioned not to place undue reliance on our long-term financial goals as they not be representative of our future financial condition and results of our operations.
Billings
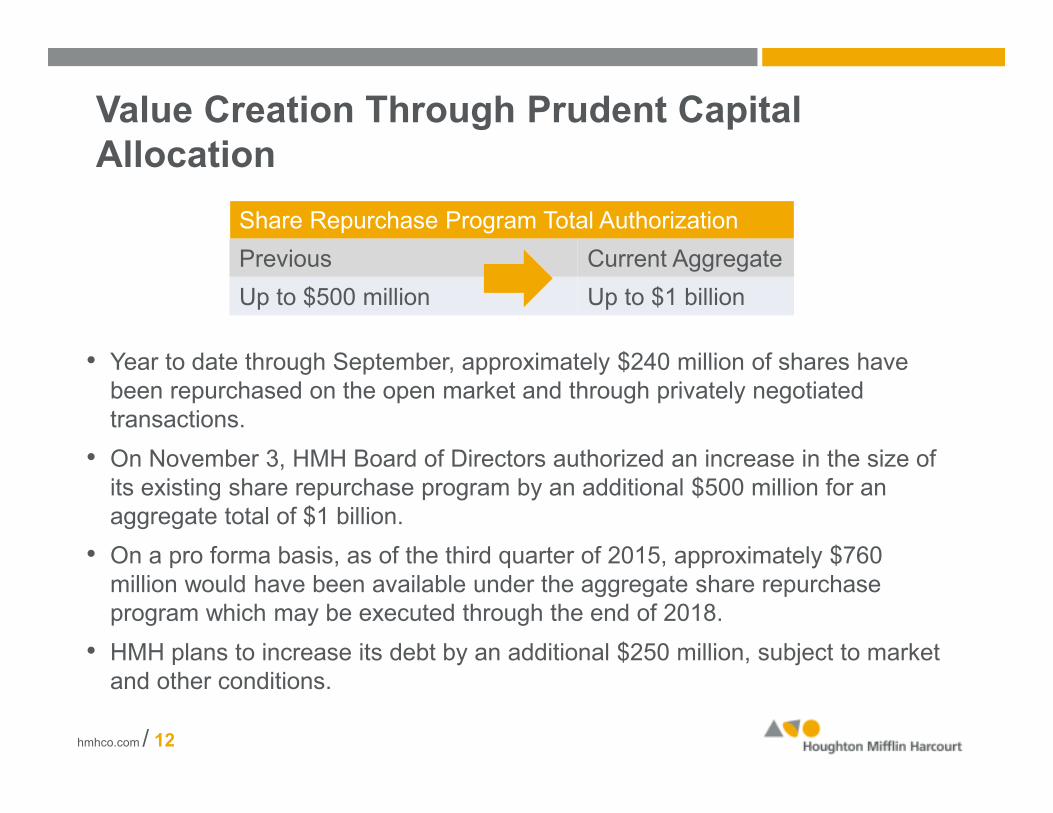
Value Creation Through Prudent Capital Allocation
• Year to date through September, approximately $240 million of shares have been repurchased on the open market and through privately negotiated transactions.
• On November 3, HMH Board of Directors authorized an increase in the size of its existing share repurchase program by an additional $500 million for an aggregate total of $1 billion.
• On a pro forma basis, as of the third quarter of 2015, approximately $760 million would have been available under the aggregate share repurchase program which may be executed through the end of 2018.
• HMH plans to increase its debt by an additional $250 million, subject to market and other conditions.
Share Repurchase Program Total Authorization
Previous Current Aggregate
Up to $500 million Up to $1 billion
hmhco.com / 12

Financial Overview
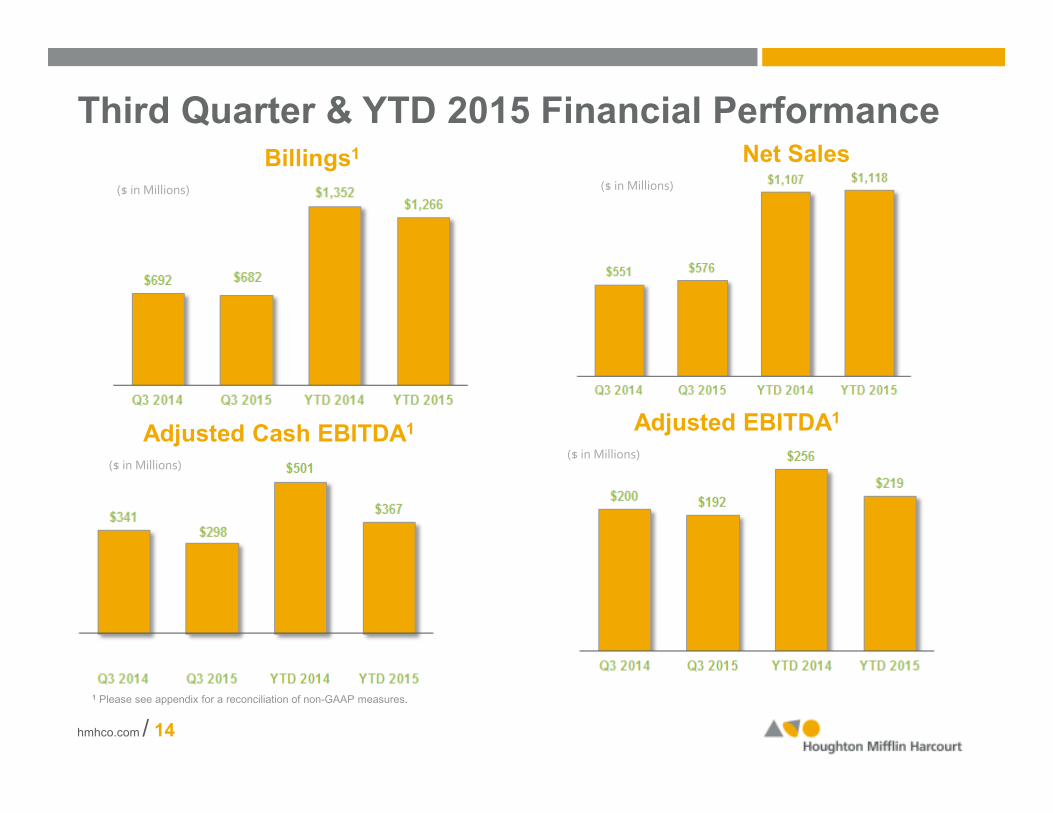
Third Quarter & YTD 2015 Financial Performance
Adjusted EBITDA1
Net Sales
1 Please see appendix for a reconciliation of non-GAAP measures.
($ in Millions)
($ in Millions)
hmhco.com / 14
Adjusted Cash EBITDA1
($ in Millions)
Billings1
($ in Millions)
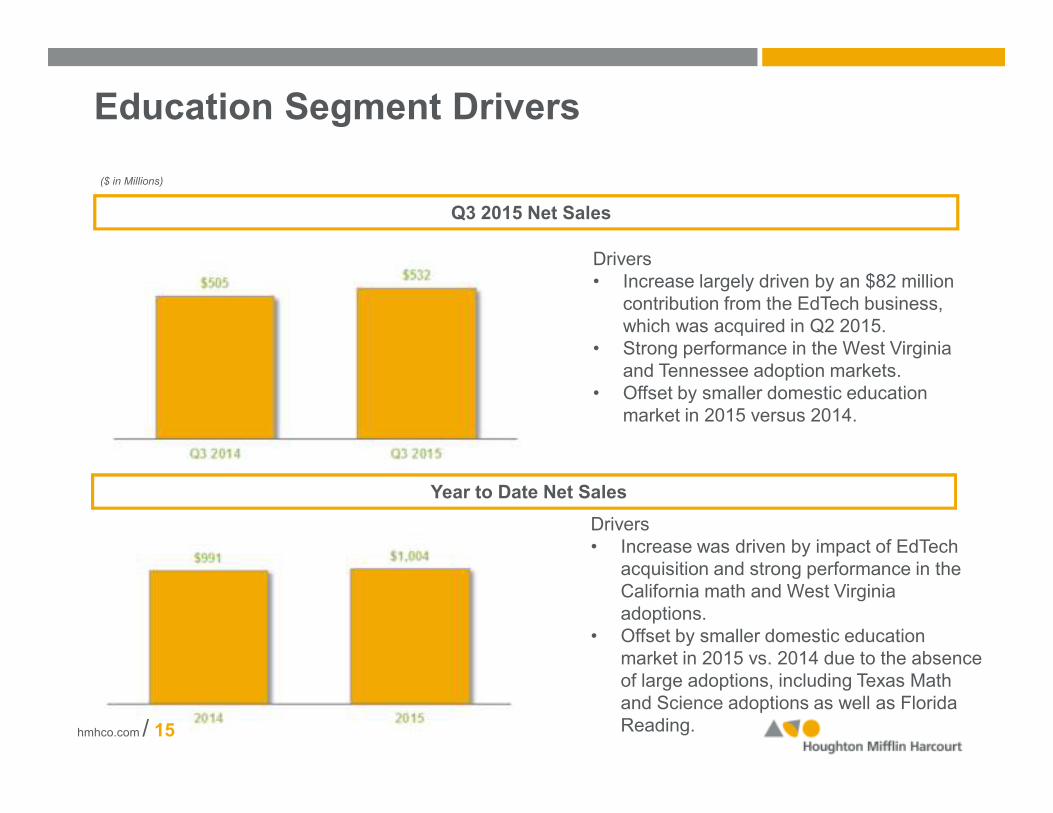
Q3 2015 Net Sales
Education Segment Drivers
($ in Millions)
Drivers• Increase largely driven by an $82 million
contribution from the EdTech business, which was acquired in Q2 2015.
• Strong performance in the West Virginia and Tennessee adoption markets.
• Offset by smaller domestic education market in 2015 versus 2014.
Year to Date Net Sales
Drivers• Increase was driven by impact of EdTech
acquisition and strong performance in the California math and West Virginia adoptions.
• Offset by smaller domestic education market in 2015 vs. 2014 due to the absence of large adoptions, including Texas Math and Science adoptions as well as Florida Reading.hmhco.com / 15
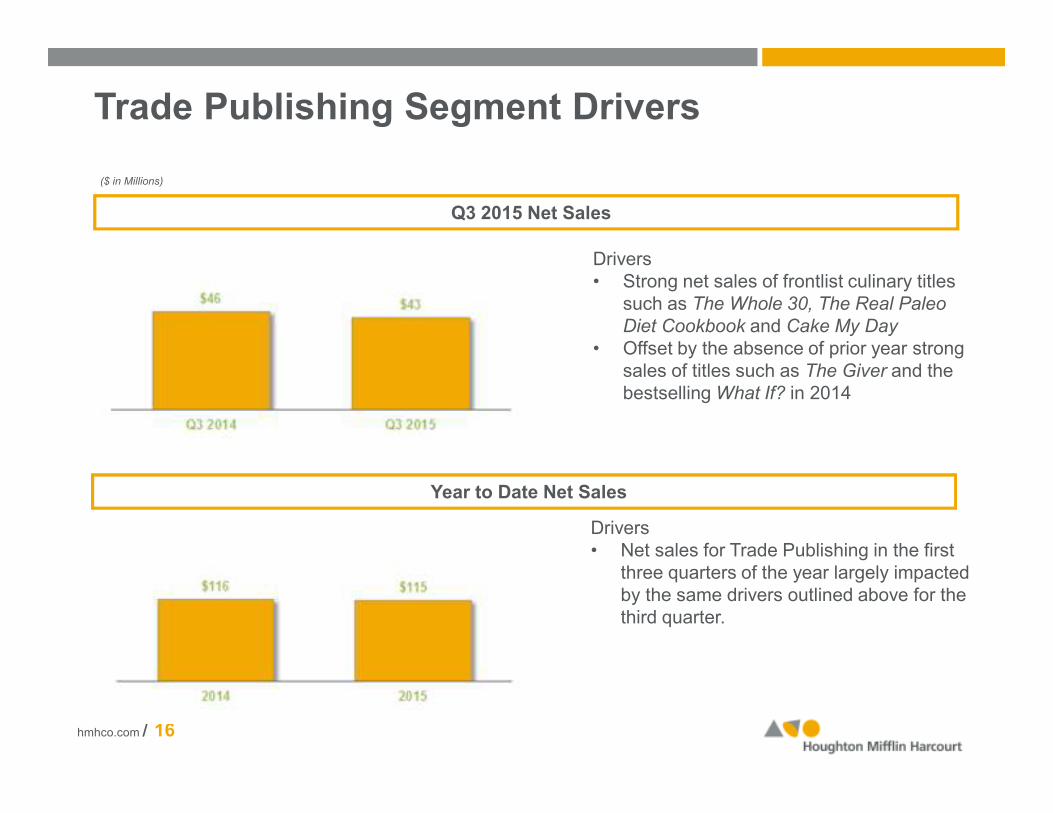
Q3 2015 Net Sales
Trade Publishing Segment Drivers
($ in Millions)
Drivers• Strong net sales of frontlist culinary titles
such as The Whole 30, The Real Paleo Diet Cookbook and Cake My Day
• Offset by the absence of prior year strong sales of titles such as The Giver and the bestselling What If? in 2014
Year to Date Net Sales
Drivers• Net sales for Trade Publishing in the first
three quarters of the year largely impacted by the same drivers outlined above for the third quarter.
hmhco.com / 16
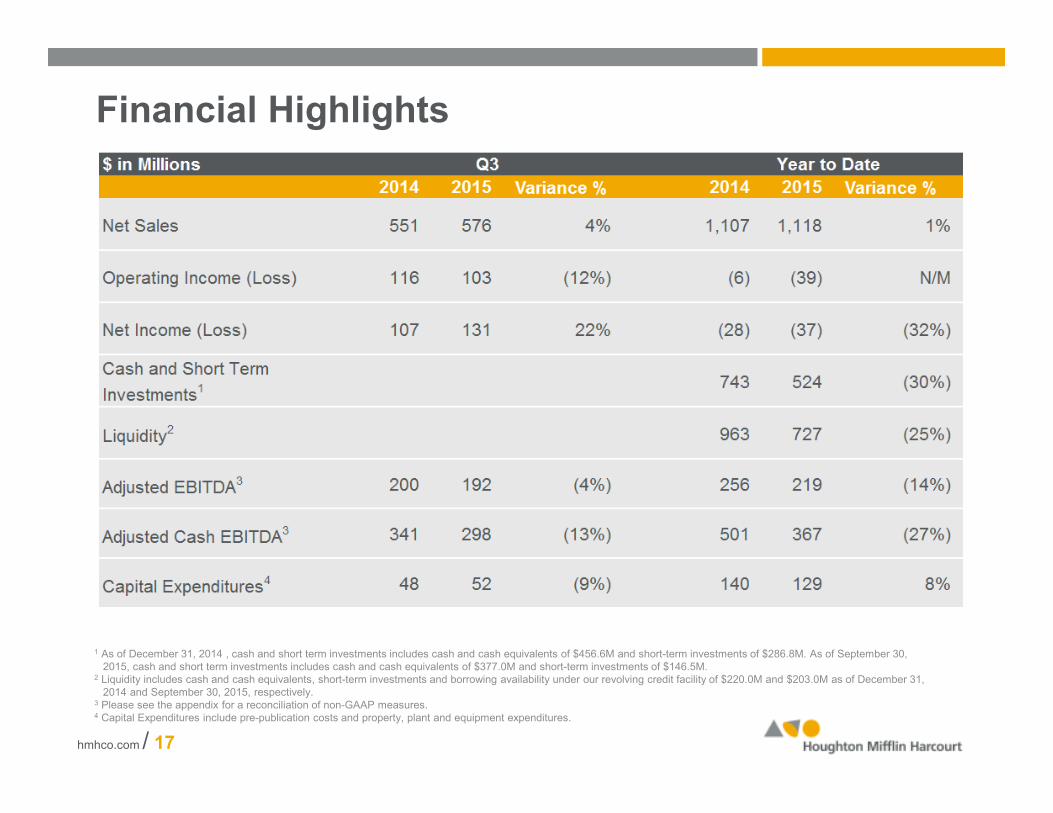
Financial Highlights
1 As of December 31, 2014 , cash and short term investments includes cash and cash equivalents of $456.6M and short-term investments of $286.8M. As of September 30, 2015, cash and short term investments includes cash and cash equivalents of $377.0M and short-term investments of $146.5M.
2 Liquidity includes cash and cash equivalents, short-term investments and borrowing availability under our revolving credit facility of $220.0M and $203.0M as of December 31, 2014 and September 30, 2015, respectively.
3 Please see the appendix for a reconciliation of non-GAAP measures.4 Capital Expenditures include pre-publication costs and property, plant and equipment expenditures.
hmhco.com / 17
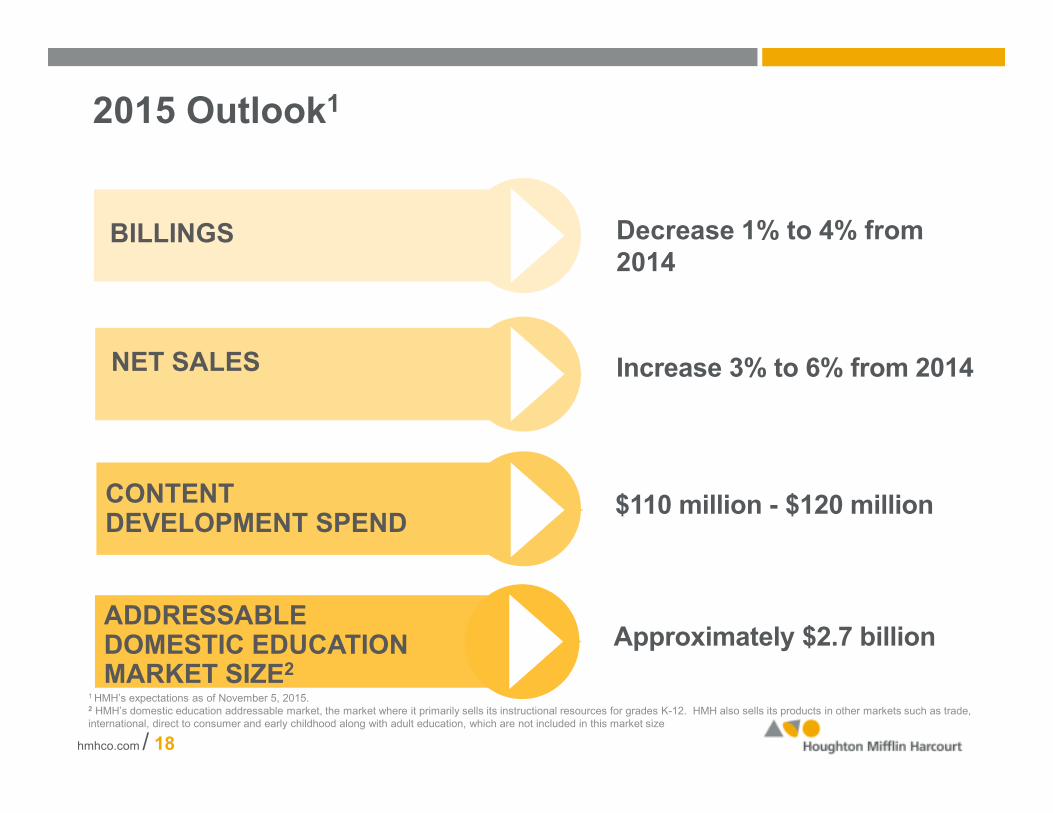
2015 Outlook1
BILLINGS
NET SALES
CONTENT DEVELOPMENT SPEND
Decrease 1% to 4% from 2014
Increase 3% to 6% from 2014
$110 million - $120 million
ADDRESSABLE DOMESTIC EDUCATION MARKET SIZE2
Approximately $2.7 billion
1 HMH’s expectations as of November 5, 2015.2 HMH’s domestic education addressable market, the market where it primarily sells its instructional resources for grades K-12. HMH also sells its products in other markets such as trade, international, direct to consumer and early childhood along with adult education, which are not included in this market size
hmhco.com / 18

Questions and Answers

Appendix
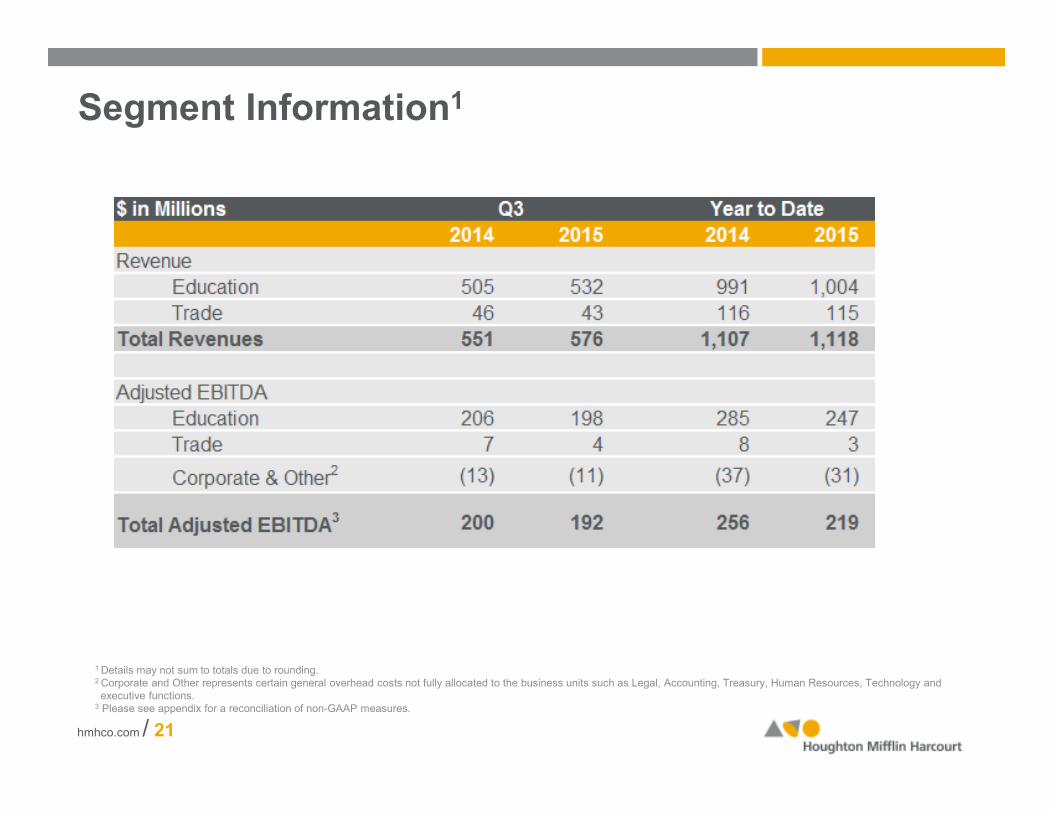
Segment Information1
hmhco.com / 21
1 Details may not sum to totals due to rounding.2 Corporate and Other represents certain general overhead costs not fully allocated to the business units such as Legal, Accounting, Treasury, Human Resources, Technology and executive functions.
3 Please see appendix for a reconciliation of non-GAAP measures.
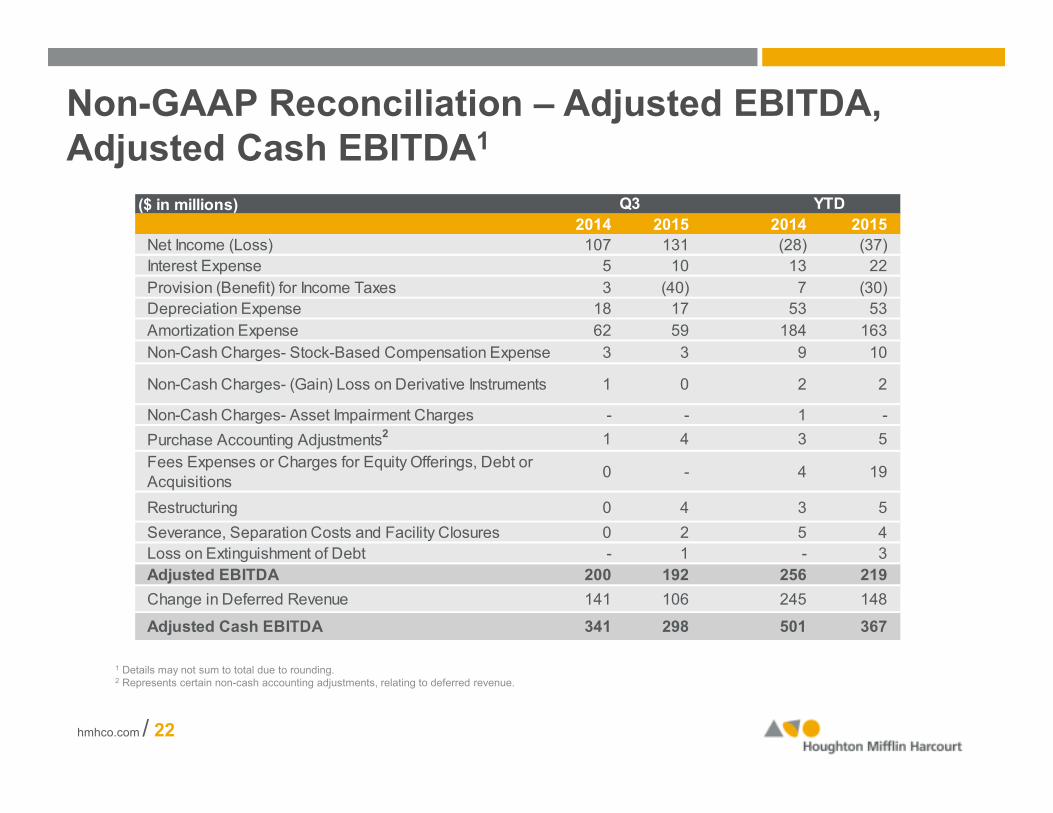
Non-GAAP Reconciliation – Adjusted EBITDA, Adjusted Cash EBITDA1
hmhco.com / 22
1 Details may not sum to total due to rounding.2 Represents certain non-cash accounting adjustments, relating to deferred revenue.
($ in millions)
2014 2015 2014 2015
Net Income (Loss) 107 131 (28) (37)
Interest Expense 5 10 13 22
Provision (Benefit) for Income Taxes 3 (40) 7 (30)
Depreciation Expense 18 17 53 53
Amortization Expense 62 59 184 163
Non-Cash Charges- Stock-Based Compensation Expense 3 3 9 10
Non-Cash Charges- (Gain) Loss on Derivative Instruments 1 0 2 2
Non-Cash Charges- Asset Impairment Charges - - 1 -
Purchase Accounting Adjustments2 1 4 3 5
Fees Expenses or Charges for Equity Offerings, Debt or
Acquisitions 0 - 4 19
Restructuring 0 4 3 5
Severance, Separation Costs and Facility Closures 0 2 5 4
Loss on Extinguishment of Debt - 1 - 3
Adjusted EBITDA 200 192 256 219
Change in Deferred Revenue 141 106 245 148
Adjusted Cash EBITDA 341 298 501 367
Q3 YTD
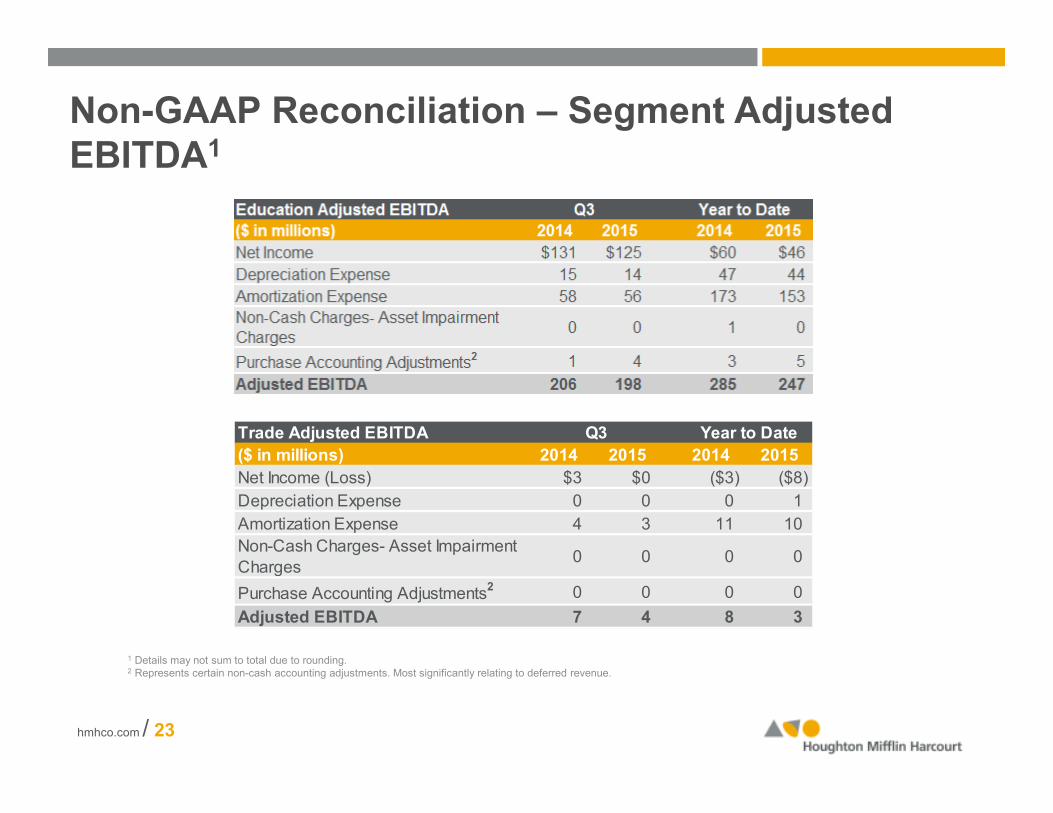
Non-GAAP Reconciliation – Segment Adjusted EBITDA1
1 Details may not sum to total due to rounding.2 Represents certain non-cash accounting adjustments. Most significantly relating to deferred revenue.
hmhco.com / 23
Trade Adjusted EBITDA
($ in millions) 2014 2015 2014 2015
Net Income (Loss) $3 $0 ($3) ($8)
Depreciation Expense 0 0 0 1
Amortization Expense 4 3 11 10
Non-Cash Charges- Asset Impairment
Charges0 0 0 0
Purchase Accounting Adjustments2 0 0 0 0
Adjusted EBITDA 7 4 8 3
Year to DateQ3
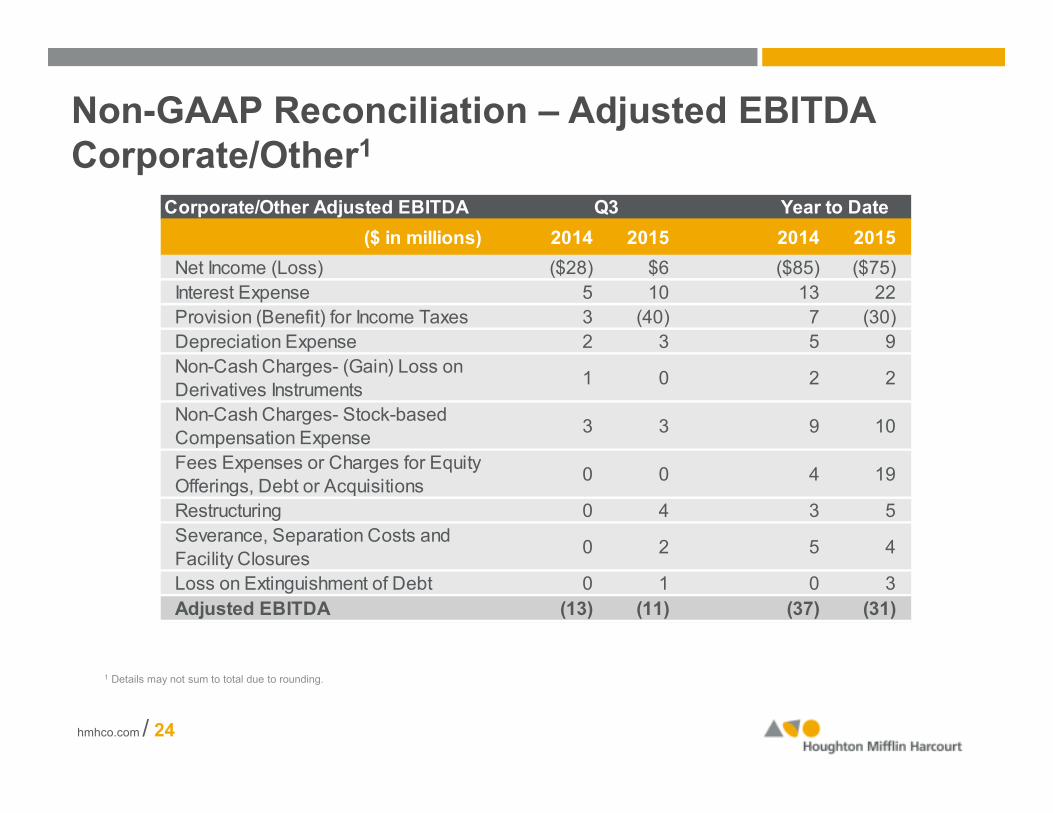
Non-GAAP Reconciliation – Adjusted EBITDA Corporate/Other1
1 Details may not sum to total due to rounding.
hmhco.com / 24
Corporate/Other Adjusted EBITDA
($ in millions) 2014 2015 2014 2015
Net Income (Loss) ($28) $6 ($85) ($75)
Interest Expense 5 10 13 22
Provision (Benefit) for Income Taxes 3 (40) 7 (30)
Depreciation Expense 2 3 5 9
Non-Cash Charges- (Gain) Loss on
Derivatives Instruments1 0 2 2
Non-Cash Charges- Stock-based
Compensation Expense3 3 9 10
Fees Expenses or Charges for Equity
Offerings, Debt or Acquisitions0 0 4 19
Restructuring 0 4 3 5
Severance, Separation Costs and
Facility Closures0 2 5 4
Loss on Extinguishment of Debt 0 1 0 3
Adjusted EBITDA (13) (11) (37) (31)
Q3 Year to Date
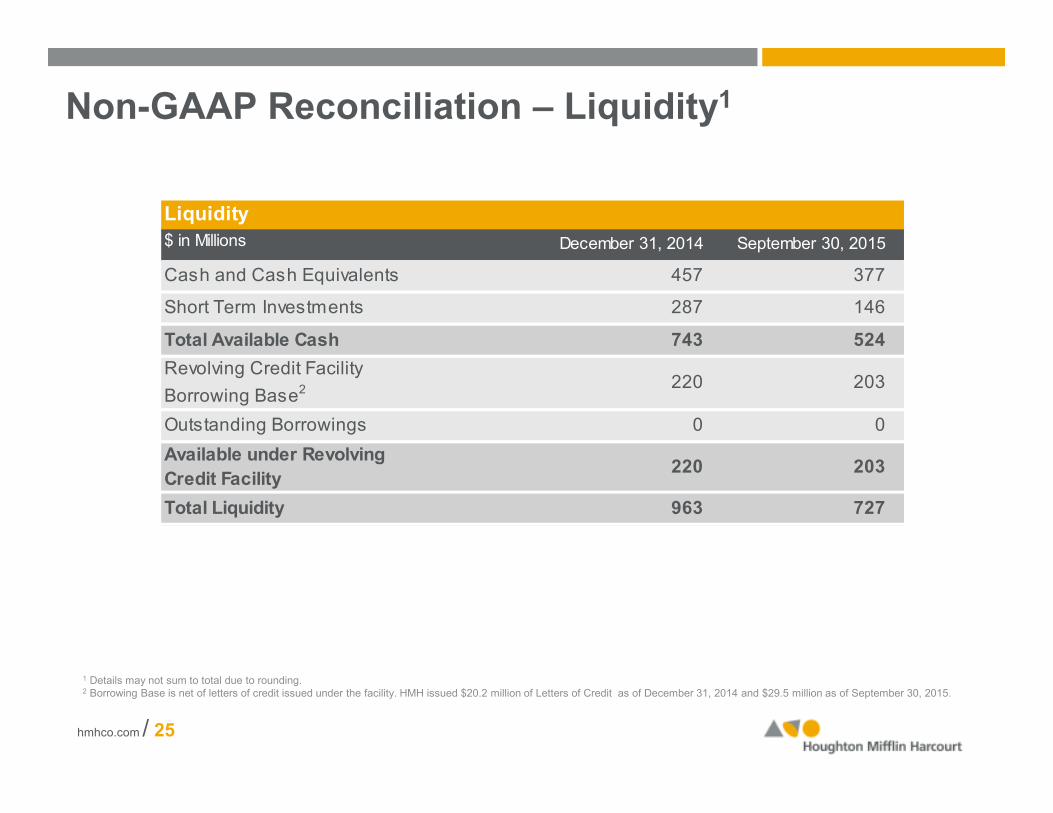
Non-GAAP Reconciliation – Liquidity1
1 Details may not sum to total due to rounding.2 Borrowing Base is net of letters of credit issued under the facility. HMH issued $20.2 million of Letters of Credit as of December 31, 2014 and $29.5 million as of September 30, 2015.
hmhco.com / 25
Liquidity
$ in Millions December 31, 2014 September 30, 2015
Cash and Cash Equivalents 457 377
Short Term Investments 287 146
Total Available Cash 743 524
Revolving Credit Facility
Borrowing Base2220 203
Outstanding Borrowings 0 0
Available under Revolving
Credit Facility220 203
Total Liquidity 963 727
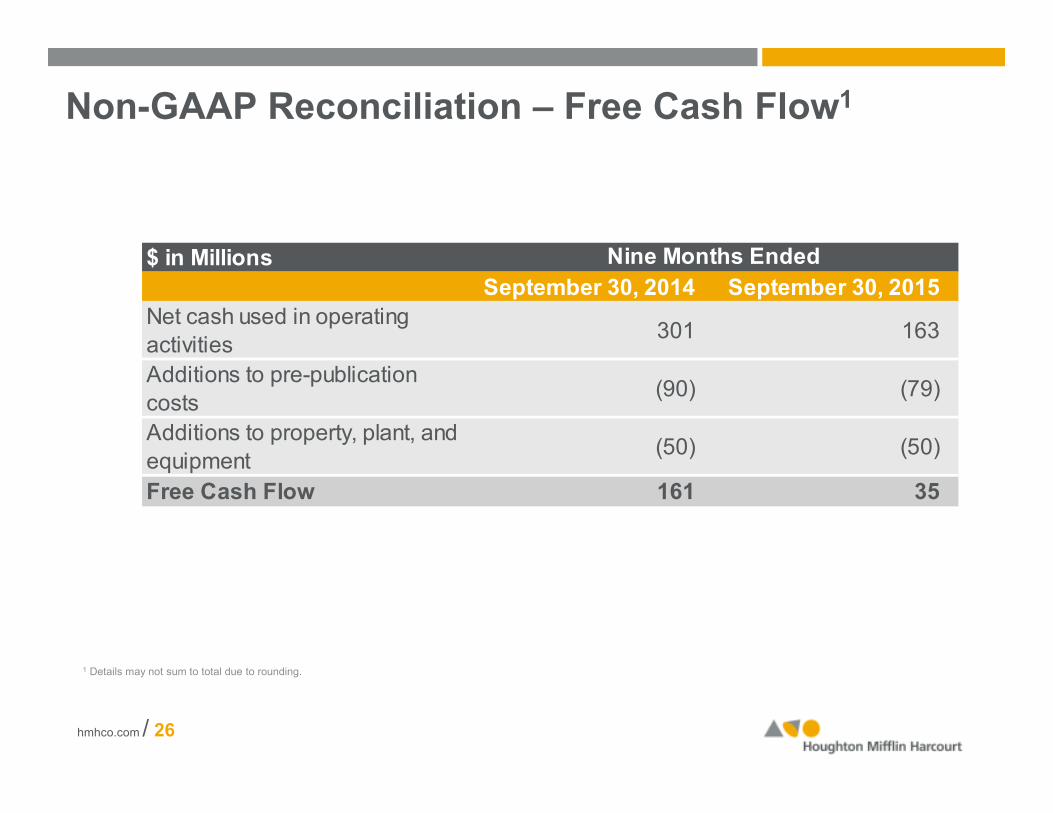
Non-GAAP Reconciliation – Free Cash Flow1
1 Details may not sum to total due to rounding.
hmhco.com / 26
$ in Millions
September 30, 2014 September 30, 2015
Net cash used in operating
activities301 163
Additions to pre-publication
costs(90) (79)
Additions to property, plant, and
equipment(50) (50)
Free Cash Flow 161 35
Nine Months Ended
hmhco.com / 27
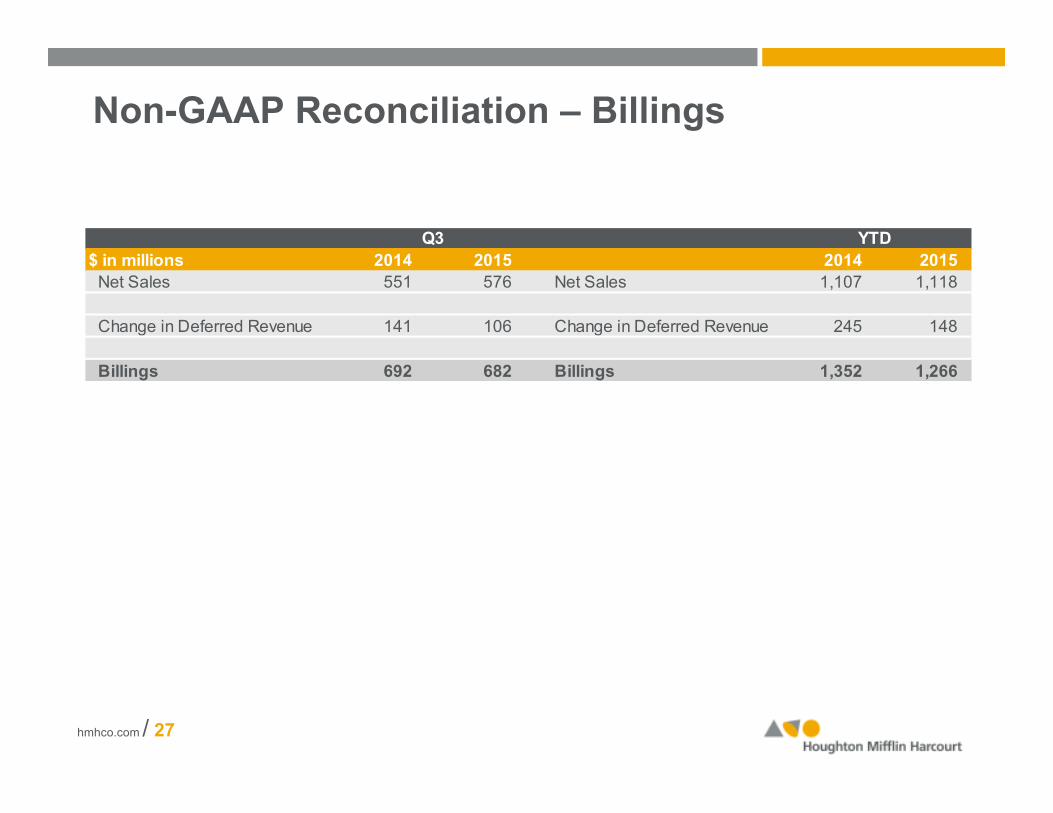
Non-GAAP Reconciliation – Billings
$ in millions 2014 2015 2014 2015
Net Sales 551 576 Net Sales 1,107 1,118
Change in Deferred Revenue 141 106 Change in Deferred Revenue 245 148
Billings 692 682 Billings 1,352 1,266
Q3 YTD
13
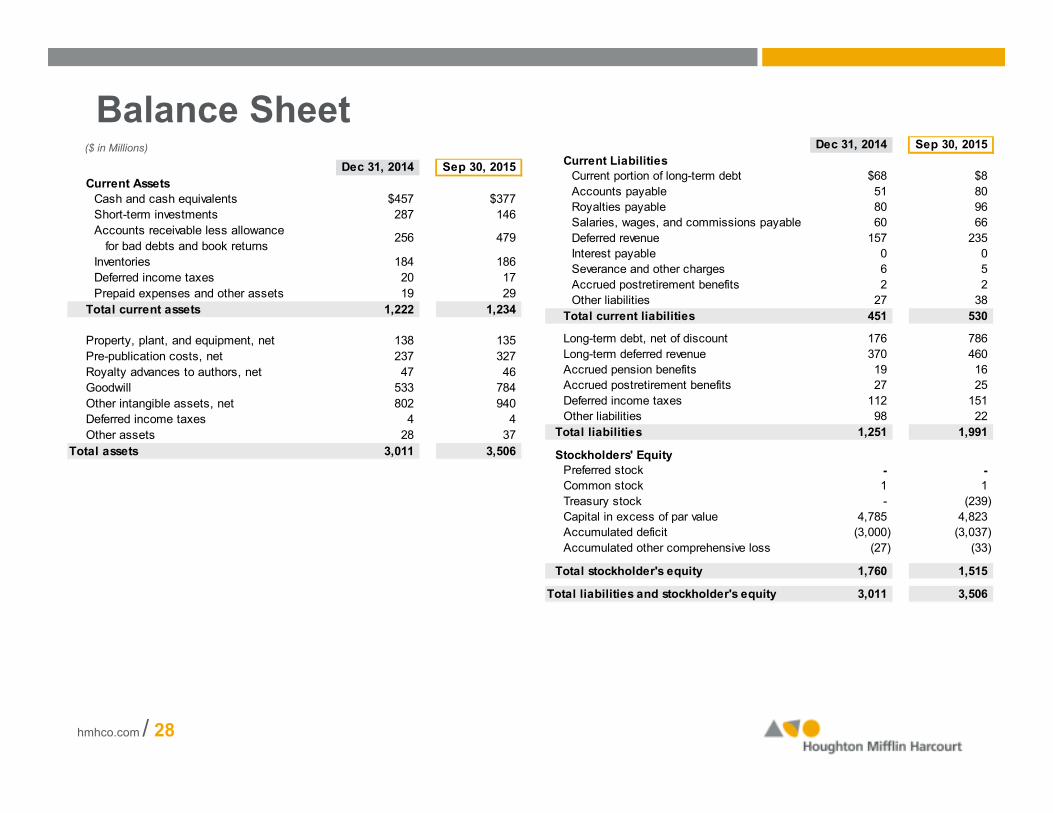
Balance Sheet($ in Millions)
hmhco.com / 28
Dec 31, 2014 Sep 30, 2015
Current Assets
Cash and cash equivalents $457 $377
Short-term investments 287 146
Accounts receivable less allowance
for bad debts and book returns
Inventories 184 186
Deferred income taxes 20 17
Prepaid expenses and other assets 19 29
Total current assets 1,222 1,234
Property, plant, and equipment, net 138 135
Pre-publication costs, net 237 327
Royalty advances to authors, net 47 46
Goodwill 533 784
Other intangible assets, net 802 940
Deferred income taxes 4 4
Other assets 28 37
Total assets 3,011 3,506
479 256
Dec 31, 2014 Sep 30, 2015
Current Liabilities
Current portion of long-term debt $68 $8
Accounts payable 51 80
Royalties payable 80 96
Salaries, wages, and commissions payable 60 66
Deferred revenue 157 235
Interest payable 0 0
Severance and other charges 6 5
Accrued postretirement benefits 2 2
Other liabilities 27 38
Total current liabilities 451 530
Long-term debt, net of discount 176 786
Long-term deferred revenue 370 460
Accrued pension benefits 19 16
Accrued postretirement benefits 27 25
Deferred income taxes 112 151
Other liabilities 98 22
Total liabilities 1,251 1,991
Stockholders' Equity
Preferred stock - -
Common stock 1 1
Treasury stock - (239)
Capital in excess of par value 4,785 4,823
Accumulated deficit (3,000) (3,037)
Accumulated other comprehensive loss (27) (33)
Total stockholder's equity 1,760 1,515
Total liabilities and stockholder's equity 3,011 3,506
13
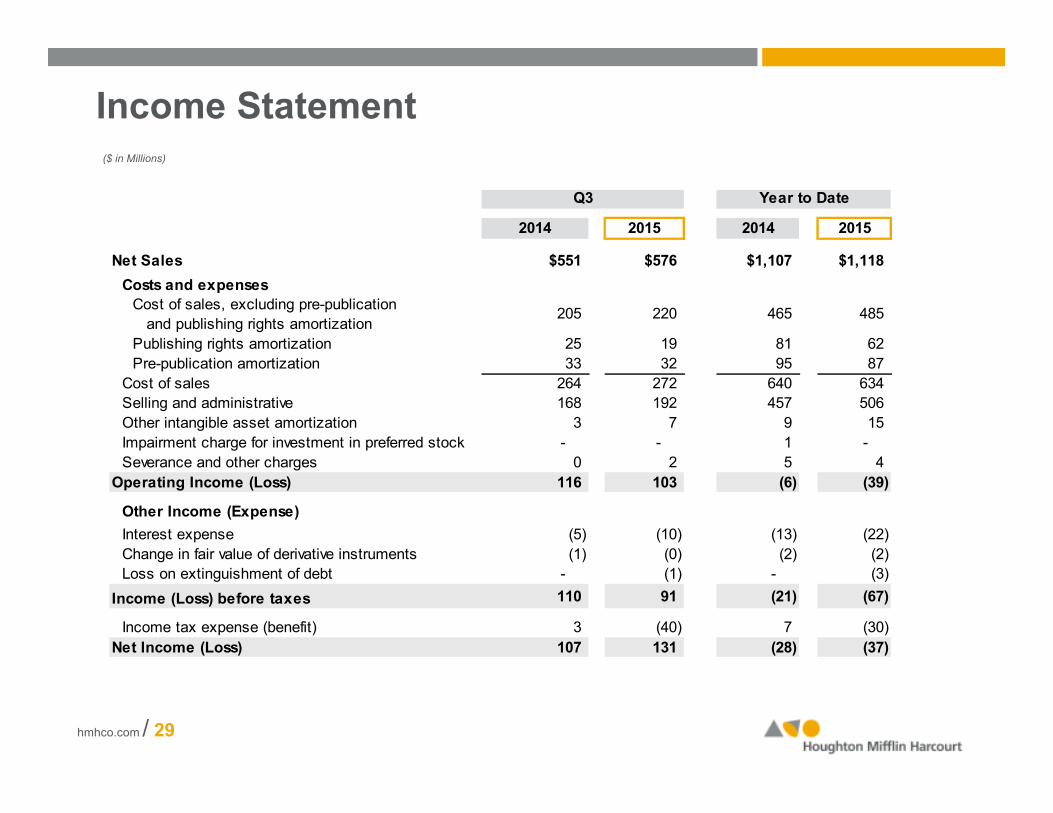
Income Statement($ in Millions)
hmhco.com / 29
2014 2015 2014 2015
Net Sales $551 $576 $1,107 $1,118
Costs and expenses
Cost of sales, excluding pre-publication
and publishing rights amortization205 220 465 485
Publishing rights amortization 25 19 81 62
Pre-publication amortization 33 32 95 87
Cost of sales 264 272 640 634
Selling and administrative 168 192 457 506
Other intangible asset amortization 3 7 9 15
Impairment charge for investment in preferred stock - - 1 -
Severance and other charges 0 2 5 4
Operating Income (Loss) 116 103 (6) (39)
Other Income (Expense)
Interest expense (5) (10) (13) (22)
Change in fair value of derivative instruments (1) (0) (2) (2)
Loss on extinguishment of debt - (1) - (3)
Income (Loss) before taxes 110 91 (21) (67)
Income tax expense (benefit) 3 (40) 7 (30)
Net Income (Loss) 107 131 (28) (37)
Q3 Year to Date
13
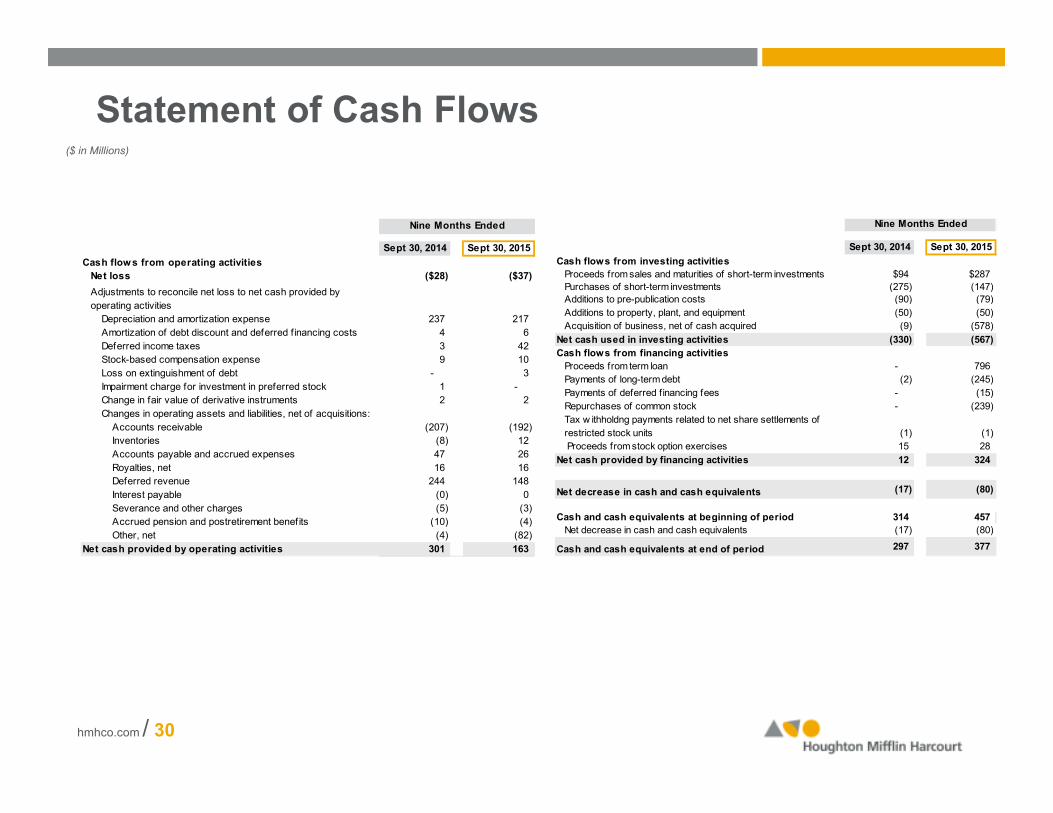
Statement of Cash Flows($ in Millions)
hmhco.com / 30
Sept 30, 2014 Sept 30, 2015
Cash flows from operating activities
Net loss ($28) ($37)
Depreciation and amortization expense 237 217
Amortization of debt discount and deferred financing costs 4 6
Deferred income taxes 3 42
Stock-based compensation expense 9 10
Loss on extinguishment of debt - 3
1 -
Change in fair value of derivative instruments 2 2
Changes in operating assets and liabilities, net of acquisitions:
Accounts receivable (207) (192)
Inventories (8) 12
Accounts payable and accrued expenses 47 26
Royalties, net 16 16
Deferred revenue 244 148
Interest payable (0) 0
Severance and other charges (5) (3)
Accrued pension and postretirement benefits (10) (4)
Other, net (4) (82)
301 163
Nine Months Ended
Net cash provided by operating activities
Adjustments to reconcile net loss to net cash provided by
operating activities
Impairment charge for investment in preferred stock
Sept 30, 2014 Sept 30, 2015
Cash flows from investing activities
$94 $287
Purchases of short-term investments (275) (147)
Additions to pre-publication costs (90) (79)
Additions to property, plant, and equipment (50) (50)
Acquisition of business, net of cash acquired (9) (578)
(330) (567)
Cash flows from financing activities
Proceeds from term loan - 796
Payments of long-term debt (2) (245)
Payments of deferred financing fees - (15)
Repurchases of common stock - (239)
(1) (1)
Proceeds from stock option exercises 15 28
12 324
(17) (80)
Cash and cash equivalents at beginning of period 314 457
Net decrease in cash and cash equivalents (17) (80)
297 377
Nine Months Ended
Cash and cash equivalents at end of period
Proceeds from sales and maturities of short-term investments
Net cash used in investing activities
Net cash provided by financing activities
Net decrease in cash and cash equivalents
Tax w ithholdng payments related to net share settlements of
restricted stock units

![ASMI Investor presentation Q3-2013 … PowerPoint - ASMI_Investor presentation Q3-2013_1November2013.pptx [Read-Only]](https://img.pdfslide.tips/doc/110x75/5bd6338909d3f2623e8d4ac3/asmi-investor-presentation-q3-2013-powerpoint-asmiinvestor-presentation-q3-20131november2013pptx.jpg)


![Investor Presentation - Q3 FY 2015-16 [Company Update]](https://img.pdfslide.tips/doc/110x75/577ca5611a28abea748b80c1/investor-presentation-q3-fy-2015-16-company-update.jpg)