Embed Size (px)
Citation preview
Expanding Production and Reducing Costs
2
Disclaimer
SAFE HARBOR: Some statements contained in this presentation are forward-looking statements or forward-looking information (collectively, “forward-looking statements”) within themeaning of the United States Private Securities Litigation Reform Act of 1995 and applicable Canadian securities laws. Investors are cautioned that forward-looking statements areinherently uncertain and involve risks and uncertainties that could cause actual results to differ materially. Such statements include comments regarding: the expansion of production andreduction of costs at Golden Star’s projects, including the estimated amounts thereof; the exploration upside of the Company’s projects and ability of the Company to increase mine lives;the impact of Wassa Underground and Prestea Underground on the Company’s production profile, cost profile, cash operating cost per ounce and AISC per ounce; the timing forcommercial production at Wassa Underground and Prestea Underground; the achievement of 2016 production; production, cash operating cost and capital expenditure guidance for 2016;production, cash operating cost per ounce and AISC per ounce forecasts for the 5 years from 2017 onwards; the increase in production forecast between 2016 and 2019; dilution whenmining the Wassa Underground F-Shoot; the current rate of decline development at Wassa Underground and the time for accessing the B-Shoot; the timing accessing higher grades at theB-Shoot; the timing for drilling Inferred Mineral Resources at the B-Shoot; the Company’s cash flow in 2017; ore grade, production and capital expenditures at Mampon; the timing forcommencing production at Mampon; the timing for mobilizing the underground mining contractor, pre-development of Mineral Resources, blasting of the first stope and commencingorebody development at Prestea Underground; the benefits of underground mining techniques including the impact on grades, costs and seasonality; the ability to expand MineralReserves and extend the life of mine at Prestea Underground and Wassa Underground through exploration; the timing and amount of debt maturity and repayments and the correlationbetween debt repayments and forecast cash flow; the conversion of mineral resources into mineral reserves; and the potential for growth of Golden Star’s share price. Factors that couldcause actual results to differ materially include timing of and unexpected events at the Bogoso/Prestea and/or the Wassa processing plants; variations in ore grade, tonnes mined, crushedor milled; delay or failure to receive board or government approvals and permits; construction delays; the availability and cost of electrical power; timing and availability of externalfinancing on acceptable terms or at all; technical, permitting, mining or processing issues, including difficulties in establishing the infrastructure for Wassa Underground, inconsistent powersupplies, plant and/or equipment failures and an inability to obtain supplies and materials on reasonable terms (including pricing) or at all; changes in U.S. and Canadian securitiesmarkets; and fluctuations in gold price and input costs and general economic conditions. There can be no assurance that future developments affecting the Company will be thoseanticipated by management. Please refer to the discussion of these and other factors in our Annual Information Form for the year ended December 31, 2015 filed on SEDAR atwww.sedar.com. The forecasts contained in this presentation constitute management's current estimates, as of the date of this presentation, with respect to the matters covered thereby.We expect that these estimates will change as new information is received and that actual results will vary from these estimates, possibly by material amounts. While we may elect toupdate these estimates at any time, we do not undertake to update any estimate at any particular time or in response to any particular event. Investors and others should not assume thatany forecasts in this presentation represent management's estimate as of any date other than the date of this presentation.
NON-GAAP FINANCIAL MEASURES: In this presentation, we use the terms “cash operating cost per ounce”, “all-in sustaining cost per ounce”, “AISC per ounce”, “Adjusted Net Loss”,“Adjusted Net Loss/Share”, “Cash operating margin per ounce” and “Cash Flow from/(used in) operations”. These terms should be considered as Non-GAAP Financial Measures as definedin applicable Canadian and United States securities laws and should not be considered in isolation or as a substitute for measures of performance prepared in accordance with InternationalFinancial Reporting Standards (“IFRS”). “Cash operating cost per ounce” for a period is equal to the cost of sales excluding depreciation and amortization for the period less royalties, thecash component of metals inventory net realizable value adjustments and severance charges divided by the number of ounces of gold sold during the period. “All-in sustaining costs perounce” commences with cash operating costs and then adds sustaining capital expenditures, corporate general and administrative costs, mine site exploratory drilling and greenfieldevaluation costs and environmental rehabilitation costs, divided by the number of ounces of gold sold during the period. This measure seeks to represent the total costs of producing goldfrom operations. These measures are not representative of all cash expenditures as they do not include income tax payments or interest costs. In order to indicate to stakeholders theCompany's earnings excluding the non-cash (gain)/loss on the fair value of debentures, non-cash impairment charges and severance charges, the Company calculates “Adjusted NetEarnings/(Loss)” and “Adjusted Net Earnings)/Loss) per share” to supplement the condensed interim consolidated financial statements. “Cash operating margin per ounce” is calaculated asgold price minus cash operating cost per ounce. “Cash flow from/(used in) operations” is calculated by subtracting the "Changes in working capital" from "Net cash provided by operatingactivities" as found in the statements of cash flows. These measures are not necessarily indicative of operating profit or cash flow from operations as would be determined under IFRS.Changes in numerous factors including, but not limited to, mining rates, milling rates, gold grade, gold recovery, and the costs of labor, consumables and mine site general andadministrative activities can cause these measures to increase or decrease. We believe that these measures are the same or similar to the measures of other gold mining companies, butmay not be comparable to similarly titled measures in every instance. Please see our “Management’s Discussion and Analysis for the three and nine months ended September 30, 2016”and our “Management’s Discussion and Analysis of Financial Condition and Results of Operations for the year ended December 31, 2015” for a reconciliation of these Non-GAAP measuresto the nearest IFRS measure.
INFORMATION: The information contained in this presentation has been obtained by Golden Star from its own records and from other sources deemed reliable, however norepresentation or warranty is made as to its accuracy or completeness. The technical information relating to Golden Star's material properties disclosed herein is based upon technicalreports prepared and filed pursuant to National Instrument 43-101 - Standards of Disclosure for Mineral Projects ("NI 43-101") and other publicly available information regarding theCompany, including the following: (i) “NI 43-101 Technical Report on a Feasibility Study of the Wassa Open Pit Mine and Underground Project in Ghana” effective December 31, 2014; (ii)“NI 43-101 Technical Report on Resources and Reserves, Golden Star Resources Ltd., Bogoso Prestea Gold Mine, Ghana” effective December 31, 2013, and (iii) “NI 43-101 TechnicalReport on a Feasibility Study of the Prestea Underground gold project in Ghana” effective November 5, 2015. Additional information is included in Golden Star's Annual Information Formfor the year ended December 31, 2015 which is filed on SEDAR. Mineral Reserves were prepared under the supervision of Dr. Martin Raffield, Senior Vice President Technical Services forthe Company. Dr. Raffield is a "Qualified Person" as defined by NI 43-101. The Qualified Person reviewing and validating the estimation of the Mineral Resources is S. Mitchel Wasel,Golden Star Resources Vice President of Exploration.
CURRENCY: All monetary amounts refer to United States dollars unless otherwise indicated.
NYSE: GSSTSX: GSC

3
Management Participants
Sam CoetzerPresident and Chief Executive Officer
André van NiekerkExecutive Vice President and Chief Financial Officer
Daniel OwireduExecutive Vice President and Chief Operating Officer
Katharine SuttonDirector, Investor Relations & Corporate Affairs
NYSE: GSSTSX: GSC
4
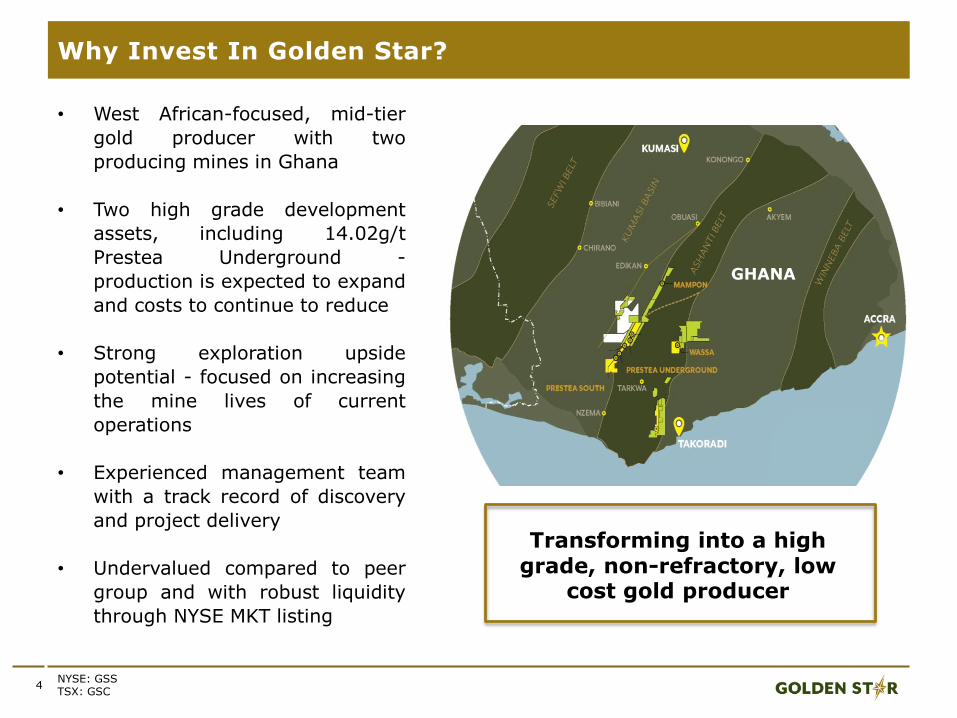
Why Invest In Golden Star?
• West African-focused, mid-tier
gold producer with two
producing mines in Ghana
• Two high grade development
assets, including 14.02g/t
Prestea Underground -
production is expected to expand
and costs to continue to reduce
• Strong exploration upside
potential - focused on increasing
the mine lives of current
operations
• Experienced management team
with a track record of discovery
and project delivery
• Undervalued compared to peer
group and with robust liquidity
through NYSE MKT listing
Transforming into a high grade, non-refractory, low
cost gold producer
GHANA
NYSE: GSSTSX: GSC
5
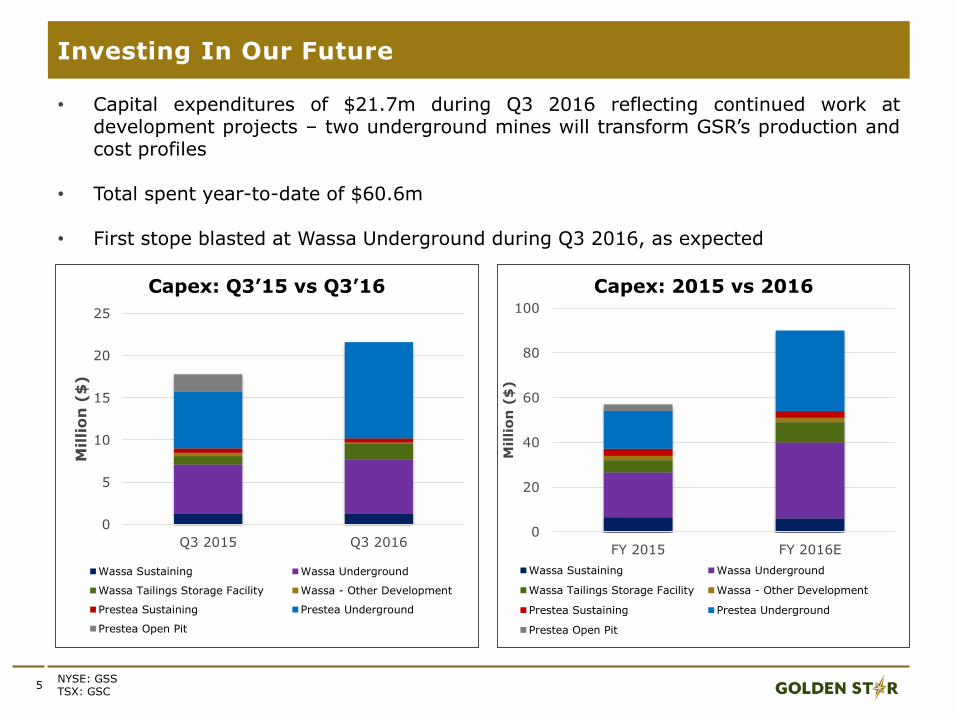
Investing In Our Future
• Capital expenditures of $21.7m during Q3 2016 reflecting continued work atdevelopment projects – two underground mines will transform GSR’s production andcost profiles
• Total spent year-to-date of $60.6m
• First stope blasted at Wassa Underground during Q3 2016, as expected
NYSE: GSSTSX: GSC
0
5
10
15
20
25
Q3 2015 Q3 2016
Millio
n (
$)
Capex: Q3’15 vs Q3’16
Wassa Sustaining Wassa Underground
Wassa Tailings Storage Facility Wassa - Other Development
Prestea Sustaining Prestea Underground
Prestea Open Pit
0
20
40
60
80
100
FY 2015 FY 2016E
Millio
n (
$)
Capex: 2015 vs 2016
Wassa Sustaining Wassa Underground
Wassa Tailings Storage Facility Wassa - Other Development
Prestea Sustaining Prestea Underground
Prestea Open Pit
6
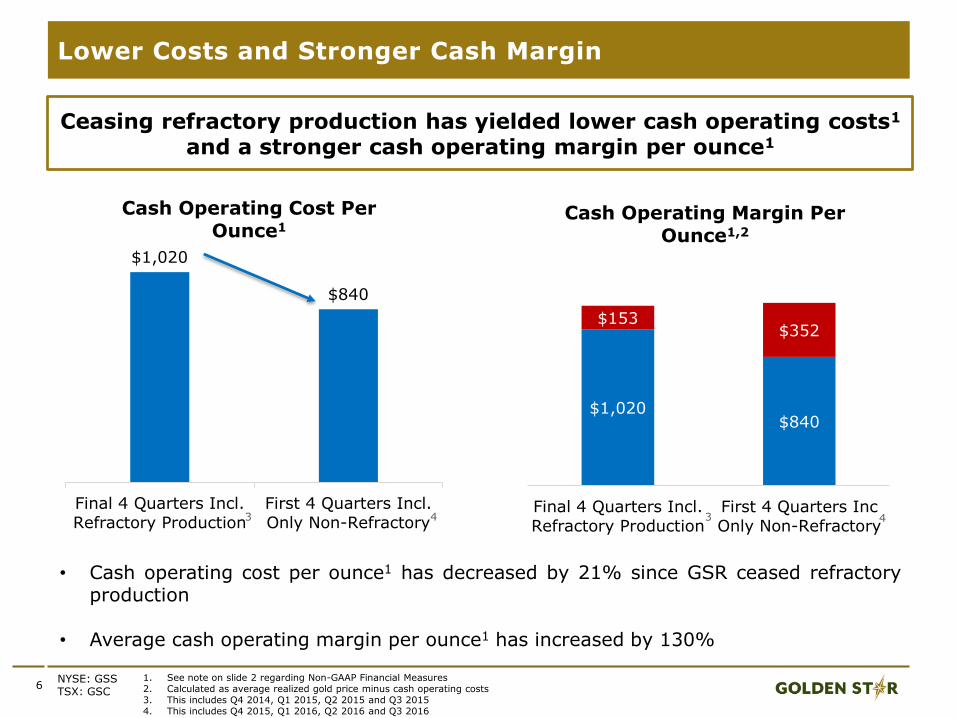
Lower Costs and Stronger Cash Margin
Ceasing refractory production has yielded lower cash operating costs1
and a stronger cash operating margin per ounce1
NYSE: GSSTSX: GSC
1. See note on slide 2 regarding Non-GAAP Financial Measures2. Calculated as average realized gold price minus cash operating costs3. This includes Q4 2014, Q1 2015, Q2 2015 and Q3 20154. This includes Q4 2015, Q1 2016, Q2 2016 and Q3 2016
$1,020
$840
Final 4 Quarters Incl.Refractory Production
First 4 Quarters Incl.Only Non-Refractory
Cash Operating Cost Per Ounce1
$1,020 $840
$153 $352
Final 4 Quarters Incl.Refractory Production
First 4 Quarters IncOnly Non-Refractory
Cash Operating Margin Per Ounce1,2
3 4 3
• Cash operating cost per ounce1 has decreased by 21% since GSR ceased refractoryproduction
• Average cash operating margin per ounce1 has increased by 130%
4
7
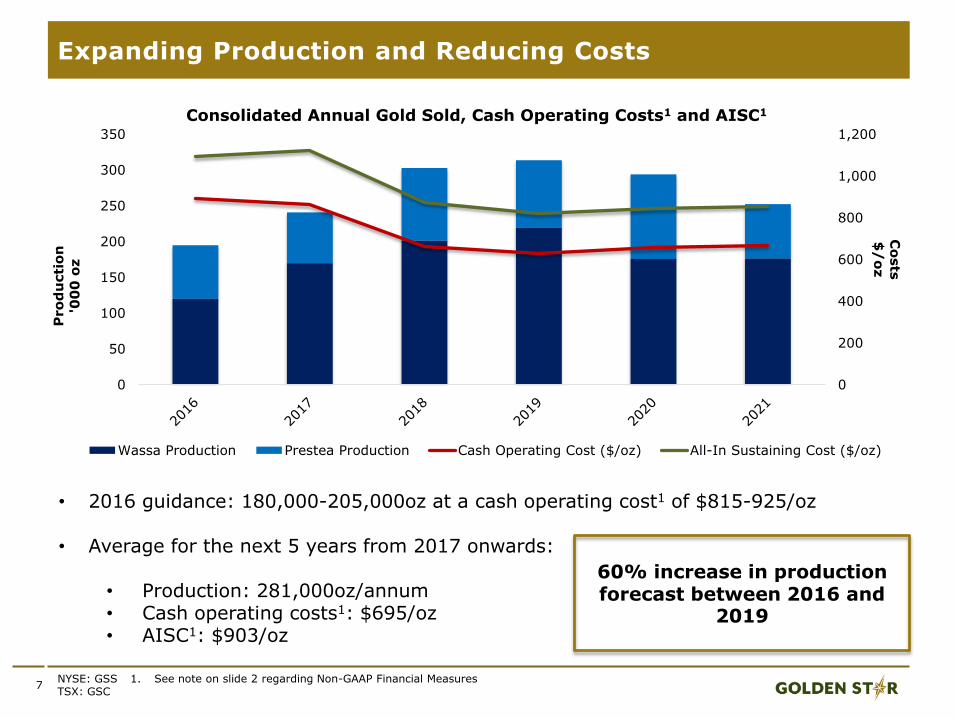
Expanding Production and Reducing Costs
• 2016 guidance: 180,000-205,000oz at a cash operating cost1 of $815-925/oz
• Average for the next 5 years from 2017 onwards:
• Production: 281,000oz/annum• Cash operating costs1: $695/oz• AISC1: $903/oz
NYSE: GSSTSX: GSC
60% increase in production forecast between 2016 and
2019
1. See note on slide 2 regarding Non-GAAP Financial Measures
0
200
400
600
800
1,000
1,200
0
50
100
150
200
250
300
350
Co
sts
$/
oz
Pro
du
cti
on
'00
0 o
z
Consolidated Annual Gold Sold, Cash Operating Costs1 and AISC1
Wassa Production Prestea Production Cash Operating Cost ($/oz) All-In Sustaining Cost ($/oz)

8
Q3 2016 OPERATIONAL REVIEW
Wassa Gold Mine
Prestea Gold Mine
9
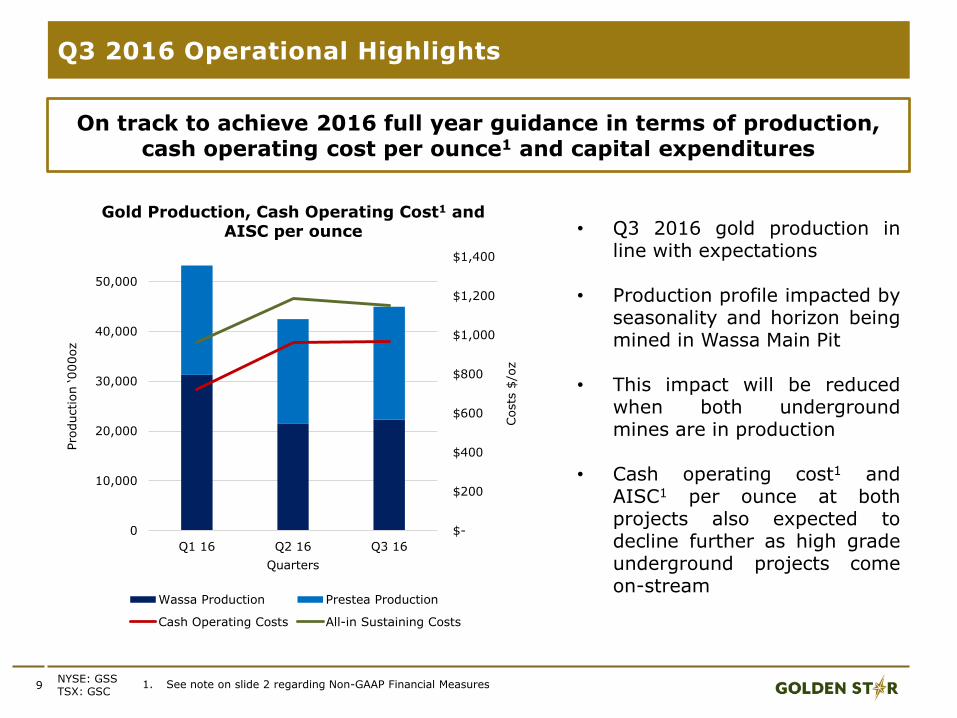
Q3 2016 Operational Highlights
1. See note on slide 2 regarding Non-GAAP Financial Measures
On track to achieve 2016 full year guidance in terms of production, cash operating cost per ounce1 and capital expenditures
• Q3 2016 gold production inline with expectations
• Production profile impacted byseasonality and horizon beingmined in Wassa Main Pit
• This impact will be reducedwhen both undergroundmines are in production
• Cash operating cost1 andAISC1 per ounce at bothprojects also expected todecline further as high gradeunderground projects comeon-stream
NYSE: GSSTSX: GSC
$-
$200
$400
$600
$800
$1,000
$1,200
$1,400
0
10,000
20,000
30,000
40,000
50,000
Q1 16 Q2 16 Q3 16
Costs
$/o
z
Pro
duction ‘000oz
Quarters
Gold Production, Cash Operating Cost1 and AISC per ounce
Wassa Production Prestea Production
Cash Operating Costs All-in Sustaining Costs
10
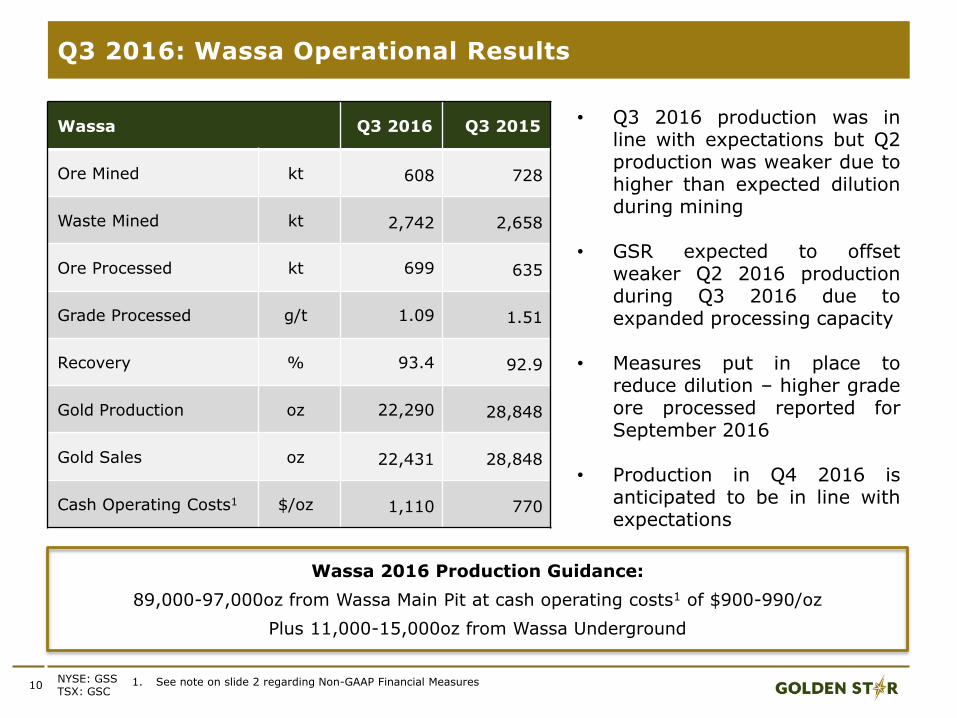
Q3 2016: Wassa Operational Results
Wassa Q3 2016 Q3 2015
Ore Mined kt 608 728
Waste Mined kt 2,742 2,658
Ore Processed kt 699 635
Grade Processed g/t 1.09 1.51
Recovery % 93.4 92.9
Gold Production oz 22,290 28,848
Gold Sales oz 22,431 28,848
Cash Operating Costs1 $/oz 1,110 770
NYSE: GSSTSX: GSC
• Q3 2016 production was inline with expectations but Q2production was weaker due tohigher than expected dilutionduring mining
• GSR expected to offsetweaker Q2 2016 productionduring Q3 2016 due toexpanded processing capacity
• Measures put in place toreduce dilution – higher gradeore processed reported forSeptember 2016
• Production in Q4 2016 isanticipated to be in line withexpectations
1. See note on slide 2 regarding Non-GAAP Financial Measures
Wassa 2016 Production Guidance:
89,000-97,000oz from Wassa Main Pit at cash operating costs1 of $900-990/oz
Plus 11,000-15,000oz from Wassa Underground
11
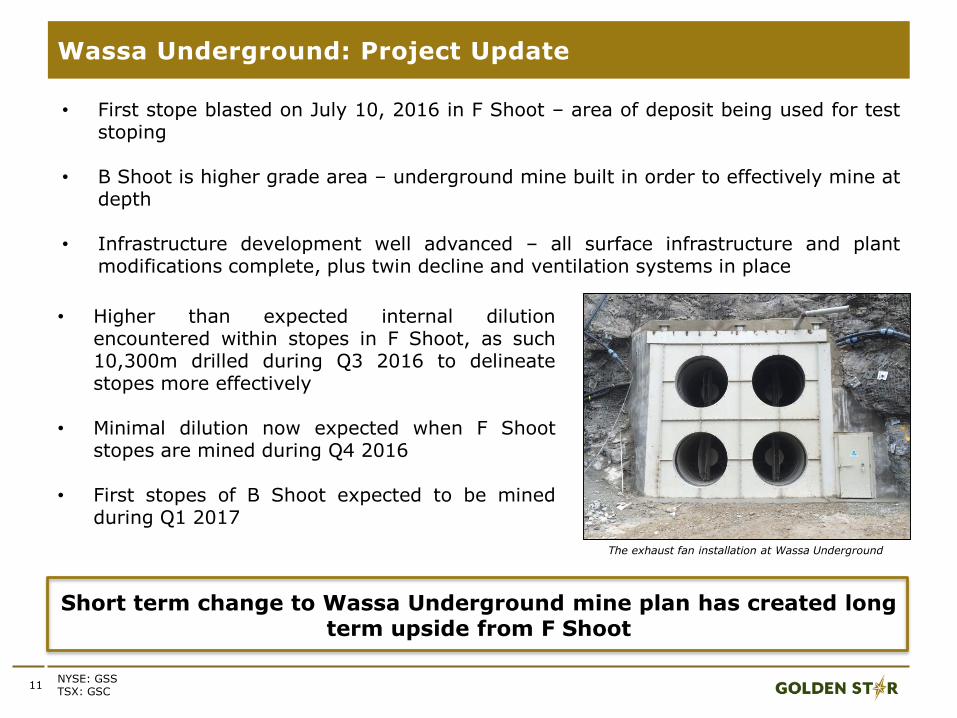
Wassa Underground: Project Update
NYSE: GSSTSX: GSC
Short term change to Wassa Underground mine plan has created long term upside from F Shoot
• Higher than expected internal dilutionencountered within stopes in F Shoot, as such10,300m drilled during Q3 2016 to delineatestopes more effectively
• Minimal dilution now expected when F Shootstopes are mined during Q4 2016
• First stopes of B Shoot expected to be minedduring Q1 2017
• First stope blasted on July 10, 2016 in F Shoot – area of deposit being used for teststoping
• B Shoot is higher grade area – underground mine built in order to effectively mine atdepth
• Infrastructure development well advanced – all surface infrastructure and plantmodifications complete, plus twin decline and ventilation systems in place
The exhaust fan installation at Wassa Underground
12
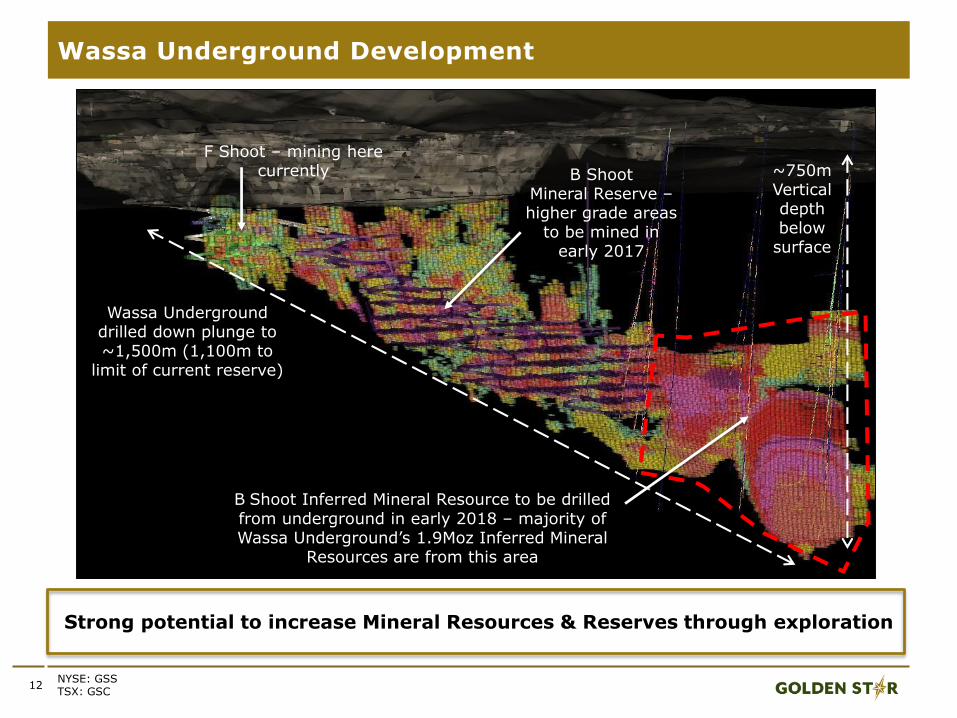
Wassa Underground Development
F Shoot
B Shoot
Strong potential to increase Mineral Resources & Reserves through exploration
NYSE: GSSTSX: GSC
F Shoot – mining here currently B Shoot
Mineral Reserve –higher grade areas
to be mined in early 2017
~750m Vertical depth below
surface
Wassa Underground drilled down plunge to ~1,500m (1,100m to
limit of current reserve)
B Shoot Inferred Mineral Resource to be drilled from underground in early 2018 – majority of Wassa Underground’s 1.9Moz Inferred Mineral
Resources are from this area
13
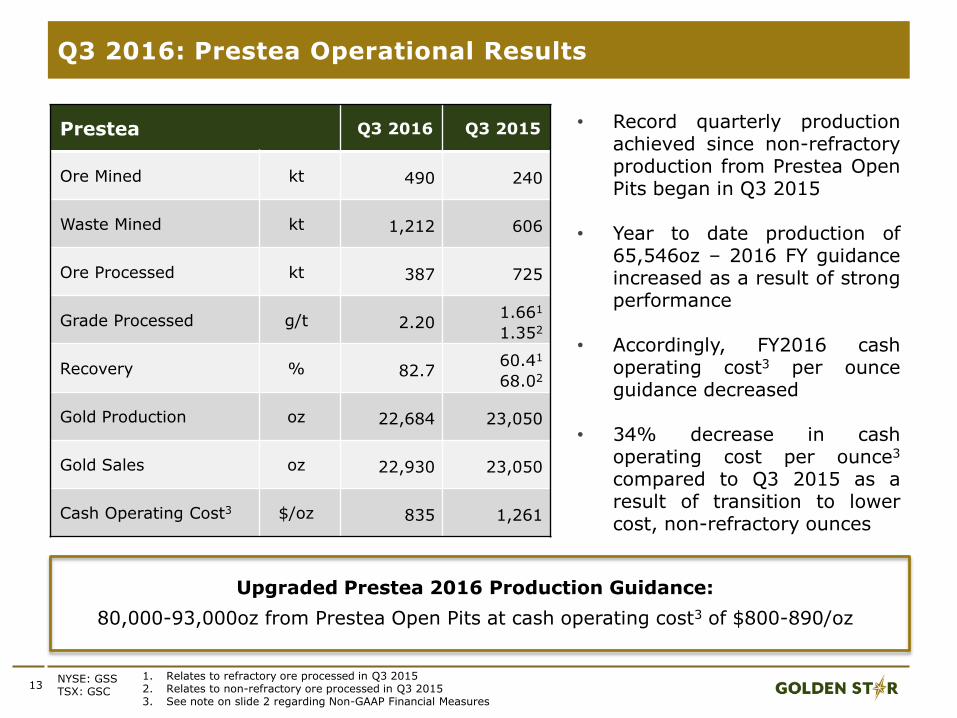
Q3 2016: Prestea Operational Results
Prestea Q3 2016 Q3 2015
Ore Mined kt 490 240
Waste Mined kt 1,212 606
Ore Processed kt 387 725
Grade Processed g/t 2.201.661
1.352
Recovery % 82.760.41
68.02
Gold Production oz 22,684 23,050
Gold Sales oz 22,930 23,050
Cash Operating Cost3 $/oz 835 1,261
NYSE: GSSTSX: GSC
• Record quarterly productionachieved since non-refractoryproduction from Prestea OpenPits began in Q3 2015
• Year to date production of65,546oz – 2016 FY guidanceincreased as a result of strongperformance
• Accordingly, FY2016 cashoperating cost3 per ounceguidance decreased
• 34% decrease in cashoperating cost per ounce3
compared to Q3 2015 as aresult of transition to lowercost, non-refractory ounces
1. Relates to refractory ore processed in Q3 20152. Relates to non-refractory ore processed in Q3 20153. See note on slide 2 regarding Non-GAAP Financial Measures
Upgraded Prestea 2016 Production Guidance:
80,000-93,000oz from Prestea Open Pits at cash operating cost3 of $800-890/oz
14
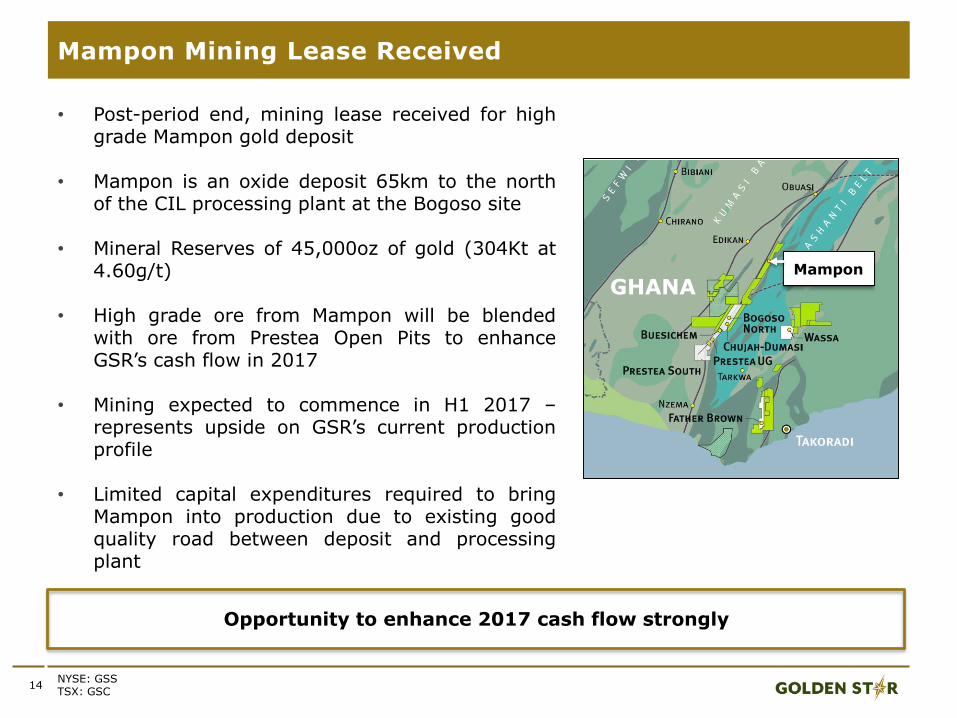
Mampon Mining Lease Received
NYSE: GSSTSX: GSC
• Post-period end, mining lease received for highgrade Mampon gold deposit
• Mampon is an oxide deposit 65km to the northof the CIL processing plant at the Bogoso site
• Mineral Reserves of 45,000oz of gold (304Kt at4.60g/t)
• High grade ore from Mampon will be blendedwith ore from Prestea Open Pits to enhanceGSR’s cash flow in 2017
• Mining expected to commence in H1 2017 –represents upside on GSR’s current productionprofile
• Limited capital expenditures required to bringMampon into production due to existing goodquality road between deposit and processingplant
Opportunity to enhance 2017 cash flow strongly
GHANAMampon
15
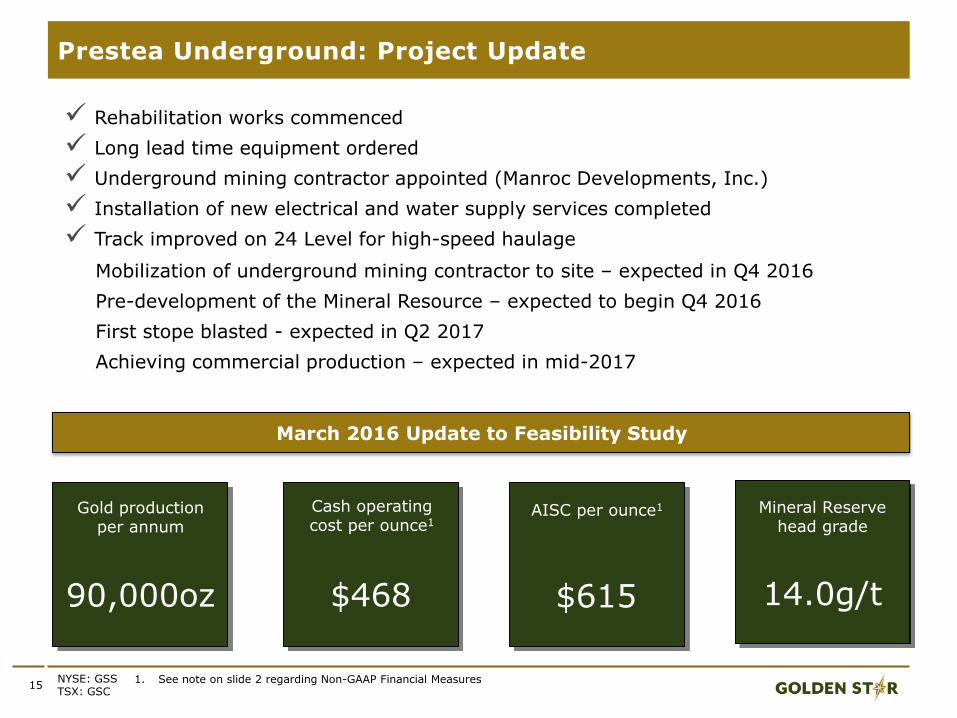
Prestea Underground: Project Update
1. See note on slide 2 regarding Non-GAAP Financial MeasuresNYSE: GSSTSX: GSC
Rehabilitation works commenced
Long lead time equipment ordered
Underground mining contractor appointed (Manroc Developments, Inc.)
Installation of new electrical and water supply services completed
Track improved on 24 Level for high-speed haulage
Mobilization of underground mining contractor to site – expected in Q4 2016
Pre-development of the Mineral Resource – expected to begin Q4 2016
First stope blasted - expected in Q2 2017
Achieving commercial production – expected in mid-2017
March 2016 Update to Feasibility Study
Gold production per annum
90,000oz
Cash operating cost per ounce1
$468
Mineral Reserve head grade
14.0g/t
AISC per ounce1
$615
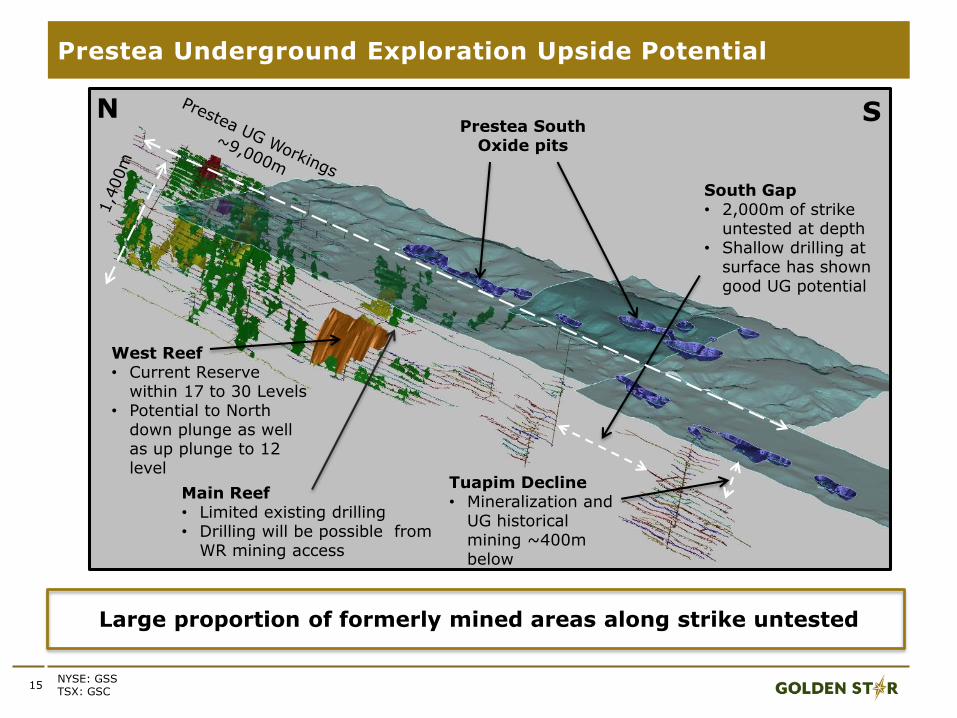
West Reef• Current Reserve
within 17 to 30 Levels • Potential to North
down plunge as well as up plunge to 12 level
Prestea South Oxide pits
Main Reef• Limited existing drilling • Drilling will be possible from
WR mining access
South Gap • 2,000m of strike
untested at depth• Shallow drilling at
surface has shown good UG potential
Tuapim Decline • Mineralization and
UG historical mining ~400m below
N S
Prestea Underground Exploration Upside Potential
Large proportion of formerly mined areas along strike untested
NYSE: GSSTSX: GSC
15
17
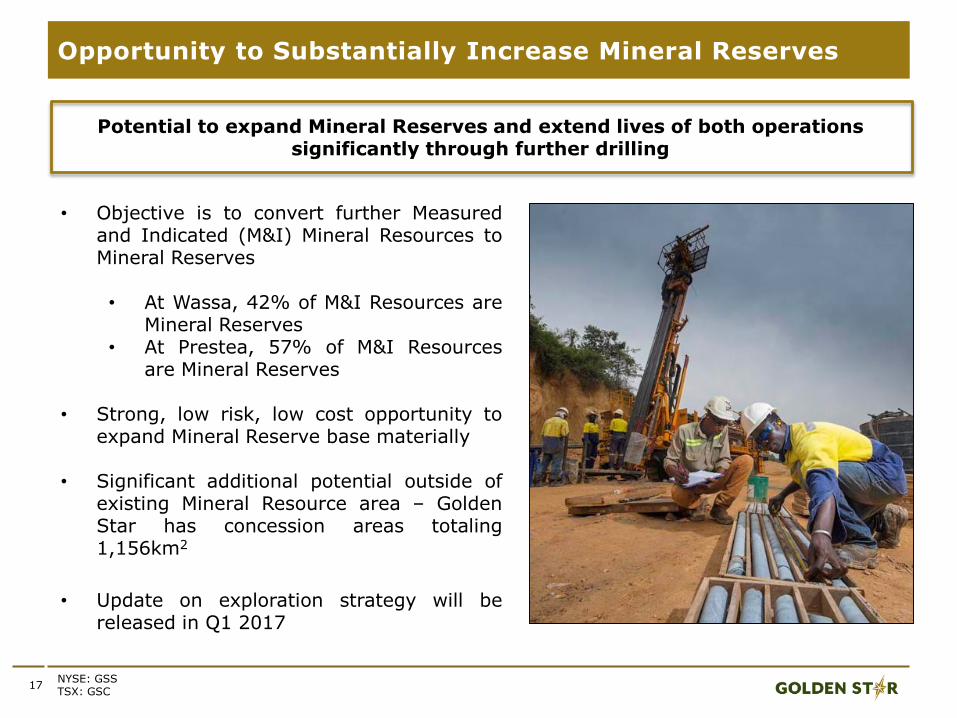
Opportunity to Substantially Increase Mineral Reserves
NYSE: GSSTSX: GSC
• Objective is to convert further Measuredand Indicated (M&I) Mineral Resources toMineral Reserves
• At Wassa, 42% of M&I Resources areMineral Reserves
• At Prestea, 57% of M&I Resourcesare Mineral Reserves
• Strong, low risk, low cost opportunity toexpand Mineral Reserve base materially
• Significant additional potential outside ofexisting Mineral Resource area – GoldenStar has concession areas totaling1,156km2
• Update on exploration strategy will bereleased in Q1 2017
Potential to expand Mineral Reserves and extend lives of both operations significantly through further drilling
18
Q3 2016FINANCIAL REVIEW
19
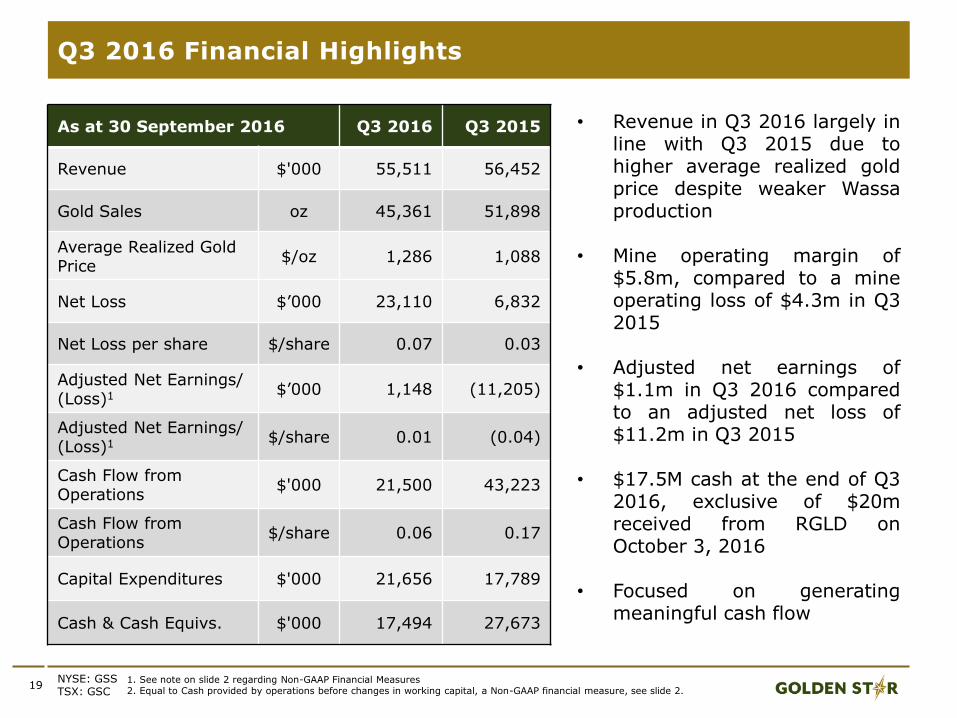
Q3 2016 Financial Highlights
As at 30 September 2016 Q3 2016 Q3 2015
Revenue $'000 55,511 56,452
Gold Sales oz 45,361 51,898
Average Realized Gold Price
$/oz 1,286 1,088
Net Loss $’000 23,110 6,832
Net Loss per share $/share 0.07 0.03
Adjusted Net Earnings/ (Loss)1 $’000 1,148 (11,205)
Adjusted Net Earnings/ (Loss)1 $/share 0.01 (0.04)
Cash Flow from Operations
$'000 21,500 43,223
Cash Flow from Operations
$/share 0.06 0.17
Capital Expenditures $'000 21,656 17,789
Cash & Cash Equivs. $'000 17,494 27,673
NYSE: GSSTSX: GSC
• Revenue in Q3 2016 largely inline with Q3 2015 due tohigher average realized goldprice despite weaker Wassaproduction
• Mine operating margin of$5.8m, compared to a mineoperating loss of $4.3m in Q32015
• Adjusted net earnings of$1.1m in Q3 2016 comparedto an adjusted net loss of$11.2m in Q3 2015
• $17.5M cash at the end of Q32016, exclusive of $20mreceived from RGLD onOctober 3, 2016
• Focused on generatingmeaningful cash flow
1. See note on slide 2 regarding Non-GAAP Financial Measures2. Equal to Cash provided by operations before changes in working capital, a Non-GAAP financial measure, see slide 2.
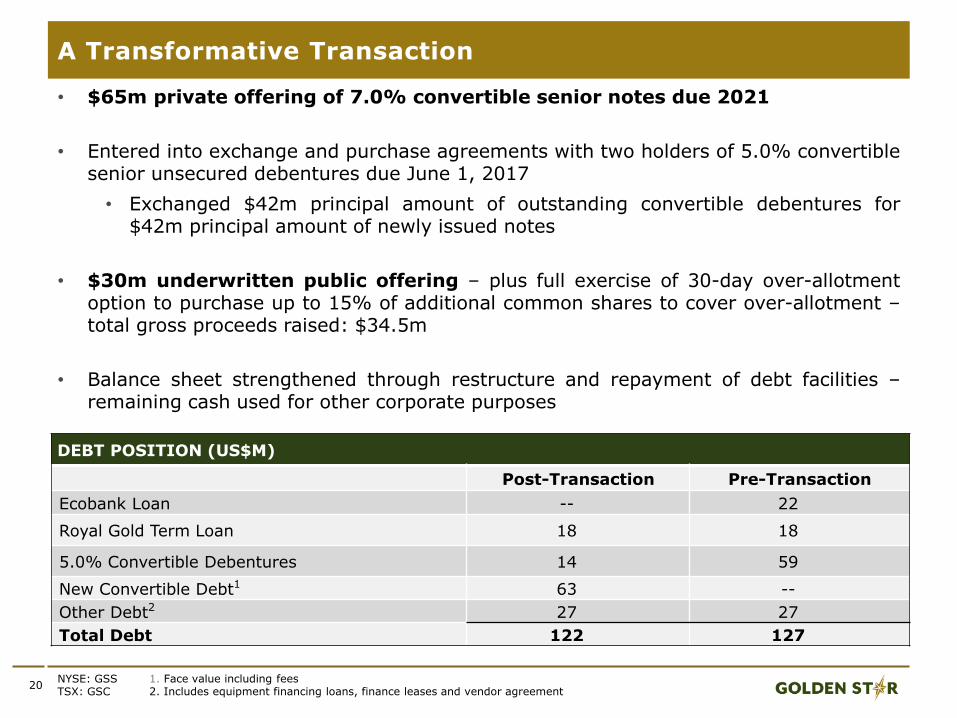
• $65m private offering of 7.0% convertible senior notes due 2021
• Entered into exchange and purchase agreements with two holders of 5.0% convertiblesenior unsecured debentures due June 1, 2017
• Exchanged $42m principal amount of outstanding convertible debentures for$42m principal amount of newly issued notes
• $30m underwritten public offering – plus full exercise of 30-day over-allotmentoption to purchase up to 15% of additional common shares to cover over-allotment –total gross proceeds raised: $34.5m
• Balance sheet strengthened through restructure and repayment of debt facilities –remaining cash used for other corporate purposes
20
A Transformative Transaction
NYSE: GSSTSX: GSC
DEBT POSITION (US$M)
Post-Transaction Pre-Transaction
Ecobank Loan -- 22
Royal Gold Term Loan 18 18
5.0% Convertible Debentures 14 59
New Convertible Debt1 63 --
Other Debt2 27 27
Total Debt 122 127
1. Face value including fees2. Includes equipment financing loans, finance leases and vendor agreement
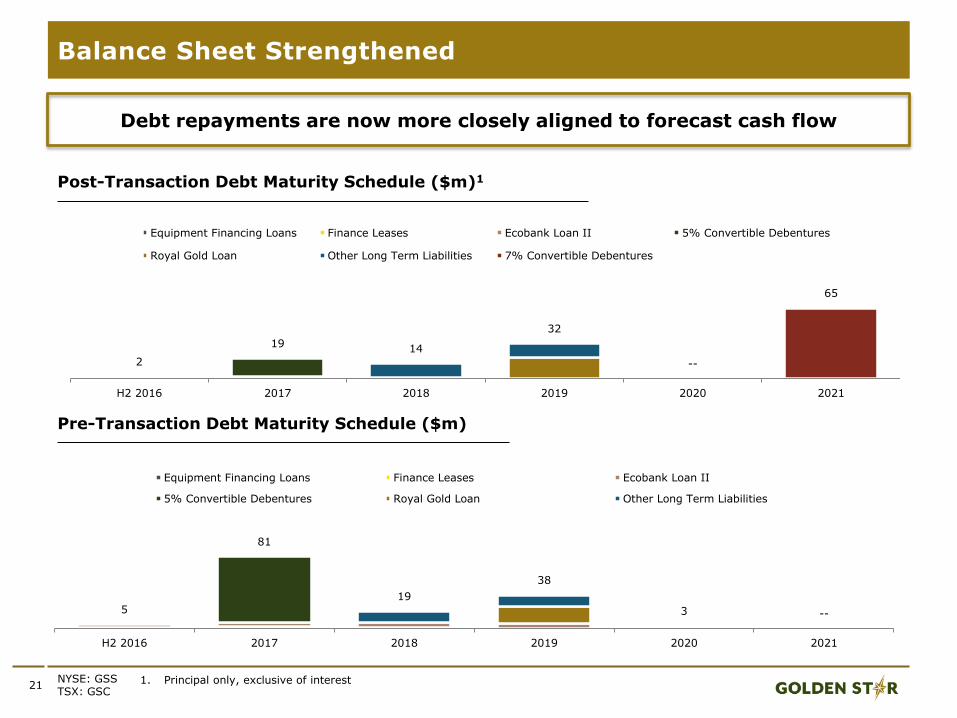
Post-Transaction Debt Maturity Schedule ($m)1
21
Balance Sheet Strengthened
NYSE: GSSTSX: GSC
Pre-Transaction Debt Maturity Schedule ($m)
1. Principal only, exclusive of interest
Debt repayments are now more closely aligned to forecast cash flow
5
81
19
38
3 --
H2 2016 2017 2018 2019 2020 2021
Equipment Financing Loans Finance Leases Ecobank Loan II
5% Convertible Debentures Royal Gold Loan Other Long Term Liabilities
2
19 14
32
--
65
H2 2016 2017 2018 2019 2020 2021
Equipment Financing Loans Finance Leases Ecobank Loan II 5% Convertible Debentures
Royal Gold Loan Other Long Term Liabilities 7% Convertible Debentures
22
LOOKING AHEAD
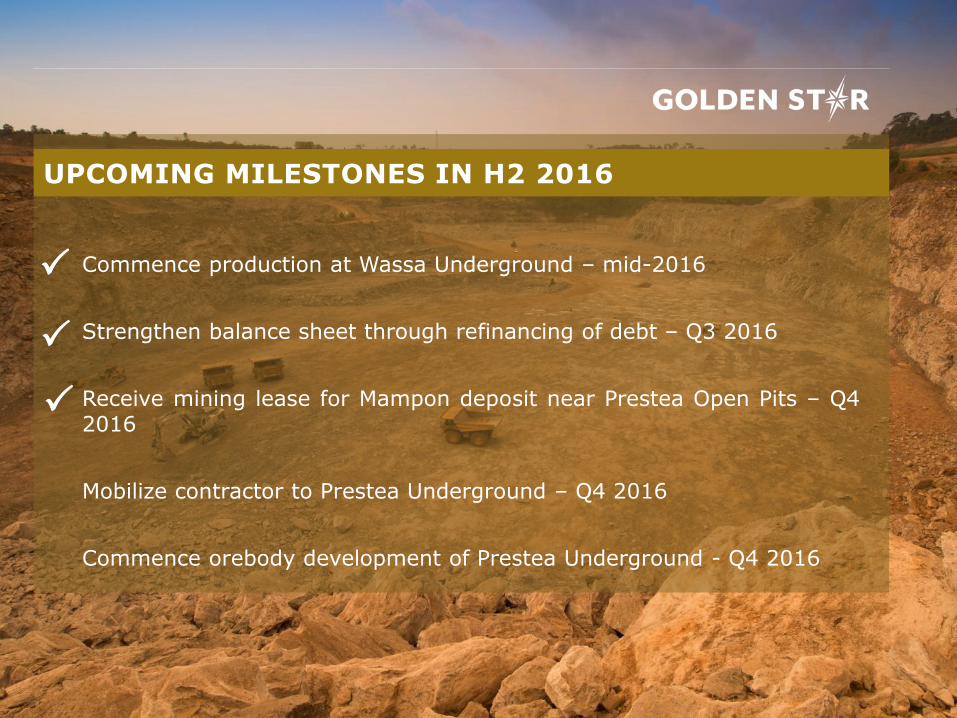
Commence production at Wassa Underground – mid-2016
Strengthen balance sheet through refinancing of debt – Q3 2016
Receive mining lease for Mampon deposit near Prestea Open Pits – Q42016
Mobilize contractor to Prestea Underground – Q4 2016
Commence orebody development of Prestea Underground - Q4 2016
UPCOMING MILESTONES IN H2 2016
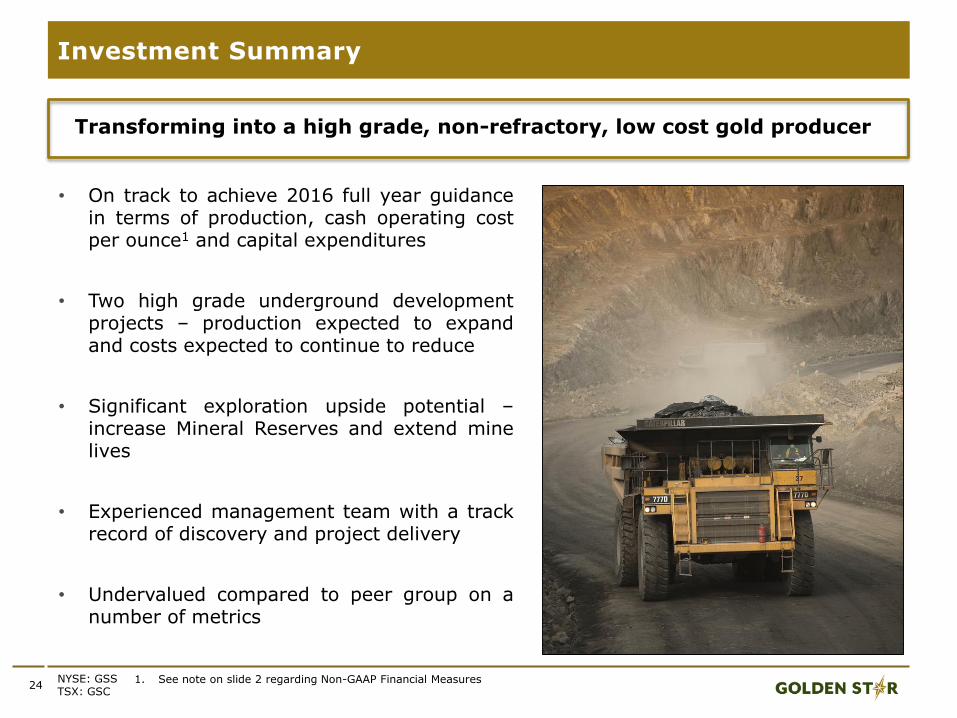
• On track to achieve 2016 full year guidancein terms of production, cash operating costper ounce1 and capital expenditures
• Two high grade underground developmentprojects – production expected to expandand costs expected to continue to reduce
• Significant exploration upside potential –increase Mineral Reserves and extend minelives
• Experienced management team with a trackrecord of discovery and project delivery
• Undervalued compared to peer group on anumber of metrics
24
Investment Summary
NYSE: GSSTSX: GSC
Transforming into a high grade, non-refractory, low cost gold producer
1. See note on slide 2 regarding Non-GAAP Financial Measures
26
Appendices: Market Information
One year SP graph
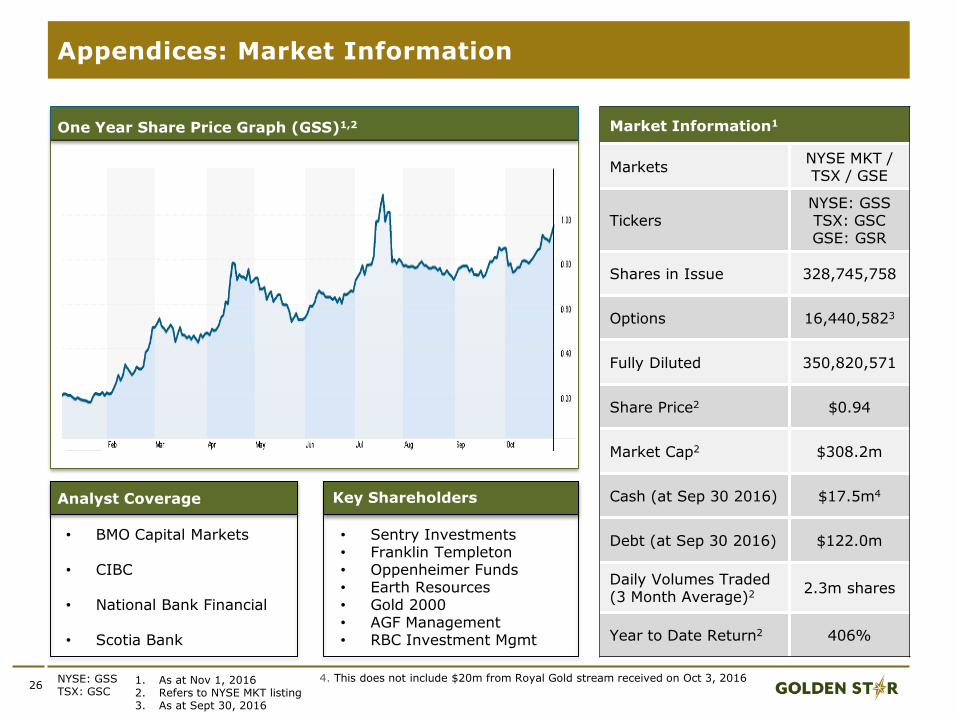
Market Information1
MarketsNYSE MKT / TSX / GSE
TickersNYSE: GSSTSX: GSCGSE: GSR
Shares in Issue 328,745,758
Options 16,440,5823
Fully Diluted 350,820,571
Share Price2 $0.94
Market Cap2 $308.2m
Cash (at Sep 30 2016) $17.5m4
Debt (at Sep 30 2016) $122.0m
Daily Volumes Traded (3 Month Average)2 2.3m shares
Year to Date Return2 406%
One Year Share Price Graph (GSS)1,2
Xxx% share price increase in 1 year
Analyst Coverage Key Shareholders
• BMO Capital Markets
• CIBC
• National Bank Financial
• Scotia Bank
• Sentry Investments• Franklin Templeton• Oppenheimer Funds• Earth Resources• Gold 2000• AGF Management• RBC Investment Mgmt
1. As at Nov 1, 20162. Refers to NYSE MKT listing3. As at Sept 30, 2016
NYSE: GSSTSX: GSC
4. This does not include $20m from Royal Gold stream received on Oct 3, 2016

27
A Responsible Corporate Citizen
NYSE: GSSTSX: GSC
99% of our workforce and contractors are Ghanaian59% of our workforce and contractors are from local communities
GSR supports a range of community projects focused on thekey areas of healthcare, education and sustainableagribusiness.
For more information on our commitment to corporate socialresponsibility, please visit www.gsr.com/responsibility
1
1. Refers to the 10% of royalties given to stools/traditional authorities. The total amount paid by GSR in 2015 to Government came to $36.9m and the total over the Company’s life to $287m..
28
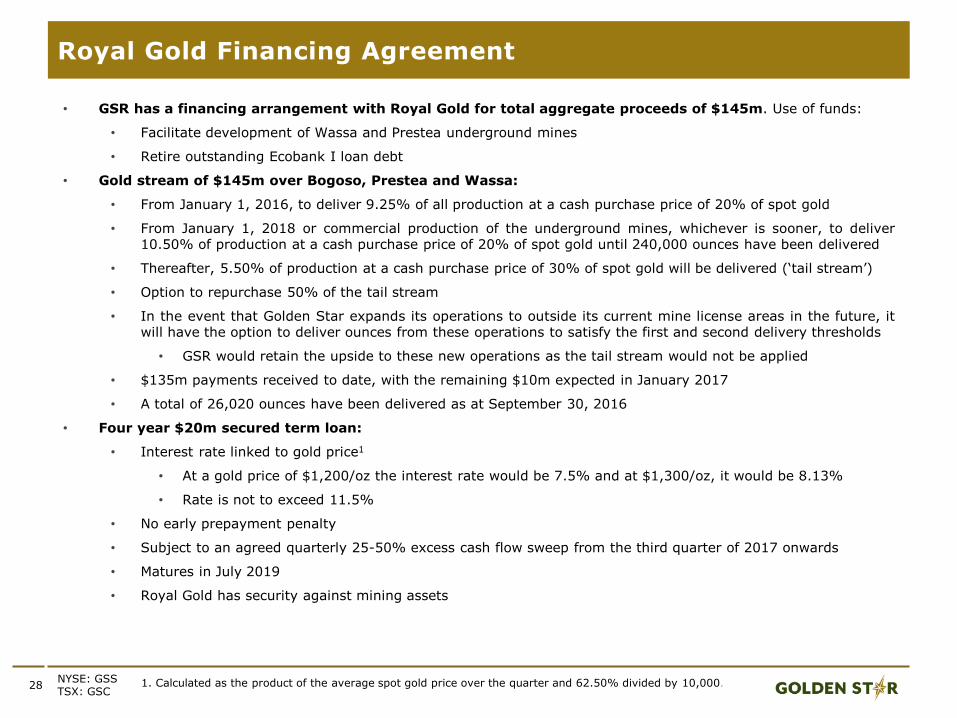
• GSR has a financing arrangement with Royal Gold for total aggregate proceeds of $145m. Use of funds:
• Facilitate development of Wassa and Prestea underground mines
• Retire outstanding Ecobank I loan debt
• Gold stream of $145m over Bogoso, Prestea and Wassa:
• From January 1, 2016, to deliver 9.25% of all production at a cash purchase price of 20% of spot gold
• From January 1, 2018 or commercial production of the underground mines, whichever is sooner, to deliver10.50% of production at a cash purchase price of 20% of spot gold until 240,000 ounces have been delivered
• Thereafter, 5.50% of production at a cash purchase price of 30% of spot gold will be delivered (‘tail stream’)
• Option to repurchase 50% of the tail stream
• In the event that Golden Star expands its operations to outside its current mine license areas in the future, itwill have the option to deliver ounces from these operations to satisfy the first and second delivery thresholds
• GSR would retain the upside to these new operations as the tail stream would not be applied
• $135m payments received to date, with the remaining $10m expected in January 2017
• A total of 26,020 ounces have been delivered as at September 30, 2016
• Four year $20m secured term loan:
• Interest rate linked to gold price1
• At a gold price of $1,200/oz the interest rate would be 7.5% and at $1,300/oz, it would be 8.13%
• Rate is not to exceed 11.5%
• No early prepayment penalty
• Subject to an agreed quarterly 25-50% excess cash flow sweep from the third quarter of 2017 onwards
• Matures in July 2019
• Royal Gold has security against mining assets
1. Calculated as the product of the average spot gold price over the quarter and 62.50% divided by 10,000.NYSE: GSSTSX: GSC
Royal Gold Financing Agreement
29
Mineral Reserves and Resources
NYSE: GSSTSX: GSC
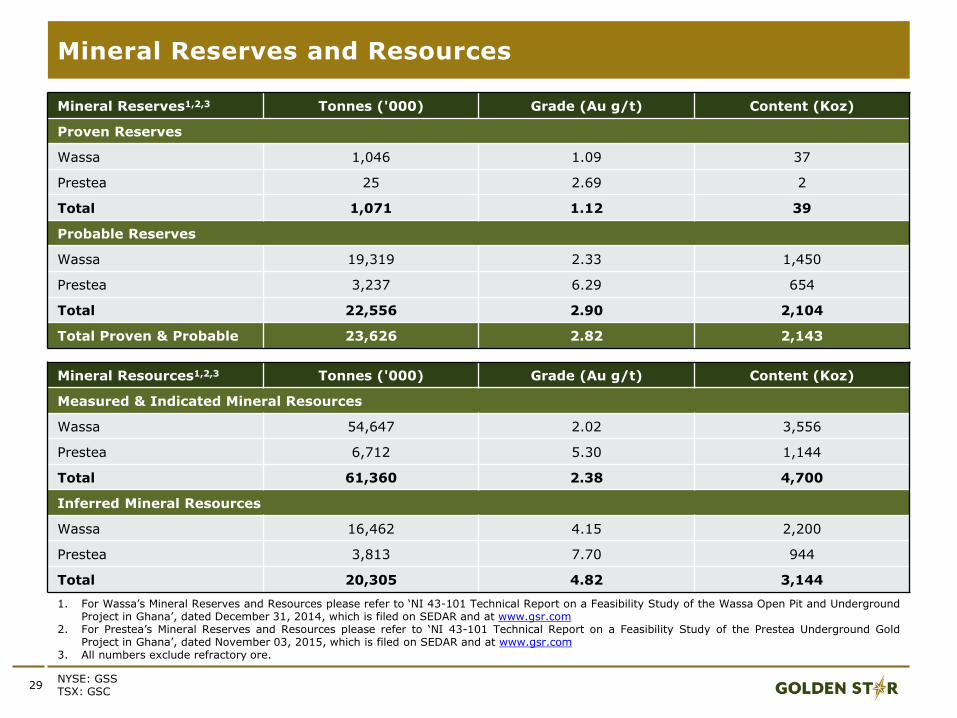
Mineral Reserves1,2,3 Tonnes ('000) Grade (Au g/t) Content (Koz)
Proven Reserves
Wassa 1,046 1.09 37
Prestea 25 2.69 2
Total 1,071 1.12 39
Probable Reserves
Wassa 19,319 2.33 1,450
Prestea 3,237 6.29 654
Total 22,556 2.90 2,104
Total Proven & Probable 23,626 2.82 2,143
Mineral Resources1,2,3 Tonnes ('000) Grade (Au g/t) Content (Koz)
Measured & Indicated Mineral Resources
Wassa 54,647 2.02 3,556
Prestea 6,712 5.30 1,144
Total 61,360 2.38 4,700
Inferred Mineral Resources
Wassa 16,462 4.15 2,200
Prestea 3,813 7.70 944
Total 20,305 4.82 3,144
1. For Wassa’s Mineral Reserves and Resources please refer to ‘NI 43-101 Technical Report on a Feasibility Study of the Wassa Open Pit and UndergroundProject in Ghana’, dated December 31, 2014, which is filed on SEDAR and at www.gsr.com
2. For Prestea’s Mineral Reserves and Resources please refer to ‘NI 43-101 Technical Report on a Feasibility Study of the Prestea Underground GoldProject in Ghana’, dated November 03, 2015, which is filed on SEDAR and at www.gsr.com
3. All numbers exclude refractory ore.

![ASMI Investor presentation Q3-2013 … PowerPoint - ASMI_Investor presentation Q3-2013_1November2013.pptx [Read-Only]](https://img.pdfslide.tips/doc/110x75/5bd6338909d3f2623e8d4ac3/asmi-investor-presentation-q3-2013-powerpoint-asmiinvestor-presentation-q3-20131november2013pptx.jpg)