Embed Size (px)
Citation preview
1
Bar Talk
The away-from-home consumption phenomenon:
A fuzzy research study between induction
and deduction.
Febo Leondini and Matteo De Angelis
2
Contents
Foreword……………………………………………………………………………………………………..
3
Methodological Note…………………………………………………………………………………. 6
The HoReCa consumption phenomenon: An inductive research
study study
study for a new analytical methodology ……………………………………………… 8
SECTION ONE
Drivers influencing the Ho.Re.Ca. consumption phenomena ……….… 14
SECTION TWO
Demand targeting and supply segmentation.................................. 31
SECTION THREE
Conclusions.................................................................................... 35
SECTION FOUR
A methodological proposal for analysing the Ho.Re.Ca market ……. 40
SECTION FIVE
FIPE: Ho.Re.Ca. Annual Report 2015…………………………………..…............ 50
SECTION SIX
Bibliography .....................…………………………..…………………………………..….. 58
3
Foreword
Despite the existence of a substantial number of analytical studies on the
Consumption phenomenon, there are still only a few documents that deal specifically
with what happens in HoReCa (Hotel, Restaurants, and Cafés). This omission, mainly
due to the difficulty of collecting and processing data of any type, has prompted the
industry to adapt business strategies developed for other sectors to those of HoReCa,
rather than develop its own strategy. This document attempts to discourage the
tendency to consider the HoReCa as a sort of “child of a lesser god” of which,
essentially, we know almost nothing.
Let’s take Oldenburg’s definition as our starting point, according to which
HoReCa is the third place, after the home and the workplace, where a person
discovers their sense of community and interacts socially. We have decided to
examine the process of Consumption both from a social and cultural perspective. This,
however, has not stopped us from identifying a quantitative, in other words objective
and repeatable method, which enables us to measure the drivers influencing the
process, in order to give us the tools to understand the hidden potential of the sector.
The search for a “process”, in this case that of AfH Consumption (Away from
Home, in a bar for instance) in HoReCa, does not enable us to identify specific
parameters that can immediately be fed into operational processes which have a
direct effect on costs and revenues. The analysis of a process can, and should, show
trends and significant events that enable the organisation to understand as early as
possible if someone is trying to take it by surprise, overtaking it on the inside. To put
it another way and to take an example from another industry, analysing the way in
which mobile devices are used would certainly not have identified a specific future
product but would have avoided wasting time improving physical keyboards, coming
up instead with the idea of the touch screen. Taking this into account, in this paper we
do not explore the processes of creating the Brand image and of giving personality to
the future product. These are specific to the marketing strategies of the individual
company and it would be unrealistic to try to address them in a general paper like this
one.
In terms of structure, this paper is divided into 6 separate sections.
4
The first section, which is necessarily theoretical, aims to define the drivers
affecting the HoReCa phenomena of consumption. What is innovative about what we
are proposing is that we have sought to support our theoretical conclusions, which are
based on accredited studies around the world, with a series of empirical observations,
which are based on objective data. By doing this we have created a bridge between
deductive rational models and the genuine empiricism of concrete field testing. Our
aim, which we hope we have achieved, was to confirm, by means of a series of
repeatable studies, the validity of the theoretical models presented.
The second section outlines the implications of the studies we carried out both
for the targeting of Demand as well as for the segmentation of Supply. The
conclusions we reached, which were often counter-intuitive, will, it is hoped,
encourage further research studies and engender further discussion.
In the third section we have presented and summarised the conclusions that we
have reached as a result of this study and which, at least in part, can form the basis
for more in-depth analysis in the future.
The fourth section, which is more technical and serves as a kind of appendix to
this paper, proposes a way of carrying out research into the Ho.Re.Ca sector enabling
the various stakeholders to take advantage of a tool, which can certainly be improved
over time, that can be used both to analyse a little-understood Segment and to
attempt to measure the effects of consumer behaviour on the profit-and-loss account.
The fifth section reproduces an extract from the publication “Considerazioni
Generali dell’Indagine FIPE 2015 sulla ristorazione in Italia: il documento più completo
sull’HoReCa” (which translates approximately into "General Considerations resulting
from the FIPE 2015 investingation on the Italian catering industry: the most
comprehensive document on Ho.Re.Ca).
The sixth section provides a basic bibliography for a more in-depth study of the
topics covered by this paper.
Finally, two more points.
As previously mentioned, we have carried out a study of the HoReCa
phenomenon of consumption, which, based on our research, is determined by both
social and cultural factors. This means that we have separated it from the product
process. In other words, we have tried to show that the function of the product is to
5
be an “experiential facilitator” and not, as happens in the purchasing function, an
experience driver. This perspective may seem infuriatingly subtle but it is of
fundamental importance because it enables us to clearly separate the two analytical
functions: that of Consumption and that of institutional Marketing Strategies.
This study finally asks how it might be possible to improve, through a better
understanding, the cash performance of a sector that, whether viewed objectively or
subjectively, represents a very important commercial opportunity. This paper suggests
that people working in this sector should try to use new research tools to develop a
commercial strategy that suits the inherent characteristics of the Market, but in any
case it will also have achieved its objective if it succeeds in stimulating a debate
among managers working in the sector.
***
6
Methodological Note
The aim of the research study, hereinafter referred to as R1, being the first
of its kind as far as we are aware, was to verify a series of theoretical insights that,
although considered to be true according to the logic of consumer theory, needed
to be proven empirically.
R1, we should emphasise, was conducted in a non-cooperative context, and
therefore the consumers were anonymous and were unaware of the research study
taking place. Therefore, the data presented was all objective data, deduced from
the cash-register sales receipts. For example, the number of consumers involved in
the study was determined by the number of covers recorded in the cash register,
which are therefore objectively verifiable.
With regard to the choice of the POS sample we were faced with two options: a
large number of POSs and relatively few sales receipts or a single POS with a large
number of receipts for us to analyse. The second alternative was chosen because
the consumption phenomenon, as demonstrated later, does not depend on the
type of POS and therefore a longitudinal study was preferable to a horizontal
study. The POS chosen is situated at the mid-point between the Milan–Piacenza
road and the Brescia-Mantova road. Customers are served either at the tables or at
the bar and the establishment offers a full food and beverages menu.
The parameters of R1 are as follows:
- Period: from week 19 to week 30 of 2016 subdivided into:
o T1 for weeks 22 to 30;
o T2 for weeks 19 to 22.
- Consumption situations analysed: 2
o Dinner, identified by the sales receipts issued between 20.00 and
21.59;
o After dinner, identified by the sales receipts issued between 22.00 and
23.59.
- Product category consumed:
o Mineral water;
o Bottled or canned soft drinks;
o Fruit juices;
o Bottled or canned beers;
7
o Bottled wines;
o Spirits and cordials;
o Non-packaged drinks;
o Cocktails;
o Sandwiches and pizzas;
o Traditional dishes, or portions;
o Hot drinks.
- Number of sales receipts analysed: 4,643;
- No. of sales receipt lines processed: 37,120;
- No. of consumers participating: 12,555 of which
o Dinner: 5,320;
o After dinner: 7,235;
- Type of consumption analysed: 3, specifically:
o Consumption at the bar;
o Consumption of food and beverages at the table;
o Consumption of beverages only at the table;
- Clusters used by week: 3, specifically:
o From Monday to Thursday inclusive;
o From Friday to Saturday inclusive;
o Sunday.
***
8
The HoReCa Consumption phenomenon: an inductive research study
for a new analytical methodology
Febo Leondini1, Matteo De Angelis2
This study aims to explore the demand-supply dynamics which characterise the
HoReCa sector (that is the consumption of food and beverages “away from home”). In
particular, through a transactional analysis of a sample of over 12,000 consumers in a
selected POS, our study fills the obvious gap in our scientific knowledge about the key
drivers influencing consumer behaviour in this significant sector, with major
implications both in terms of demand targeting and of supply segmentation. In our
study we have used an inductive approach, which is based on empirical observations
and data relating to the behaviour of the consumers of HoReCa goods and services in
various consumption situations, for different product categories and at different times
of the week. The most important point of this study is that the empirical research
carried out prepares the ground for a proposed new study method based on three
variables which are: servitisation, time and space. These, in turn, are divided into a
number of useful indicators that provide applicable and comparable measures for
assessing the demand–supply dynamics within the HoReCa sector.
Key terms: HoReCa, consumption, services, experience, time, space.
1. Research objectives and context
Despite the existence of a substantial number of analytical studies on the
Consumption processes in various contexts and markets, there are still only a few
research studies that deal specifically with what happens in HoReCa, which is in the
“away-from-home” food and beverage consumption sector. This lack, mainly due to
the difficulty in collecting and processing systematic data, prompted the industry to
adapt commercial strategies that had been developed for other sectors to those of
HoReCa, rather than develop its own strategy. The lack of in-depth knowledge of the
HoReCa sector is even more surprising given its significant economic value, which is
equal to 74.7 billion euros (2014 data), compared with approx. 66 billion euros in
2008, which is the equivalent to 35% of what Italians spend on food (FIPE 2015
1 Contact author, Consigliere Delegato di Noumeno 2 Assistant Professor di Marketing, Università LUISS Guido Carli
9
Report). This document attempts to discourage the tendency to consider the HoReCa
as a sort of “child of a lesser god” about which, essentially, we know almost nothing.
Let’s take Oldenburg’s definition as our starting point, according to which HoReCa is
the third place, after the home and the workplace, where a person discovers their
sense of community and interacts socially. We have decided to examine the process of
Consumption both from a social and cultural perspective. This, however, has not
stopped us from identifying a quantitative, in other words objective and repeatable
method, which enables us to measure the key drivers of the process, in order to give
us the tools to understand the hidden potential of the sector.
Starting with the basic assumption that HoReCa consumption has social and
cultural drivers, this study maintains that the main purpose of the HoReCa product is
to be “an experiential facilitator” and not to be a direct driver of the consumption
experience. On the basis of these arguments the study aims to provide professionals
in this industry with an inductive approach for assessing consumption processes that
is based on the observations of consumer behaviours at POSs, aimed at creating an
analysis model for use by both academics and managers in future. This inductive
approach goes against, to a certain extent, the deductive approach based on the
application of pre-prepared analysis schemes which are therefore less and less
capable of grasping the complex, varied and multi-dimensional aspects of HoReCa
consumption. The empirical research study presented in this document is based on
data relating to transactions carried out by a sample of over 12,000 consumers at a
POS located in Northern Italy, and leads to a methodological proposal for assessing
consumption within the HoReCa sector.
2. Customer experience in the HoReCa consumption
These days HoReCa consumption is strongly characterised by experience. According to
Miao and Mattila (2013), "food consumption needs to be examined from a broader
sociological perspective beyond product acquisition". According to Gentile et al. (2007,
p. 397), "the customer experience originates from a set of interactions between a
customer and a product, a company, or part of its organisation, which provoke a
reaction. This experience is strictly personal and implies the customer’s involvement
at different levels (rational, emotional, sensorial, physical, and spiritual)”. In other
words, the term customer experience (CE) identifies a descriptive model of what the
10
consumer experiences during the process of buying and consuming goods. A
noteworthy study that identified the parameters and people’s previous consumer
experience was written by Verhoef et al. (2009) in which the authors present a model
where the key drivers of the CE are the social environment, the service interface
(which includes the use of technology for the provision of services and the possibility
to co-create and personalise the service itself), the POS environment and the range
and price of products and services.
HoReCa consumption can be considered as having three fundamental dimensions:
servitisation, defined as the combination of the physical product and the intangibles of
experience, time and space. In other words, servitisation refers to the idea that the
physical product is one of the components of the consumption experience, not the
driver of the experience itself. This is due to the fact that the HoReCa consumption
dynamic often has a tendency to make the product seem anonymous. As far as time is
concerned, this is defined as when the consumption takes place, and this differs
between breakfast, lunch, an aperitif and dinner and depends on the importance of
the social occasion. Finally, space indicates the place where consumption takes place
and is determined by the various POSs (from vending machines and take-away kiosks
to POSs with service). These 3 dimensions can be interpreted using the Verhoef at al
model (2009), which stresses the importance of associating the social environment
with the time dimension (when the consumption takes place), the service interface
and the POS environment with the space dimension, and, finally, the range and price
of products and services with the servitisation dimension.
Setting the definition of CE in the context of HoReCa consumption, we can
conclude that CE is triggered by the occasion, determined by the context and defined
by the attitude of the consumer. CE is therefore strongly influenced by qualitative
factors that have an unpredictable impact, since they are in a bi-univocal relationship
with the experience of the consumer. To incorporate this assumption into the current
social dynamic, however, means to undermine the classical theories of demand
segmentation. The post-modern tribalism context (Maffesoli, 2004) in which the
consumer operates and exists prevents the attribution of pre-conceived meaning to
his or her own experience and consequently goes against the idea of a segmentation
based on a classification that, despite being multi-varied, excludes experience. In this
framework, with its socio-economic connotations, we retrieve the difference between
HoReCa consumption and other forms of consumption: while in the latter, the same
experience can be derived from the same quantitative data, in the former this does
11
not happen. HoReCa consumption adheres to a new formulation of the principle of
uncertainty that goes more or less like this: it is impossible for us to understand the
quantitative data of the act of consumption or the experiences of the consumer at that
very moment; the same quantitative data can describe different experiences and,
conversely, identical experiences can be described by different quantitative data.
When you become aware of this particular feature of HoReCa consumption, you have
to recognise the impossibility of coming to a descriptive conclusion which does not
take account of experience and, consequently, to accept the need to move from a
metaphysic of the consumer to an anthropology of consumption.
3. Empirical research
Empirical research into HoReCa consumption was conducted in a non-cooperative
context, and therefore the consumers were anonymous and were unaware of the
research study taking place. Consequently, the data presented was all objective data,
deduced from cash-register sales receipts. We decided to go to a single POS, which is
situated at the mid-point between the Milan–Piacenza road and the Brescia-Mantova
road. Customers are served either at the tables or at the bar and the establishment
offers a full food and beverage menu. The research study was conducted between
weeks 19 and 30 in 2016 and we analysed dinner and after dinner as our consumption
situations. We analysed the following product categories: mineral water, pre-packed
drinks, juices, beers, wines, liquors, non-packaged drinks, cocktails, sandwiches,
pizzas, traditional dishes, and coffees. We analysed 12,555 consumers and 4,643 sales
receipts. The analysis was divided into three consumption methods (at the bar, food
and beverages at the table or just beverages at the table) and three clusters during
the week (from Monday to Thursday, from Friday to Saturday and Sunday).
4. A methodological proposal for the analysis of HoReCa consumption
The methodological proposal presented in this study is based, on the one hand, on the
definition of the parameters of supply and, on the other hand, on the definition of the
parameters of demand. With regard to the supply aspect, the aim is to identify
objective data definable in quantitative terms, which enable us to analyse the value
drivers of the HoReCa consumption phenomena. Specifically, in line with what we
presented in the theoretical part, the methodological proposal is based on the three
12
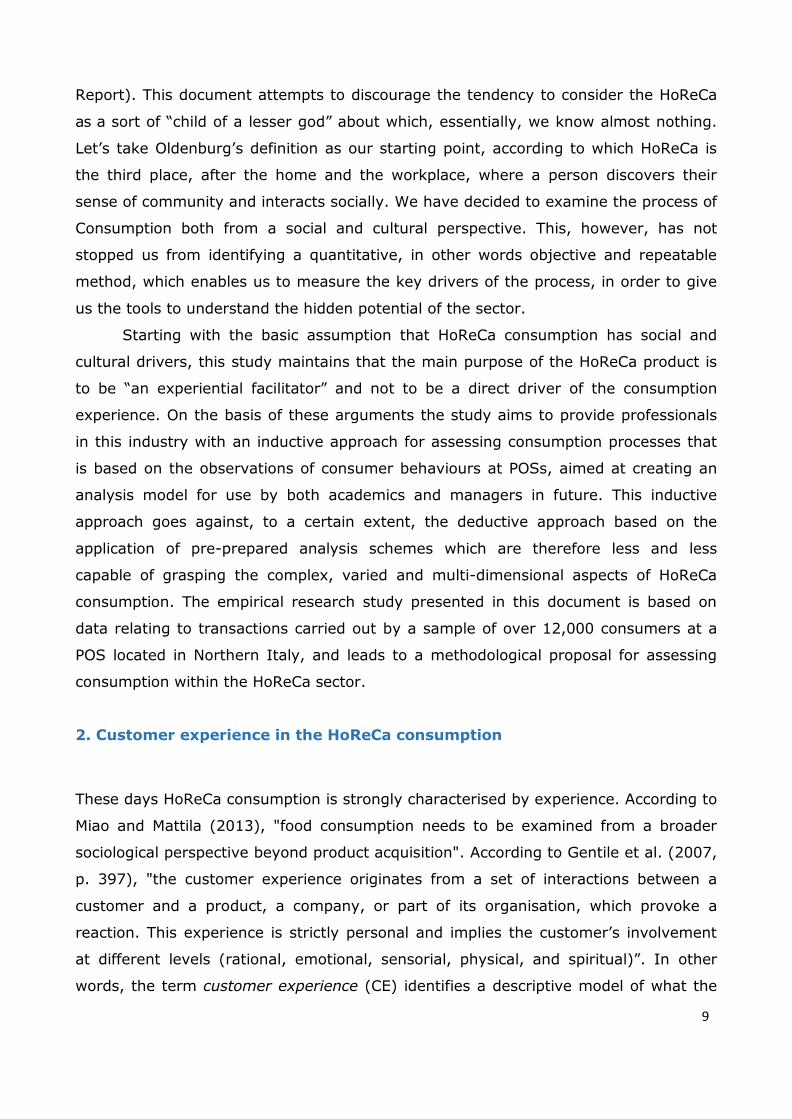
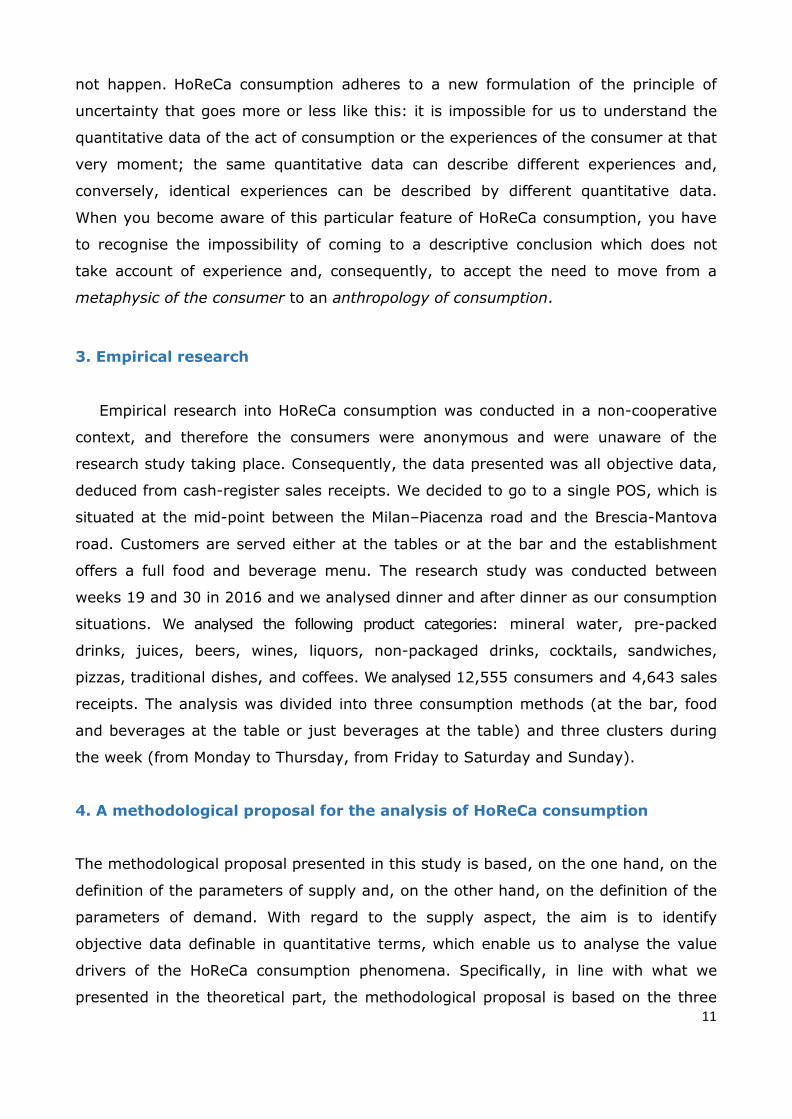
main dimensions of HoReCa consumption that is servitisation, time and space.
With regard to servitisation, the proposal involves placing the various distribution
channels on a continuum which goes from complete standardisation to complete
personalisation according to the diagram in Figure 1.
Standardisation
Take-away
food kiosks
POS table service
Vending machines
POS
Non-table service Personalisation
(Fig. 1) Servitisation by distribution channel
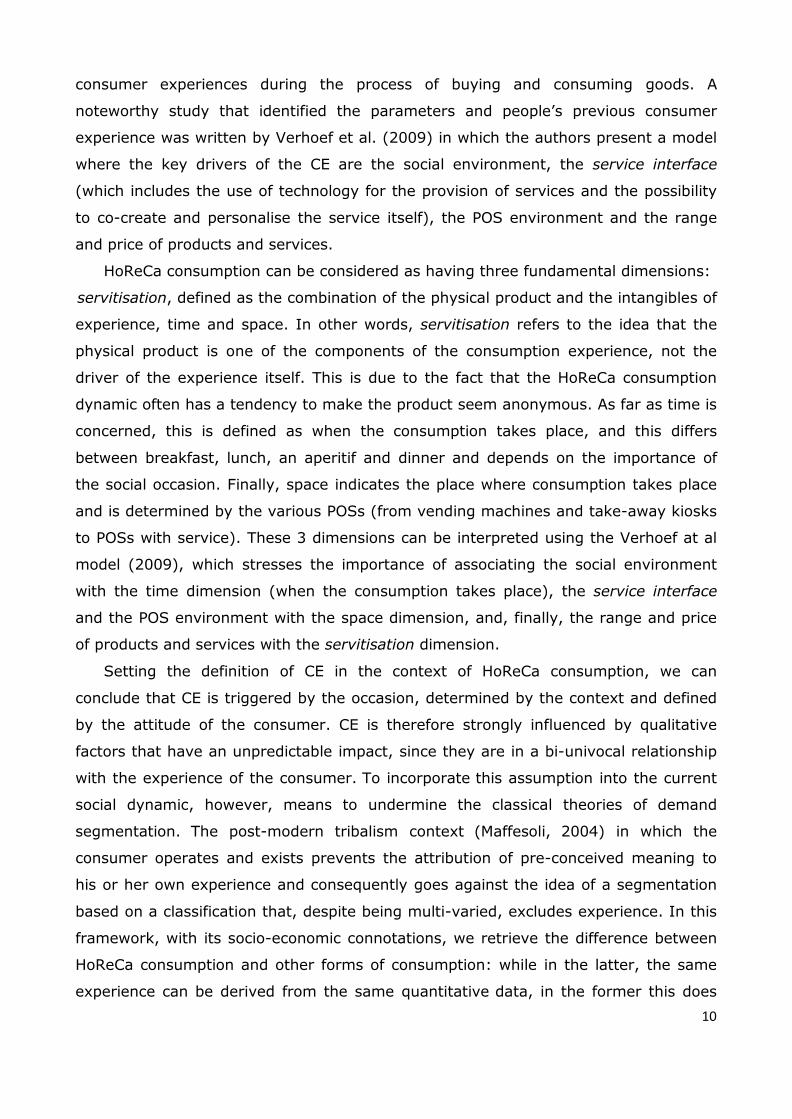
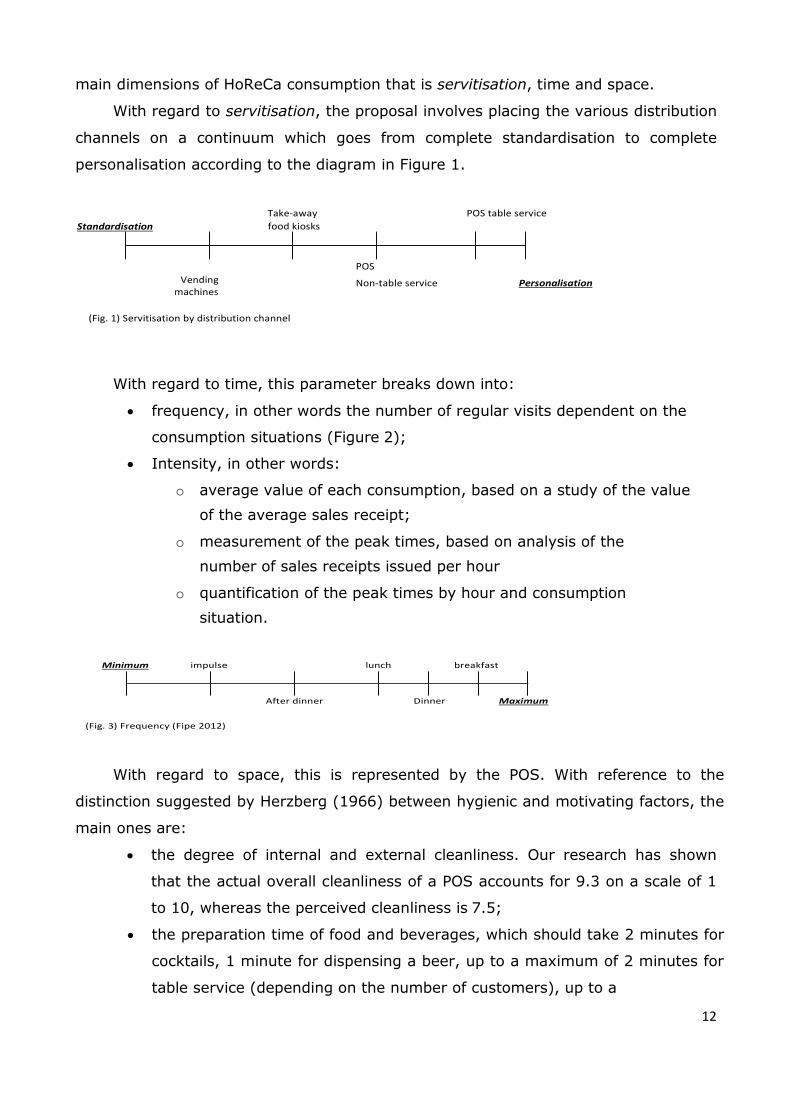
With regard to time, this parameter breaks down into:
frequency, in other words the number of regular visits dependent on the
consumption situations (Figure 2);
Intensity, in other words:
o average value of each consumption, based on a study of the value
of the average sales receipt;
o measurement of the peak times, based on analysis of the
number of sales receipts issued per hour
o quantification of the peak times by hour and consumption
situation.
Minimum impulse lunch breakfast
After dinner Dinner Maximum
With regard to space, this is represented by the POS. With reference to the
distinction suggested by Herzberg (1966) between hygienic and motivating factors, the
main ones are:
the degree of internal and external cleanliness. Our research has shown
that the actual overall cleanliness of a POS accounts for 9.3 on a scale of 1
to 10, whereas the perceived cleanliness is 7.5;
the preparation time of food and beverages, which should take 2 minutes for
cocktails, 1 minute for dispensing a beer, up to a maximum of 2 minutes for
table service (depending on the number of customers), up to a
(Fig. 3) Frequency (Fipe 2012)
13
maximum of 2 minutes for taking the order, and a maximum of 6 minutes
for the preparation and cooking of pizzas and hot dishes.
Among the motivating factors, on the other hand, we include the friendliness of
the staff, how pleasant the environment is, the sensory experience, the retail-
tainment and special events.
With regard to demand, it was a case of examining consumption habits and
behaviour without being too intrusive. Quantitative data to take into account includes:
the ratio of customers to passers-by, both direct (individual POS) and indirect
(comparison between different POSs), to measure the value of the location;
the time spent looking in to define the in-store communication policies of the
establishment;
the time spent in the queue for the till;
the time differential between consumption at the bar or at the table;
the correlation between customer flow, value of the sales receipt and products
purchased in order to modify either the staffing levels required or the
servitisation;
the analysis of internet traffic during consumption to understand what the
consumer thinks while he or she is inside the POS;
the integration of the analysis of sales receipts with climatic and social variables;
video analytics to assess the participants and to define the various types of
experience.
All of the above data can be collected in non-collaborative contexts, without being
intrusive, and by mere provision of a free Wi-Fi service.
***
14
Section One:
Drivers influencing the Ho.Re.Ca. consumption phenomena
AfH consumption: essential components
The social driver: Consumption between impulse and relationship
The need to identify more precisely the potential users of a service or potential
consumers of goods has been increasing with the increase of the productive potential
of a Supply system in constant expansion. The response to such need is complex and
intricate. In the interests of providing a general summary only, we can identify three
different approaches to resolving the problem which were adopted in three phases
following the Second World War:
- a “company centric” vision which, in an unspecified Market that is driven by
needs and experiences continuous, fast expansion, was motivated by the need
to fill the void of Supply. Essentially, we were faced with a proportion of
Demand left unsatisfied and the response was simply to produce more and
faster. This phase, which started in the period after the second world war, came
to an end in the mid-70s;
- a “market centric” vision in which, with a Consumption dynamic increasingly
liberated from Need, the principles of Market segmentation are confirmed. The
market is no longer regarded as a kind of quintessential ether, but as an
aggregate of different components. Consumers can be precisely classified
according to demographic and social indicators. This phase will last for ten
years and will come to an end towards the middle of the 80s. It is a period in
which powerful emotions and shifting values are causing tensions within
society. Society tended to give hierarchical responses, which in the end were
the drivers of the Consumption phenomena approach;
15
- a “consumer centric” vision which lasted until the end of the 20th Century. In
this phase it was realised that, when describing the behaviour of buyers and
consumers, demographic and social variables are inadequate. Although society
was still influenced by the patterns and values of previous decades, it began to
be affected by millennial phenomena and to have hedonistic tendencies. The
development of sophisticated psychographic techniques, the explosion of the
sociology of consumption and the study of youth dynamics originate in this
period.
Towards the end of the last century these behavioural dynamics and ethics, which had
affected society in this final decade, ceased to be considered the framework of
reference, which could be precisely describable and identifiable, and became instead
the main drivers, if not the instruments, of change. A new social model began to be
developed, no longer describable in terms of stratified differentiation (Luhman, 1990),
and therefore subjected to a hierarchical order. It was instead based on functional
differentiation, in which hierarchical boundaries fade until they lose their
representative capacity. The birth and the development of social networks, the
pervasiveness of interconnected networks and the spread of low-cost flights, following
an initial shock in a neo-oblative way, increased the flow of information and group
dynamics, and mankind became again the measure of all things: of the things that are
as they are, and of the things that are not as they are not. From now on we begin to
refer to Customer Experience (CE) as a dialectical synthesis of the three periods
described above. Starting from CE, seen not as a new descriptive model but as an
interactive process of mutual engagement between the consumer and third parties on
a pseudo-contractual basis, we can define the limits of the traditional theory of
Demand segmentation in AfH consumption: “The results from this study further affirm
the notion that food consumption needs to be examined from a broader sociological
perspective beyond product acquisition” (Miao, Mattila 2013).
16
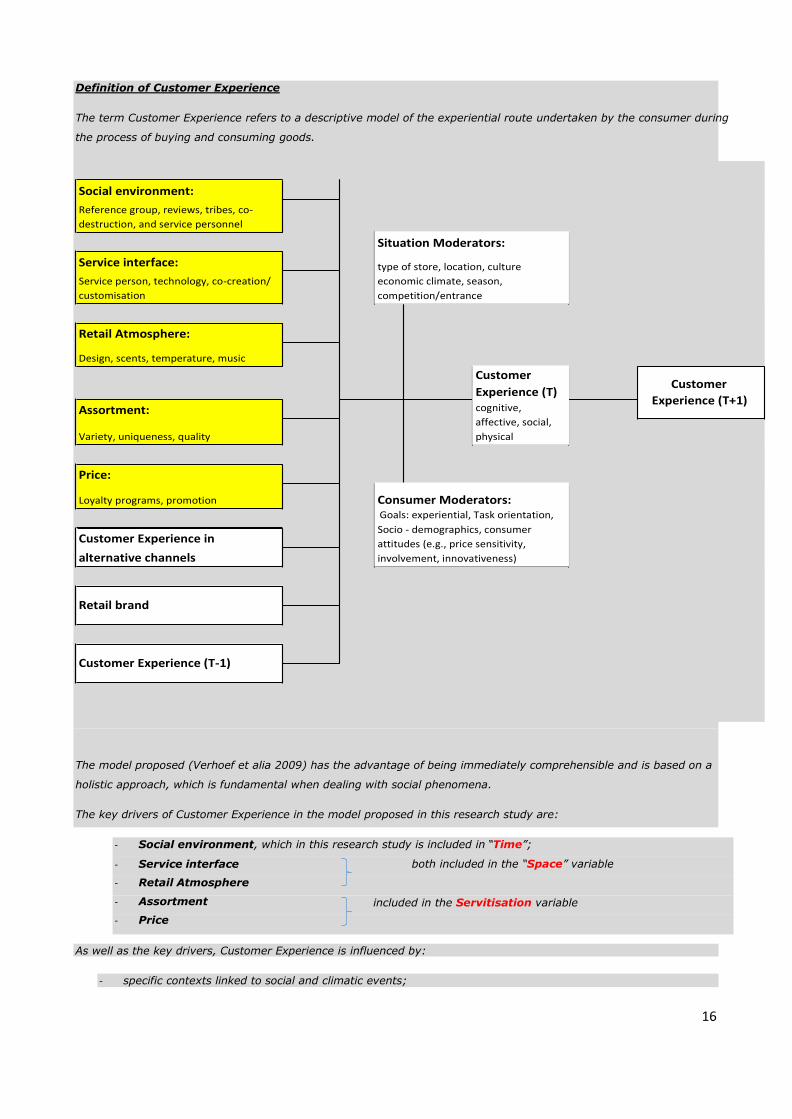
Definition of Customer Experience
The term Customer Experience refers to a descriptive model of the experiential route undertaken by the consumer during
the process of buying and consuming goods.
Social environment:
Reference group, reviews, tribes, co-
destruction, and service personnel
Service interface:
Service person, technology, co-creation/
customisation
Retail Atmosphere:
Design, scents, temperature, music
Assortment:
Customer
Experience (T+1)
Variety, uniqueness, quality
Price:
Loyalty programs, promotion
Customer Experience in
alternative channels
Retail brand
Customer Experience (T-1)
The model proposed (Verhoef et alia 2009) has the advantage of being immediately comprehensible and is based on a
holistic approach, which is fundamental when dealing with social phenomena.
The key drivers of Customer Experience in the model proposed in this research study are:
As well as the key drivers, Customer Experience is influenced by:
- specific contexts linked to social and climatic events;
- Social environment, which in this research study is included in “Time”;
- Service interface
- Retail Atmosphere
- Assortment
- Price
both included in the “Space” variable
included in the Servitisation variable
Situation Moderators:
type of store, location, culture
economic climate, season,
competition/entrance
Customer
Experience (T) cognitive,
affective, social,
physical
Consumer Moderators: Goals: experiential, Task orientation,
Socio - demographics, consumer
attitudes (e.g., price sensitivity,
involvement, innovativeness)
17
The driver of the supply system: "Where are we going tonight?"
Consumption, separated from need, is a social action which is determined
culturally and gives meaning to the goods in question. More specifically, it is possible
to condense the act of consumption into three main drivers:
- Servitisation;
- Time;
- Space.
1) Servitisation
The term servitisation does not simply define an entity consisting of
physical goods and additional services, but identifies a genuine new product in
which the physical and the intangible form an indivisible union. In fact, while
this holistic vision has the importance of a descriptive synthesis, it brings with
it some problems from the point of view of the analysis of the consumption
phenomenon. We will break down the measurable drivers in a different section
of this document but for the time being we will only focus on physical goods in
the social context of AfH consumption.
Physical goods are what makes the act of consumption possible; they
turn it into a concrete entity as part of a quantitative choice which can be
described objectively. In the context of AfH consumption, however, it is
important to distinguish between generic goods, as we have defined them, and
goods identified by a brand. If, in fact, the aim of the product is to turn a
cultural action into a physical entity, the comforting function of the brand in the
context of F&B (food and beverage) goods has the tendency to fade until it no
longer makes sense. The dynamic of AfH consumption as social action which is
- the opinions of friends and relatives;
- previous experiences;
- value of the POS brand.
In this document we have considered and developed all the above aspects except for the last one. This was an almost
obligatory choice given that our research study is contextualised within the Italian situation where there is not a brand
such as Starbucks, which is strong enough to influence the choice of POS.
Finally, we completed the model by adding a further time variable, T+1, in order to underline that Customer
Experience continues even once you leave the POS, and is associated with memories that go beyond the
simple act of consumption itself. This aspect should be stressed because it highlights the interactivity of the
cognitive processes of Customer Experience which make it, on the one hand, a phenomenon that cannot
be attributed to a specific category of consumers and, on the other hand, an experience influenced by
social contexts and not necessarily by professional ones.
18
inadvertently stimulated by the physical goods, makes the product anonymous.
This phenomenon, which is self-evident in draught-dispensed products (so-
called draught beverages), is even more evident when you think of the act of
transforming demand into something material, which, at best, identifies an
undefined category of product or situation (a beer or an aperitif) and hardly
ever applies to a specific brand.
In order to conduct a more complete research study, we should cite a few
examples in which the brand has become synonymous with an entire product category
or a consumption situation (e.g. Crodino for a non-alcoholic aperitif, Spritz for an
alcoholic aperitif, or Coca Cola for a soft drink), turning a non-specific intention into a
specific request. However, due to its pervasiveness, the contextualisation of the brand
has lost its intrinsic brand identity and, therefore, could be interpreted more as a loss
of brand value, which is, however, an issue for the manufacturer who thus sees the
unwitting dispersal of the money spent on promotion, rather than as a way of
branding the consumption situation.
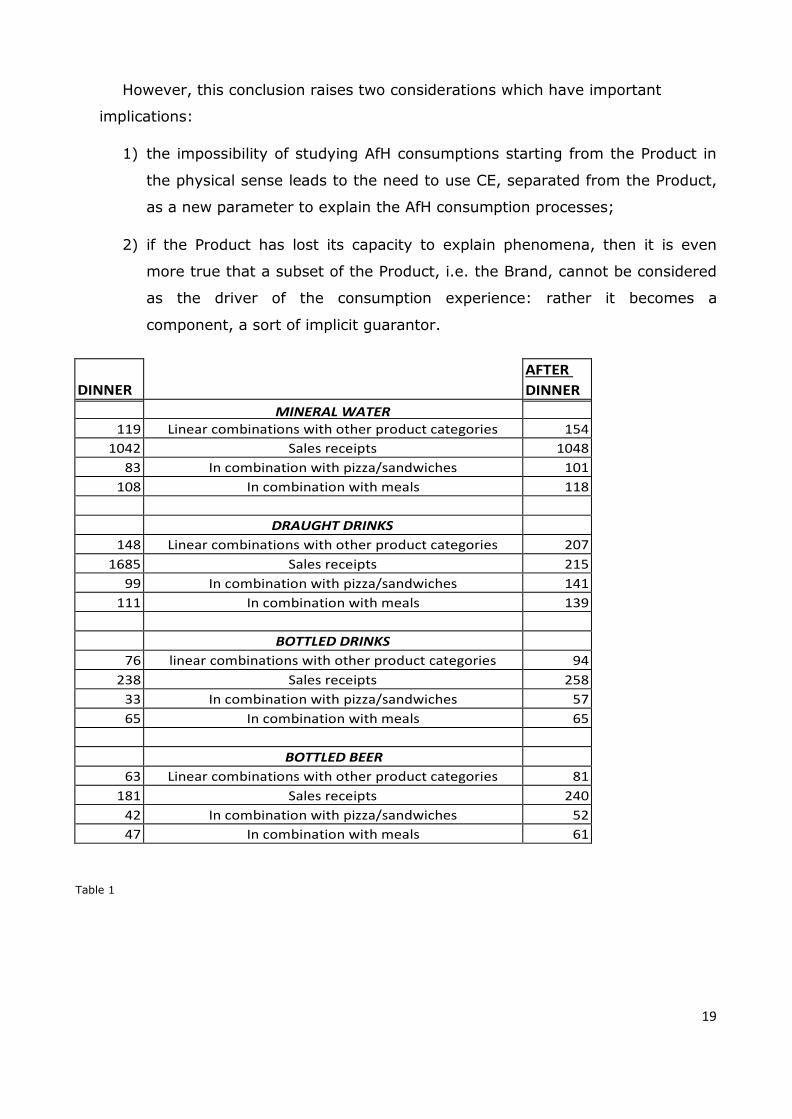
The above is shown in the data featured in table 1). Assuming that at
least one type of drink should always appear at least once on a sales receipt, for the
obvious reason that you do not eat without drinking, while you can drink without
eating, we analysed the Food/Beverage linear combinations. The analysis showed
that:
1) a preferred combination does NOT exist. On the contrary, food and beverages
are totally unrelated;
2) the Food/Beverage combination, in the Italian situation, is a genuine “food
diphthong”, subject to personal rules and dependent on the fleeting moment of
the experiential context.
The conclusions resulting from the above data suggest that in AfH F&B
consumption there are no rules allowing us to determine that the consumer's
choice of a drink is linked to a specific food in a given context; a context that, it
should be emphasised, apart from the excessive number of linear combinations,
easily exceeds the number of the consumption situations analysed.
19
However, this conclusion raises two considerations which have important
implications:
1) the impossibility of studying AfH consumptions starting from the Product in
the physical sense leads to the need to use CE, separated from the Product,
as a new parameter to explain the AfH consumption processes;
2) if the Product has lost its capacity to explain phenomena, then it is even
more true that a subset of the Product, i.e. the Brand, cannot be considered
as the driver of the consumption experience: rather it becomes a
component, a sort of implicit guarantor.
DINNER
AFTER
DINNER
MINERAL WATER 119 Linear combinations with other product categories
erceologiche 154
1042 Sales receipts 1048
83 In combination with pizza/sandwiches 101
108 In combination with meals 118
DRAUGHT DRINKS
148 Linear combinations with other product categories merceologiche
207
1685 Sales receipts 215
99 In combination with pizza/sandwiches 141
111 In combination with meals 139
BOTTLED DRINKS
76 linear combinations with other product categories 94
238 Sales receipts 258
33 In combination with pizza/sandwiches 57
65 In combination with meals 65
BOTTLED BEER
63 Linear combinations with other product categories 81
181 Sales receipts 240
42 In combination with pizza/sandwiches 52
47 In combination with meals 61
Table 1
20
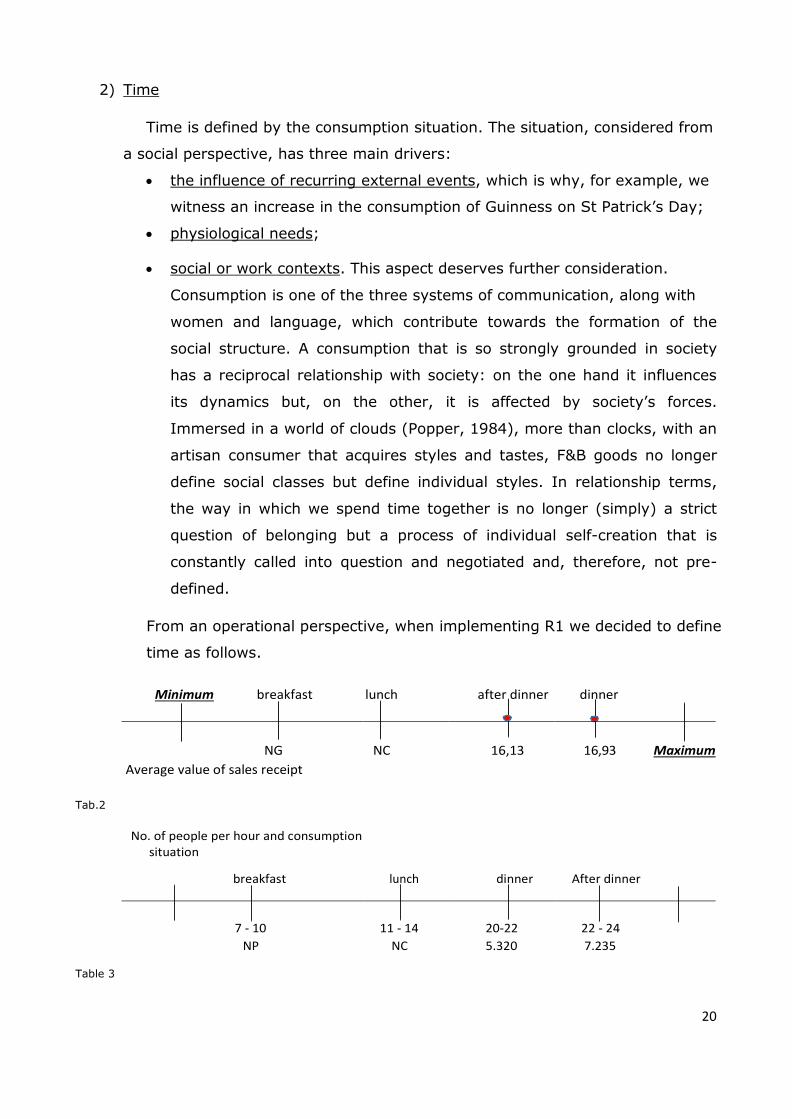
2) Time
Time is defined by the consumption situation. The situation, considered from
a social perspective, has three main drivers:
the influence of recurring external events, which is why, for example, we
witness an increase in the consumption of Guinness on St Patrick’s Day;
physiological needs;
social or work contexts. This aspect deserves further consideration.
Consumption is one of the three systems of communication, along with
women and language, which contribute towards the formation of the
social structure. A consumption that is so strongly grounded in society
has a reciprocal relationship with society: on the one hand it influences
its dynamics but, on the other, it is affected by society’s forces.
Immersed in a world of clouds (Popper, 1984), more than clocks, with an
artisan consumer that acquires styles and tastes, F&B goods no longer
define social classes but define individual styles. In relationship terms,
the way in which we spend time together is no longer (simply) a strict
question of belonging but a process of individual self-creation that is
constantly called into question and negotiated and, therefore, not pre-
defined.
From an operational perspective, when implementing R1 we decided to define
time as follows.
Minimum breakfast lunch after dinner dinner
NG
NC
16,13
16,93 Maximum
Average value of sales receipt
Tab.2
No. of people per hour and consumption situation
breakfast lunch dinner After dinner
7 - 10
11 - 14
20-22
22 - 24
NP NC 5.320 7.235
Table 3
21
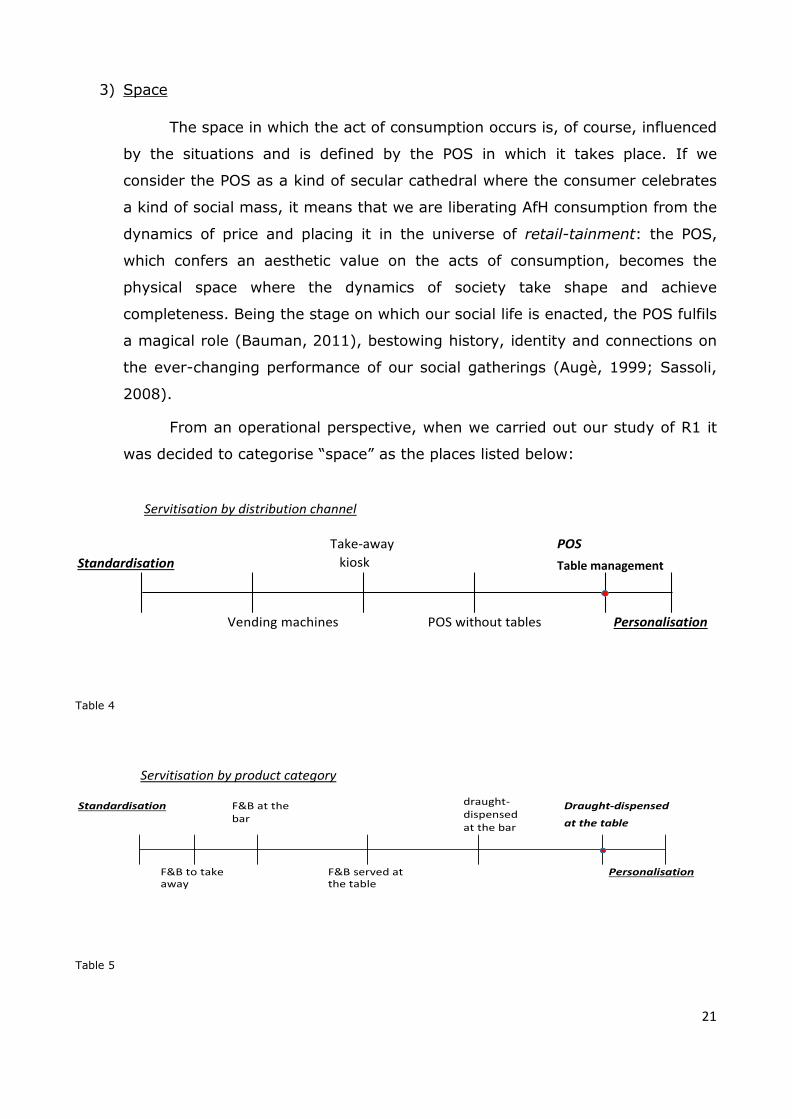
3) Space
The space in which the act of consumption occurs is, of course, influenced
by the situations and is defined by the POS in which it takes place. If we
consider the POS as a kind of secular cathedral where the consumer celebrates
a kind of social mass, it means that we are liberating AfH consumption from the
dynamics of price and placing it in the universe of retail-tainment: the POS,
which confers an aesthetic value on the acts of consumption, becomes the
physical space where the dynamics of society take shape and achieve
completeness. Being the stage on which our social life is enacted, the POS fulfils
a magical role (Bauman, 2011), bestowing history, identity and connections on
the ever-changing performance of our social gatherings (Augè, 1999; Sassoli,
2008).
From an operational perspective, when we carried out our study of R1 it
was decided to categorise “space” as the places listed below:
Servitisation by distribution channel
Standardisation
Take-away
kiosk
POS
Table management
Vending machines POS without tables Personalisation
Table 4
Servitisation by product category
Standardisation F&B at the bar
draught-dispensed at the bar
Draught-dispensed
at the table
F&B to take away
F&B served at the table
Personalisation
Table 5
22
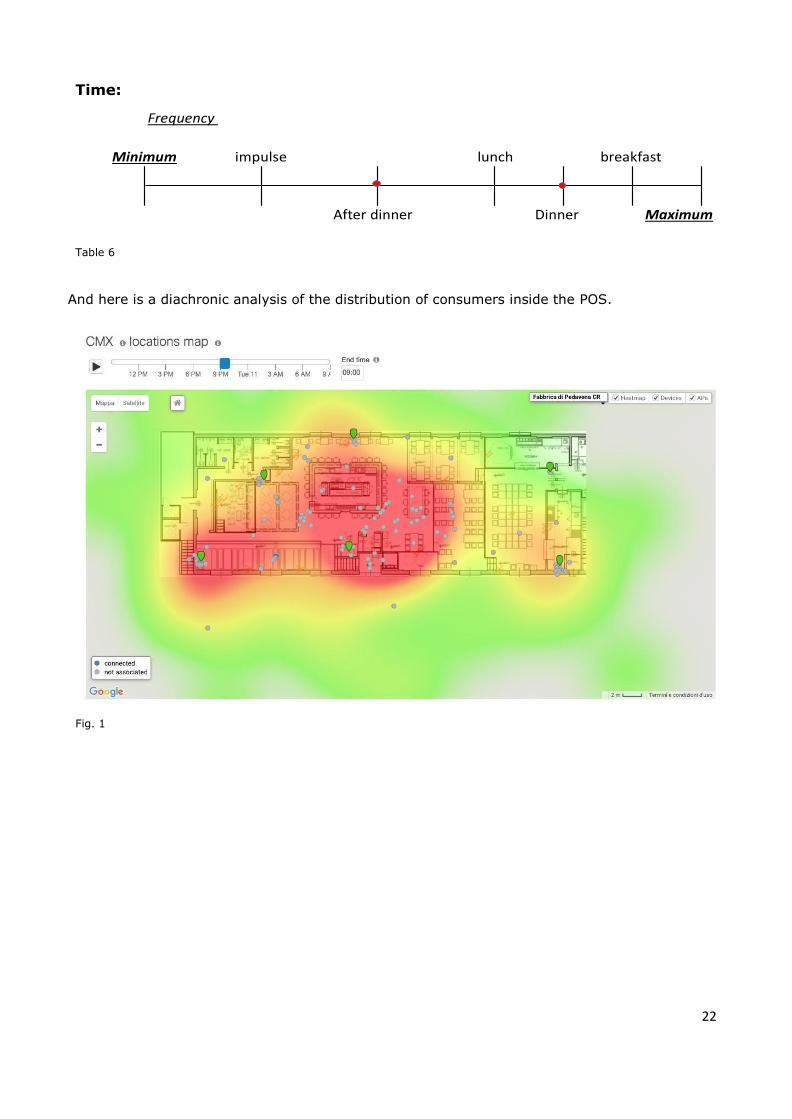
Time:
Frequency
Minimum impulse lunch breakfast
After dinner Dinner Maximum
Table 6
And here is a diachronic analysis of the distribution of consumers inside the POS.
Fig. 1
23
The driver of demand: "Who will I spend the evening with?"
If, at this stage, we refer to the definition given at the beginning and we put it in
the context of AfH consumption, we can conclude that CE is activated by the Situation,
emerges in the Context and is defined by the attitude of the Consumer. CE, therefore,
is strongly influenced by qualitative phenomena which have a pre-defined impact,
because they are in a reciprocal relationship with the experience of the Consumer. To
include this assumption in current social dynamics, however, means to undermine the
classical theories of demand segmentation. The post-modern tribalism context
(Maffesoli, 2004), in which the consumer operates and exists, prevents the attribution
of pre-conceived meaning to his or her own experience and consequently goes against
the idea of a segmentation based on a classification that, despite being multi-varied,
excludes experience. In this framework, with its socio-economic connotations, we
retrieve the difference between AfH consumption and Ah consumption: while in the
latter the same experience derives from the same quantitative data, in the former this
does not happen. AfH consumptions adhere to a new formulation of the principle of
uncertainty that goes more or less like this: it is impossible for us to understand the
quantitative data of the act of consumption or the experiences of the consumer at that
very moment; the same quantitative groups can describe different experiences and,
conversely, identical experiences can be described by different quantitative groups.
When you become aware of this particular feature of AfH consumption, you have to
recognise the impossibility of coming to a descriptive conclusion which does not take
account of experience and, consequently, to accept the need to move from a
metaphysic of the consumer to an anthropology of consumption.
The parameters used in R1 to define the variables of demand from an
operational perspective are based on the manner of consumption and the frequency of
demand. It seemed appropriate to subdivide the study into two large periods taking
into account POS location:
- T1 corresponds to the beginning of the holiday period / end of school year and
hot weather
- T2 corresponds to May, with temperatures on the rise and characterised by
regular consumers.
To facilitate the study, we decided to create a separate table for each period
24
of the week, comparing the data directly with the average of the observations. The
data is expressed in complementary index numbers to 100.
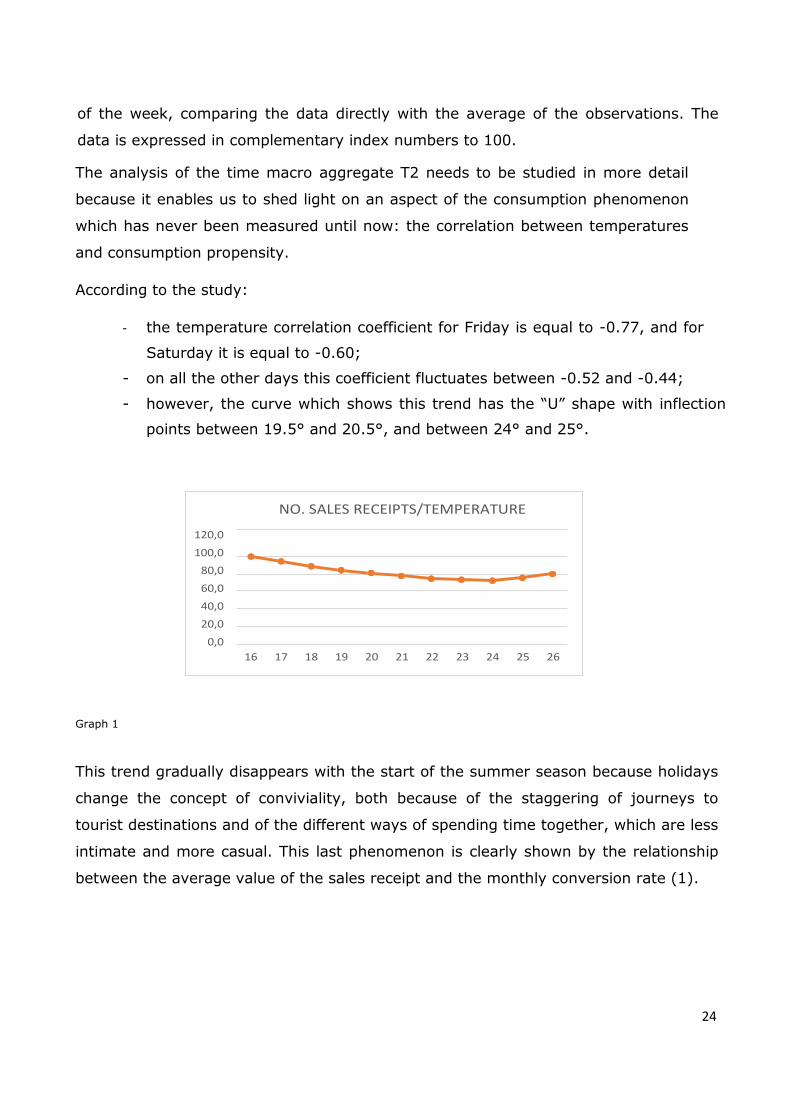
The analysis of the time macro aggregate T2 needs to be studied in more detail
because it enables us to shed light on an aspect of the consumption phenomenon
which has never been measured until now: the correlation between temperatures
and consumption propensity.
According to the study:
- the temperature correlation coefficient for Friday is equal to -0.77, and for
Saturday it is equal to -0.60;
- on all the other days this coefficient fluctuates between -0.52 and -0.44;
- however, the curve which shows this trend has the “U” shape with inflection
points between 19.5° and 20.5°, and between 24° and 25°.
Graph 1
This trend gradually disappears with the start of the summer season because holidays
change the concept of conviviality, both because of the staggering of journeys to
tourist destinations and of the different ways of spending time together, which are less
intimate and more casual. This last phenomenon is clearly shown by the relationship
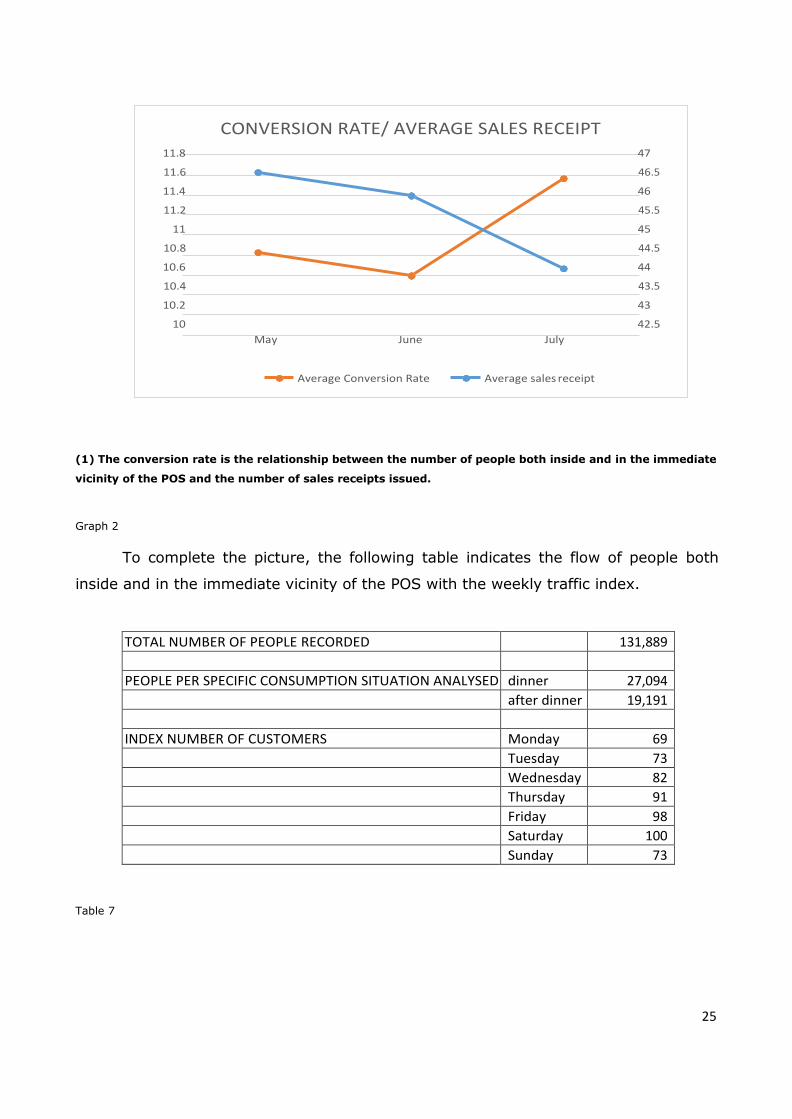
between the average value of the sales receipt and the monthly conversion rate (1).
NO. SALES RECEIPTS/TEMPERATURE
120,0
100,0
80,0
60,0
40,0
20,0
0,0
16 17 18 19 20 21 22 23 24 25 26
25
(1) The conversion rate is the relationship between the number of people both inside and in the immediate
vicinity of the POS and the number of sales receipts issued.
Graph 2
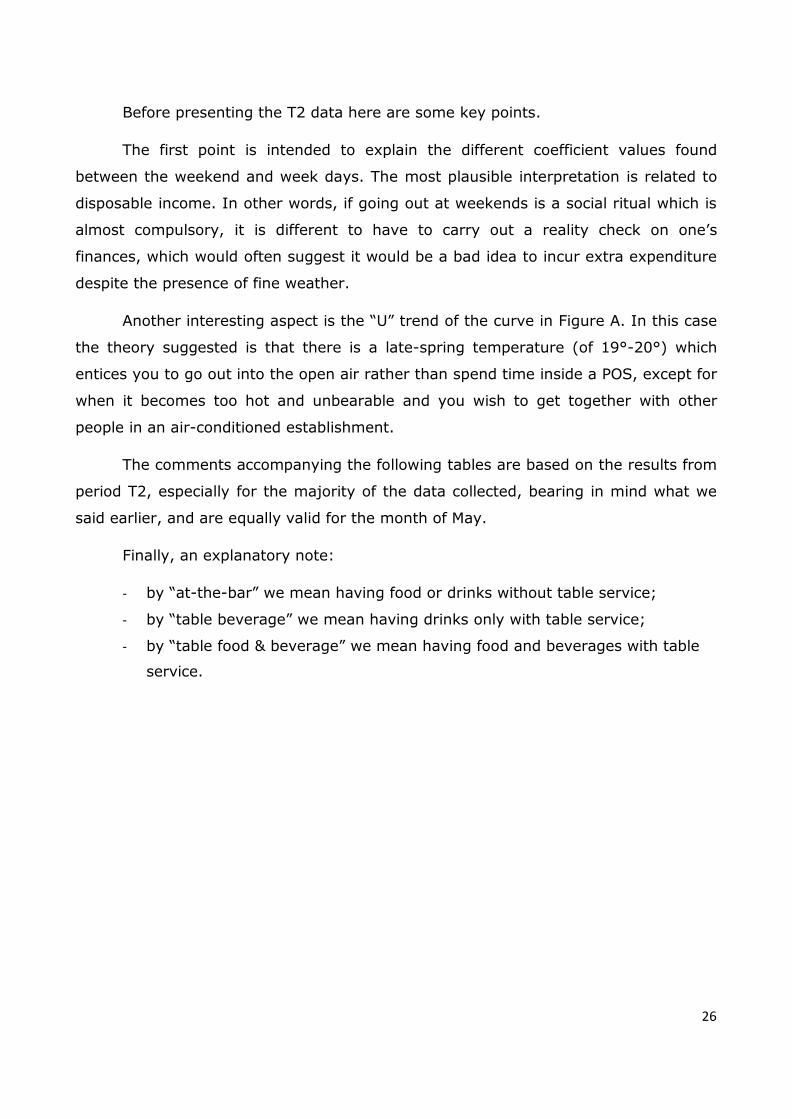
To complete the picture, the following table indicates the flow of people both
inside and in the immediate vicinity of the POS with the weekly traffic index.
TOTAL NUMBER OF PEOPLE RECORDED 131,889
PEOPLE PER SPECIFIC CONSUMPTION SITUATION ANALYSED dinner 27,094
after dinner 19,191
INDEX NUMBER OF CUSTOMERS Monday 69
Tuesday 73
Wednesday 82
Thursday 91
Friday 98
Saturday 100
Sunday 73
Table 7
CONVERSION RATE/ AVERAGE SALES RECEIPT 11.8 47
11.6 46.5
11.4 46
11.2 45.5
11 45
10.8 44.5
10.6 44
10.4 43.5
10.2 43
10 42.5
May June July
Average Conversion Rate Average sales receipt
26
Before presenting the T2 data here are some key points.
The first point is intended to explain the different coefficient values found
between the weekend and week days. The most plausible interpretation is related to
disposable income. In other words, if going out at weekends is a social ritual which is
almost compulsory, it is different to have to carry out a reality check on one’s
finances, which would often suggest it would be a bad idea to incur extra expenditure
despite the presence of fine weather.
Another interesting aspect is the “U” trend of the curve in Figure A. In this case
the theory suggested is that there is a late-spring temperature (of 19°-20°) which
entices you to go out into the open air rather than spend time inside a POS, except for
when it becomes too hot and unbearable and you wish to get together with other
people in an air-conditioned establishment.
The comments accompanying the following tables are based on the results from
period T2, especially for the majority of the data collected, bearing in mind what we
said earlier, and are equally valid for the month of May.
Finally, an explanatory note:
- by “at-the-bar” we mean having food or drinks without table service;
- by “table beverage” we mean having drinks only with table service;
- by “table food & beverage” we mean having food and beverages with table
service.
27
PERIOD P 1
WEEKLY
AVERAGE
CONSUMPTION
SITUATION
CONSUMPTION
METHOD
FREQUENCY
FREQUENCY
T2 T1
DINNER
At-the-bar
consumption
1.7
1.2
1.9
Table
Beverage
6.4
4.6
5.9
Table food &
beverage
91.9
94.2
92.2
total 100 100
AFTER DINNER
At-the-bar
consumption
5.4
1.2
5.9
Table
Beverage
19.7
4.6
18.8
Table food &
beverage
74.9
94.2
75.3
total 100 100
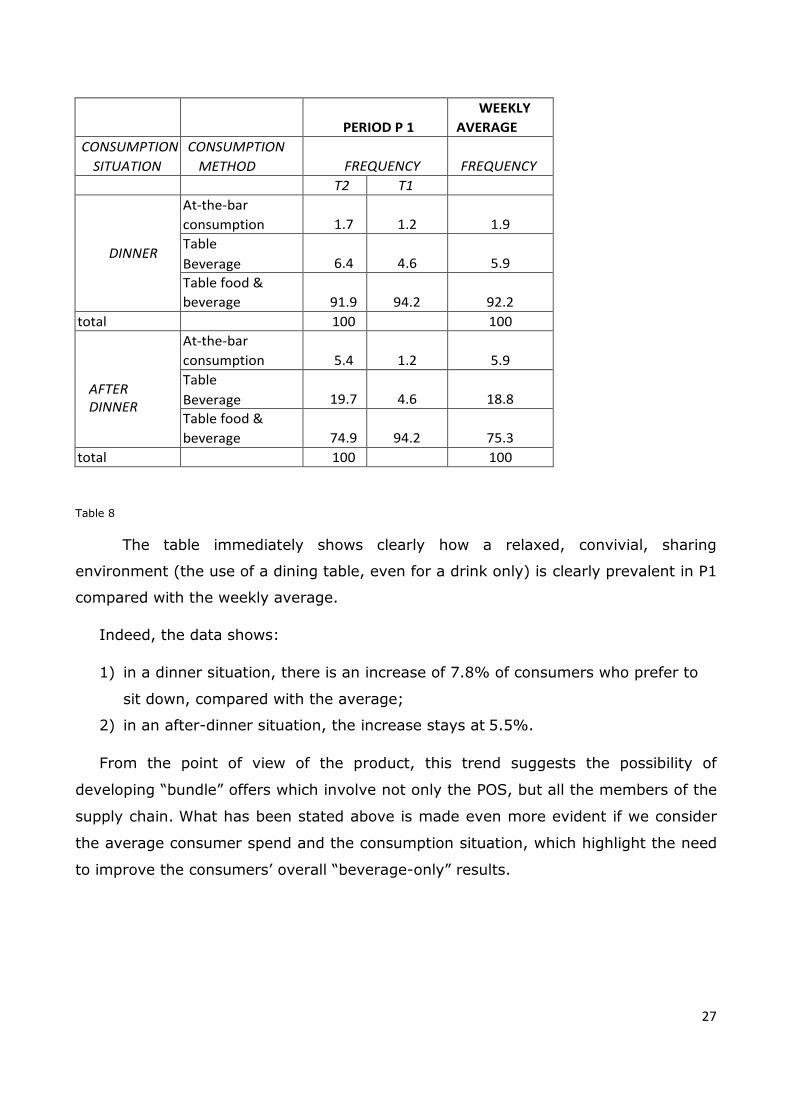
Table 8
The table immediately shows clearly how a relaxed, convivial, sharing
environment (the use of a dining table, even for a drink only) is clearly prevalent in P1
compared with the weekly average.
Indeed, the data shows:
1) in a dinner situation, there is an increase of 7.8% of consumers who prefer to
sit down, compared with the average;
2) in an after-dinner situation, the increase stays at 5.5%.
From the point of view of the product, this trend suggests the possibility of
developing “bundle” offers which involve not only the POS, but all the members of the
supply chain. What has been stated above is made even more evident if we consider
the average consumer spend and the consumption situation, which highlight the need
to improve the consumers’ overall “beverage-only” results.
28
PERIOD P 1
WEEKLY
AVERAGE
CONSUMPTION
SITUATION
CONSUMPTION
METHOD
AVERAGE CONSUMER
SPEND
T2 T1
DINNER
At-the-bar
consumption
10.1
12.6
9.1
Table
Beverage
over
9.3
15.8
8.2
Table Food &
beverage
17.6
18.4
17.7
AFTER DINNER
At-the-bar
consumption
7.6
8.4
6.7
Table
Beverage
cover
8.6
7.4
8.2
Table Food &
beverage
19.8
20.6
19.9
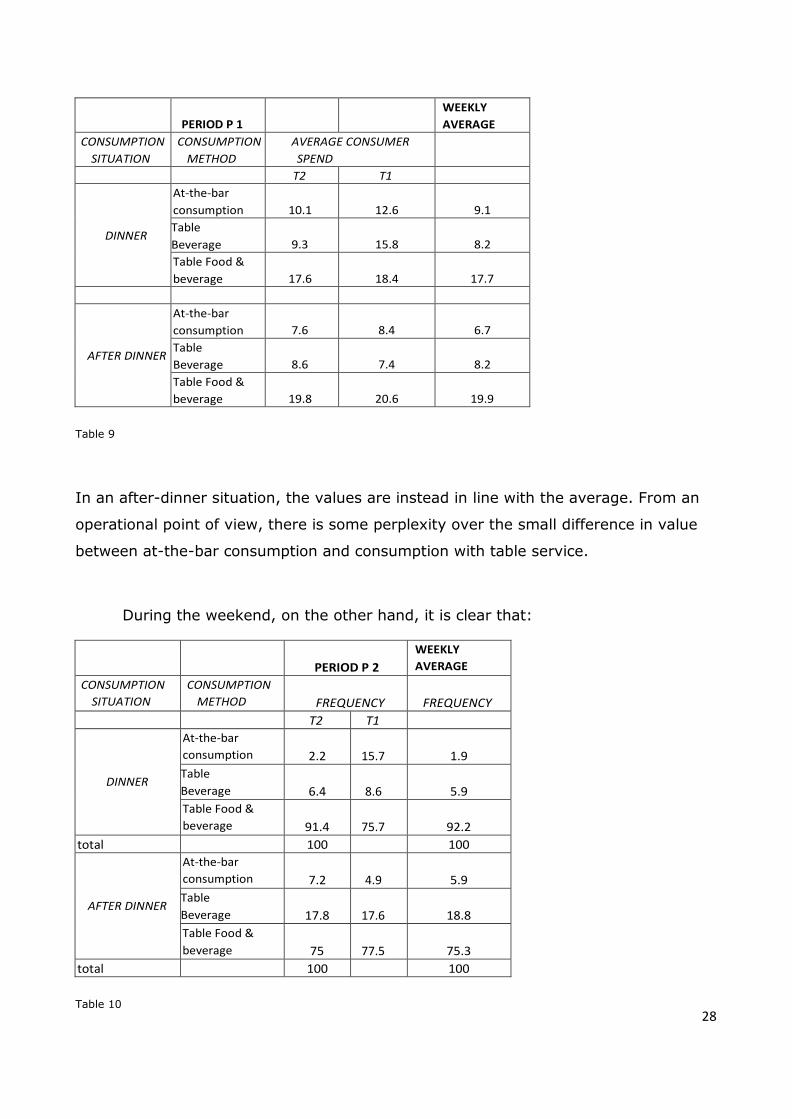
Table 9
In an after-dinner situation, the values are instead in line with the average. From an
operational point of view, there is some perplexity over the small difference in value
between at-the-bar consumption and consumption with table service.
During the weekend, on the other hand, it is clear that:
PERIOD P 2
WEEKLY
AVERAGE
CONSUMPTION
SITUATION
CONSUMPTION
METHOD
FREQUENCY
FREQUENCY
T2 T1
DINNER
At-the-bar
consumption
2.2
15.7
1.9
Table
Beverage
6.4
8.6
5.9
Table Food &
beverage
91.4
75.7
92.2
total 100 100
AFTER DINNER
At-the-bar
consumption
7.2
4.9
5.9
Table
Beverage
17.8
17.6
18.8
Table Food &
beverage
75
77.5
75.3
total 100 100
Table 10
29
The weekend is still the key time for informal conviviality with significant
increases in at-the-bar consumption in both contexts. The creation of offer “bundles”
for this type of consumption is also extremely important in this case.
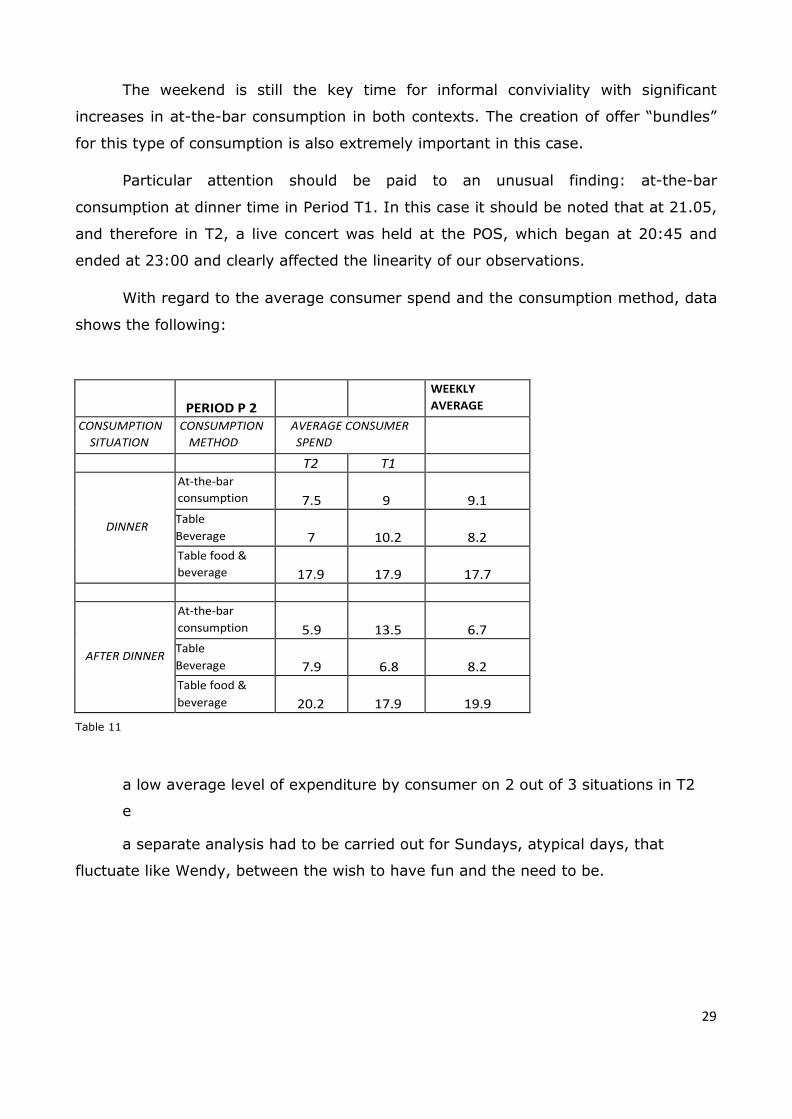
Particular attention should be paid to an unusual finding: at-the-bar
consumption at dinner time in Period T1. In this case it should be noted that at 21.05,
and therefore in T2, a live concert was held at the POS, which began at 20:45 and
ended at 23:00 and clearly affected the linearity of our observations.
With regard to the average consumer spend and the consumption method, data
shows the following:
PERIOD P 2
WEEKLY
AVERAGE
CONSUMPTION
SITUATION CONSUMPTION
METHOD AVERAGE CONSUMER
SPEND
T2 T1
DINNER
At-the-bar
consumption
7.5
9
9.1
Table
Beverage
7
10.2
8.2
Table food &
beverage
17.9
17.9
17.7
AFTER DINNER
At-the-bar
consumption
5.9
13.5
6.7
Table
Beverage
7.9
6.8
8.2
Table food &
beverage
20.2
17.9
19.9
Table 11
e
a low average level of expenditure by consumer on 2 out of 3 situations in T2
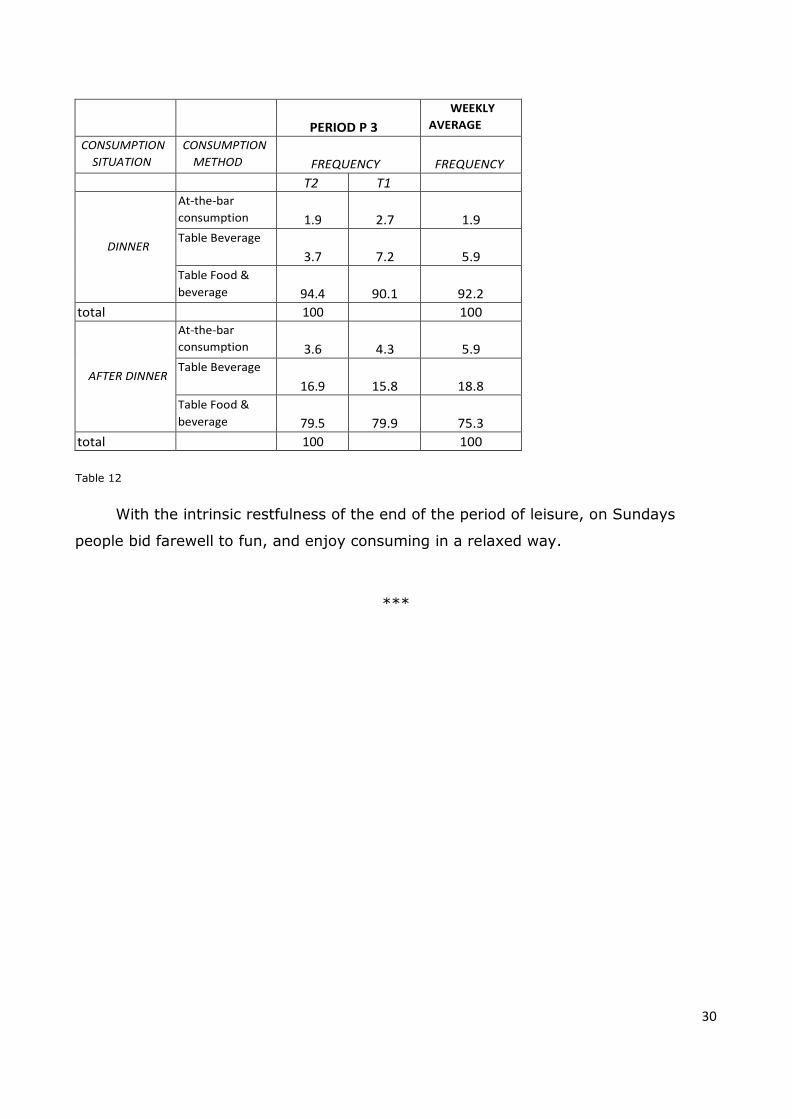
a separate analysis had to be carried out for Sundays, atypical days, that
fluctuate like Wendy, between the wish to have fun and the need to be.
30
PERIOD P 3
WEEKLY
AVERAGE
CONSUMPTION
SITUATION CONSUMPTION
METHOD
FREQUENCY
FREQUENCY
T2 T1
DINNER
At-the-bar
consumption
1.9
2.7
1.9 Table Beverage
3.7
7.2
5.9
Table Food &
beverage
94.4
90.1
92.2
total 100 100
AFTER DINNER
At-the-bar
consumption
3.6
4.3
5.9 Table Beverage
16.9
15.8
18.8
Table Food &
beverage
79.5
79.9
75.3
total 100 100
Table 12
With the intrinsic restfulness of the end of the period of leisure, on Sundays
people bid farewell to fun, and enjoy consuming in a relaxed way.
***
31
Section Two:
Demand targeting and supply segmentation
Demand targeting: from the metaphysics of the Consumer to the anthropology
of consumption
The shift from the study of the Consumer to the study of CE
The study of the parameters that define consumer behaviour has a long and
difficult history involving constant field testing. Then again, the entire social structure
lent itself to being grouped into phenotypes and to being described using subordinate
syntactic models. Consider that when we think of the last 40 years of the 20th Century
we associate each decade with Hippies, factory workers (operai), “Travoltini” (1970s
disco goers), “Paninari” (middle-class youngsters who embraced consumerism in the
1980s), Yuppies, Hedonists and Beatniks, to mention but a few. With the development
of communication networks and the rapid rise of phonations at the expense of
metaconstructions, society also broke down and became more conformist. However,
on the research front, rather than calling into question the main principles, we
preferred to adapt our methods instead. If the creation of phenotypes was initially an
inductive process, the last decade has seen a preference towards a deductive analysis
using the previous model as our starting point. If it is true that by using an inductive
approach we run the risk of ending up like the famous turkey, it is also true that a
deductive process has an intrinsic pre-determined synthetic root. In other words, the
real danger is of making genotypes created with DNA laboratory, unless we ask
ourselves why reality does not conform to the model that has been developed. This is
the metaphysics of the Consumer; the logical consequence of an analysis of social
dynamics, which, due to constantly simplifying its complexity, has over-structured its
modelling and has ended up losing its descriptive capacity. Faced with this aberration
the suggestion is that we should go back, in the AfH consumption analysis, to an
anthropology of consumption. It is only a question of accepting the new principle of
32
uncertainty mentioned above, by defining a method of empirical research, of inductive
inspiration, which allows us to infer consumer behaviour starting from the situations
related to the contexts. It is worth remembering that these contexts do not end with
the “bill”, but “what happens to customers after they leave the restaurant is also part
of their overall experience with the restaurant” (Miao, Mattila ibid.).
In this research endeavour it is important to observe how the new technological
platforms have contributed to redeveloping the way we interact with others and with
ourselves. In fact, the Web 3.0 does not mean “Surfing the internet with a smart
phone” all over the world, but it represents the new social and syntactic connection
between people. In this sense, the digital divide is an important factor in social
discrimination; it is not the recreational implications that are the focus of our studies,
but the marginalising effects of the inability to access information. If information
constitutes the new basis of social relationships, the consumption phenomenon, as a
social act, is obviously strongly affected by this. It is in this new context that we
should focus on the need to review the ways in which we analyse consumption
phenomena.
By adopting the scenarios of the Game Theory we can address the problem as
follows. Talking about “Consumer satisfaction” means to accept both the existence of
an information deficit to the detriment of the Consumer, and almost complete
information in favour of the strongest player, in this case the industry. Clearly, in this
situation, the game needs to be defined in dynamic terms, with sequential moves by
the players, and not in a cooperative way, because it is far more advantageous for
one side. However, the increase in information and the ability to access it immediately
have changed the rules. These days we need to accept a game that favours perfect
information, because the Consumer is more informed about the Environment and the
Industry, as well as a game, that, thanks to information being available
instantaneously, is leaning towards a stable description, because the players will aim
to synchronise their moves. In this situation the most convenient way to play is to
collaborate. In fact, in the presence of reduced information asymmetries and, to an
extent, organisational asymmetries, getting along well is a far more satisfying
strategy. Then again, incorrectly, the paradigm on which the sharing economy is based
is an example: injecting trust, which is the logical requirement of collaboration, into a
supply system, means to make goods, which would otherwise be underused,
accessible.
33
In light of the above, all we can do is conclude, and this takes courage, that there
is no specific Consumer for each type of product; there is no “Type of consumer for
xxxxx”, because we can all be that type in different contexts.
The innovative significance of this conclusion, which overturns our consolidated
vision of society and its related relationships, should be investigated with the tools at
our disposal today.
And, to conclude, we should remember that all of the above is valid for analysing
the Consumption process, but not, on the other hand, for determining corporate
Communication strategies that incorporate the purchase function that, as we know
only too well, follows different rules.
Supply segmentation: between flatus vocis and commercial necessity
And then we will be like the stars drinking whiskey at Roxy Bar
If Demand segmentation has lost its meaning, we need to review the
parameters of the analysis of Supply. In other words, skipping the Consumer-Product
link, we need to understand whether a Consumer-POS Type link can exist. In this case
too, we should use empirical analysis to find the answer.
The first phenomenon is the expansion of the supply system that has
characterised every POS in the last twenty years. If, indeed, until the end of the
1990s, it was still possible to differentiate, for example, POSs where you could have
lunch from others where you could not, since the beginning of the 21st century these
distinctions have started to fade. Nowadays, most HoReCa POSs offer breakfast,
lunch, dinner and often stay open “late into the evening”. This extension of potential
consumption situations has, on the one hand, weakened the horizontal differentiation
based on the Product and, on the other hand, forced POSs to extend the range of
services they offer because “…restaurants should not be entirely driven by revenue-
maximisation and should approach impulse buying from a broader social responsibility
perspective” (Miao, Mattila ibid.).
A second aspect concerns the separation of the Product from CE. It is a typical
HoReCa phenomenon, defined as “anonymisation of the product”, which has important
consequences:
- the first one relates to the Brand which, in HoReCa, is not the driver of the
34
experience, but, at the most, is its guarantor. This implies that the Product
takes on the role of experiential facilitator rather than consumption marketer;
- the second one is that the term “Product”, in this context, indicates a
manufactured item produced by the organisational structure of the POS,
commonly referred to as “manager”;
- the third one is that if we separate the experience from the product, the latter
ends up taking on a secondary role in the dynamic of consumption. Consider
that, for example, 51% of the pizzas we eat, despite the huge number of
combinations available to us, are reduced to two: margherita and spicy salami
(Doxa, 2014). Do not believe that the solution is found in improvised, health-
related options because “…Our results show that primary food motives are a
strong predictor of impulse buying of restaurant food. However, when affect-
regulation motive is activated in a particular consumption situation, primary
food motives are overridden by affect-regulation motive and individuals’
impulse buying behaviour is predominantly driven by the powerful motivation
to feel better” (Miao, Mattila ibid.).
One should not be surprised, at this point, that the POS is chosen in a
completely unplanned way (Donlon, 1998): once again the supply system is not the
main driver of the experience. Similarly, one should not be surprised that the word of
mouth between friends, not as influencer, is the basis of advice on which POS to
patronise (Oliver, 2012).
The conclusion, just as with the analysis of Demand, is that supply
segmentation has almost entirely lost its cognitive characteristics because of the
different types of POS.
It should be stressed that, also in this case, the conclusion refers exclusively to
the study of the Consumption process and it would not be appropriate to arbitrarily
broaden its sphere. In other words, if it is true that the CE of a top model or Billionaire
is identical to that of a group of friends meeting up after dinner in a bar of a provincial
town, we cannot deny that the products they consume will be completely different.
And the fact that these products are not the drivers of the process does not mean that
we can ignore them. Consequently, if it is true that segmentation by POS type does
not help us to understand the consumption process, it is also true that it plays a
fundamental role in determining commercial operations in the field.
35
Section Three:
Conclusions
The research study presented is different from all previous similar analyses
under three crucial aspects:
1) the database analysed consists of certified documents within an objective
framework;
2) the research study was conducted in a non-collaborative context;
3) the empirical analysis was used to support a theory which, based on the most
important studies on the topic of AfH consumption, reached counter-intuitive
and, at times, original conclusions.
At this stage, we are now in a position to draw some conclusions.
From the analysis of consumption processes emerged the need to identify the
new descriptive reference parameter in CE. However, having Customer Experience
as our starting point can bring unforeseen consequences:
a) Customer Experience is detached from the product, suppressed in
Servitisation, and deeply embedded in society as a shared experience and
belongs more to the relational aspect rather than to the economic aspect.
This shift has three main consequences:
traditional Demand segmentation has suddenly lost its voice,
unable to explain consumption phenomena;
Supply segmentation no longer serves any informative purpose, as
it has been rendered worthless by the social contextualisation of
Customer Experience;
the product has become an experiential layer, giving up its role of
driver of the experience.
36
The first set of considerations, and perhaps the most important one, refers to
Demand targeting. If, on the one hand, we demonstrated the loss of cognitive value in
traditional Consumer segmentation we cannot, on the other hand, accept losing the
possibility to develop an information system capable of offering some generalisations
regarding the data collected. What we call into question, in fact, is not the principle
which is submitted to segmentation, but the parameter which is the subject of our
analysis, the Consumer, and the method applied, which is extremely deductive. That
Consumption is a social process is certainly not new. The obvious consequence is that,
as Pierce says, the Consumer-Signal is ‘something which equals someone times
something divided by certain aspects or capacities'. As long as Society was described
in terms of stratified differentiation, therefore attributable to a series of approximate
hierarchical relationships, abstraction worked, but since the end of the 1990s society
has changed. As soon as the ways of spending time together started to favour
functional criteria as opposed to hierarchical criteria, the Consumer as synecdoche of
Consumption ceased to be representative, hence the need for a new knowledge
driver: Customer Experience, to be precise. For this reason, we must now ask
ourselves how we can define a research study method of CE which is both rigorous
and operationally applicable and that delivers useful results from a corporate point of
view. The proposal, detailed in part four below, is to view the AfH F&B consumption
expressed in various “consumption situations” in turn as “experiential connections”. To
simplify the above, the situation could be as follows:
Consumption situation:
o Dinner
Experiential connection:
Stag/Hen party
Work-related
Hanging out with friends
Women’s Day.
This framework has various important implications:
a. it shifts the emphasis away from functional characteristics, the dinner, to
experiential ones, for instance “with friends”. The important difference is
that the former have a price, while the latter have a value;
37
b. the servitisation proposal is aimed at satisfying experience and, therefore,
it is necessary to define some preliminary experiential paths. In this
process the Industry’s marketing departments should be engaged in a
series of innovative, fundamentally important BTL operations (e.g. the
creation of a brand hot spot, of guided experiential paths…);
c. the development of an experiential path is NOT the preserve of a single
member of the supply chain. Therefore, it is possible to develop a home-
grown commercial and marketing policy which is dedicated to HoReCa;
d. at this point, the Consumer, whoever he or she may be, only has to
specify the experience he or she wants to have, because that will
determine his or her levels of satisfaction.
The second set of considerations refers to Supply segmentation. Although
Supply segmentation has lost its capacity to inform consumption processes, it still
retains a strong position in purely commercial operations. In other words, if it is true
that the understanding of consumption phenomena no longer uses the subdivision of
POSs by type of supply system (Day, Night, Evening Bars et alia), mainly due to the
inherent expansion of supply offered by various Commercial Concerns, it is also true
that there are entire product categories whose ideal commercial outlet is identifiable
by means of specific types of key Supply. Therefore, our proposal is to improve Supply
segmentation but restricting its use to the sphere of commercial operations where
having “boots on the ground” is fundamental.
The third set of considerations refers to the Product and, consequently, to the
Brand. From the standpoint of the product, if it is true that it loses its role as driver of
consumption experience, because it cannot be separated from a combination of
tangible and intangible services, it retains this role in the act of purchasing. Otherwise
known as Brand vulgarisation, which we explained at the beginning, although almost
inconsequential as far as Customer Experience is concerned, it plays a vitally
important role from the point of view of sales. This means that the traditional
functions of ATL Marketing play the role of “external involvement in consumption
processes”, while the sales function becomes a key factor in the management of the
SKUs.
38
The fourth consideration, instead, refers to engagement processes. If the driver
of the Consumption process, in F&B AfH contexts, is the experience, then loyalty and
Customer engagement processes are a consequence of this. This conclusion, however,
forces us to review the function of Branded Apps and intangible processes of
Consumer engagement. For this reason, we should stress that 60% of Consumers
prefer to visit (35%), or to have direct telephone communication (25%) with the
retailers themselves, relegating the other forms of communication and relationships to
insignificant levels (15% SMS, 14% e-mail and only 8% in-app messages) (MEF,
2016). This data explains the difficulty of popularising and implementing Branded
Apps and other hi-tech ways of retaining customer loyalty. In other words, we can
argue that the role of Branded Apps, and similar things, is secondary to, and not
determined by, previous personal experience. Inverting this sequence has given the
practises of Consumer engagement a role which does not suit their purpose, which is
to consolidate an experience that a person has already had, and not to try to persuade
them to try something out, as happens all too often.
The last consideration is strictly operational: using a consumption situation, rather
than the individual POSs, as reference, and Customer Experience, rather than the
single SKUs, as the focus of our study, enables us to increase both the quantity of
data to be processed and the population sample, all of which favours transparency
and reduces costs. In the Italian context, generally speaking, a sample of 300 POSs
would be sufficient to describe and draw conclusions from the results of the Customer
Experience analysis for the various consumption situations.
The methodological approach proposed below which, in the context of this study,
represents an innovation, and expands the scope of the functional analysis to all the
stages of the supply chain. It improves and reshapes the relationship between, on the
one hand, Industry and Distribution, giving the latter the role of the supply hub and
the management of futures relating to consumption (brand voucher) and information
(consortium management of virtual market places) and, on the other hand, between
Distributor and POS, giving the former the task of listening to its customers’ pulses,
freeing itself from its obsession with cardboard boxes, and acknowledging the role of
the latter as Market nerve ending.
Finally, we need to determine who should be responsible for implementing this new
form of Market research; and who should facilitate these new information services.
Once again, the key player should be the Distributor, directly or through Category

39
aggregations. And once again, the challenge is not to finish in second place: either
you win, in which case all the Sector dynamics become the property of Distribution, or
you lose, and Distribution will continue “to exist because there is Industry”, to
paraphrase the definition of Beverage Distributor given by a Distribution business
woman.
***
40
Section Four:
A methodological approach to analysing the HoReCa Market
Leaving behind the negative side of the case, it is essential that we try to
propose some solutions. If, indeed, the Industry is intended to start developing an
original, authentic Distribution Channel policy for HoReCa, it should be provided with
the necessary cognitive tools.
The study model we propose is intended to be used by all the members of the
supply chain. Therefore, the total number of parameters to be analysed is modular
and depends on the phenomenon that is the subject of our analysis, on who carries
out the analysis, and on the purposes of the analysis. The research process consists of
a two-track analysis:
1) contextualised measurement of CE, which as such is useful to all the members
of the supply chain;
2) detailed economic, or simply cognitive analyses, that are relevant to one or
more specific commercial bodies. In other words, the total number of
parameters proposed and the methods employed to describe them can be used
by the manager of the POS to manage his/her supply system, by the Beverage
Distributor to assess its own market and by the Industry to draw attention to
new consumer trends.
Having written off both the efficacy of Demand segmentation, and the cognitive
capability of Supply subdivision means starting again from CE. At this stage we can
only determine the parameters that, by implication, allow us to measure consumption
experience as much as possible from a quantitative perspective.
Analysing Consumption by type of experience, from a methodological
perspective, means:
41
1) to identify precise consumption situations, for example:
a. Breakfast
b. Aperitif
c. Lunch
d. Impulse
e. Pre-dinner drink
f. Dinner after dinner
2) to segment consumption situations by type of experience, for example:
a. Work-related event,
b. Being with friends,
c. Stag/Hen party,
d. Free burp.
e. ………….
In this research study we did not attempt to identify the type of experience but
limited ourselves to analysing consumption situations. This was mainly due to the
need to verify the new research methods and the parameters that were becoming
apparent.
From an operational perspective, on the other hand, this means working with
significantly smaller data samples compared with traditional quantitative statistical
analysis. In the Italian context, for example, the sample could be limited to no more
than 300 POSs across the country, which has cost benefits.
By defining the boundaries of our study in this way, the advantages of involving
all the members of the HoReCa supply chain become obvious:
1) the Industry can intervene in Consumer experience through BTL marketing
initiatives in which the Brand is implicitly chosen according to the
servitisation;
2) the Distributor becomes a facilitating platform of information services;
3) the Manager “modifies” the appearance of his/her own business according to
experiential considerations, cheaply and in a way that can be easily
changed, rather than making logistical or architectural changes at an
unacceptable cost.
42
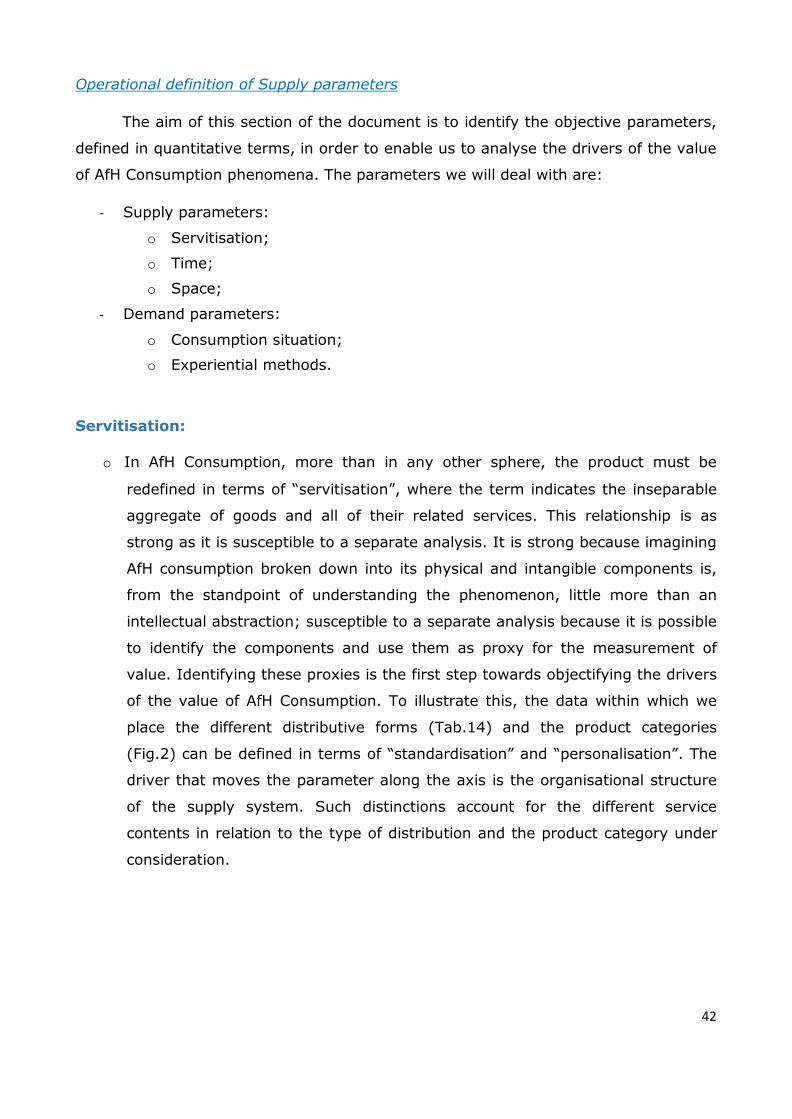
Operational definition of Supply parameters
The aim of this section of the document is to identify the objective parameters,
defined in quantitative terms, in order to enable us to analyse the drivers of the value
of AfH Consumption phenomena. The parameters we will deal with are:
- Supply parameters:
o Servitisation;
o Time;
o Space;
- Demand parameters:
o Consumption situation;
o Experiential methods.
Servitisation:
o In AfH Consumption, more than in any other sphere, the product must be
redefined in terms of “servitisation”, where the term indicates the inseparable
aggregate of goods and all of their related services. This relationship is as
strong as it is susceptible to a separate analysis. It is strong because imagining
AfH consumption broken down into its physical and intangible components is,
from the standpoint of understanding the phenomenon, little more than an
intellectual abstraction; susceptible to a separate analysis because it is possible
to identify the components and use them as proxy for the measurement of
value. Identifying these proxies is the first step towards objectifying the drivers
of the value of AfH Consumption. To illustrate this, the data within which we
place the different distributive forms (Tab.14) and the product categories
(Fig.2) can be defined in terms of “standardisation” and “personalisation”. The
driver that moves the parameter along the axis is the organisational structure
of the supply system. Such distinctions account for the different service
contents in relation to the type of distribution and the product category under
consideration.
43
Standardisation
Take-away
kiosk
POS, table service
Vending
machines
POS
No table service Personalisation
Servitisation by type of distribution
Table 14
Standardisation F&B
At the bar
Draught-dispensed at the bar
Draught-dispensed
Served at the table
F&B To take away
Lcc At the table
Personalisation
Servitisation by product category
Table 15
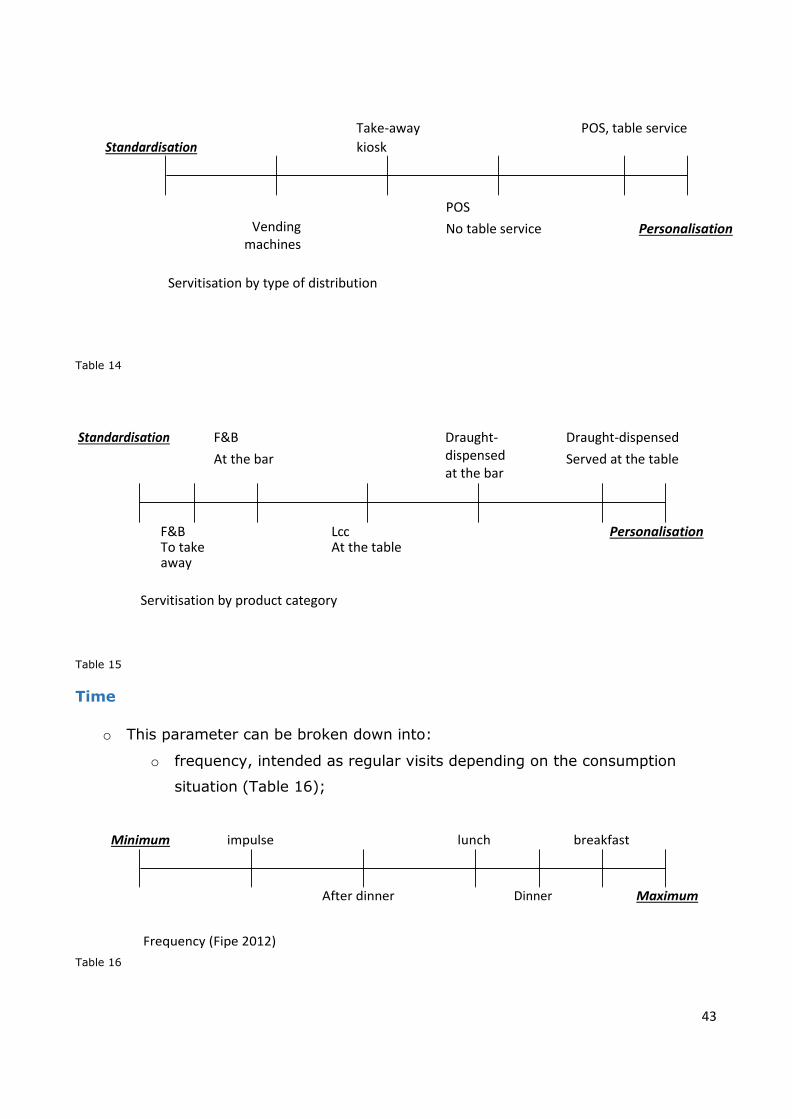
Time
o This parameter can be broken down into:
o frequency, intended as regular visits depending on the consumption
situation (Table 16);
Minimum impulse lunch breakfast
After dinner
Frequency (Fipe 2012)
Table 16
Dinner Maximum
44
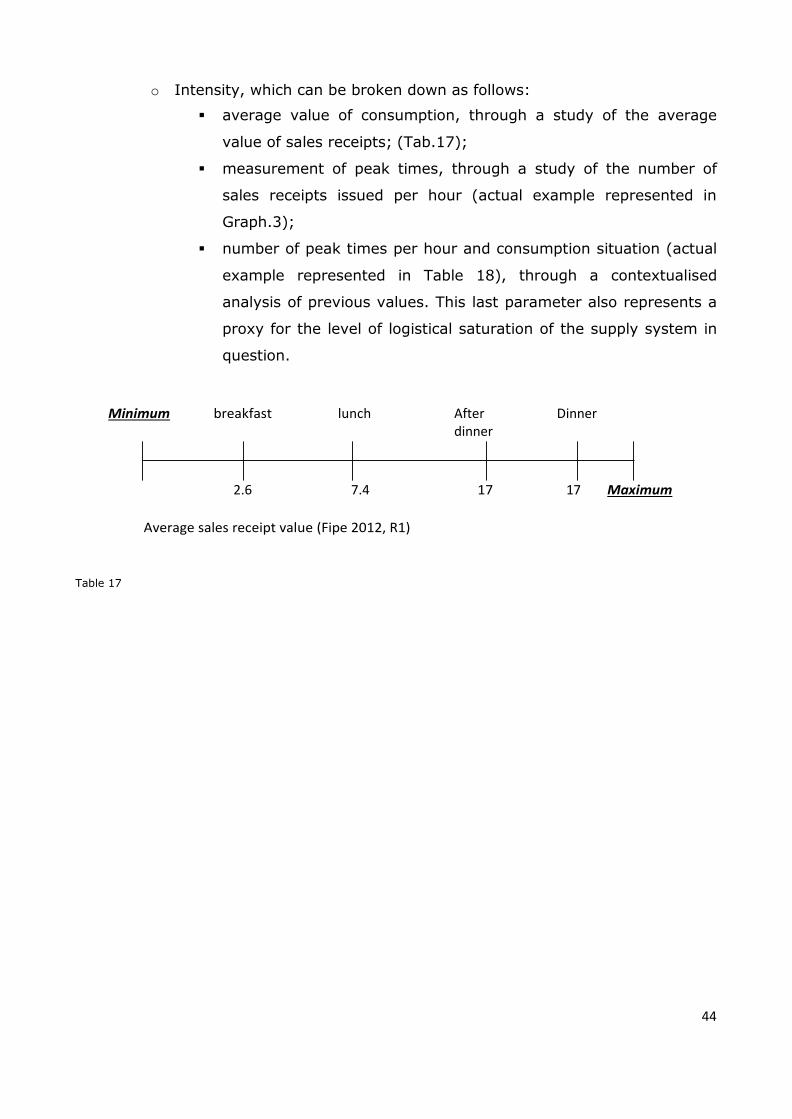
o Intensity, which can be broken down as follows:
average value of consumption, through a study of the average
value of sales receipts; (Tab.17);
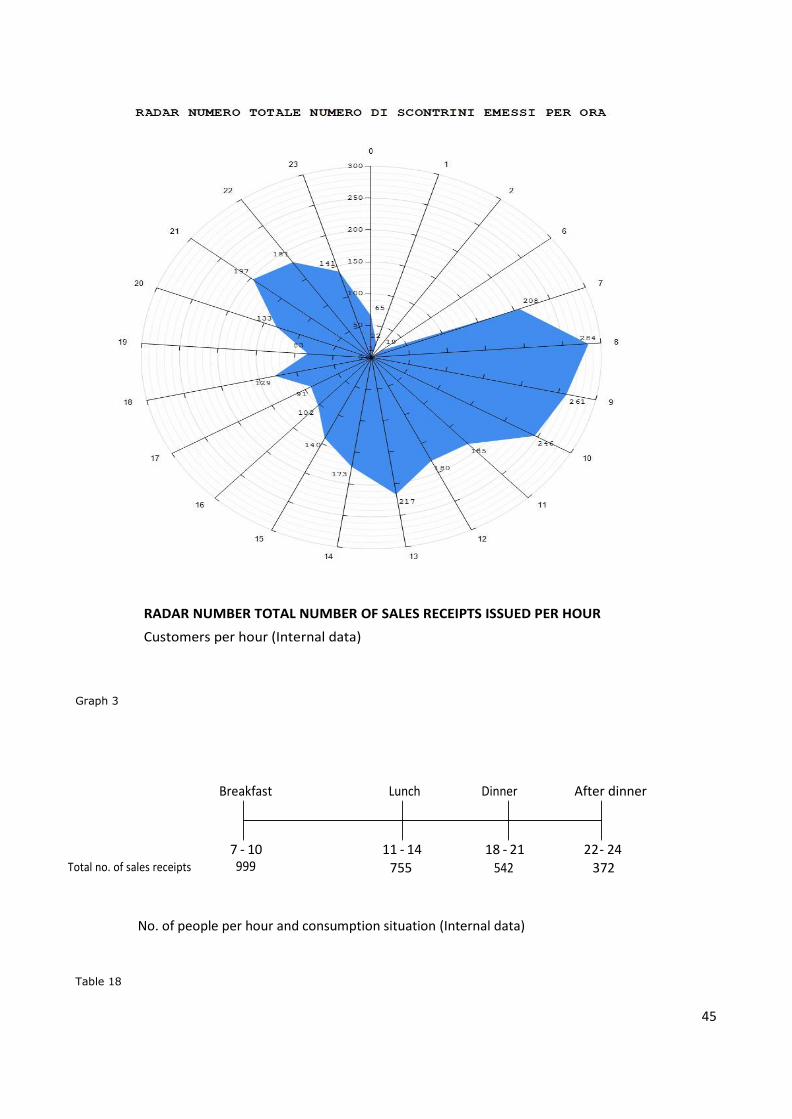
measurement of peak times, through a study of the number of
sales receipts issued per hour (actual example represented in
Graph.3);
number of peak times per hour and consumption situation (actual
example represented in Table 18), through a contextualised
analysis of previous values. This last parameter also represents a
proxy for the level of logistical saturation of the supply system in
question.
Minimum breakfast lunch
After dinner
Dinner
2.6 7.4 17 17 Maximum
Average sales receipt value (Fipe 2012, R1)
Table 17
45
RADAR NUMBER TOTAL NUMBER OF SALES RECEIPTS ISSUED PER HOUR
Customers per hour (Internal data)
Graph 3
Breakfast Lunch Dinner After dinner
7 - 10 11 - 14 18 - 21 22 - 24
Total no. of sales receipts 999 755 542 372
No. of people per hour and consumption situation (Internal data)
Table 18
46
This analysis allows us:
to objectify some proxies for evaluating the importance of the
consumption contexts;
to measure and define concrete opportunities to manage the peak times
and visits to the POSs. Indeed, considering the products and the
techniques used to deliver the service deduced from sales receipts, and
the analysis of standard delivery peak times, it is possible to determine
the workload that is effectively achievable by the organisation in any
given period of time.
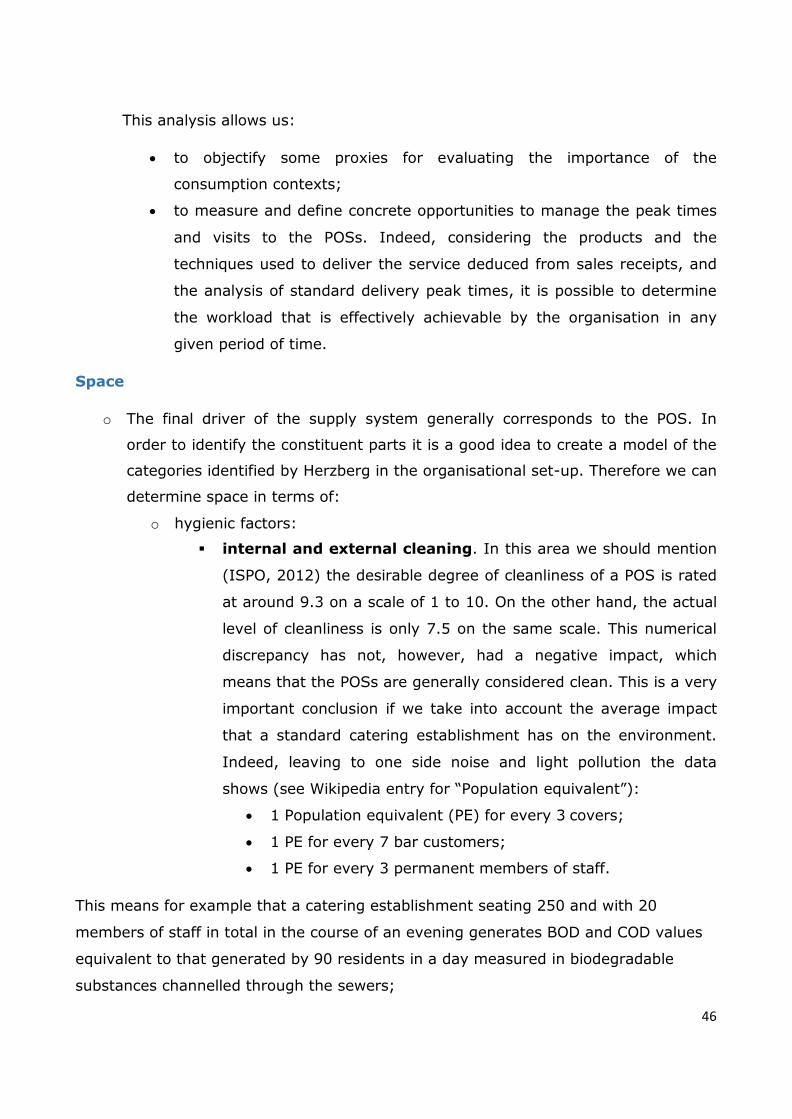
Space
o The final driver of the supply system generally corresponds to the POS. In
order to identify the constituent parts it is a good idea to create a model of the
categories identified by Herzberg in the organisational set-up. Therefore we can
determine space in terms of:
o hygienic factors:
internal and external cleaning. In this area we should mention
(ISPO, 2012) the desirable degree of cleanliness of a POS is rated
at around 9.3 on a scale of 1 to 10. On the other hand, the actual
level of cleanliness is only 7.5 on the same scale. This numerical
discrepancy has not, however, had a negative impact, which
means that the POSs are generally considered clean. This is a very
important conclusion if we take into account the average impact
that a standard catering establishment has on the environment.
Indeed, leaving to one side noise and light pollution the data
shows (see Wikipedia entry for “Population equivalent”):
1 Population equivalent (PE) for every 3 covers;
1 PE for every 7 bar customers;
1 PE for every 3 permanent members of staff.
This means for example that a catering establishment seating 250 and with 20
members of staff in total in the course of an evening generates BOD and COD values
equivalent to that generated by 90 residents in a day measured in biodegradable
substances channelled through the sewers;
47
food and beverage preparation time. In this case the
evidence is inevitably approximate because it refers to a
standard POS. Essentially, we can quantify it as follows:
o Cocktail preparation: 2’. In this case we extrapolate the
data from the AIBES tables which estimate a maximum
time of 4’ for the preparation of a cocktail with 7
ingredients;
o Dispensing a beer: 1’30” for an average beer served
presentably (field study);
o Dispensing a soft drink: 1’ (field study);
o Table service: from 1’30” to 2’ based on the number of
waiters and the layout of the establishment (field study).
This parameter is also a proxy for measuring the level of
service;
o Order placement time: from 1’30” to 2’ (field study);
o Pizza preparation time: 3’ for the preparation itself and 3’
for cooking (field study);
o Hot dish preparation time: 3’ for the preparation and 6’
for cooking (field study);
o Sandwich preparation time: 1’30” (field study).
The precise definition of these drivers enables us to attribute the precise value to
the complete range of services which constitutes the intangible aspect of servitisation.
o Motivating factors:
the politeness of the staff;
the attractiveness of the environment;
the sensory appeal;
retail-tainment and other events.
All these drivers are gathered from proxies from studying the internet using
specialist analytical tools (Trip Advisor, et alia).
48
Operational definition of Demand parameters
In this case we decided to study consumption habits and behaviours without becoming
intrusive. In a Market that produces 45,000 Apps a month, it becomes very difficult to
engage in any kind of direct dialogue with the Consumer. Therefore, we have to
pursue different strategies because in AfH consumption the aim is to “spend time
together”, not to search the internet. We should consider the following measurable
parameters:
o a direct ratio of customers to passers-by (single POS) or an indirect ratio
(comparison between different POSs) can be used to assess the value of the
establishment;
o how much time you spend outside the establishment in order to form an
impression of what the place is like;
o the length of the queue at the cash desk;
o the time difference between bar service and table service and the
corresponding price difference in order to decide which type of service is most
appropriate;
o correspondence between the number of customers, the value of sales receipts,
and products purchased in order to assess the number of staff needed and the
level of servitisation;
o analysis of internet use during the period of consumption to understand what
the consumer is thinking while he or she is inside the POS;
o analysis of internet use during special events;
o analysis of sales receipts during different weather conditions and social events;
o Video Analytics in order to assess different customers and to evaluate their
experiences;
o an analysis, Fig. 1 and Fig. 2, of the timing of consumer visits and where they
sit in the POS.
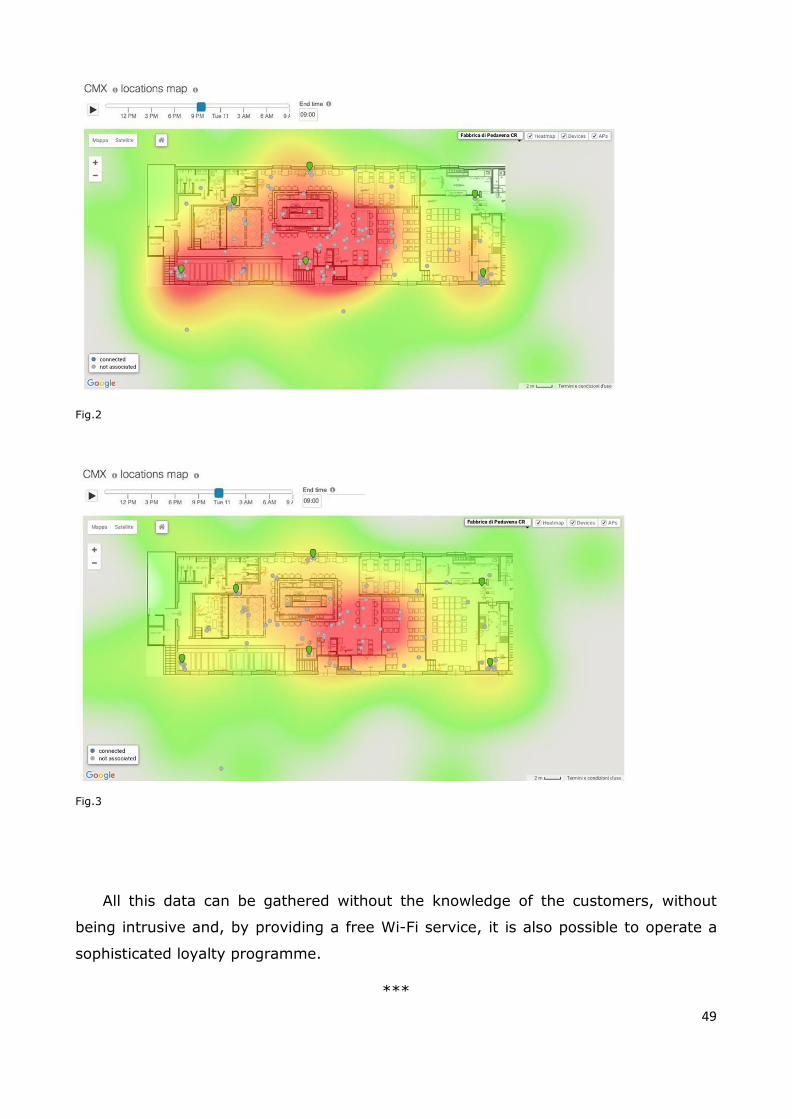
49
Fig.2
Fig.3
All this data can be gathered without the knowledge of the customers, without
being intrusive and, by providing a free Wi-Fi service, it is also possible to operate a
sophisticated loyalty programme.
***
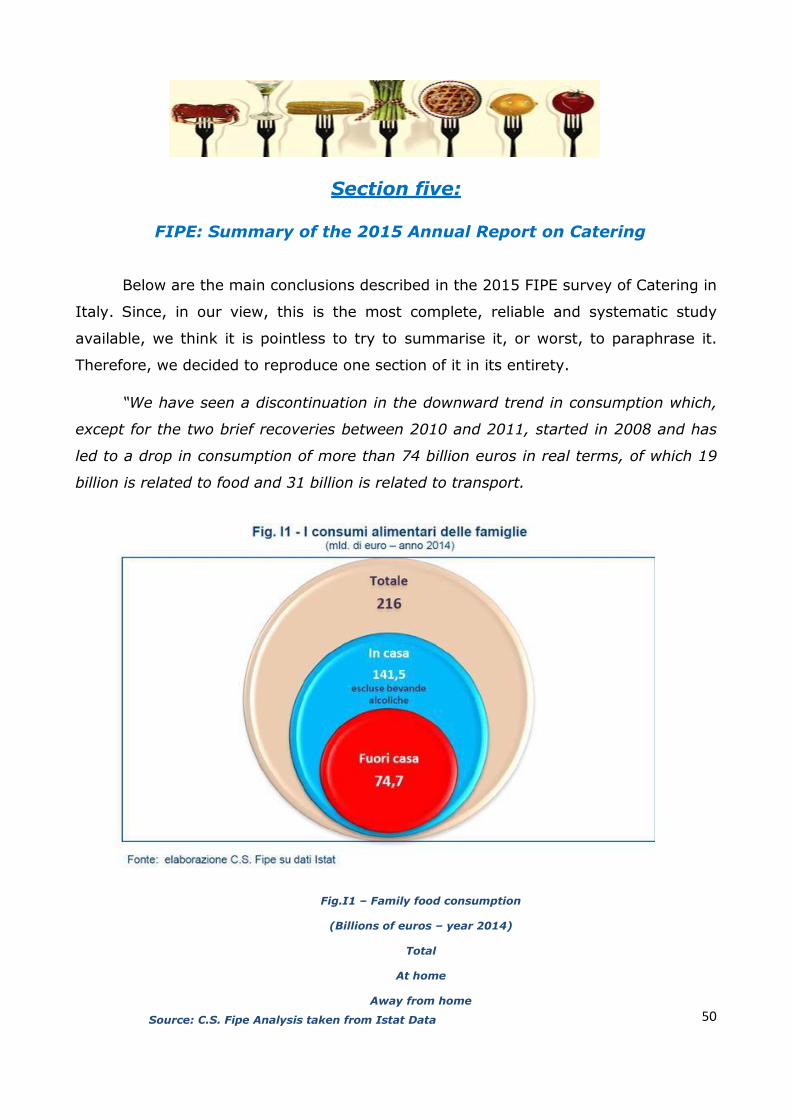
50
Section five:
FIPE: Summary of the 2015 Annual Report on Catering
Below are the main conclusions described in the 2015 FIPE survey of Catering in
Italy. Since, in our view, this is the most complete, reliable and systematic study
available, we think it is pointless to try to summarise it, or worst, to paraphrase it.
Therefore, we decided to reproduce one section of it in its entirety.
“We have seen a discontinuation in the downward trend in consumption which,
except for the two brief recoveries between 2010 and 2011, started in 2008 and has
led to a drop in consumption of more than 74 billion euros in real terms, of which 19
billion is related to food and 31 billion is related to transport.
Fig.I1 – Family food consumption
(Billions of euros – year 2014)
Total
At home
Away from home
Source: C.S. Fipe Analysis taken from Istat Data
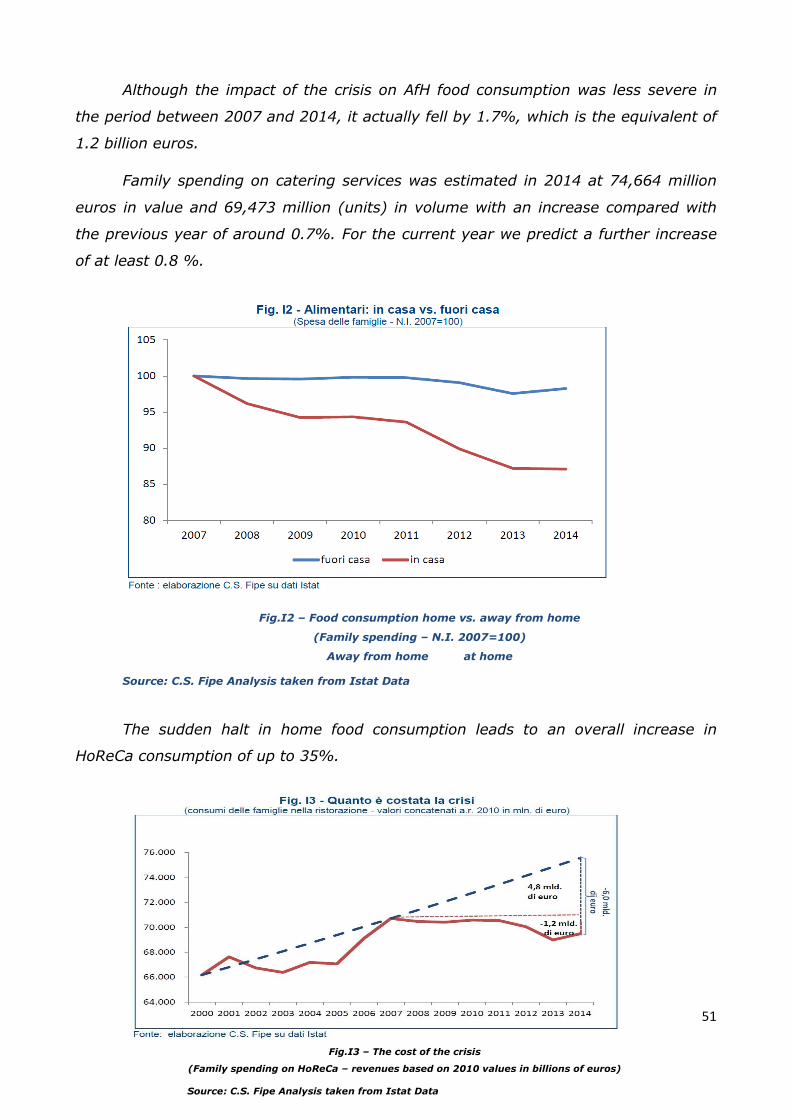
51
Although the impact of the crisis on AfH food consumption was less severe in
the period between 2007 and 2014, it actually fell by 1.7%, which is the equivalent of
1.2 billion euros.
Family spending on catering services was estimated in 2014 at 74,664 million
euros in value and 69,473 million (units) in volume with an increase compared with
the previous year of around 0.7%. For the current year we predict a further increase
of at least 0.8 %.
Fig.I2 – Food consumption home vs. away from home
(Family spending – N.I. 2007=100)
Away from home at home
Source: C.S. Fipe Analysis taken from Istat Data
The sudden halt in home food consumption leads to an overall increase in
HoReCa consumption of up to 35%.
Fig.I3 – The cost of the crisis
(Family spending on HoReCa – revenues based on 2010 values in billions of euros)
Source: C.S. Fipe Analysis taken from Istat Data
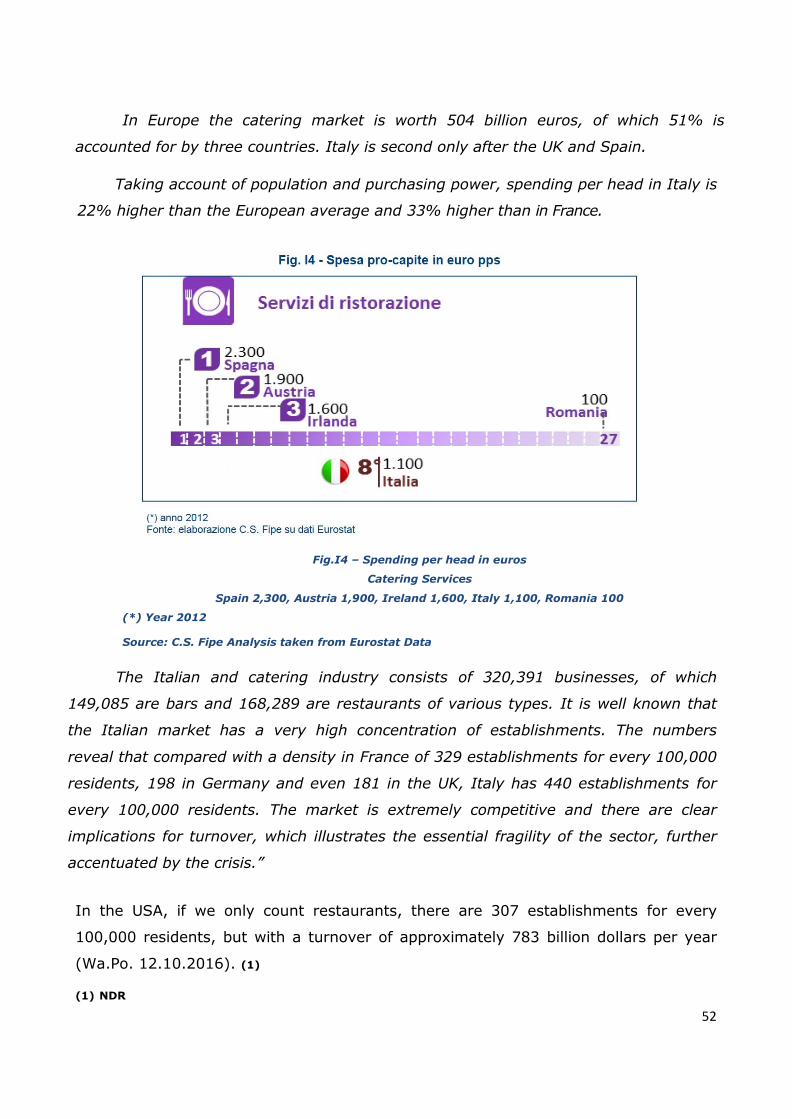
52
In Europe the catering market is worth 504 billion euros, of which 51% is
accounted for by three countries. Italy is second only after the UK and Spain.
Taking account of population and purchasing power, spending per head in Italy is
22% higher than the European average and 33% higher than in France.
Fig.I4 – Spending per head in euros
Catering Services
Spain 2,300, Austria 1,900, Ireland 1,600, Italy 1,100, Romania 100
(*) Year 2012
Source: C.S. Fipe Analysis taken from Eurostat Data
The Italian and catering industry consists of 320,391 businesses, of which
149,085 are bars and 168,289 are restaurants of various types. It is well known that
the Italian market has a very high concentration of establishments. The numbers
reveal that compared with a density in France of 329 establishments for every 100,000
residents, 198 in Germany and even 181 in the UK, Italy has 440 establishments for
every 100,000 residents. The market is extremely competitive and there are clear
implications for turnover, which illustrates the essential fragility of the sector, further
accentuated by the crisis.”
In the USA, if we only count restaurants, there are 307 establishments for every
100,000 residents, but with a turnover of approximately 783 billion dollars per year
(Wa.Po. 12.10.2016). (1)
(1) NDR
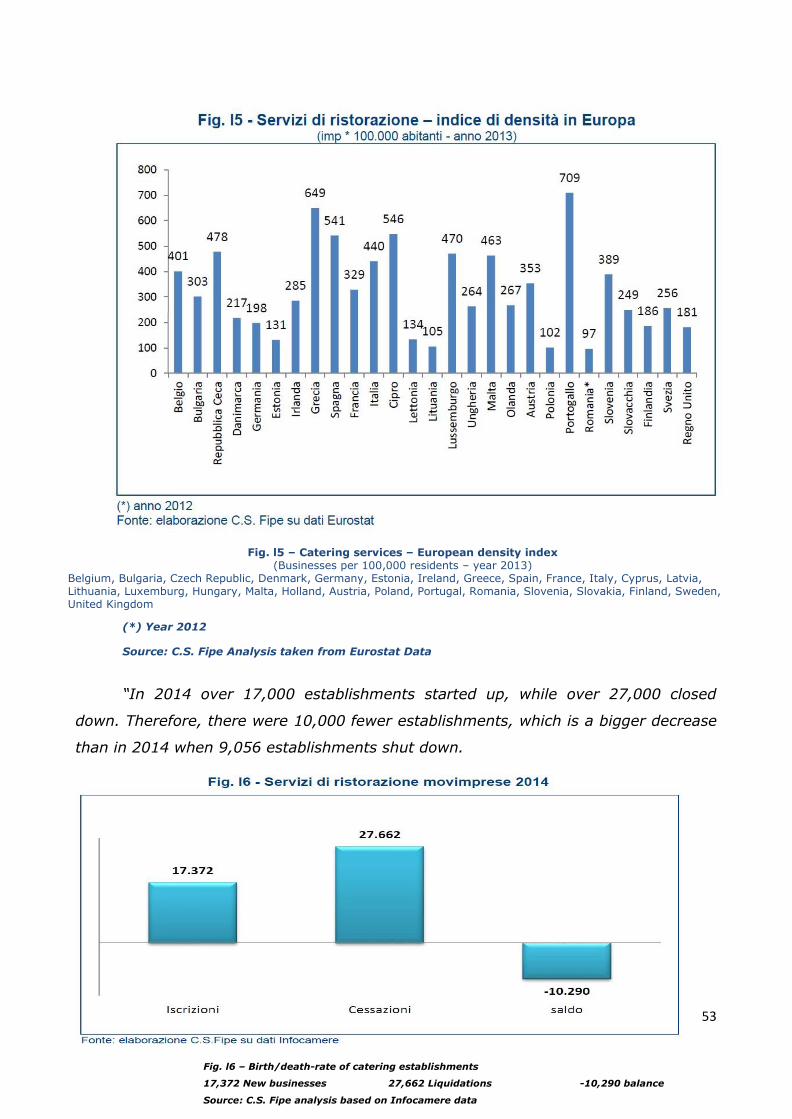
53
Fig. l5 – Catering services – European density index (Businesses per 100,000 residents – year 2013)
Belgium, Bulgaria, Czech Republic, Denmark, Germany, Estonia, Ireland, Greece, Spain, France, Italy, Cyprus, Latvia, Lithuania, Luxemburg, Hungary, Malta, Holland, Austria, Poland, Portugal, Romania, Slovenia, Slovakia, Finland, Sweden, United Kingdom
(*) Year 2012
Source: C.S. Fipe Analysis taken from Eurostat Data
“In 2014 over 17,000 establishments started up, while over 27,000 closed
down. Therefore, there were 10,000 fewer establishments, which is a bigger decrease
than in 2014 when 9,056 establishments shut down.
Fig. l6 – Birth/death-rate of catering establishments
17,372 New businesses 27,662 Liquidations -10,290 balance
Source: C.S. Fipe analysis based on Infocamere data
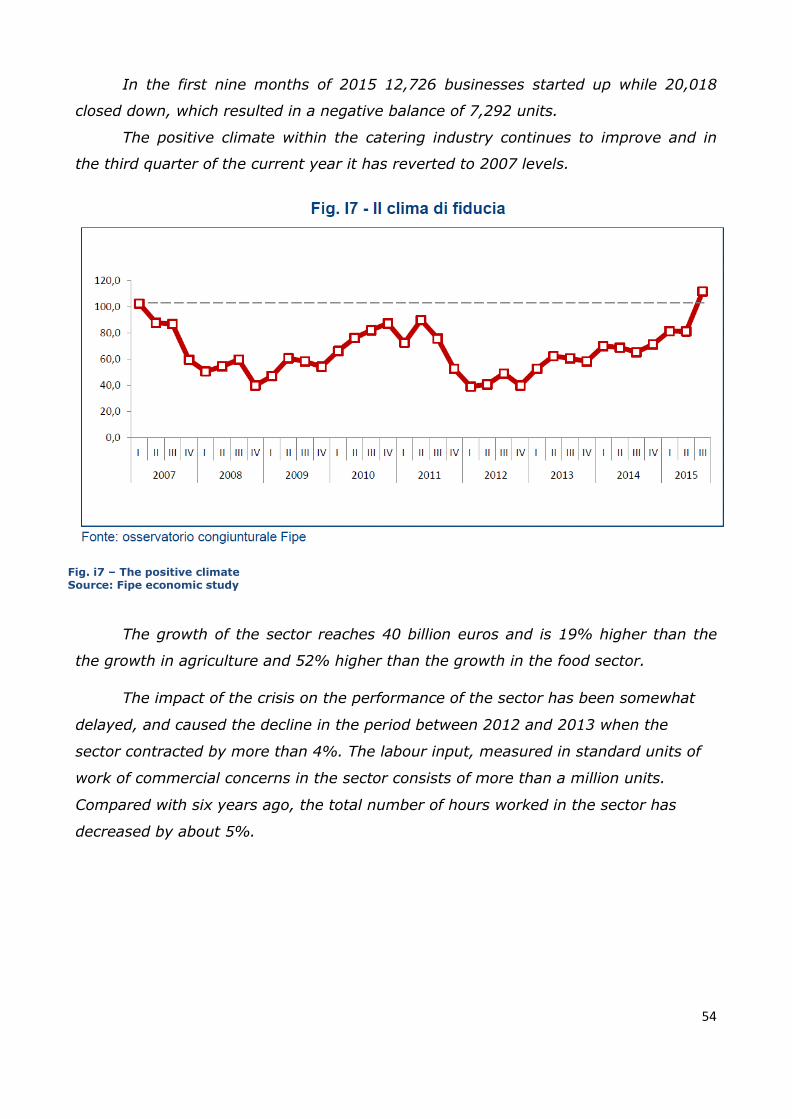
54
In the first nine months of 2015 12,726 businesses started up while 20,018
closed down, which resulted in a negative balance of 7,292 units.
The positive climate within the catering industry continues to improve and in
the third quarter of the current year it has reverted to 2007 levels.
Fig. i7 – The positive climate Source: Fipe economic study
The growth of the sector reaches 40 billion euros and is 19% higher than the
the growth in agriculture and 52% higher than the growth in the food sector.
The impact of the crisis on the performance of the sector has been somewhat
delayed, and caused the decline in the period between 2012 and 2013 when the
sector contracted by more than 4%. The labour input, measured in standard units of
work of commercial concerns in the sector consists of more than a million units.
Compared with six years ago, the total number of hours worked in the sector has
decreased by about 5%.
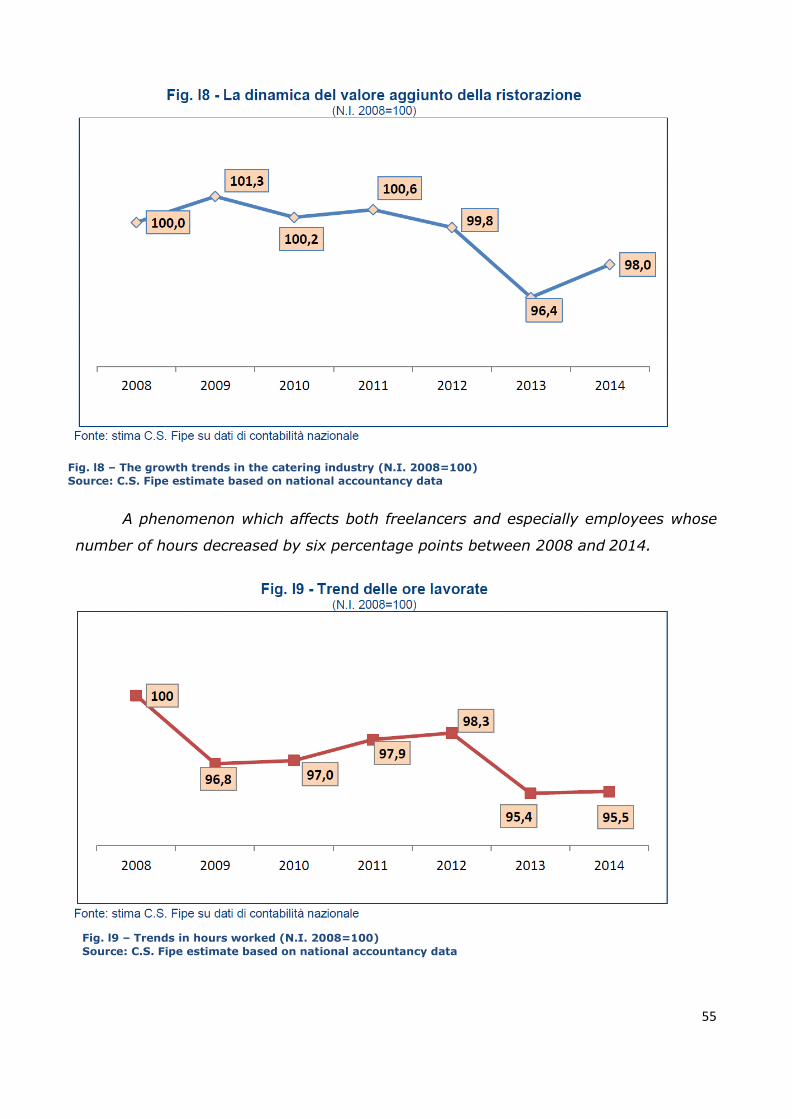
55
Fig. l8 – The growth trends in the catering industry (N.I. 2008=100)
Source: C.S. Fipe estimate based on national accountancy data
A phenomenon which affects both freelancers and especially employees whose
number of hours decreased by six percentage points between 2008 and 2014.
Fig. l9 – Trends in hours worked (N.I. 2008=100)
Source: C.S. Fipe estimate based on national accountancy data
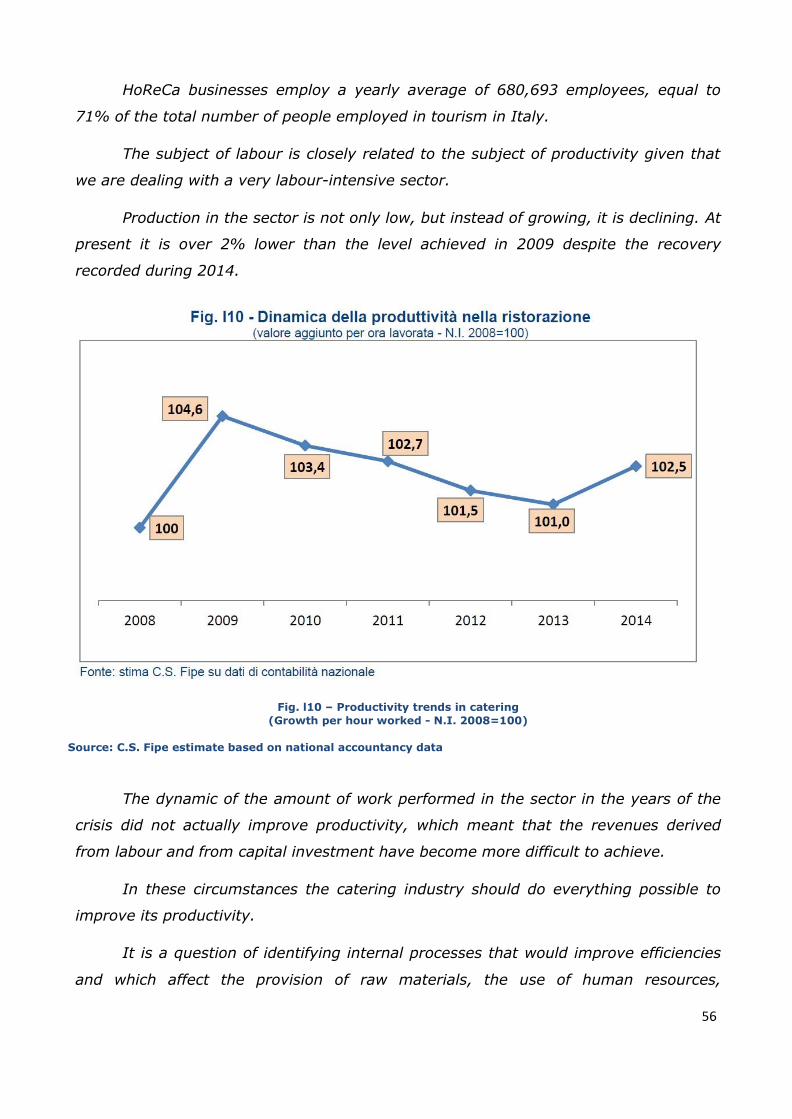
56
HoReCa businesses employ a yearly average of 680,693 employees, equal to
71% of the total number of people employed in tourism in Italy.
The subject of labour is closely related to the subject of productivity given that
we are dealing with a very labour-intensive sector.
Production in the sector is not only low, but instead of growing, it is declining. At
present it is over 2% lower than the level achieved in 2009 despite the recovery
recorded during 2014.
Fig. l10 – Productivity trends in catering
(Growth per hour worked - N.I. 2008=100)
Source: C.S. Fipe estimate based on national accountancy data
The dynamic of the amount of work performed in the sector in the years of the
crisis did not actually improve productivity, which meant that the revenues derived
from labour and from capital investment have become more difficult to achieve.
In these circumstances the catering industry should do everything possible to
improve its productivity.
It is a question of identifying internal processes that would improve efficiencies
and which affect the provision of raw materials, the use of human resources,
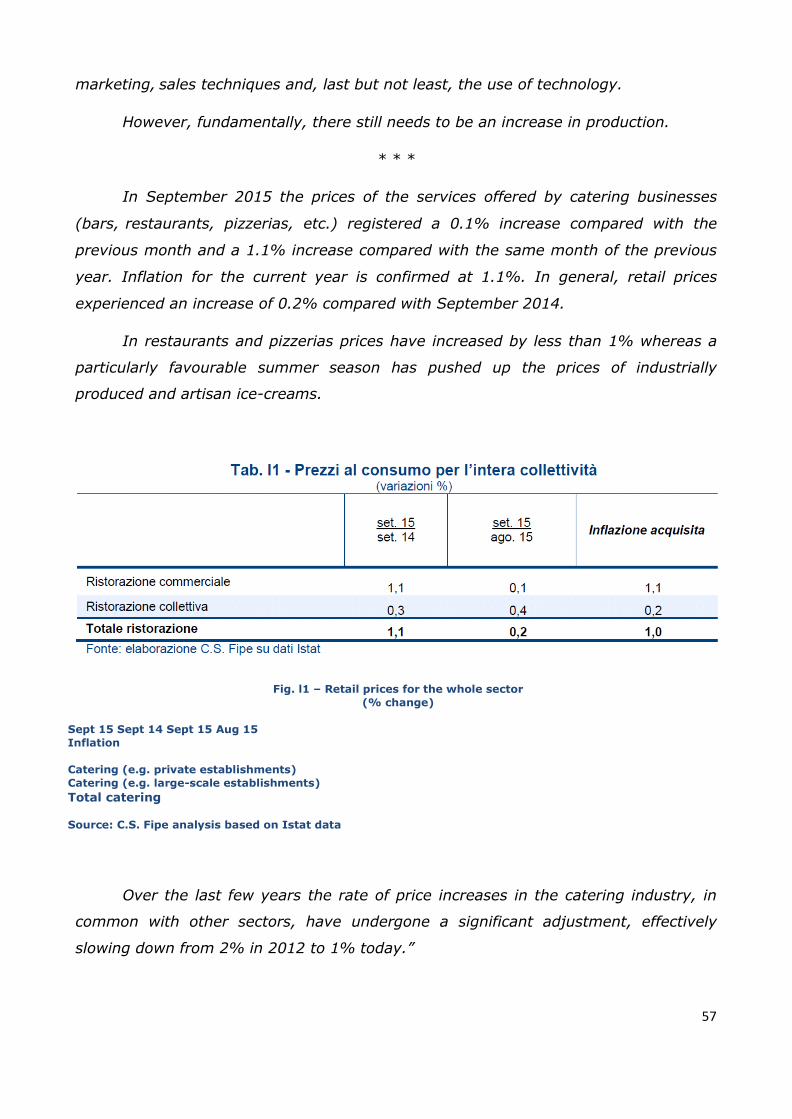
57
marketing, sales techniques and, last but not least, the use of technology.
However, fundamentally, there still needs to be an increase in production.
* * *
In September 2015 the prices of the services offered by catering businesses
(bars, restaurants, pizzerias, etc.) registered a 0.1% increase compared with the
previous month and a 1.1% increase compared with the same month of the previous
year. Inflation for the current year is confirmed at 1.1%. In general, retail prices
experienced an increase of 0.2% compared with September 2014.
In restaurants and pizzerias prices have increased by less than 1% whereas a
particularly favourable summer season has pushed up the prices of industrially
produced and artisan ice-creams.
Fig. l1 – Retail prices for the whole sector
(% change)
Sept 15 Sept 14 Sept 15 Aug 15
Inflation
Catering (e.g. private establishments)
Catering (e.g. large-scale establishments)
Total catering
Source: C.S. Fipe analysis based on Istat data
Over the last few years the rate of price increases in the catering industry, in
common with other sectors, have undergone a significant adjustment, effectively
slowing down from 2% in 2012 to 1% today.”
58
Section six:
Bibliography:
- Augè, M., Disneyland e altri Nonluoghi, Bollati Boringhieri 1999
- Augè, M., Nonluoghi. Introduzione a una antropologia della surmodernità,
Eleuthera 2009
- Argoneto, P., I Radiohead: l’arcobaleno e il piede sinistro di Dio. Saggio sulla
teoria dei giochi e le sue applicazioni, Armando Editore 2009
- Bauman, Z., Modernità liquida, Laterza 2011
- BBVA Open Mind, Reinventing the Company in the digital age, 2014
- Codini, A., Strategie di servitisation e valore per il cliente: una proposta
metodologica, Paper 121 UniBs 2011
- Donlon, J.P., Quinlan Fries Harder, Chief Executive Publishing, 1998
- Doxa, Le abitudini di consumo e le opinioni degli italiani sull’abbinamento pizza
& birra, 2014
- Ericsson Consumer Lab, 10 hot consumer trends, Ericsson 2016
- Eurisko, La grande mappa di Sinottica e i nuovi stili di vita, Sinottica Eurisko
2004
- Fabri, B., Il reincanto del mondo nel tempo delle tribù, Tesi di laurea LUISS
2013, relatrice Prof.ssa Fallocco
- Fabris, G.P., Societing – Il marketing nella società post moderna, EGEA 2009
- FIPE, PE 24h: la cas@ fuoricasa, FIPE 2013
- FIPE, Ristorazione Rapporto Annuale 2015, FIPE 2016
- Gentile, C., Spiller N. & Noci, How To sustain the customer experience: An
overview of experience components that co-creates value with the costumer.
European Management Journal 2007
- Herzberg, F.I., Work and the nature of man, 1966
- IBM, Servitisation: il servizio come leva del vantaggio competitivo, IBM 2008
- ISPO, Il valore della pulizia, ISPO 2012
- Luhman, N., Sistemi sociali, Il Mulino 1990
- Maffesoli, M., Il tempo delle tribù. Il declino dell’individualismo nelle società
post moderne, Guerini e Associati 2004
- Meeker, M., Internet trends 2015, Code Conference 27.05.15, KPCB 2015
- Miao, Li & Mattila, A., Impulse Buying in Restaurant Food Consumption, 2013
59
- MIT, Digital Humanities, MIT Press 2012
- Mobile Ecosystem Forum, Mobile Messaging Report 2016, MEF 2016
- Oliver, C., Groundbreaking Survey Reveals How Diners Choose Restaurants,
http://angelsmith.net/inbound-marketing/ 2012
- Oracle Hospitality, Guida pratica alla gestione del tuo ristorante, Restaurant
Magazine 2015
- Popper, K., Società aperta, Universo aperto, Borla 1984
- Sassoli, E., Non solo shopping, Le Lettere 2008
- The Washington Post, Food prices are dropping. Restaurant prices aren’t,
Wa.Po. 12/10/2016
- Verhoef, P.C., Lemon, K.C., Parasuraman, A., Roggeveen, A., Tsiros, M.,
Schlesinger, L.A., Customer Experience Creation: Determinants Dynamics and
Management strategies”, Journal of Retailing 85 (1-2009) pag. 31-41. New
York University 2008