Embed Size (px)
Citation preview
Ready or Not, Here Comes 2015: Marketing Trends to Master
TODAY’S AGENDA & PRESENTERS
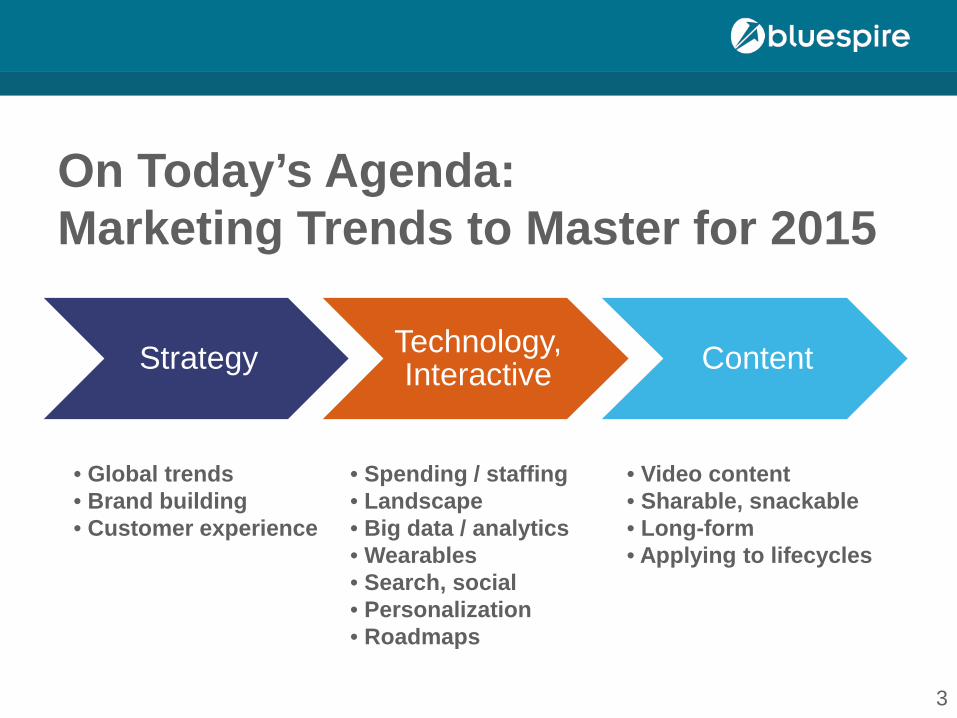
On Today’s Agenda: Marketing Trends to Master for 2015
Strategy Technology, Interactive Content
3
• Global trends • Brand building • Customer experience
• Spending / staffing • Landscape • Big data / analytics • Wearables • Search, social • Personalization • Roadmaps
• Video content • Sharable, snackable • Long-form • Applying to lifecycles
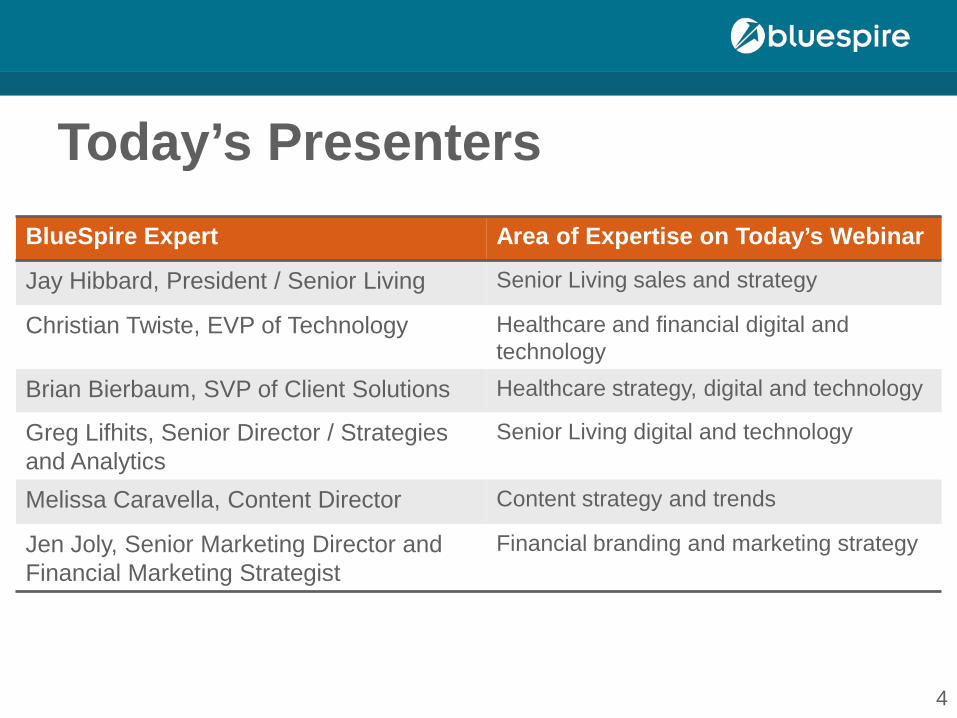
BlueSpire Expert Area of Expertise on Today’s Webinar
Jay Hibbard, President / Senior Living Senior Living sales and strategy
Christian Twiste, EVP of Technology Healthcare and financial digital and technology
Brian Bierbaum, SVP of Client Solutions Healthcare strategy, digital and technology
Greg Lifhits, Senior Director / Strategies and Analytics
Senior Living digital and technology
Melissa Caravella, Content Director Content strategy and trends
Jen Joly, Senior Marketing Director and Financial Marketing Strategist
Financial branding and marketing strategy
4
Today’s Presenters
A quick note about …
5
STRATEGY
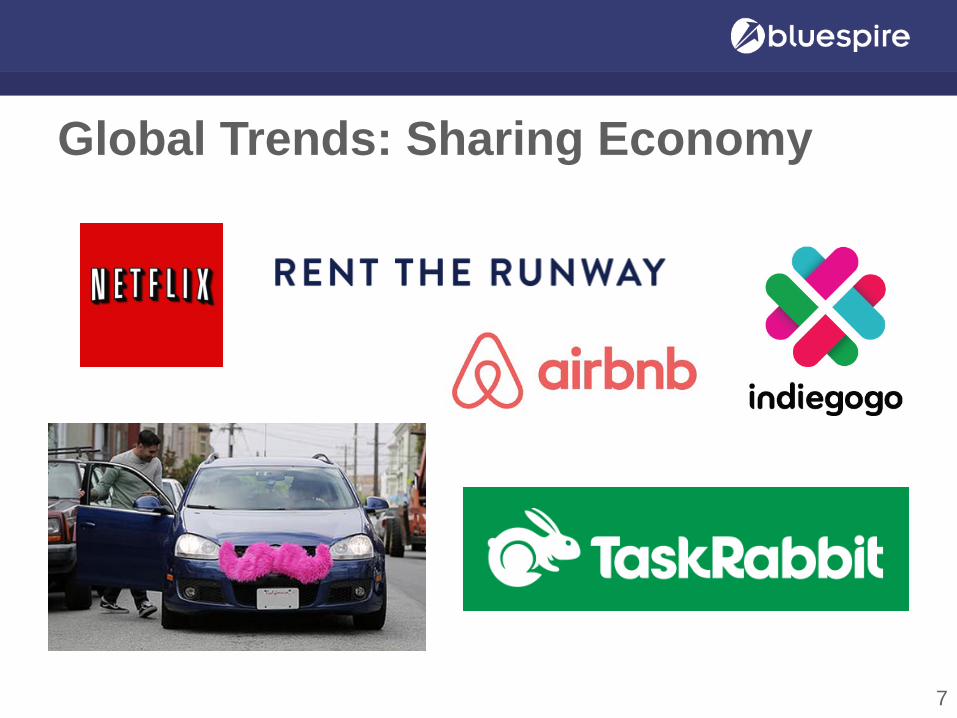
Global Trends: Sharing Economy
7
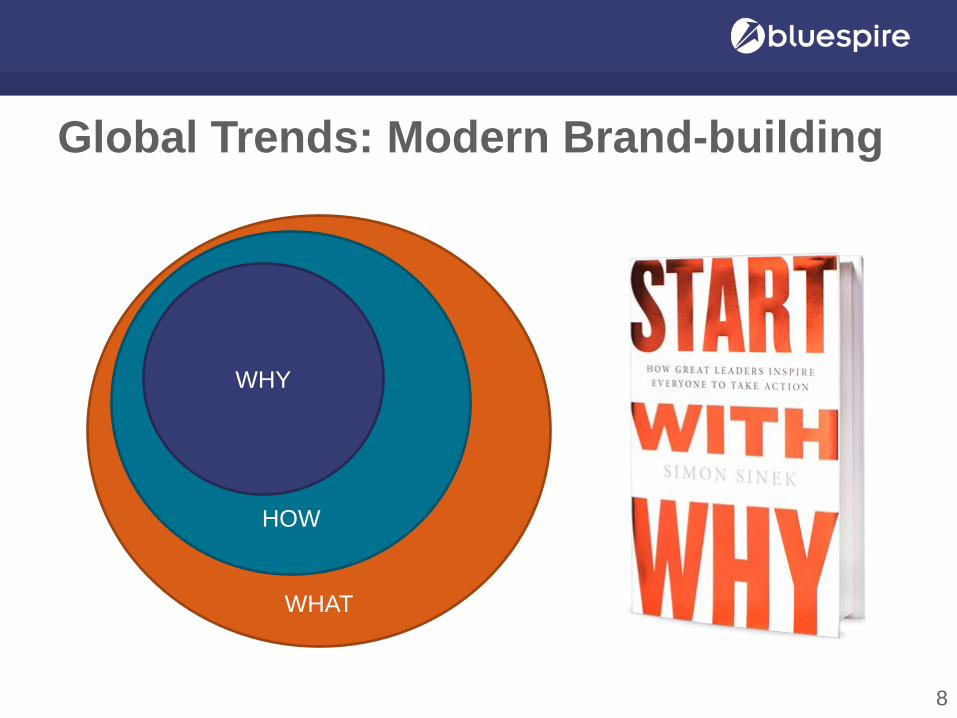
Global Trends: Modern Brand-building
8
WHAT
HOW
WHY
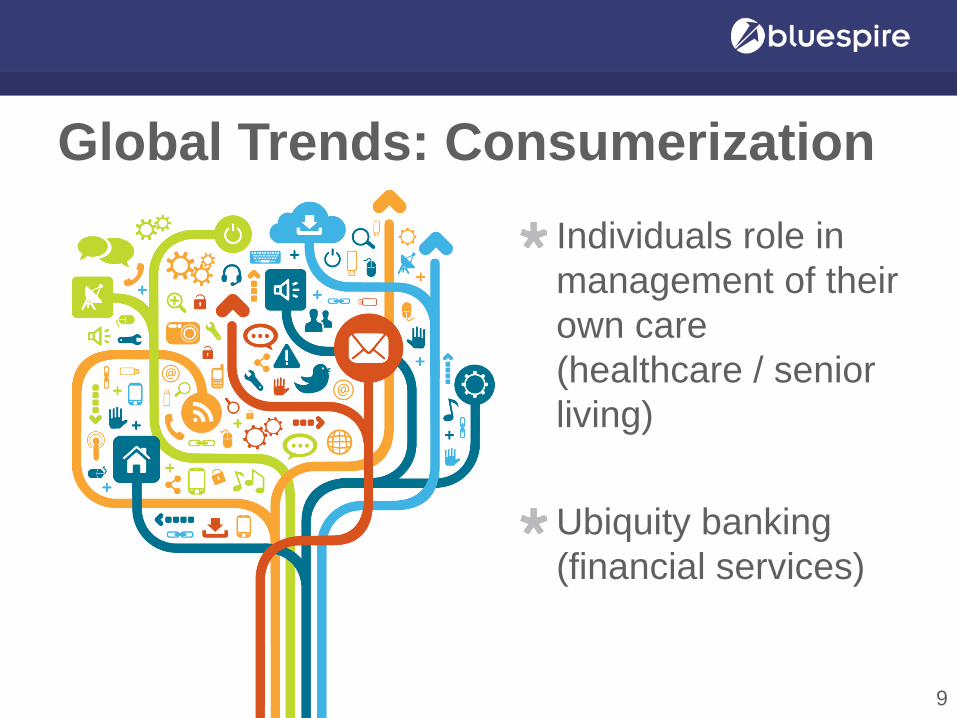
Global Trends: Consumerization Individuals role in management of their own care (healthcare / senior living) Ubiquity banking (financial services)
9
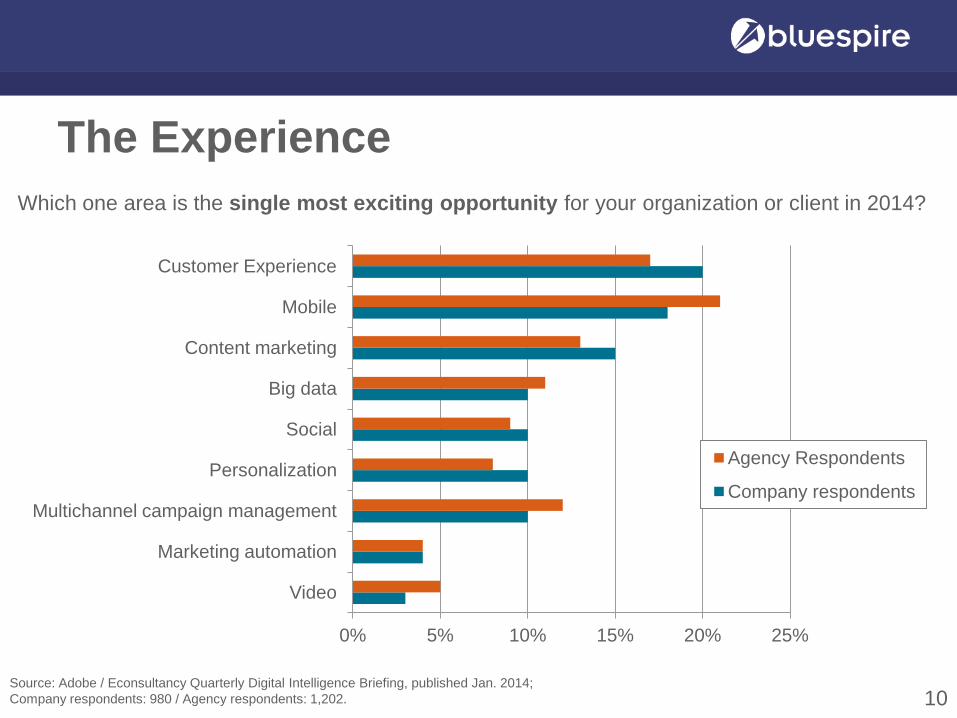
The Experience
10
0% 5% 10% 15% 20% 25%
Video
Marketing automation
Multichannel campaign management
Personalization
Social
Big data
Content marketing
Mobile
Customer Experience
Agency Respondents
Company respondents
Which one area is the single most exciting opportunity for your organization or client in 2014?
Source: Adobe / Econsultancy Quarterly Digital Intelligence Briefing, published Jan. 2014; Company respondents: 980 / Agency respondents: 1,202.
Optimizing the Experience
11
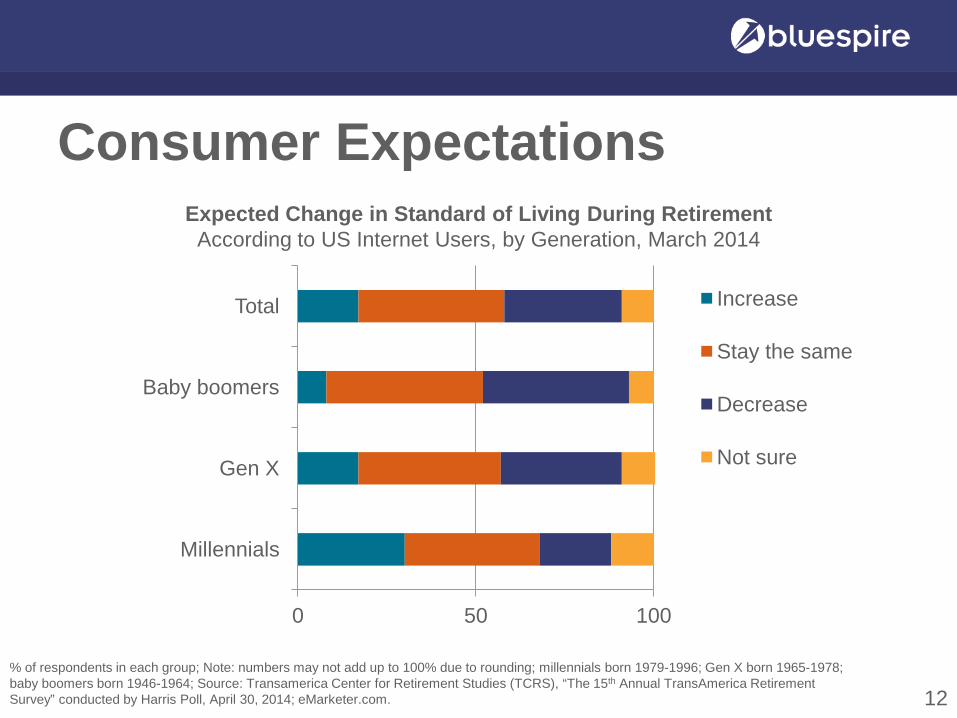
Consumer Expectations
12
0 50 100
Millennials
Gen X
Baby boomers
Total Increase
Stay the same
Decrease
Not sure
Expected Change in Standard of Living During Retirement According to US Internet Users, by Generation, March 2014
% of respondents in each group; Note: numbers may not add up to 100% due to rounding; millennials born 1979-1996; Gen X born 1965-1978; baby boomers born 1946-1964; Source: Transamerica Center for Retirement Studies (TCRS), “The 15th Annual TransAmerica Retirement Survey” conducted by Harris Poll, April 30, 2014; eMarketer.com.
TECHNOLOGY
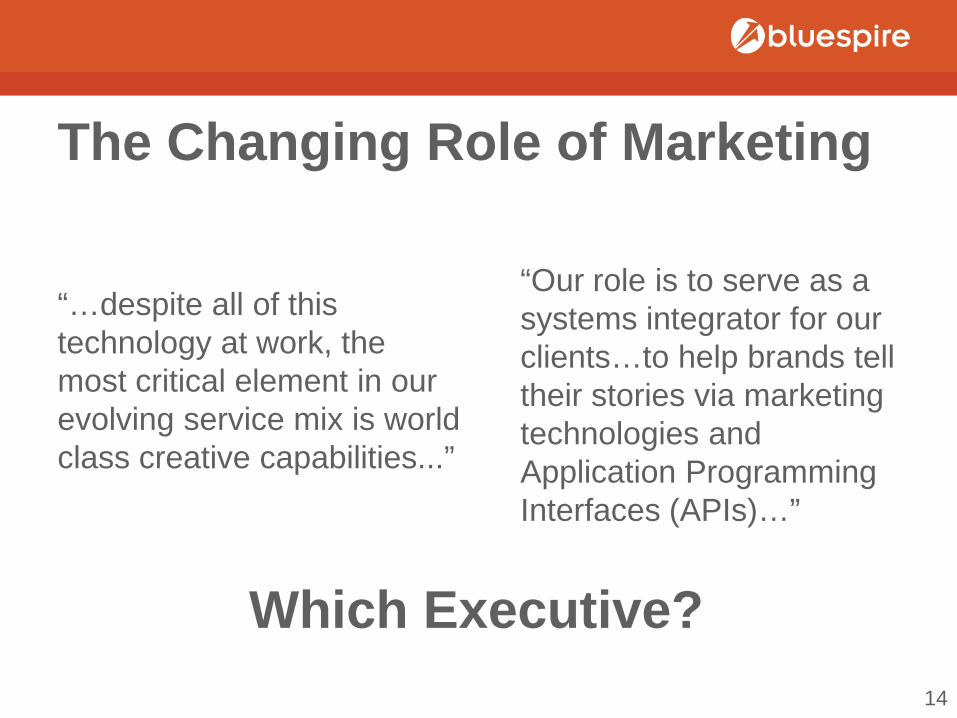
The Changing Role of Marketing
“…despite all of this technology at work, the most critical element in our evolving service mix is world class creative capabilities...”
“Our role is to serve as a systems integrator for our clients…to help brands tell their stories via marketing technologies and Application Programming Interfaces (APIs)…”
Which Executive?
14
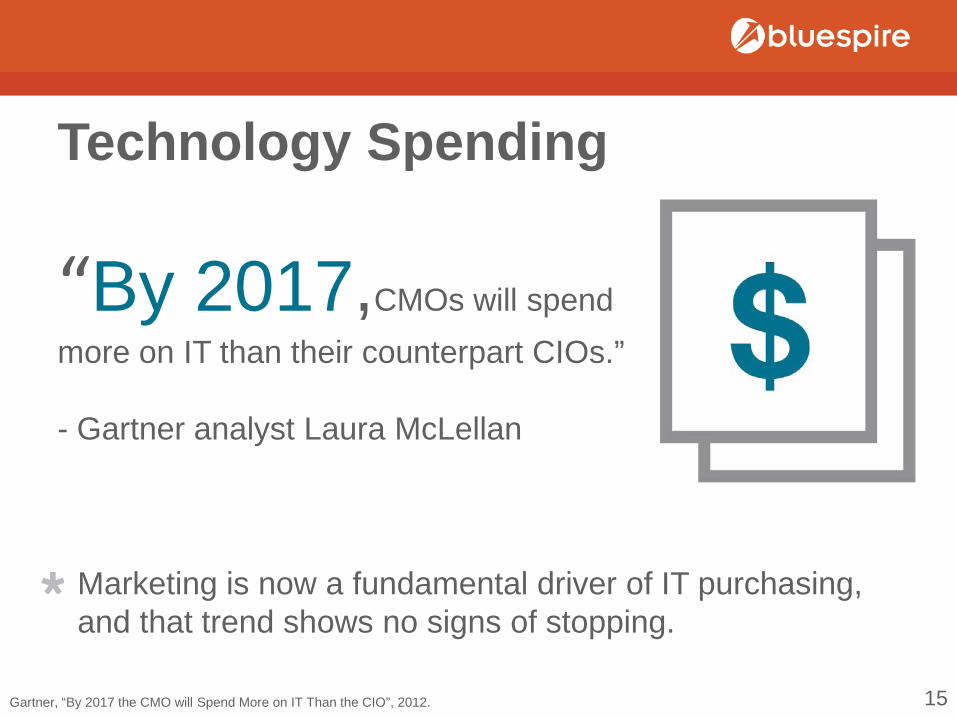
Technology Spending
Marketing is now a fundamental driver of IT purchasing, and that trend shows no signs of stopping.
Gartner, “By 2017 the CMO will Spend More on IT Than the CIO”, 2012.
“By 2017,CMOs will spend more on IT than their counterpart CIOs.” - Gartner analyst Laura McLellan
15
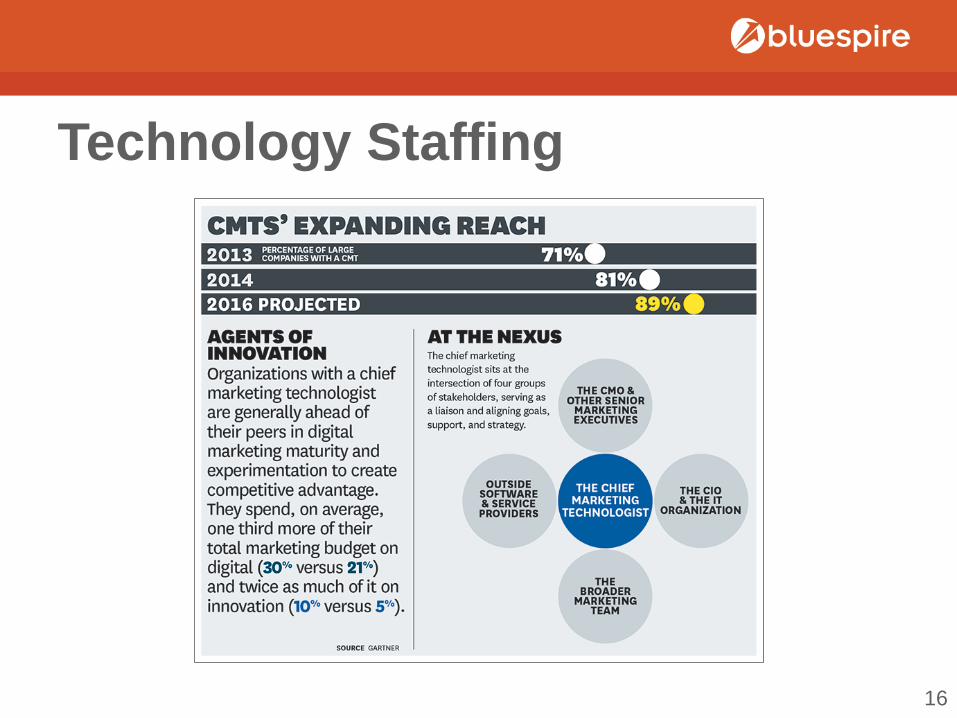
Technology Staffing
16
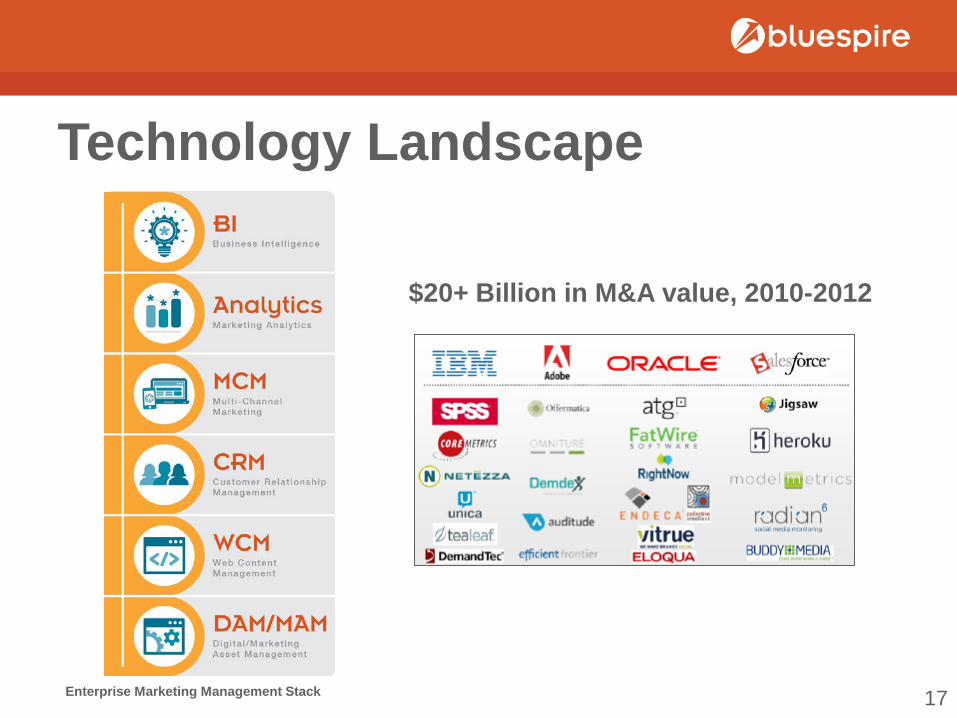
Technology Landscape
$20+ Billion in M&A value, 2010-2012
Enterprise Marketing Management Stack 17
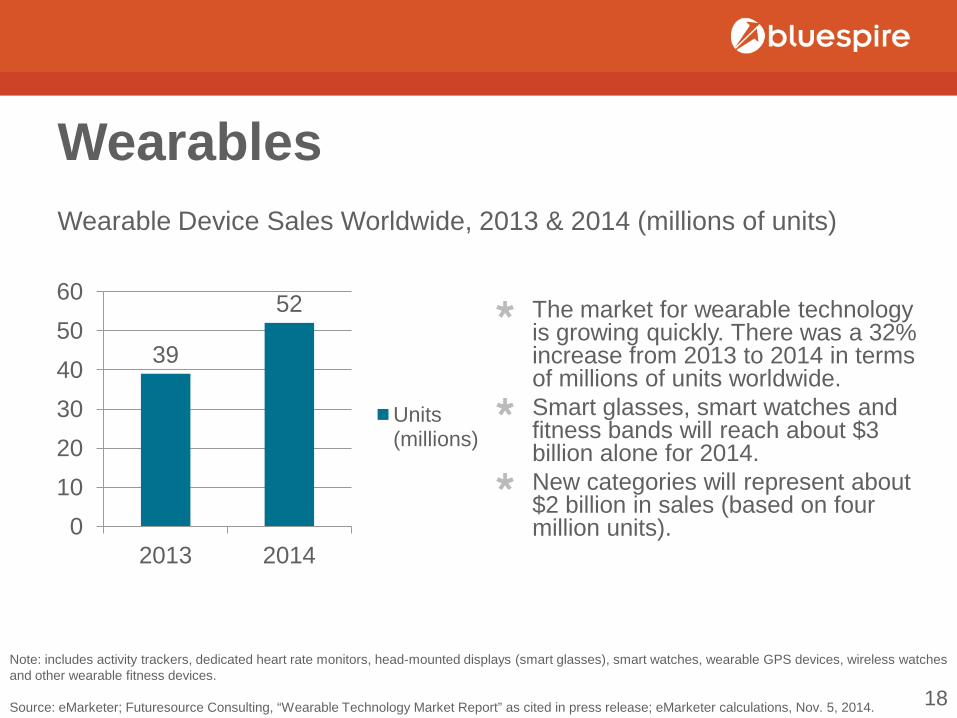
Wearables
The market for wearable technology is growing quickly. There was a 32% increase from 2013 to 2014 in terms of millions of units worldwide. Smart glasses, smart watches and fitness bands will reach about $3 billion alone for 2014. New categories will represent about $2 billion in sales (based on four million units).
39
52
0 10 20 30 40 50 60
2013 2014
Units (millions)
Wearable Device Sales Worldwide, 2013 & 2014 (millions of units)
Note: includes activity trackers, dedicated heart rate monitors, head-mounted displays (smart glasses), smart watches, wearable GPS devices, wireless watches and other wearable fitness devices. Source: eMarketer; Futuresource Consulting, “Wearable Technology Market Report” as cited in press release; eMarketer calculations, Nov. 5, 2014. 18
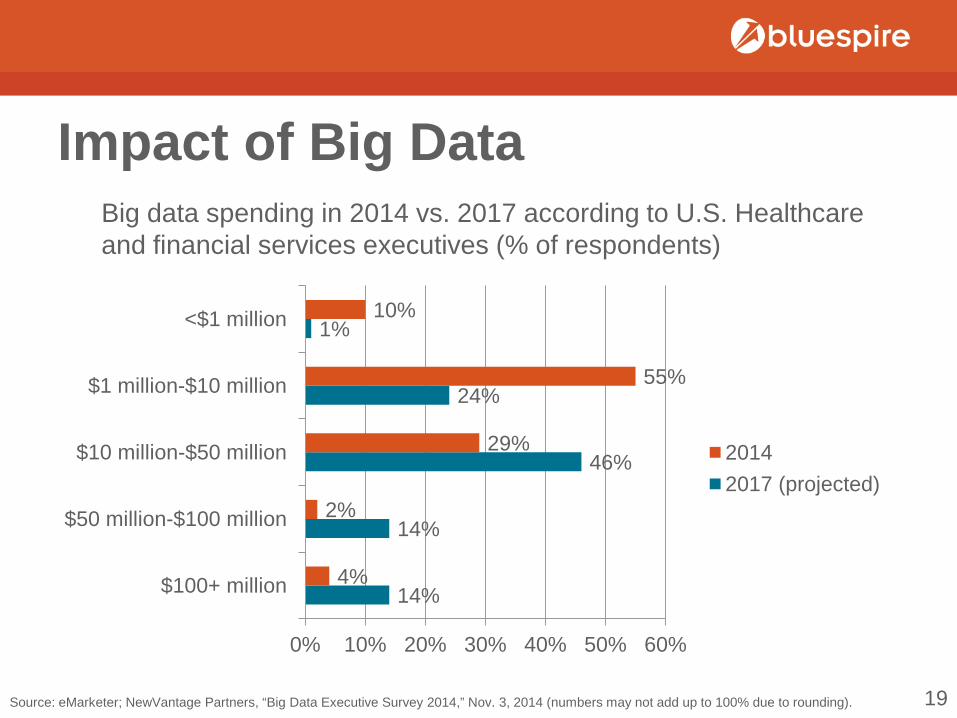
Impact of Big Data Big data spending in 2014 vs. 2017 according to U.S. Healthcare and financial services executives (% of respondents)
Source: eMarketer; NewVantage Partners, “Big Data Executive Survey 2014,” Nov. 3, 2014 (numbers may not add up to 100% due to rounding).
14%
14%
46%
24%
1%
4%
2%
29%
55%
10%
0% 10% 20% 30% 40% 50% 60%
$100+ million
$50 million-$100 million
$10 million-$50 million
$1 million-$10 million
<$1 million
2014 2017 (projected)
19
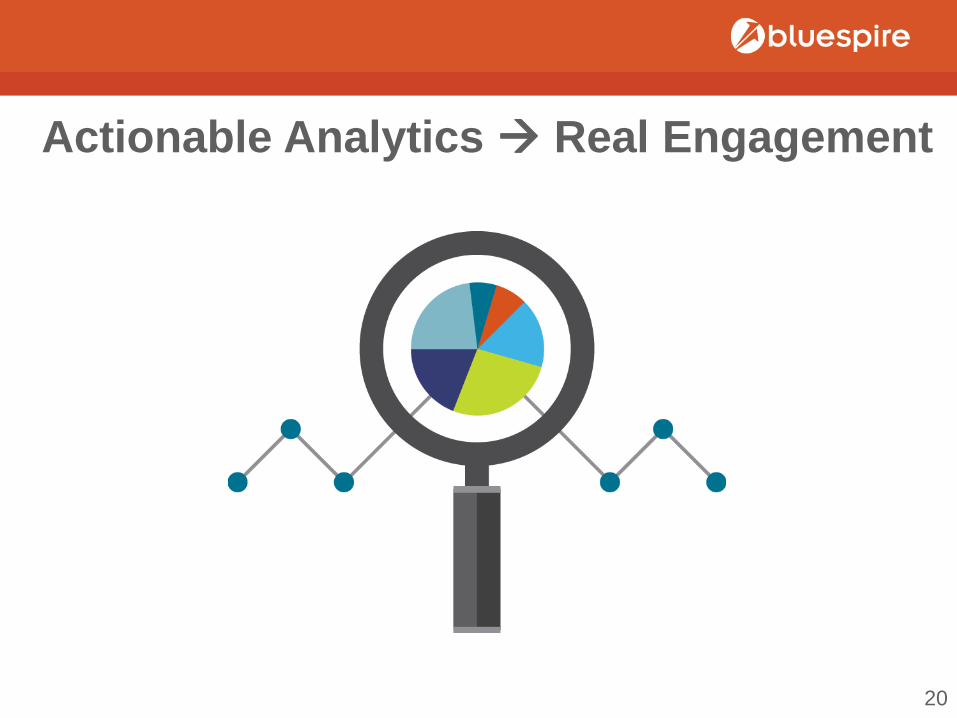
Actionable Analytics Real Engagement
20
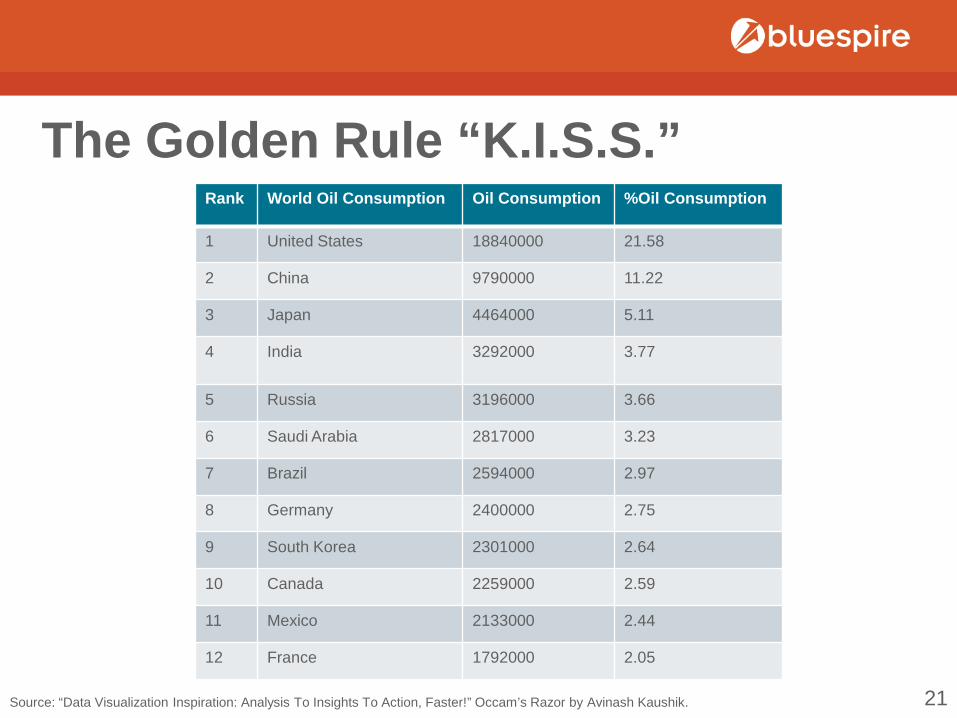
The Golden Rule “K.I.S.S.” Rank World Oil Consumption Oil Consumption %Oil Consumption
1 United States 18840000 21.58
2 China 9790000 11.22
3 Japan 4464000 5.11
4 India 3292000 3.77
5 Russia 3196000 3.66
6 Saudi Arabia 2817000 3.23
7 Brazil 2594000 2.97
8 Germany 2400000 2.75
9 South Korea 2301000 2.64
10 Canada 2259000 2.59
11 Mexico 2133000 2.44
12 France 1792000 2.05
Source: “Data Visualization Inspiration: Analysis To Insights To Action, Faster!” Occam’s Razor by Avinash Kaushik. 21
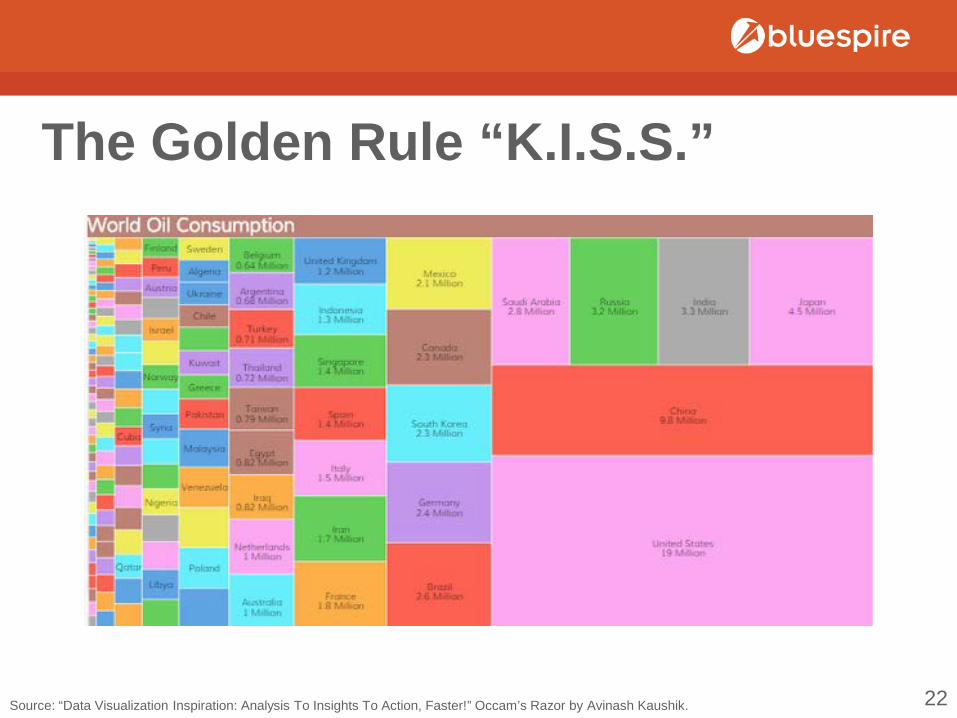
The Golden Rule “K.I.S.S.”
Source: “Data Visualization Inspiration: Analysis To Insights To Action, Faster!” Occam’s Razor by Avinash Kaushik. 22
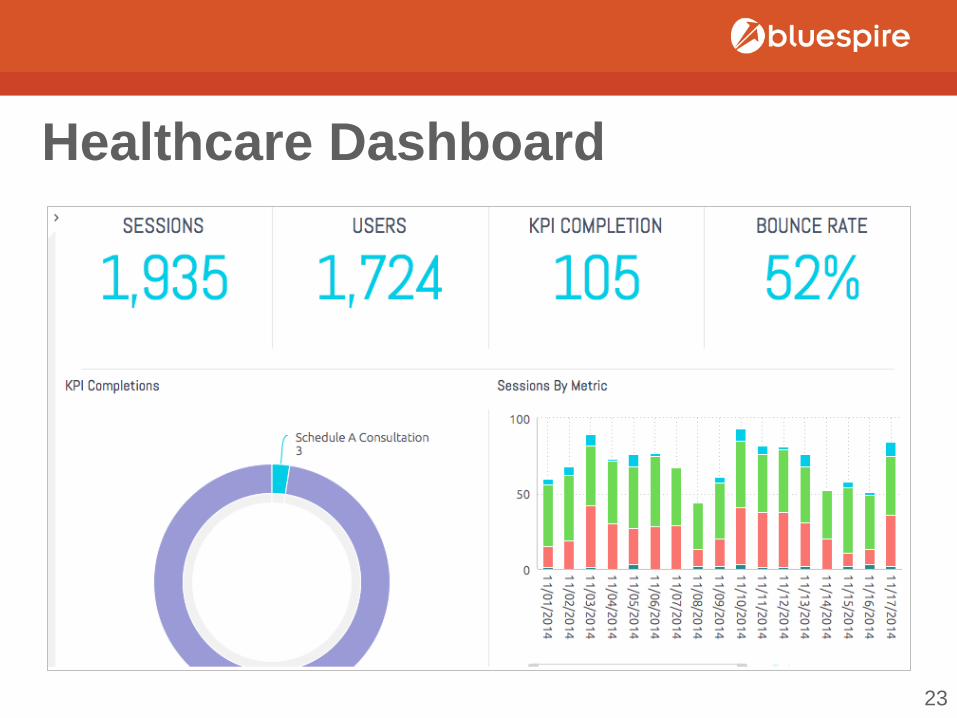
Healthcare Dashboard
23
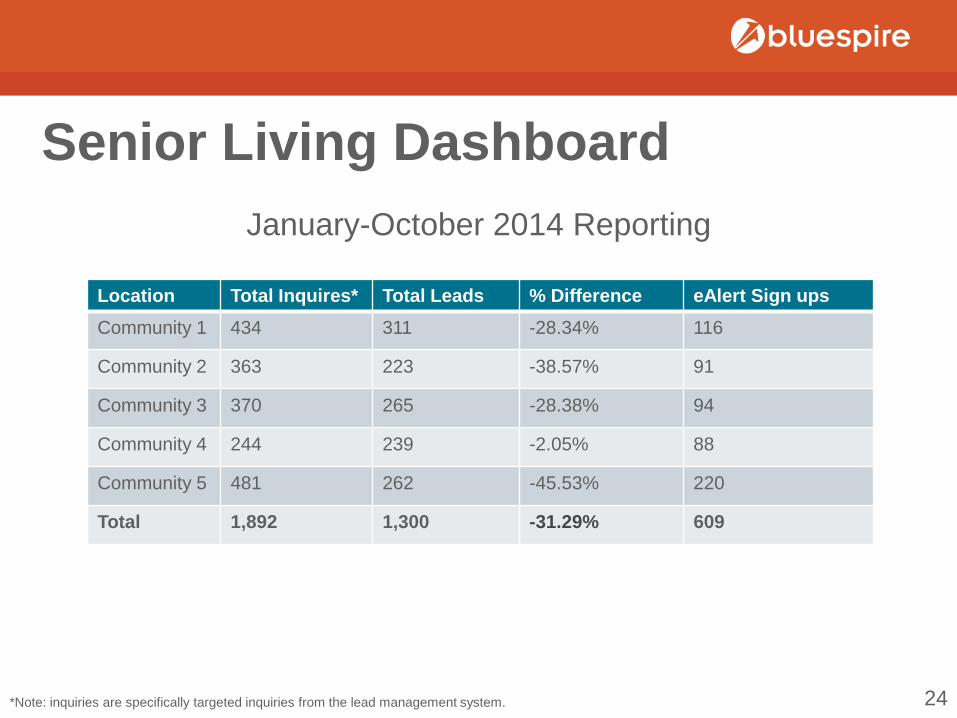
Senior Living Dashboard January-October 2014 Reporting
Location Total Inquires* Total Leads % Difference eAlert Sign ups Community 1 434 311 -28.34% 116
Community 2 363 223 -38.57% 91
Community 3 370 265 -28.38% 94
Community 4 244 239 -2.05% 88
Community 5 481 262 -45.53% 220
Total 1,892 1,300 -31.29% 609
*Note: inquiries are specifically targeted inquiries from the lead management system. 24
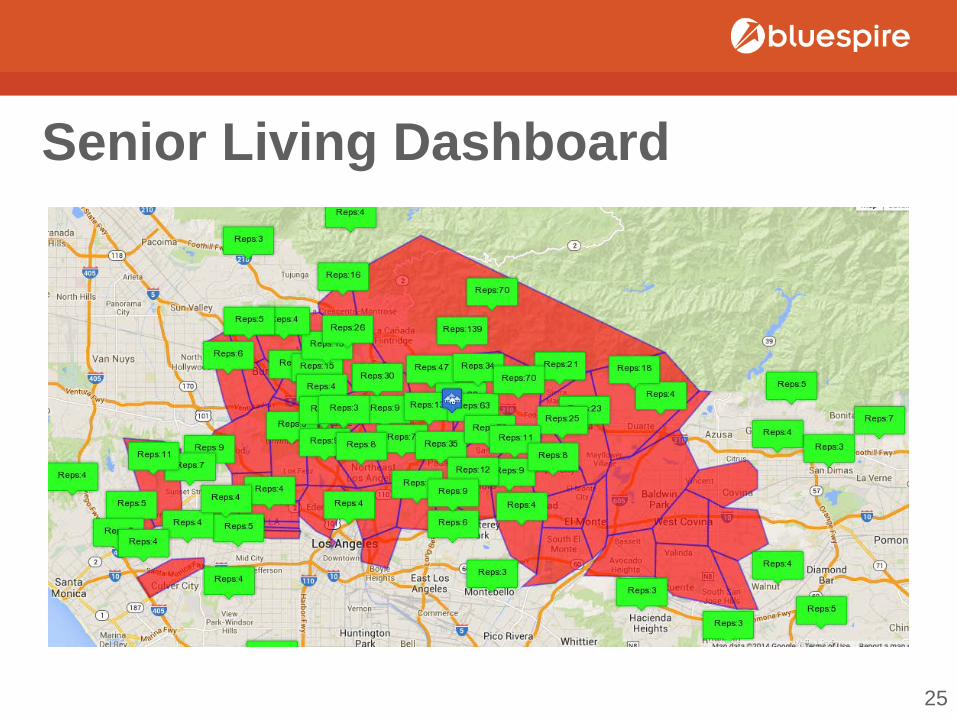
Senior Living Dashboard
25
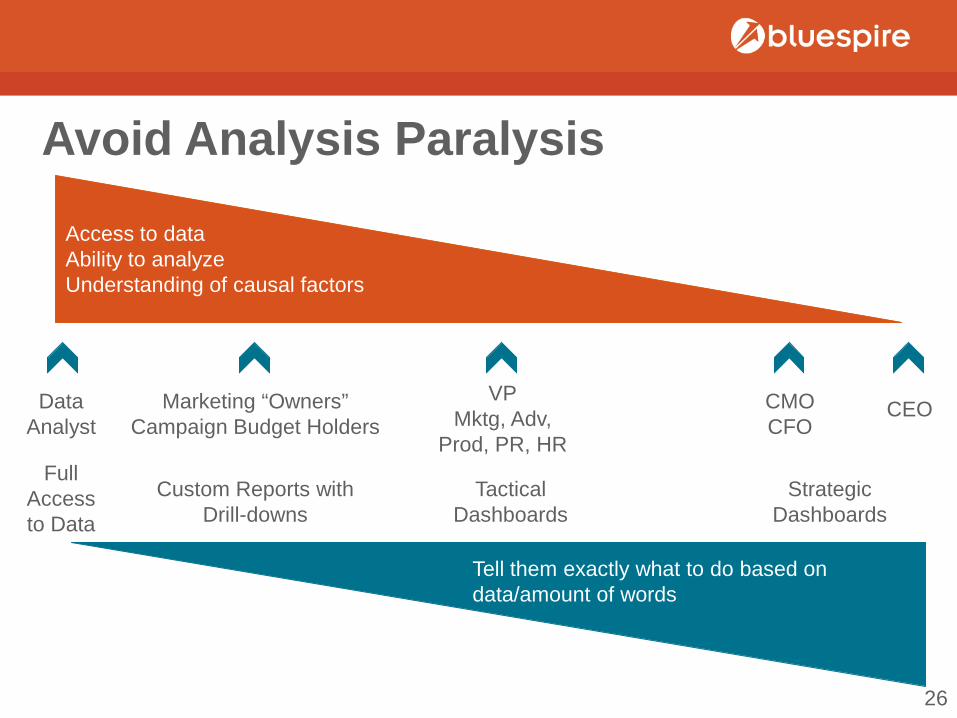
Access to data Ability to analyze Understanding of causal factors
Tell them exactly what to do based on data/amount of words
Data Analyst
Marketing “Owners” Campaign Budget Holders
VP Mktg, Adv,
Prod, PR, HR
CMO CFO
CEO
Full Access to Data
Custom Reports with Drill-downs
Tactical Dashboards
Strategic Dashboards
Avoid Analysis Paralysis
26
INTERACTIVE
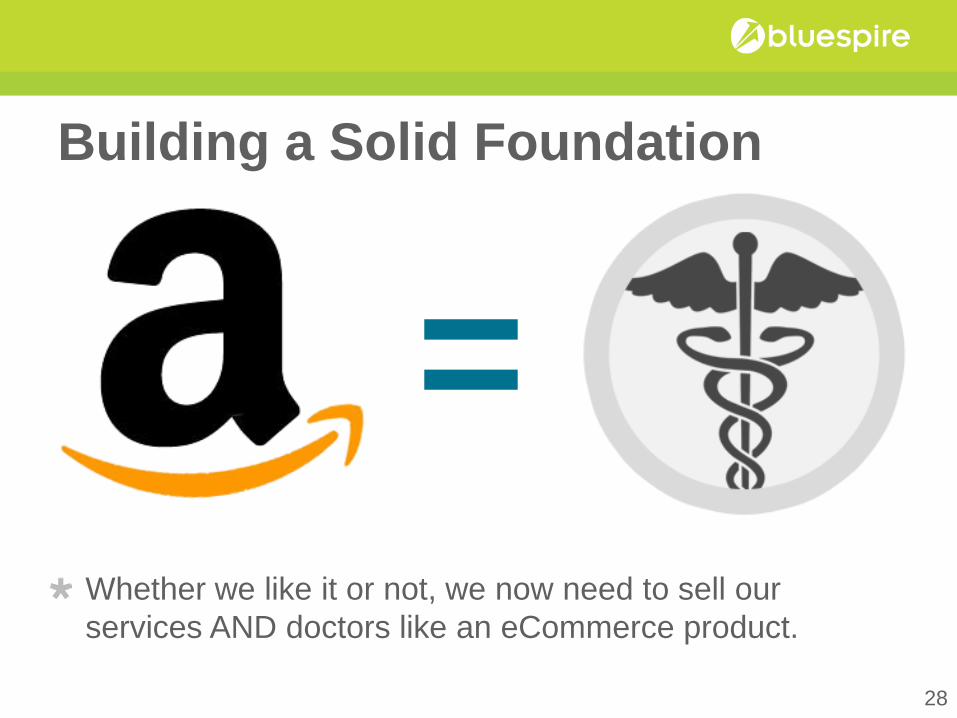
Building a Solid Foundation
= Whether we like it or not, we now need to sell our services AND doctors like an eCommerce product.
28
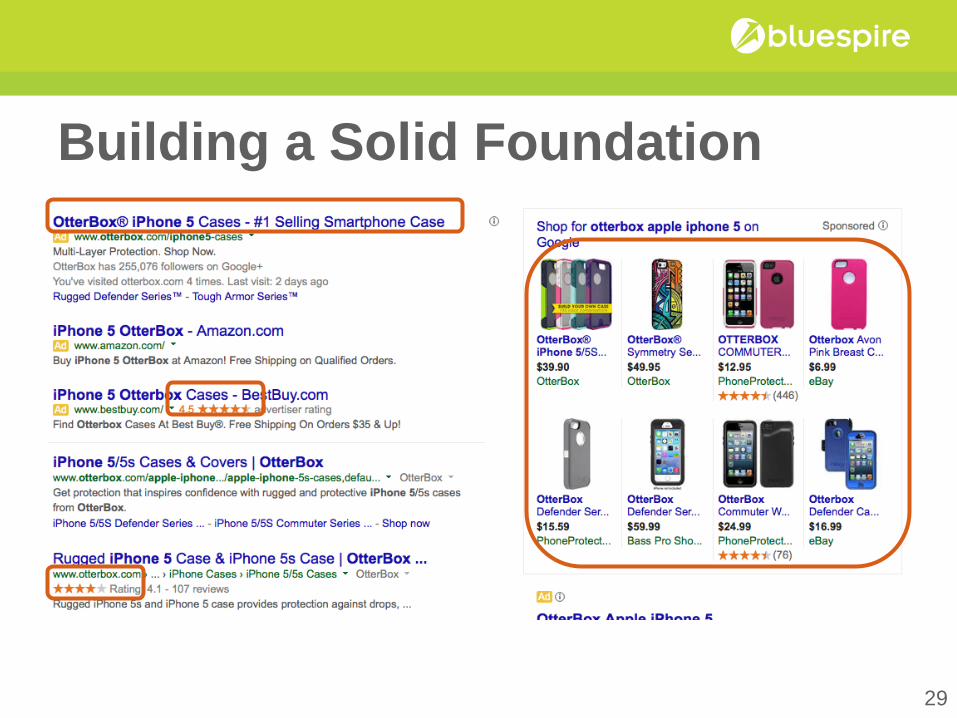
Building a Solid Foundation
29
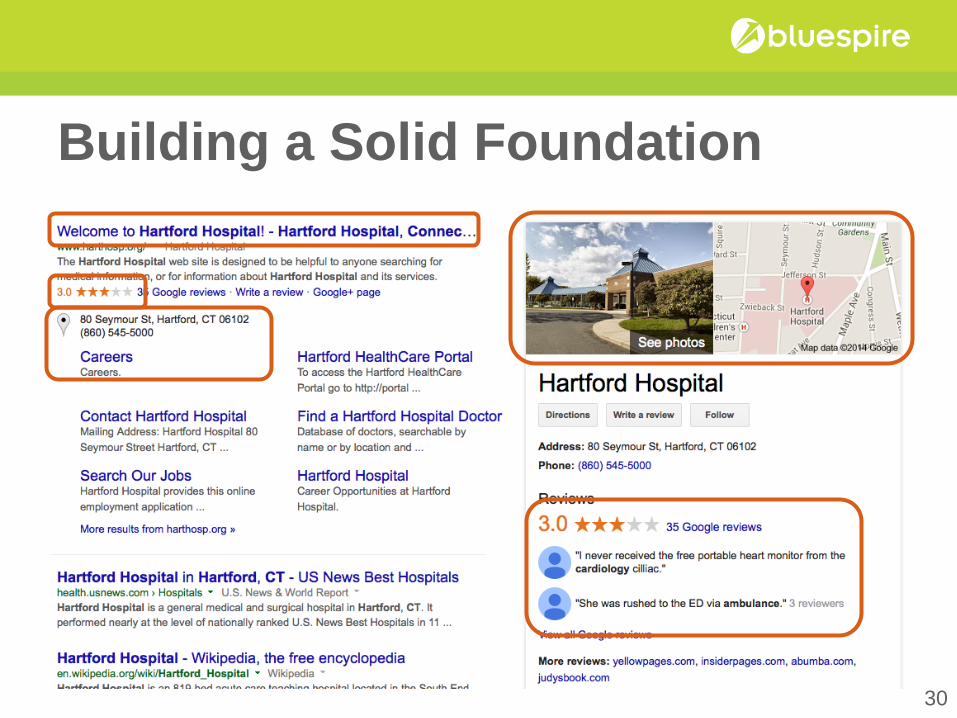
Building a Solid Foundation
30
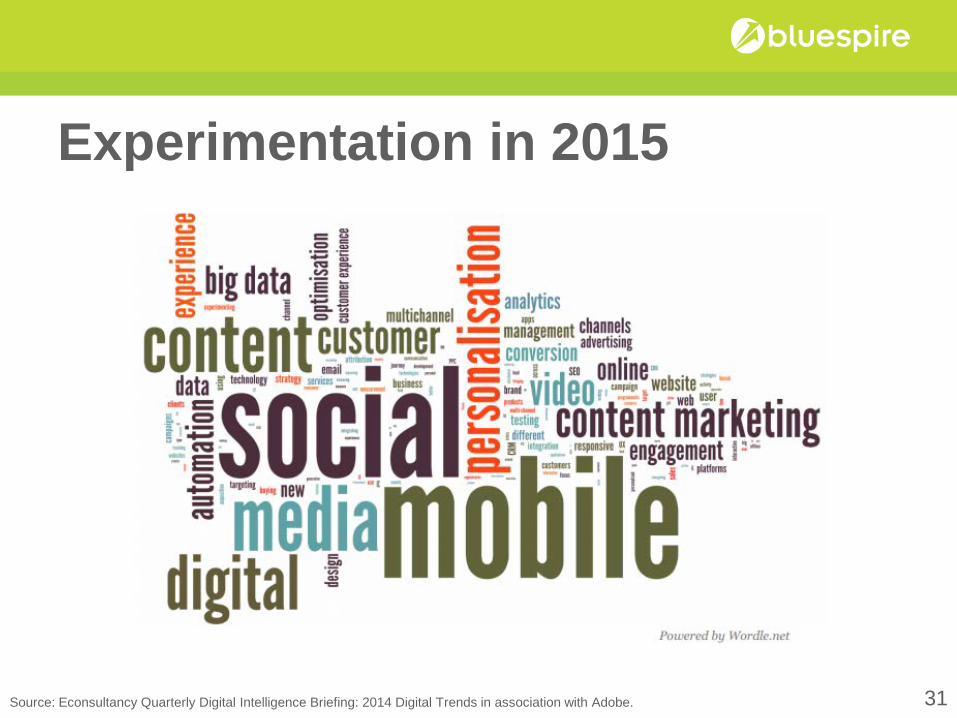
Experimentation in 2015
Source: Econsultancy Quarterly Digital Intelligence Briefing: 2014 Digital Trends in association with Adobe. 31
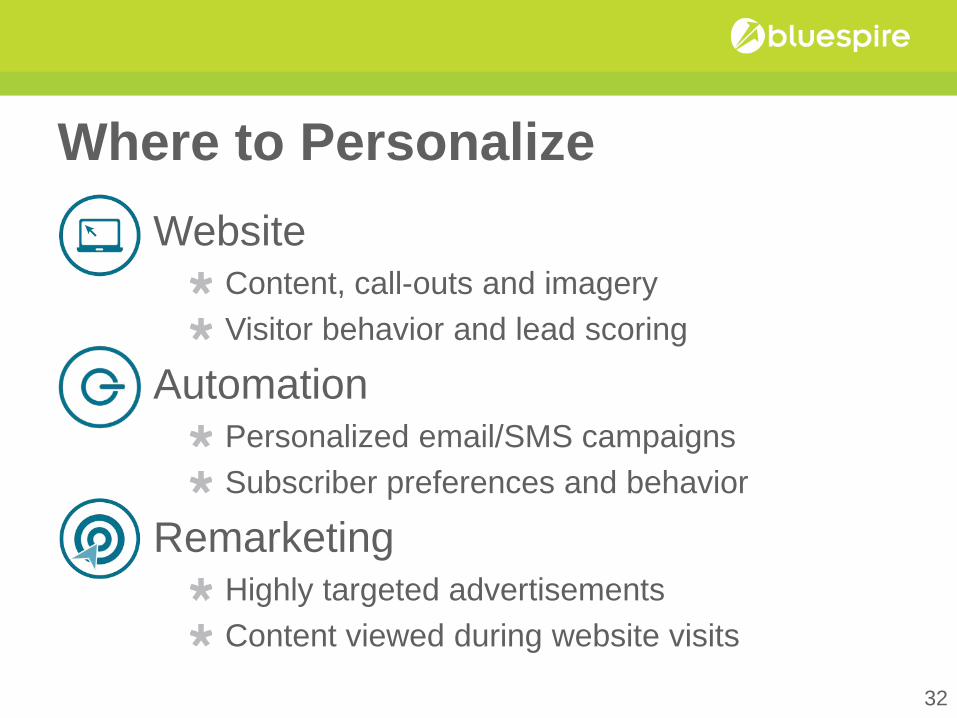
Where to Personalize Website
Content, call-outs and imagery Visitor behavior and lead scoring
Automation Personalized email/SMS campaigns Subscriber preferences and behavior
Remarketing Highly targeted advertisements Content viewed during website visits
32
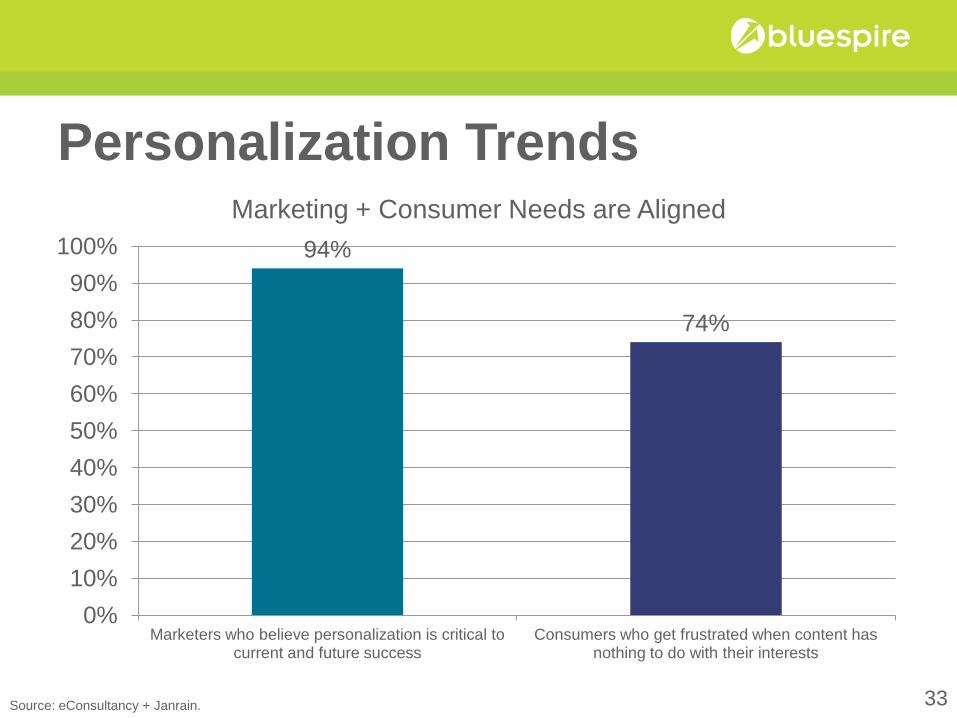
Personalization Trends
94%
74%
0% 10% 20% 30% 40% 50% 60% 70% 80% 90%
100%
Marketers who believe personalization is critical to current and future success
Consumers who get frustrated when content has nothing to do with their interests
Marketing + Consumer Needs are Aligned
Source: eConsultancy + Janrain. 33
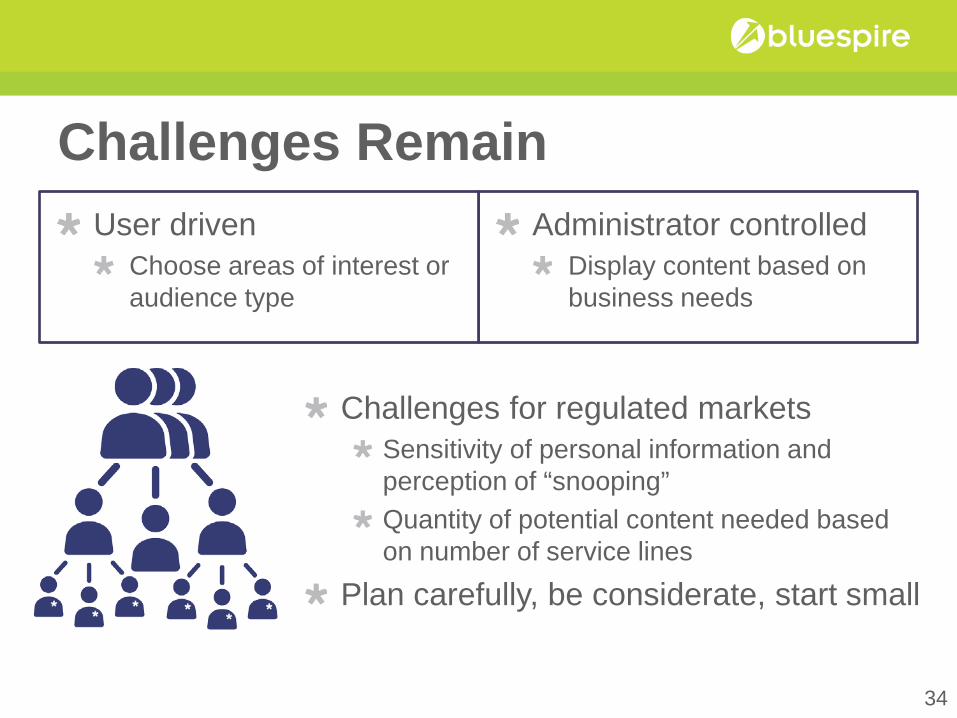
Challenges Remain User driven
Choose areas of interest or audience type
Administrator controlled Display content based on business needs
Challenges for regulated markets Sensitivity of personal information and perception of “snooping” Quantity of potential content needed based on number of service lines
Plan carefully, be considerate, start small
34
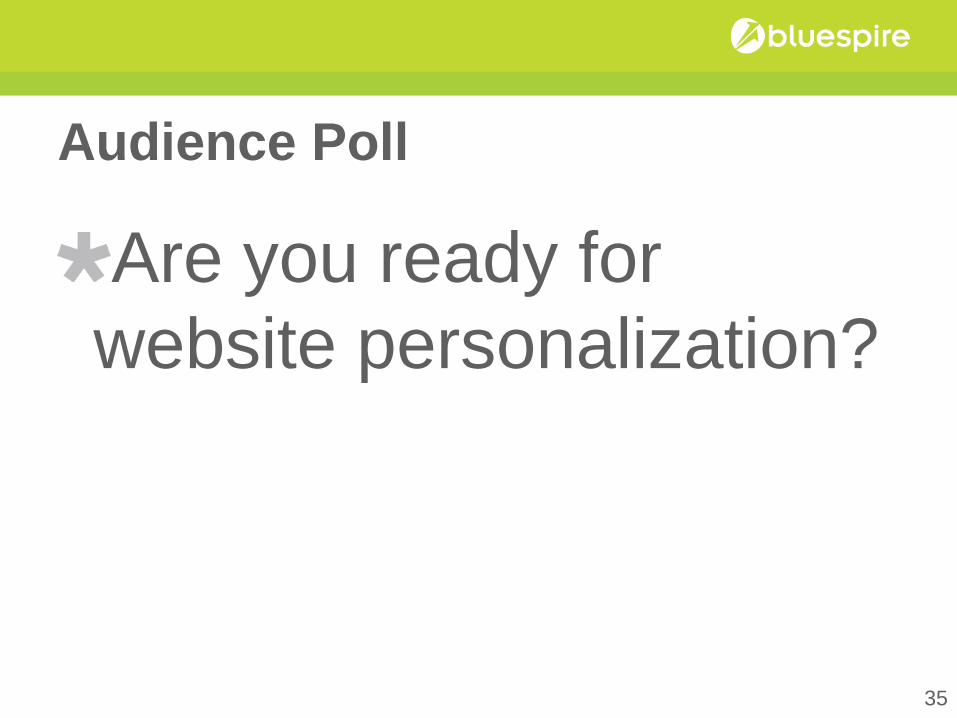
Audience Poll
Are you ready for website personalization?
35
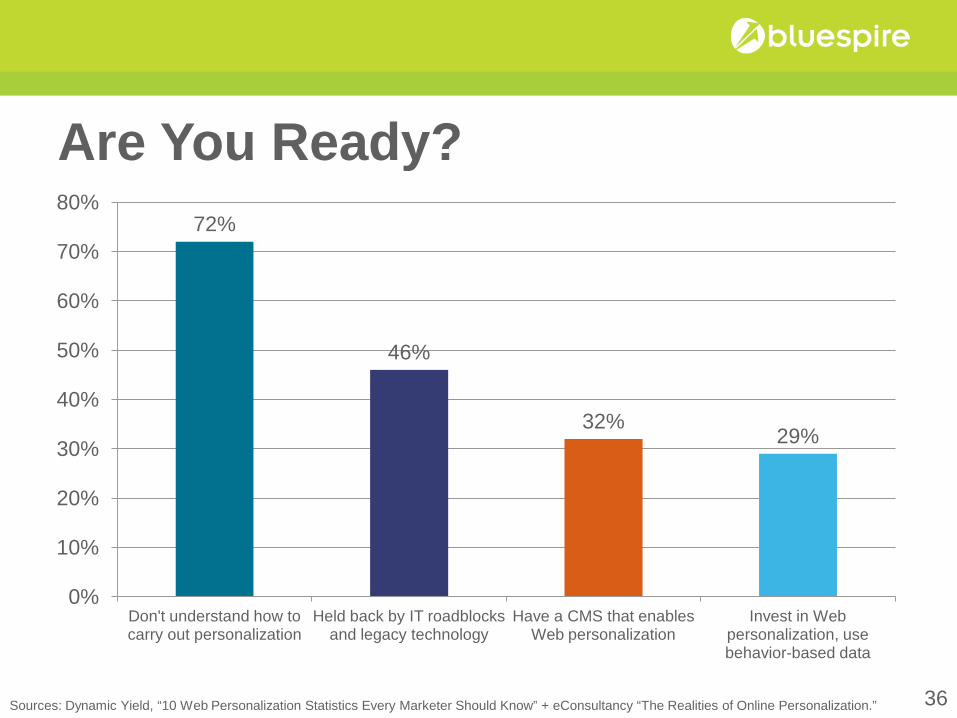
Are You Ready? 72%
46%
32% 29%
0%
10%
20%
30%
40%
50%
60%
70%
80%
Don't understand how to carry out personalization
Held back by IT roadblocks and legacy technology
Have a CMS that enables Web personalization
Invest in Web personalization, use behavior-based data
Sources: Dynamic Yield, “10 Web Personalization Statistics Every Marketer Should Know” + eConsultancy “The Realities of Online Personalization.” 36
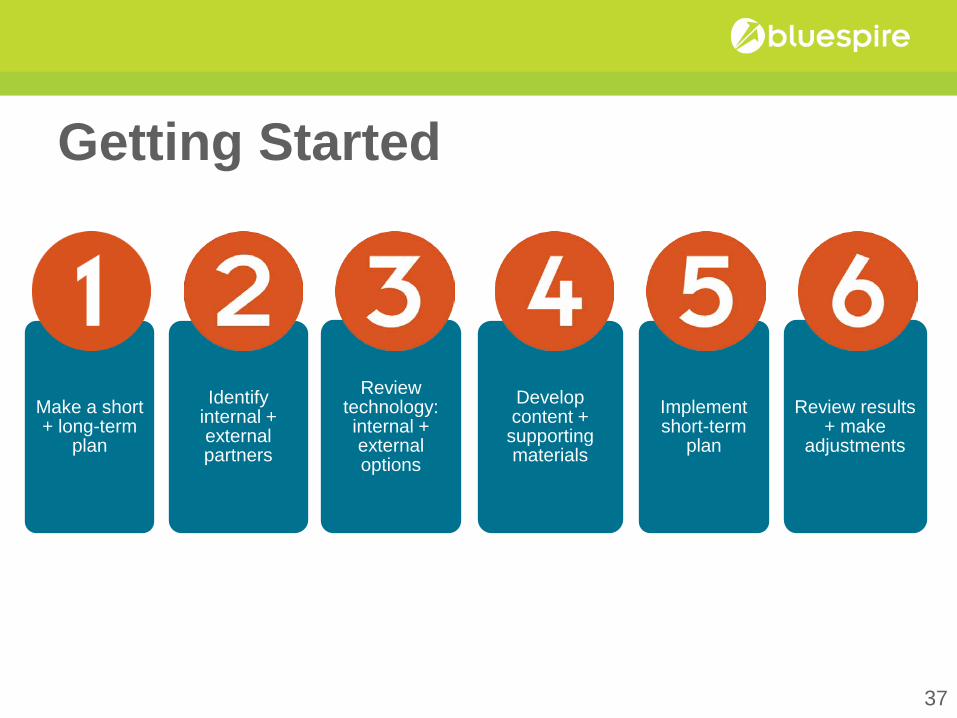
Getting Started
Make a short + long-term
plan
Identify internal + external partners
Review technology: internal + external options
Develop content + supporting materials
Implement short-term
plan
Review results + make
adjustments
37
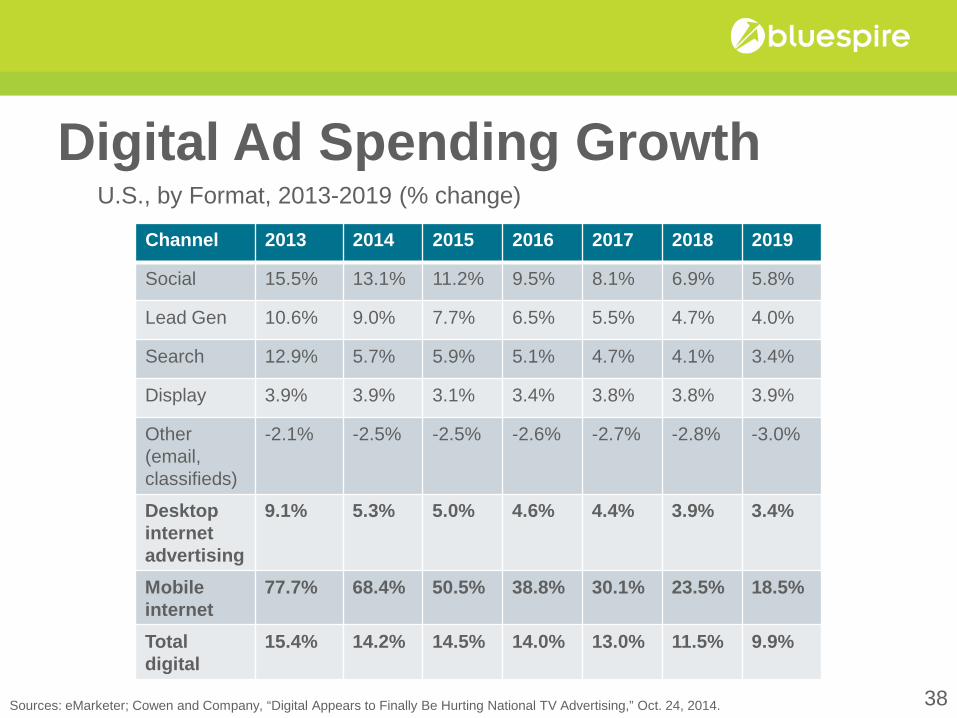
Digital Ad Spending Growth U.S., by Format, 2013-2019 (% change)
Sources: eMarketer; Cowen and Company, “Digital Appears to Finally Be Hurting National TV Advertising,” Oct. 24, 2014.
Channel 2013 2014 2015 2016 2017 2018 2019
Social 15.5% 13.1% 11.2% 9.5% 8.1% 6.9% 5.8%
Lead Gen 10.6% 9.0% 7.7% 6.5% 5.5% 4.7% 4.0%
Search 12.9% 5.7% 5.9% 5.1% 4.7% 4.1% 3.4%
Display 3.9% 3.9% 3.1% 3.4% 3.8% 3.8% 3.9%
Other (email, classifieds)
-2.1% -2.5% -2.5% -2.6% -2.7% -2.8% -3.0%
Desktop internet advertising
9.1% 5.3% 5.0% 4.6% 4.4% 3.9% 3.4%
Mobile internet
77.7% 68.4% 50.5% 38.8% 30.1% 23.5% 18.5%
Total digital
15.4% 14.2% 14.5% 14.0% 13.0% 11.5% 9.9%
38
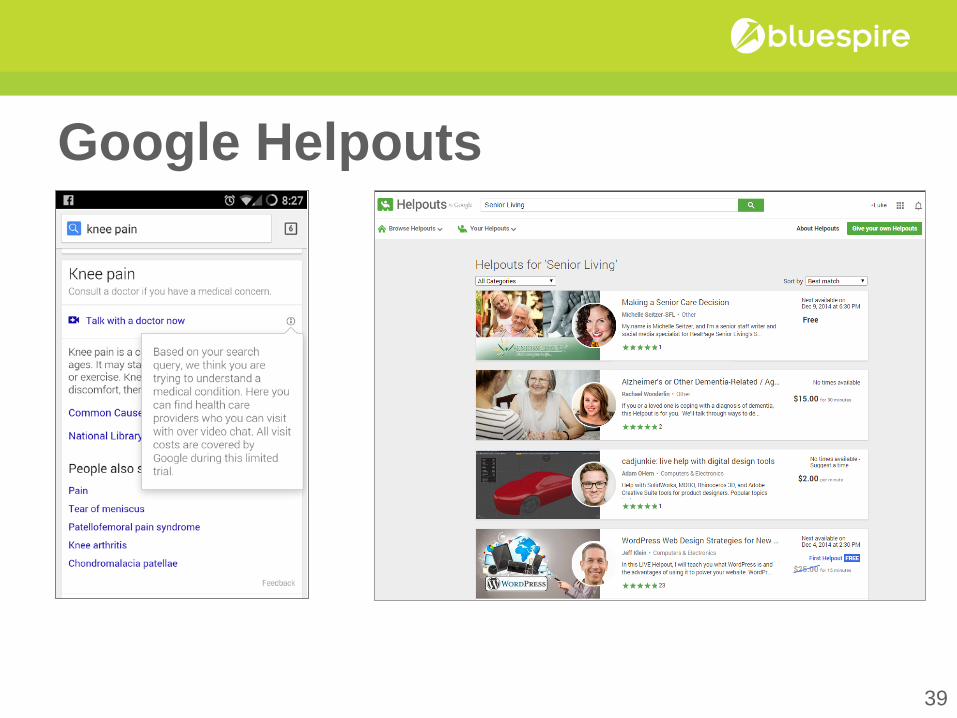
Google Helpouts
39
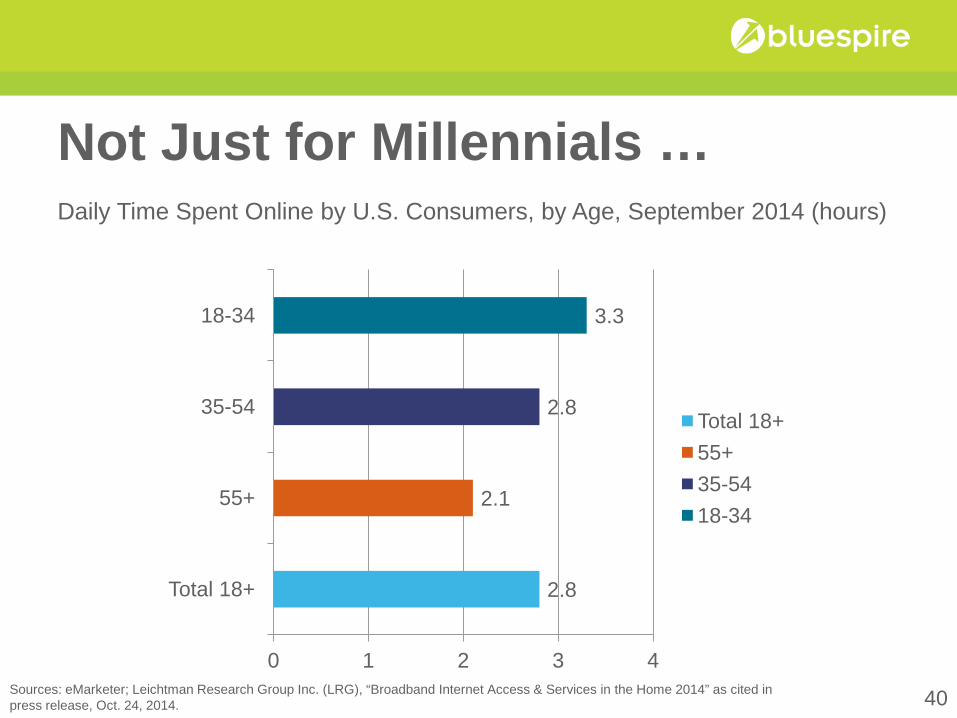
Not Just for Millennials … Daily Time Spent Online by U.S. Consumers, by Age, September 2014 (hours)
Sources: eMarketer; Leichtman Research Group Inc. (LRG), “Broadband Internet Access & Services in the Home 2014” as cited in press release, Oct. 24, 2014.
2.8
2.1
2.8
3.3
0 1 2 3 4
Total 18+
55+
35-54
18-34
Total 18+ 55+ 35-54 18-34
40
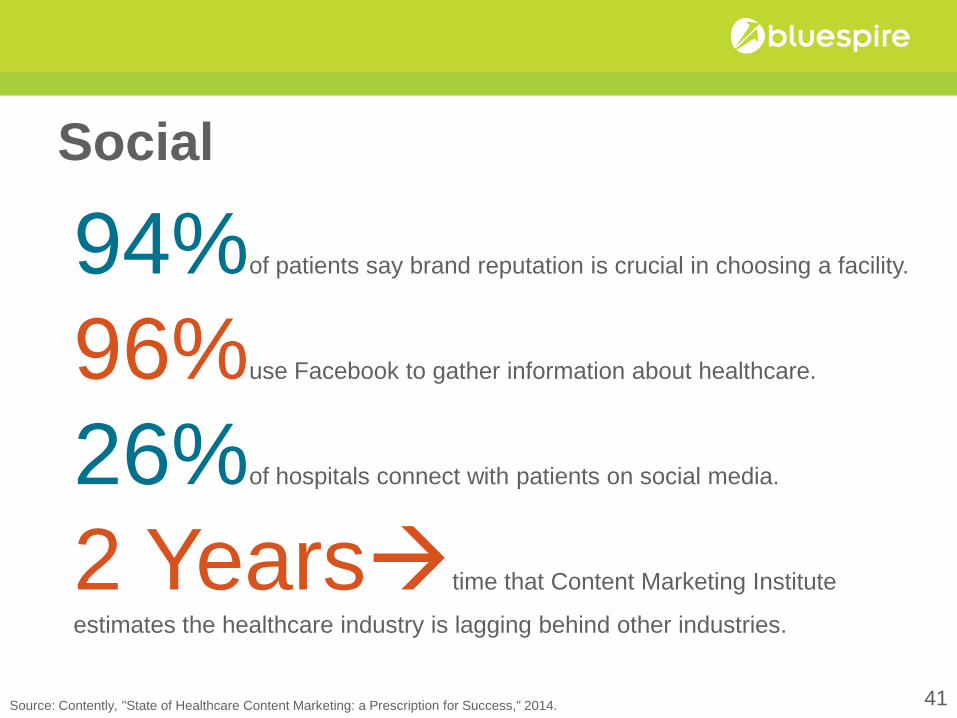
Social
94%of patients say brand reputation is crucial in choosing a facility.
96%use Facebook to gather information about healthcare.
26%of hospitals connect with patients on social media.
2 Yearstime that Content Marketing Institute
estimates the healthcare industry is lagging behind other industries.
Source: Contently, "State of Healthcare Content Marketing: a Prescription for Success," 2014. 41
CONTENT
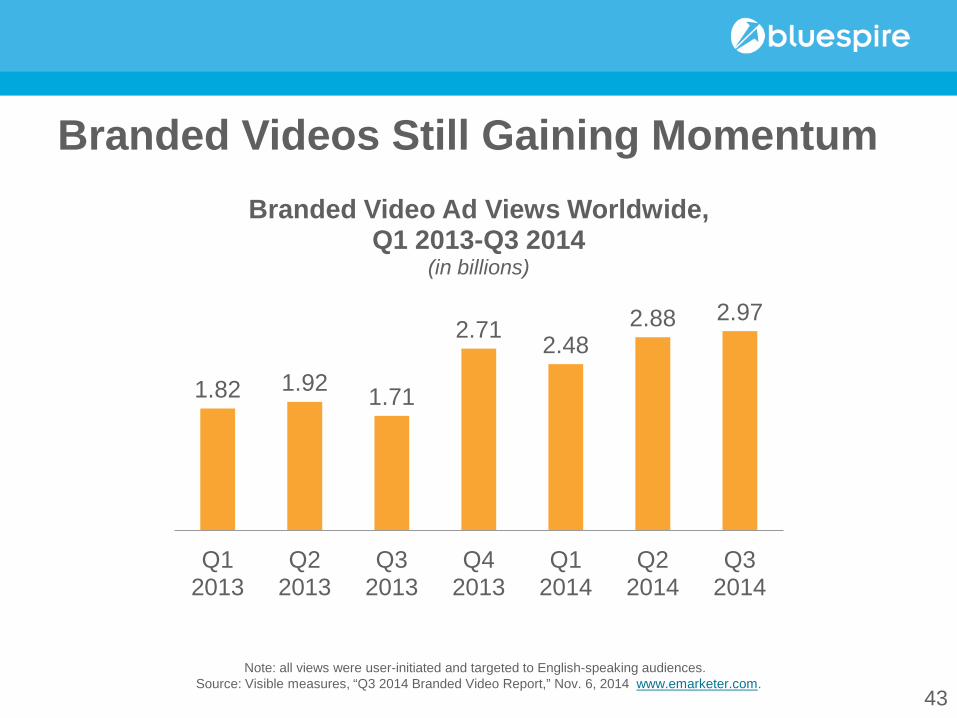
Branded Videos Still Gaining Momentum
43
1.82 1.92 1.71
2.71 2.48 2.88 2.97
Q1 2013
Q2 2013
Q3 2013
Q4 2013
Q1 2014
Q2 2014
Q3 2014
Branded Video Ad Views Worldwide, Q1 2013-Q3 2014
(in billions)
Note: all views were user-initiated and targeted to English-speaking audiences. Source: Visible measures, “Q3 2014 Branded Video Report,” Nov. 6, 2014 www.emarketer.com.
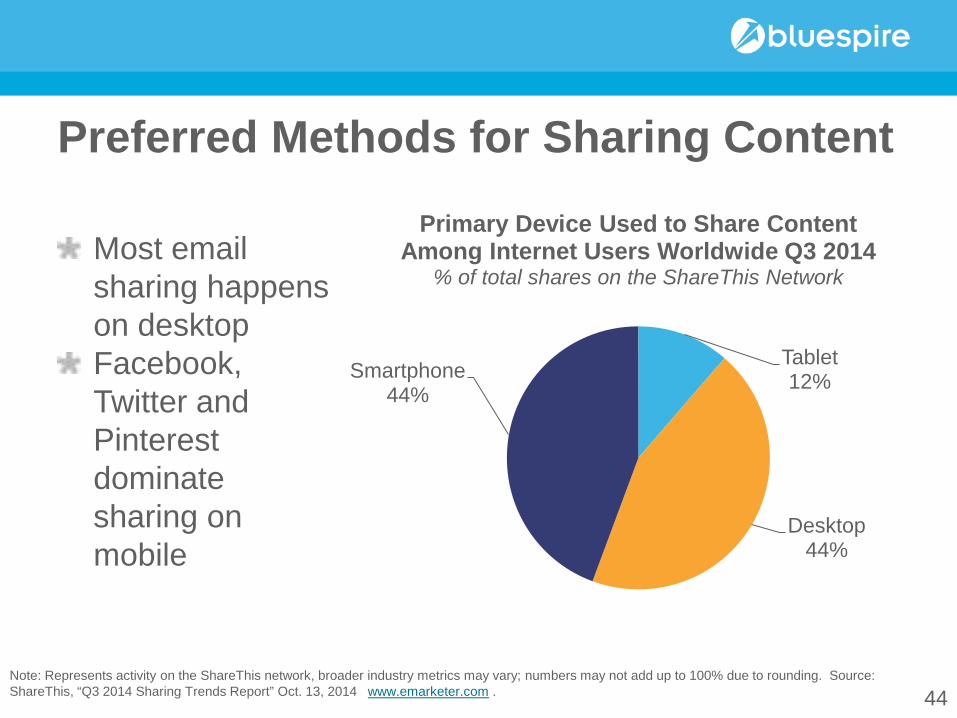
Preferred Methods for Sharing Content
44
Most email sharing happens on desktop Facebook, Twitter and Pinterest dominate sharing on mobile
Tablet 12%
Desktop 44%
Smartphone 44%
Primary Device Used to Share Content Among Internet Users Worldwide Q3 2014
% of total shares on the ShareThis Network
Note: Represents activity on the ShareThis network, broader industry metrics may vary; numbers may not add up to 100% due to rounding. Source: ShareThis, “Q3 2014 Sharing Trends Report” Oct. 13, 2014 www.emarketer.com .
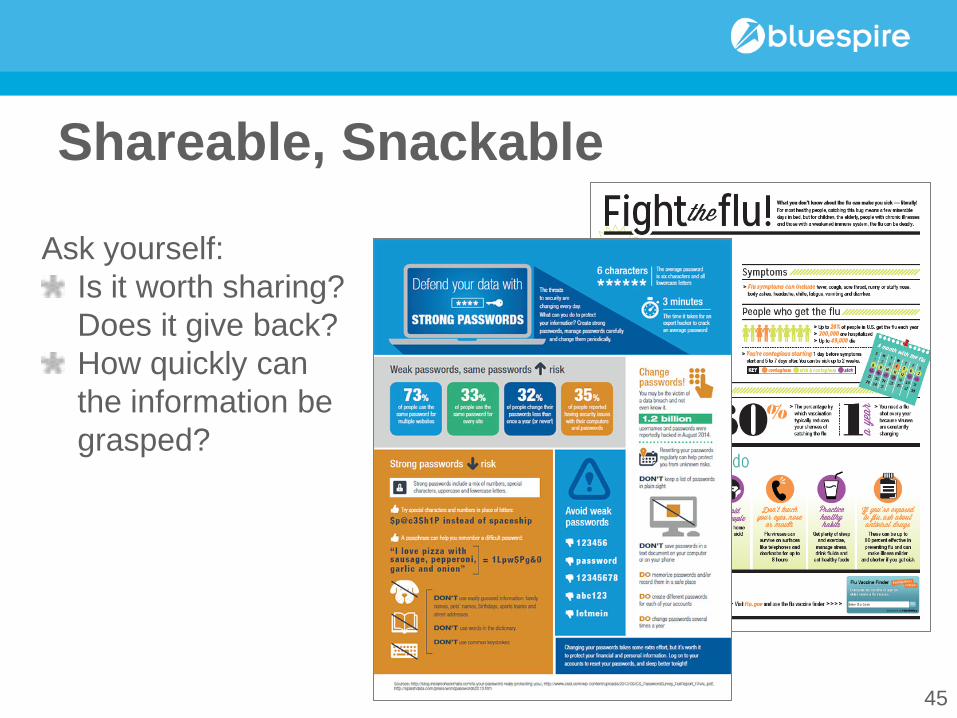
Shareable, Snackable
45
Ask yourself: Is it worth sharing? Does it give back? How quickly can the information be grasped?
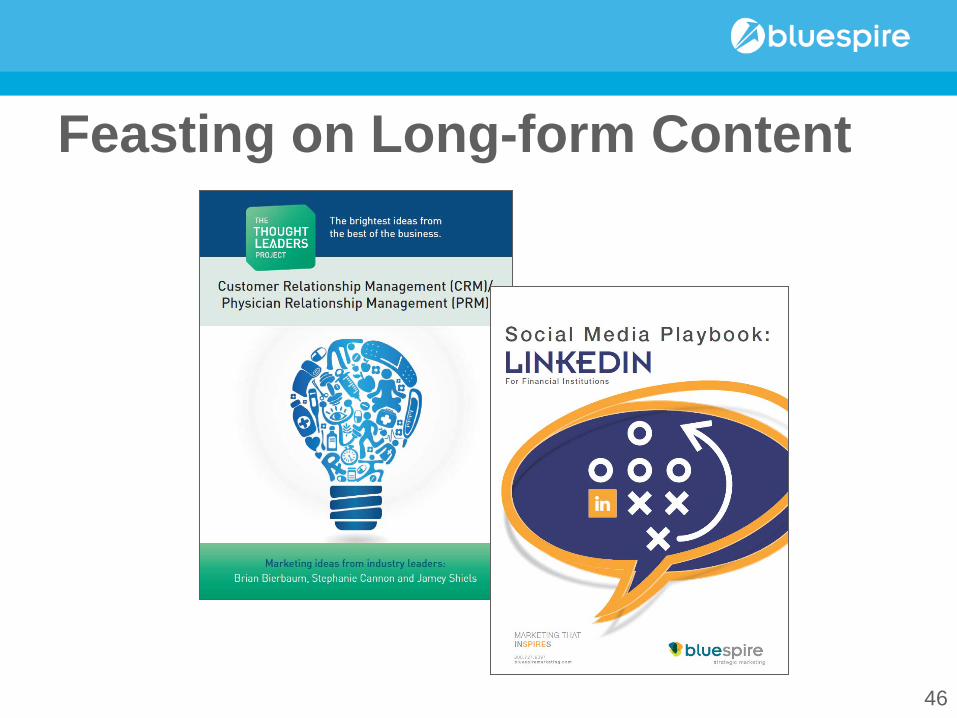
Feasting on Long-form Content
46
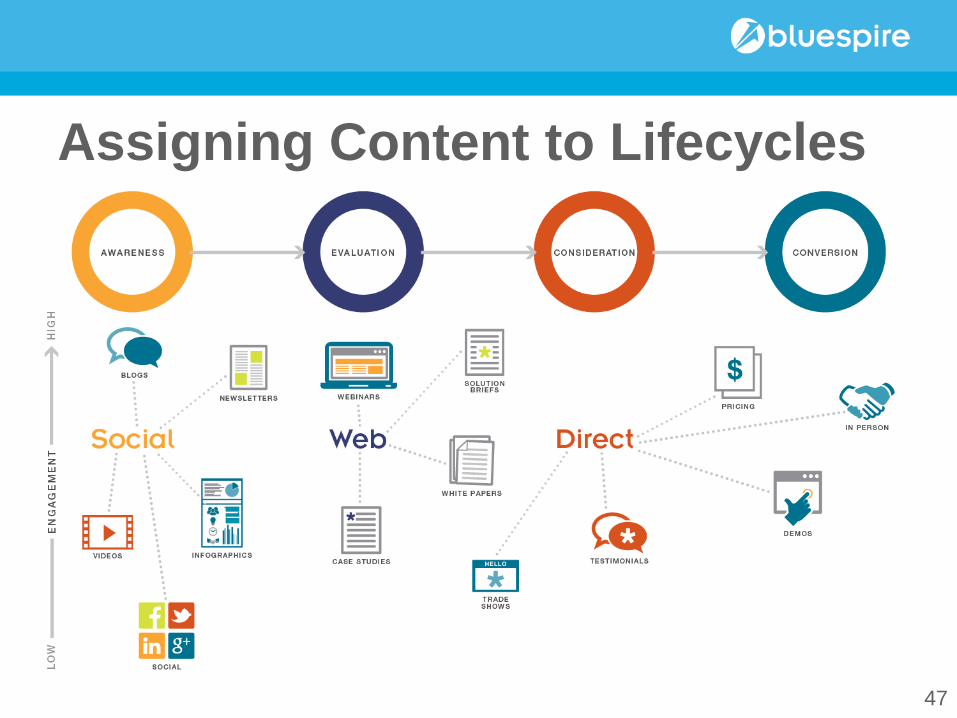
Assigning Content to Lifecycles
47

CLOSING THOUGHTS
Senior Living Challenge to maintain sustainable market presence with limited budgets to reach all audiences Marketing’s ultimate success dependant on good sales staff Metrics have changed post-recession: more leads generate same number of sales
Traditional media is losing effectiveness Robust online marketing effort integrated with offline (direct mail) are key to success
Goal should always be for marketing to create preference not just awareness
49
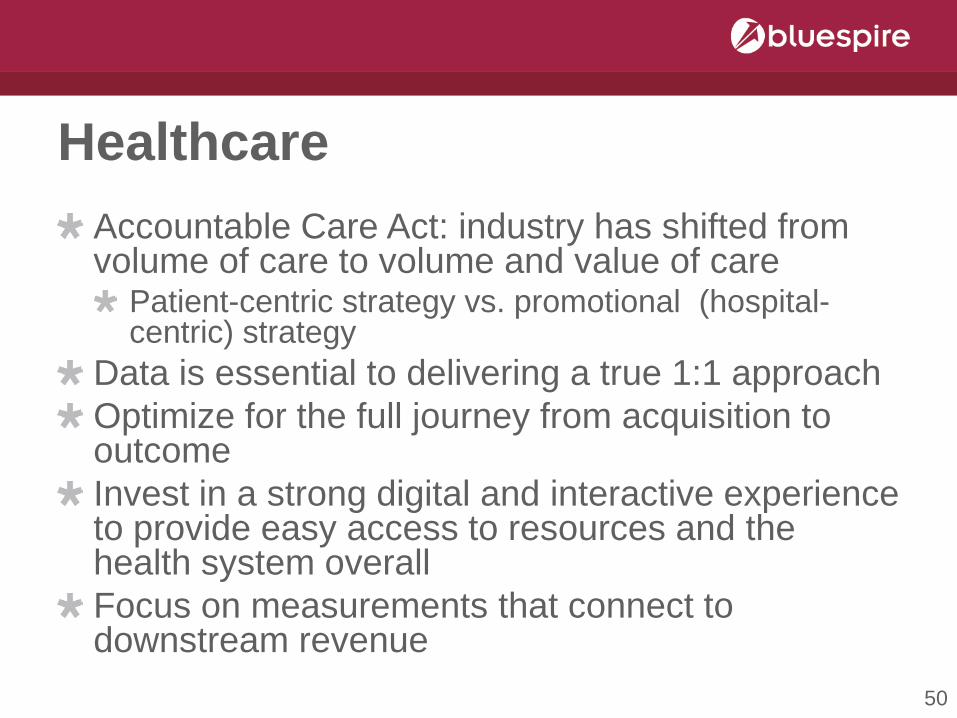
Healthcare Accountable Care Act: industry has shifted from volume of care to volume and value of care
Patient-centric strategy vs. promotional (hospital-centric) strategy
Data is essential to delivering a true 1:1 approach Optimize for the full journey from acquisition to outcome Invest in a strong digital and interactive experience to provide easy access to resources and the health system overall Focus on measurements that connect to downstream revenue
50
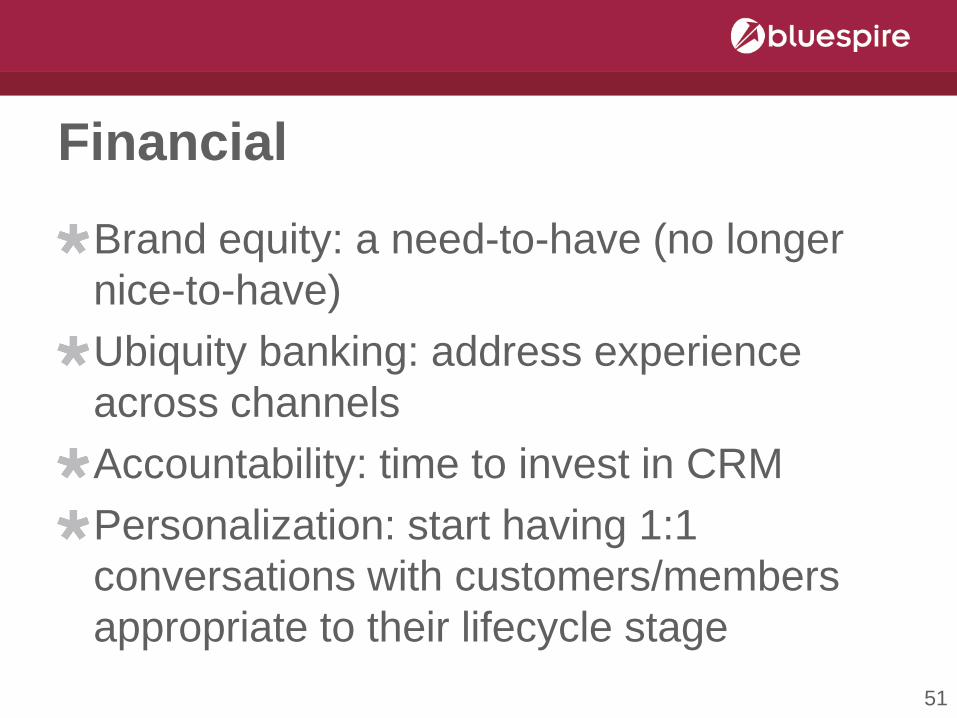
Financial
Brand equity: a need-to-have (no longer nice-to-have) Ubiquity banking: address experience across channels Accountability: time to invest in CRM Personalization: start having 1:1 conversations with customers/members appropriate to their lifecycle stage 51
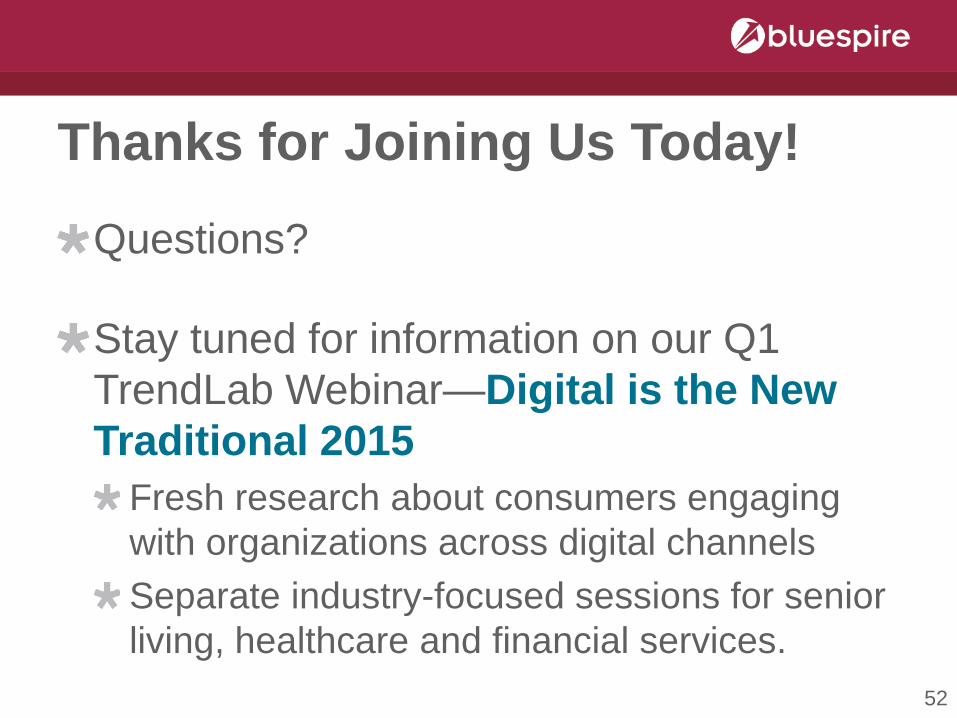
Thanks for Joining Us Today!
Questions?
Stay tuned for information on our Q1 TrendLab Webinar—Digital is the New Traditional 2015
Fresh research about consumers engaging with organizations across digital channels Separate industry-focused sessions for senior living, healthcare and financial services.
52