Embed Size (px)
Citation preview

1
Company Presentation
July 28, 2015
2
Forward-Looking Statements
Certain statements and information in this presentation may constitute “forward-looking statements” within the meaning of the Private Securities Litigation Reform Act of 1995. The words “anticipate,” “believe,” “estimate,” “expect,” “forecast,” “plan,” “predict,” “target,” “project,” “could,” “should,” “would” or similar words are intended to identify forward-looking statements, which are generally not historical in nature. Statements concerning well drilling and completion costs assume a development mode of operation; additionally, estimates of future capital expenditures, production volumes, reserve volumes, reserve values, resource potential, resource potential including future ethane extraction, number of development and exploration projects, finding costs, operating costs, overhead costs, cash flow, NPV10, EUR and earnings are forward-looking statements. Our forward looking statements, including those listed in the previous sentence are based on our assumptions concerning a number of unknown future factors including commodity prices, recompletion and drilling results, lease operating expenses, administrative expenses, interest expense, financing costs, and other costs and estimates we believe are reasonable based on information currently available to us; however, our assumptions and the Company’s future performance are both subject to a wide range of risks including, production variance from expectations, the volatility of oil and gas prices, the results of our hedging transactions, the need to develop and replace reserves, the costs and results of drilling and operations, the substantial capital expenditures required to fund operations, exploration risks, competition, our ability to implement our business strategy, the timing of production, mechanical and other inherent risks associated with oil and gas production, weather, the availability of drilling equipment, changes in interest rates, access to capital, litigation, uncertainties about reserve estimates, environmental risks and regulatory changes, and there is no assurance that our projected results, goals and financial projections can or will be met. This presentation includes certain non-GAAP financial measures. Reconciliation and calculation schedules for the non-GAAP financial measures can be found on our website at www.rangeresources.com.
The SEC permits oil and gas companies, in filings made with the SEC, to disclose proved reserves, which are estimates that geological and engineering data demonstrate
with reasonable certainty to be recoverable in future years from known reservoirs under existing economic and operating conditions as well as the option to disclose probable and possible reserves. Range has elected not to disclose the Company’s probable and possible reserves in its filings with the SEC. Range uses certain broader terms such as "resource potential," or "unproved resource potential,” "upside" and “EURs per well” or other descriptions of volumes of resources potentially recoverable through additional drilling or recovery techniques that may include probable and possible reserves as defined by the SEC's guidelines. Range has not attempted to distinguish probable and possible reserves from these broader classifications. The SEC’s rules prohibit us from including in filings with the SEC these broader classifications of reserves. These estimates are by their nature more speculative than estimates of proved, probable and possible reserves and accordingly are subject to substantially greater risk of being actually realized. Unproved resource potential refers to Range's internal estimates of hydrocarbon quantities that may be potentially discovered through exploratory drilling or recovered with additional drilling or recovery techniques and have not been reviewed by independent engineers. Unproved resource potential does not constitute reserves within the meaning of the Society of Petroleum Engineer's Petroleum Resource Management System and does not include proved reserves. Area wide unproven, unrisked resource potential has not been fully risked by Range's management. “EUR,” or estimated ultimate recovery, refers to our management’s estimates of hydrocarbon quantities that may be recovered from a well completed as a producer in the area. These quantities may not necessarily constitute or represent reserves within the meaning of the Society of Petroleum Engineer’s Petroleum Resource Management System or the SEC’s oil and natural gas disclosure rules. Actual quantities that may be recovered from Range's interests could differ substantially. Factors affecting recovery include the scope of Range's drilling program, which will be directly affected by the availability of capital, drilling and production costs, commodity prices, availability of drilling services and equipment, drilling results, lease expirations, transportation constraints, regulatory approvals, field spacing rules, recoveries of gas in place, length of horizontal laterals, actual drilling results, including geological and mechanical factors affecting recovery rates and other factors. Estimates of resource potential may change significantly as development of our resource plays provides additional data. In addition, our production forecasts and expectations for future periods are dependent upon many assumptions, including estimates of production decline rates from existing wells and the undertaking and outcome of future drilling activity, which may be affected by significant commodity price declines or drilling cost increases.
Readers are cautioned not to place undue reliance on forward-looking statements, which speak only as of the date hereof. We undertake no obligation to publicly update
or revise any forward-looking statements after the date they are made, whether as a result of new information, future events or otherwise. Investors are urged to consider closely the disclosure in our most recent Annual Report on Form 10-K, available from our website at www.rangeresources.com or by written request to 100 Throckmorton Street, Suite 1200, Fort Worth, Texas 76102. You can also obtain the Form 10-K by calling the SEC at 1-800-SEC-0330.

3
Large Scale Growth Story with Low Cost and Low Risk
1. Largest acreage position in core of Marcellus, Upper Devonian and Utica
2. Unit costs down over 40% since 2008
3. Marcellus well costs down 57% or more on a per lateral foot basis
4. Continued efficiencies expected from technical improvements, stacked pay acreage and drilling in areas of existing infrastructure
5. Disciplined financial approach and liquidity supports development plans
Focused on PER SHARE GROWTH of production and reserves at top-quartile or better cost structure

4
Company Positions
Total Reserves (tcfe)
Breakeven (US$/mcf)
Range 30.00 2.62 Rex 3.19 2.66
Cabot 18.18 2.71
EQT 15.84 2.74
Antero Resources 23.87 2.88
Chesapeake 31.03 2.93
Statoil 21.46 2.98
Rice Energy 4.83 3.26
Seneca 4.69 3.33
Reliance 5.19 3.36
Enerplus 2.58 3.45
Mitsui 5.57 3.46
Anadarko 13.32 3.46
Chevron 17.89 3.47
Southwestern 9.83 3.55
Carrizo 0.17 3.60
EOG 1.05 3.65
Chief 9.88 3.67
Noble 17.80 3.68
CONSOL 16.44 3.73
WPX 2.00 3.90
MHR 2.93 3.99
Talisman 5.14 4.49
PDC 0.78 4.51
Ultra 0.84 4.65
Shell 2.89 4.72
ExxonMobil 6.08 4.94
BG 0.28 5.04
EXCO 0.28 5.04
Range: Low-Cost, Large Scale
Range has both highest net risked resource and lowest breakeven cost in
the Marcellus per Wood Mackenzie
Source = Wood Mackenzie Marcellus Shale only

5
Range is Focused on Per Share Growth, on a Debt-Adjusted Basis
• Production/share = annual production divided by debt-adjusted year-end diluted shares outstanding
• Reserves/share = year-end proven reserves divided by debt-adjusted year-end diluted shares outstanding
Reserves/share – debt adjusted Production/share – debt adjusted
Mcf
e/sh
are
Mcf
e/sh
are
2014 Increase of 27% 2014 Increase of 29%
-
0.50
1.00
1.50
2.00
2.50
3.00
2010 2011 2012 2013 2014 -
10.00
20.00
30.00
40.00
50.00
60.00
70.00
2010 2011 2012 2013 2014

6
SW/NE Pennsylvania Stacked Pays
Upper Devonian
330,000 195,000 525,000 330,000 310,000 640,000 - 400,000 400,000 660,000 905,000 1,565,000
Stacked pays allow for multiple development opportunities at 1,000 foot spacing between wells and later with 500 foot spacing prospective on most acreage
Marcellus
Utica/Point Pleasant
Wet Acreage
Dry Acreage
Total Net
Acreage
(1)
(1) Excludes Northwest PA - 285,000 net acres, largely HBP

7
$-
$0.50
$1.00
$1.50
$2.00
$2.50
$3.00
$3.50
$4.00
$4.50
Driving Down Unit Costs $/
mcf
e
(1) Three-year average of drill bit F&D costs, excluding acreage
2008 2009 2010 2011 2012 2013 2014 2015E Reserve Replacement(1) $1.64 $1.25 $0.83 $0.68 $0.68 $0.66 $0.59 $0.56
LOE (2) $0.99 $0.82 $0.72 $0.60 $0.41 $0.36 $0.35 $0.30
Prod. taxes $0.39 $0.20 $0.19 $0.14 $0.15 $0.13 $0.10 $0.09
G&A (2) $0.49 $0.51 $0.55 $0.56 $0.46 $0.42 $0.35 $0.31
Interest $0.71 $0.74 $0.73 $0.69 $0.61 $0.51 $0.40 $0.33
Trans. & Gathering (2) $0.08 $0.32 $0.40 $0.62 $0.70 $0.75 $0.76 $0.83 (3)
Total $4.30 $3.84 $3.42 $3.29 $3.01 $2.84 $2.55 $2.42
$0.00
(2) Excludes non-cash stock compensation (3) Includes additional NGL & natural gas firm transport agreements & propane transport cost previously netted against NGL revenue. Incremental natural gas & NGL revenue will more than offset the 2015 increase in transport expense

8
Sustained Growth with Improving Capital Efficiency
Growth achieved despite reducing capital, demonstrating improved efficiency
* 2015 estimated production assuming announced target of 20% production growth and capital budget of $870 million
$-
$5
$10
$15
$20
$25
$30
0
250
500
750
1,000
1,250
1,500
2011 2012 2013 2014 2015E*
$ C
apex
per
Incr
emen
tal m
cfe
Prod
uctio
n
Prod
uctio
n (m
mcf
epd)
Production (mmcfepd) $ Capex per Incremental mcfe Production

9
1,500
2,500
3,500
4,500
5,500
6,500
2011 2012 2013 2014 2015
Average Lateral Length
$200
$400
$600
$800
$1,000
$1,200
2011 2012 2013 2014 2015
Drilling Cost/Lateral Length (includes vertical)
$400
$600
$800
$1,000
$1,200
2011 2012 2013 2014 2015
Completion Cost/Lateral Length
$700
$1,000
$1,300
$1,600
$1,900
$2,200
$2,500
2011 2012 2013 2014 2015
Well Cost/Lateral Length
Cost & Efficiency Improvements – SW Pennsylvania

10
1,000
2,000
3,000
4,000
5,000
6,000
2011 2012 2013 2014 2015
Average Lateral Length
$600
$900
$1,200
$1,500
$1,800
$2,100
$2,400
2011 2012 2013 2014 2015
Well Cost / Lateral Length
$200
$400
$600
$800
$1,000
2011 2012 2013 2014 2015
Drilling Cost/Lateral Length (includes vertical)
$300
$600
$900
$1,200
$1,500
2011 2012 2013 2014 2015
Completion Cost/Lateral Length
Cost & Efficiency Improvements – NE Pennsylvania

11
Disciplined Financial Approach
Strong, Simple Balance Sheet • Bank debt, long-term bonds and common stock • No near term maturities, first bond maturity in 2021, after the expected call of 2020’s. Bank credit
facility matures in 2019 • Recent 4.875% senior notes offering met with strong investor demand, resulting in the
lowest yield achieved by any non-investment grade issuer in 2015 • Liquidity of $1.5 billion under commitment amount at end of Q2
Solid Hedge Position • Range hedges a significant portion of projected upcoming 12 months of production • 2H15 Gas is over 85% hedged at an average floor of $3.70 • 2H15 Oil is approximately 90% hedged at a floor of $85.87 • 2H15 NGLs are over 60% hedged
Debt Metrics • Debt trades at or near investment grade • Annual borrowing base unanimously approved • Debt Covenants with ample flexibility:
• EBITDAX/Interest expense - minimum of 2.5x • PV9 proved reserves value to debt - minimum of 1.5x
Well Structured Bank Credit Facility • 29 banks with no bank holding more than 6% of total • Commitment amount of $2.0 billion; current borrowing base of $3.0 billion

12
$-
$5,000
$10,000
$15,000
$20,000
$25,000
$30,000
2010 2011 2012 2013 2014
0.0x
1.0x
2.0x
3.0x
4.0x
5.0x
6.0x
7.0x
8.0x
2010 2011 2012 2013 2014
A History of Strong Credit Metrics
Debt / Production ($/boepd)
EBITDAX / Interest
Moody’s Investment Grade Range
• Range has a long history of disciplined financial management
• Strong EBITDAX coverage of interest expense evidences the low cost structure and Range’s resiliency
• While developing an unrivaled project inventory in terms of size and scale, Range has consistently grown production while prudently managing debt
• Debt/Production is consistent with Moody’s Investment Grade rankings

13
0.0x
2.0x
4.0x
6.0x
8.0x
10.0x
12.0x
14.0x
16.0x
18.0x
2010 2011 2012 2013 2014
Long Life Reserves Enhances Credit Profile Proved Developed Reserves / Production
Debt / Proved Developed ($/mcfe)
The peer group is comprised of companies in the GICS Oil & Gas Exploration & Production sub-industry with a corporate family rating between Ba3 and Ba1 from Moody’s and between BB- and BB+ from S&P.
BB / Ba Peer Avg for 2014
• With a best-in-class reserve life index, Range’s low production decline provides more stable cash flow and both low capital reinvestment and low reinvestment risk
• Low production decline also allows Range to grow more efficiently
• Proved developed reserves provide exceptional coverage of debt at levels consistent with high investment grade measures
$-
$0.25
$0.50
$0.75
$1.00
$1.25
$1.50
$1.75
2010 2011 2012 2013 2014
Moody’s Investment
Grade Range
Range well above the average

14
Gas In Place (GIP) Analysis Shows Greatest Potential in SW PA
Note: Townships where Range holds ~3,000 or more acres (as of 12/31/2014), and estimated as prospective, are outlined green. GIP – Range estimates.
When GIP analysis from the Marcellus, Upper Devonian and Point Pleasant are
combined, the largest stacked pay resource is located in SW PA where Range
has concentrated its acreage position

15
Additional Upside – Utica/Point Pleasant
• Producing on an interruptible basis into existing wet gas gathering system
• 1 well currently completing
• 1 well planned to be drilled in late 2015
• 400,000 net acres in SW PA prospective
• Core analysis and petrographic analysis show RRC Claysville well has high GIP
• Range has 20% to 40% more GIP than best areas in eastern Ohio
24 hour IP of 59 Mmcf/d at Claysville Sportsman’s Club 11H
Note: Townships where Range holds ~3,000 or more acres are shown outlined above (As of 12/31/2014)
OH PA
WV

16
SW Super-Rich SW Wet SW Dry NE Dry
EUR 12.9 Bcfe 1,169 Mbbls & 5.9 Bcf
17.6 Bcfe 1,501 Mbbls & 8.6 Bcf
17.1 Bcf 15.2 Bcf
EUR/1,000 ft. lateral 2.40 Bcfe 2.95 Bcfe 2.52 Bcf 2.67 Bcf
EUR/stage 477 Mmcfe 586 Mmcfe 504 Mmcf 542 Mmcf
Well Cost $5.9 MM $5.9 MM $6.0 MM $4.9 MM
Cost/1,000 ft. lateral $1,099 K $991 K $883 K $865 K
Stages 27 30 34 28
Lateral Length 5,367 ft. 5,955 ft. 6,798 ft. 5,663 ft.
IRR – Strip (as of 6/30/2015)
26% 28% 60% 64%
IRR – $4.00 33% 38% 101% 140%
Range Marcellus – 2015 Well Economic Summary
The different Marcellus areas provide optionality and a balanced approach to developing acreage and growing overall Marcellus production
See appendix for complete assumptions and data on each area

17
Range’s Natural Gas Liquids Provide Revenue Uplift
$3.19
$2.00
$1.40 - $1.50
$0.00
$0.50
$1.00
$1.50
$2.00
$2.50
$3.00
$3.50
$4.00
Unprocessed Gas Processed Gas - EthaneExtraction
Gas (1055 Btu) 24% shrink
NGLs (C2+)
$3.40 - $3.50
Gas (1275 Btu)
$/Wellhead Gas
Assumptions: $3.00 NYMEX Gas, Local NG differential ($0.50) , $55.00 WTI, 30% WTI (C3+), 5.50 GPM (ethane extraction), processing and transport costs included. Based on SWPA wet gas quality (1,275 processing plant inlet Btu). Based on full utilization of current ethane/propane agreements.
NOTE: Wet Gas (Ethane Extraction) equals 1.54 mcfe.
Projected – After Mariner East I fully operational
• Range is one of the largest NGL producer in Appalachia, (56,000 bpd in 2Q15) with the highest Btu inlet gas
• Higher Btu gas receives increased uplift as it contains heavier NGLs
• In 2nd half of 2015, over
85% of ethane is expected to be priced off gas or oil-linked indices, rather than Mont Belvieu ethane index
• This revenue uplift is unique to Range’s contracts

18
Two Key Marketing Events
Spectra - Uniontown to Gas City Pipeline
• Moves ~200 Mmcf/day of Range gas production as anchor shipper from local Appalachia M2 to Midwest markets
• Under current strip prices this project is expected to capture an uplift of approximately $1.00 per Mmbtu in September and $0.75 to $1.00 in 4Q
• Starts August 1, 2015
Mariner East I
• Range has 20,000 barrels per day of ethane and 20,000 barrels per day of propane transportation to Marcus Hook
• Access (80%) to 1 million barrels of propane cavern storage at Marcus Hook
• Net increase in cash flow from Mariner East I, Mariner West and ATEX of ~$90 million per year, when all are fully operational
• Commissioning starts late 3Q 2015
19
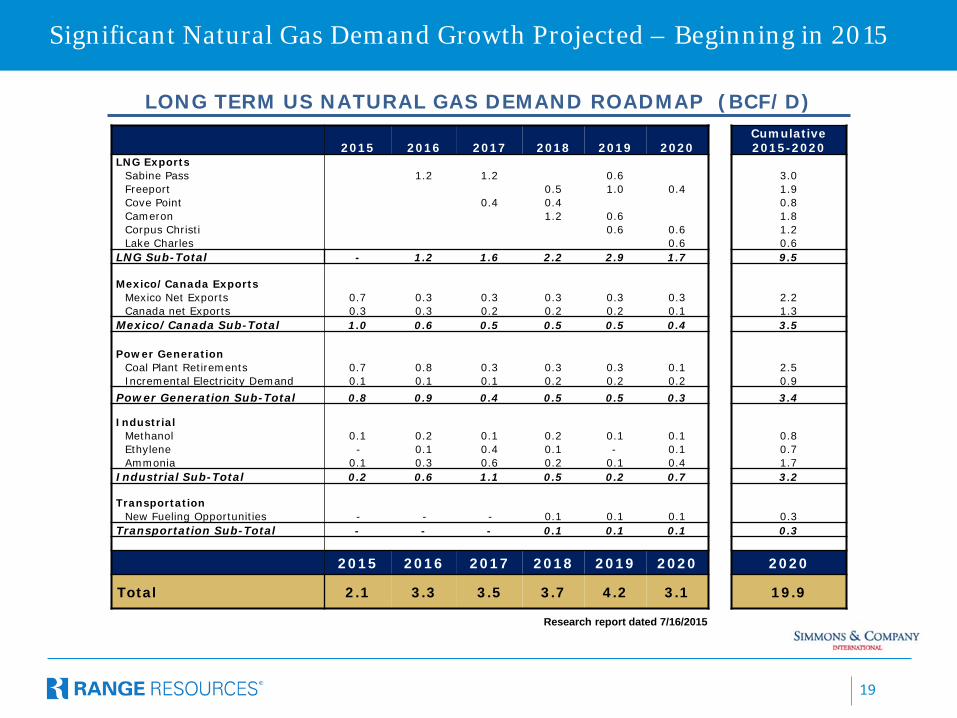
Significant Natural Gas Demand Growth Projected – Beginning in 2015
LONG TERM US NATURAL GAS DEMAND ROADMAP (BCF/D)
Research report dated 7/16/2015
2015 2016 2017 2018 2019 2020 Cumulative 2015-2020
LNG Exports Sabine Pass 1.2 1.2 0.6 3.0 Freeport 0.5 1.0 0.4 1.9 Cove Point 0.4 0.4 0.8 Cameron 1.2 0.6 1.8 Corpus Christi 0.6 0.6 1.2 Lake Charles 0.6 0.6
LNG Sub-Total - 1.2 1.6 2.2 2.9 1.7 9.5
Mexico/Canada Exports Mexico Net Exports 0.7 0.3 0.3 0.3 0.3 0.3 2.2 Canada net Exports 0.3 0.3 0.2 0.2 0.2 0.1 1.3
Mexico/Canada Sub-Total 1.0 0.6 0.5 0.5 0.5 0.4 3.5
Power Generation Coal Plant Retirements 0.7 0.8 0.3 0.3 0.3 0.1 2.5 Incremental Electricity Demand 0.1 0.1 0.1 0.2 0.2 0.2 0.9
Power Generation Sub-Total 0.8 0.9 0.4 0.5 0.5 0.3 3.4
Industrial Methanol 0.1 0.2 0.1 0.2 0.1 0.1 0.8 Ethylene - 0.1 0.4 0.1 - 0.1 0.7 Ammonia 0.1 0.3 0.6 0.2 0.1 0.4 1.7
Industrial Sub-Total 0.2 0.6 1.1 0.5 0.2 0.7 3.2
Transportation New Fueling Opportunities - - - 0.1 0.1 0.1 0.3
Transportation Sub-Total - - - 0.1 0.1 0.1 0.3
2015 2016 2017 2018 2019 2020 2020
Total 2.1 3.3 3.5 3.7 4.2 3.1 19.9

20
U.S. Gas Production Growth Has Slowed
• ~16 Bcf per day of associated gas with oil plays
• ~8 Bcf per day of associated gas with shale oil plays
• Capital budgets in oil plays typically reduced by 40-50%
• Oil rig count down 60%
• First year decline on horizontal shale oil wells ~80%
Lower Oil Prices will Affect Gas Production
Marcellus-Utica Natural Gas Production Growth Slowing
• Capital budgets typically reduced 40-50%
• Rig count down 66% in Utica and 55% in Marcellus
• Continuing infrastructure constraints in NE PA where production has been flat for extended time

21 21
Natural Gas Production Flattening
Source - ITG IR, Ventyx & Bloomberg
0
2
4
6
8
10
12
14
16
18
Jan-
14
Feb-
14M
ar-1
4
Apr
-14
May
-14
Jun-
14
Jul-1
4
Aug
-14
Sep-
14
Oct
-14
Nov
-14
Dec
-14
Jan-
15
Feb-
15M
ar-1
5
Apr
-15
May
-15
Jun-
15
Jul-1
5
BC
F/d
Marcellus Pipeline Flows
Marcellus
58
60
62
64
66
68
70
72
74
Jan-
14Fe
b-14
Mar
-14
Apr
-14
May
-14
Jun-
14Ju
l-14
Aug
-14
Sep-
14O
ct-1
4N
ov-1
4D
ec-1
4Ja
n-15
Feb-
15M
ar-1
5A
pr-1
5M
ay-1
5Ju
n-15
Jul-1
5
Bcf
/d
Estimated Total L48 Gas Pipeline Flows
Estimated Total L48 Gas Pipeline Flows
Lower 48 gas leveling out in 2015 Marcellus production flat in 2015

22 22
20
40
60
80
100
120
140Marcellus Rig Count
0
10
20
30
40
50
60Utica / Point Pleasant Rig Count
• Utica/Point Pleasant rig count down 66% from the peak in 2014
• Marcellus rig count down 55% from the peak in 2014
Appalachian Rig Counts Declining
Source – RigData

23
Range Resources – Concluding Summary
1. Largest acreage position in core of Marcellus, Upper Devonian and Utica
2. Marcellus development has driven down unit costs over 40%; capital costs down 57% or more on a per lateral foot basis
3. Continued efficiencies expected from longer laterals, technical improvements, stacked pay development and drilling in areas of existing infrastructure
4. Strong balance sheet and $1.5 billion of liquidity support planned long-term production growth of 20%-25%

24
Portfolio Detail
Appendix

25
SW PA Super-Rich Area Marcellus Projected 2015 Well Economics
• Southwestern PA – (High Btu case) • EUR / 1,000 ft. – 2.40 Bcfe • EUR – 12.9 Bcfe (182 Mbbls condensate, 987 Mbbls NGLs, and 5.9 Bcf gas)
• Drill and Complete Capital – $5.9 MM, ($1,099 K per 1,000 ft.)
• Average Lateral Length – 5,367 ft.
• F&D – $0.55/mcfe Strip pricing NPV10 = $5.2 MM
NYMEX Gas Price
12.9 Bcfe
Strip - 26%
$3.00 - 26%
$4.00 - 33%
Estimated Cumulative Recoveries for 2015 TIL Forecast
Condensate (Mbbls)
Residue (Mmcf)
NGL w/ Ethane (Mbbls)
1 Year 39 533 90
2 Years 59 920 155
3 Years 74 1,253 211
5 Years 97 1,810 304
10 Years 129 2,836 477
20 Years 157 4,159 699
EUR 182 5,872 987
• Price includes current and expected differentials less gathering, transportation and processing costs
• For flat pricing, oil price assumed to be $55/bbl for 2015, $65/bbl for 2016 then $75/bbl to life with no escalation
• NGL price includes ethane contracts plus escalation
• Strip dated 06/30/15 with 10 year
average $65.87/bbl and $3.58/mcf

26
0
500
1,000
1,500
2,000
2,500
3,000
0 50 100 150 200 250 300 350 400
Nor
mal
ized
Mcf
e/D
ay p
er 1
,000
ft.
Days
Southwest PA - Super-Rich Area 2015 Turn in Line Forecast
2014 Actual Production 2014-15 Unrestricted Type Curve 2015 Forecasted Production
Improvements Between Years
EUR
(Bcfe) Well Costs
($ MM) Lateral
Lengths (ft.)
2014 Type Curve - Drilling 12.3 $6.8 5,300
2015 Type Curve - TIL 12.9 $5.9 5,367
System designed to maximize project economics

27
Southwest PA – Super Rich Marcellus
5
10
15
20
25
30
2013 2014 2015
Stag
es
Average Number of Stages
0.0
0.5
1.0
1.5
2.0
2.5
3.0
2013 2014 2015
EUR
(Bcf
e)/1
,000
ft.
EUR per 1,000 ft.
0.02.04.06.08.0
10.012.014.0
2013 2014 2015
EUR
(Bcf
e)
EUR by Year
Gas NGLs Condensate
2,000 2,500 3,000 3,500 4,000 4,500 5,000 5,500 6,000
2013Actual
2014Actual
2015Forecast
Feet
Horizontal Length (TIL)
All comparisons based on Turned In Line (TIL) wells for each year

28
SW PA Wet Area Marcellus Projected 2015 Well Economics
• Southwestern PA – (Wet Gas case) • EUR / 1,000 ft. – 2.95 Bcfe • EUR – 17.6 Bcfe (48 Mbbls condensate, 1,453 Mbbls NGLs, and 8.6 Bcf gas)
• Drill and Complete Capital – $5.9 MM, ($991 K per 1,000 ft.)
• Lateral Length – 5,955 ft.
• F&D – $0.41/mcfe • Price includes current and expected differentials less gathering, transportation and processing costs
• For flat pricing, oil price assumed to be
$55/bbl for 2015, $65/bbl for 2016 then $75/bbl to life with no escalation
• NGL price includes ethane contracts plus escalation
• Strip dated 06/30/15 with 10 year average $65.87/bbl and $3.58/mcf
Strip pricing NPV10 = $6.4 MM
NYMEX Gas Price
17.6 Bcfe
Strip - 28%
$3.00 - 26%
$4.00 - 38%
Estimated Cumulative Recoveries for 2015 TIL Forecast
Condensate (Mbbls)
Residue (Mmcf)
NGL w/ Ethane (Mbbls)
1 Year 17 1,035 174 2 Years 26 1,721 290 3 Years 31 2,277 383 5 Years 37 3,154 531
10 Years 43 4,666 786
20 Years 47 6,524 1,098
EUR 48 8,629 1,453

29
0
500
1,000
1,500
2,000
2,500
3,000
3,500
0 50 100 150 200 250 300 350 400
Nor
mal
ized
Mcf
e/D
ay p
er 1
,000
ft.
Days
Southwest PA - Wet Area 2015 Turn in Line Forecast
Improvements Between Years
EUR
(Bcfe) Well Costs
($ MM) Lateral
Lengths (ft.)
2014 Type Curve - Drilling 12.3 $6.1 4,200
2015 Type Curve - TIL 17.6 $5.9 5,955
System designed to maximize project economics
2014 Actual Production 2014-15 Unrestricted Type Curve 2015 Forecasted Production

30
Southwest PA – Wet Marcellus
5
10
15
20
25
30
35
2013 2014 2015
Stag
es
Average Number of Stages
0.0
5.0
10.0
15.0
20.0
2013 2014 2015
EUR
(Bcf
e)
EUR by Year
Gas NGLs Condensate
2,000 2,500 3,000 3,500 4,000 4,500 5,000 5,500 6,000 6,500
2013 2014 2015
Feet
Horizontal Length (TIL)
1.0
1.5
2.0
2.5
3.0
3.5
2013 2014 2015
EUR
(Bcf
e)/1
,000
ft.
EUR per 1,000 ft.
Actual Actual Forecast
All comparisons based on Turned In Line (TIL) wells for each year
31
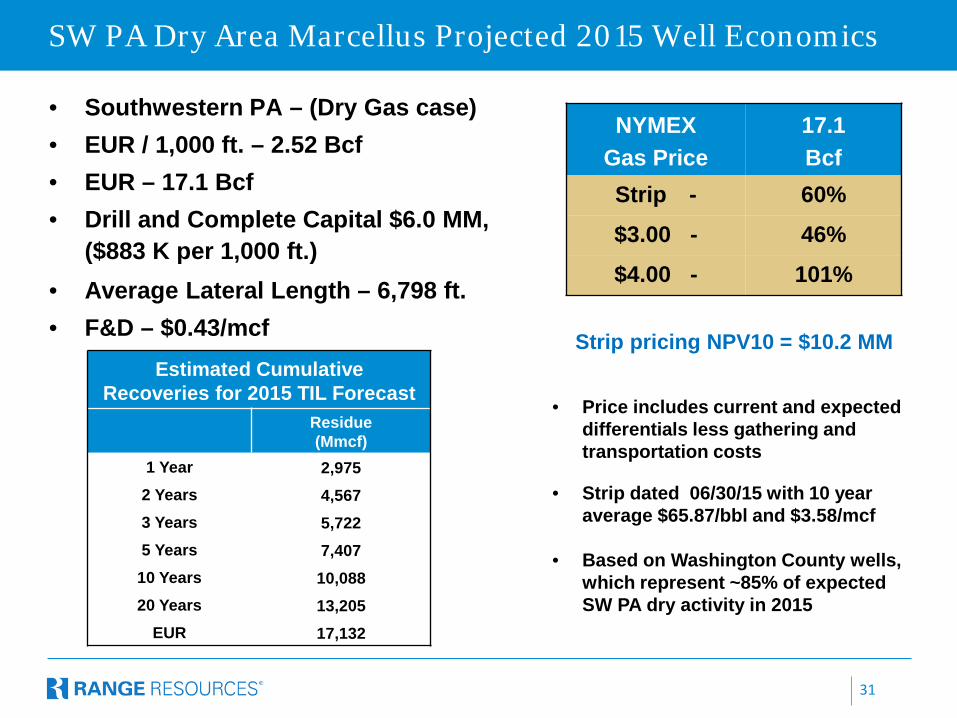
• Southwestern PA – (Dry Gas case) • EUR / 1,000 ft. – 2.52 Bcf • EUR – 17.1 Bcf • Drill and Complete Capital $6.0 MM,
($883 K per 1,000 ft.)
• Average Lateral Length – 6,798 ft. • F&D – $0.43/mcf
Strip pricing NPV10 = $10.2 MM
NYMEX Gas Price
17.1 Bcf
Strip - 60%
$3.00 - 46%
$4.00 - 101%
Estimated Cumulative Recoveries for 2015 TIL Forecast
Residue (Mmcf)
1 Year 2,975 2 Years 4,567 3 Years 5,722 5 Years 7,407
10 Years 10,088 20 Years 13,205
EUR 17,132
• Price includes current and expected differentials less gathering and transportation costs
• Strip dated 06/30/15 with 10 year average $65.87/bbl and $3.58/mcf
• Based on Washington County wells, which represent ~85% of expected SW PA dry activity in 2015
SW PA Dry Area Marcellus Projected 2015 Well Economics

32
0
1,000
2,000
3,000
4,000
5,000
6,000
0 50 100 150 200 250 300 350 400
Nor
mal
ized
Mcf
/Day
per
1,0
00 ft
.
Days
Improvements Between Years
EUR (Bcf)
Well Costs ($ MM)
Lateral Lengths (ft.)
2014 Type Curve - Drilling 13.4 $6.6 5,200
2015 Type Curve - TIL 17.1 $6.0 6,798
System designed to maximize project economics
2014 Actual Production 2014-15 Unrestricted Type Curve 2015 Forecasted Production
Southwest PA – Dry Area 2015 Turn in Line Forecast
Based on Washington County wells, which represent ~85% of expected wells TIL

33
2,000
3,000
4,000
5,000
6,000
7,000
8,000
2013 2014 2015
Feet
Horizontal Length (TIL)
Actual Actual Forecast
5
10
15
20
25
30
35
40
2013 2014 2015
Stag
es
Average Number of Stages
1.0
1.5
2.0
2.5
3.0
2013 2014 2015
EUR
(Bcf
)/1,0
00 ft
.
EUR per 1,000 ft.
0.0
5.0
10.0
15.0
20.0
2013 2014 2015
EUR
(Bcf
)
EUR by Year
Southwest PA – Dry Marcellus
All comparisons based on Turned In Line (TIL) wells for each year

34
• Northeastern PA – (Dry Gas case) • EUR / 1,000 ft. – 2.67 Bcf • EUR – 15.2 Bcf • Drill and Complete Capital $4.9 MM,
($865 K per 1,000 ft.) • Average Lateral Length – 5,663 ft. • F&D – $0.38/mcf
• Price includes current and expected differentials less gathering and transportation costs
• Strip dated 06/30/15 with 10 year average $65.87/bbl and $3.58/mcf
• All 2015 TIL wells are located in Lycoming County
Strip pricing NPV10 = $7.7 MM
NYMEX Gas Price
15.2 Bcf
Strip - 64%
$3.00 - 42%
$4.00 - 140%
Estimated Cumulative Recoveries for 2015 TIL Forecast
Residue (Mmcf)
1 Year 3,282
2 Years 4,735
3 Years 5,725
5 Years 7,123
10 Years 9,302
20 Years 11,823
EUR 15,172
NE PA Dry Area Marcellus Projected 2015 Well Economics

35
0
500
1,000
1,500
2,000
2,500
3,000
3,500
4,000
4,500
0 50 100 150 200 250 300 350 400
Nor
mal
ized
Mcf
/Day
per
1,0
00 ft
.
Days
Improvements Between Years
EUR (Bcf)
Well Costs ($ MM)
Lateral Lengths (ft.)
2014 Type Curve - Drilling 13.1 $4.7 4,800
2015 Type Curve - TIL 15.1 $4.9 5,663
System designed to maximize project economics
2014 Actual Production 2014-15 Unrestricted Type Curve 2015 Forecasted Production
Northeast PA – Dry Area 2015 Turn in Line Forecast

36
2,000 2,500 3,000 3,500 4,000 4,500 5,000 5,500 6,000
2013 2014 2015
Feet
Horizontal Length (TIL)
Actual Actual Forecast 5
10
15
20
25
30
2013 2014 2015
Stag
es
Average Number of Stages
1.0
1.5
2.0
2.5
3.0
2013 2014 2015
EUR
(Bcf
)/1,0
00 ft
.
EUR per 1,000 ft.
0.0
5.0
10.0
15.0
20.0
2013 2014 2015
EUR
(Bcf
)
EUR by Year
Northeast PA – Dry Marcellus
All comparisons based on Turned In Line (TIL) wells for each year

37
0
500
1,000
1,500
2,000
2,500
3,000
1 365 729 1093 1457
Nor
mal
ized
Mcf
e/D
ay p
er 1
,000
ft.
Projects Conducted in the Wet and Super Rich Areas of the Marcellus
Year 1 Year 3 Year 2 Year 4
500 foot spaced wells produced 80% of 1,000 foot spaced wells
over a five year period
Represents Old Completion Methods
Results of Marcellus Tighter Spacing Pilot Projects
Normalized for lateral length
500 ft. Wells 1,000 ft. Wells

38
0
500
1,000
1,500
2,000
2,500
3,000
3,500
0 100 200 300 400 500 600 700
Aver
age
Mcf
e/D
ay p
er 1
,000
ft.
Days On
AVERAGE NORMALIZED TIME ZERO DECLINE CURVES
AVERAGE ORIGINAL TARGETING AVERAGE OPTIMIZED TARGETING
900 ft. spacing
Targeting/Down Spacing Test Results Encouraging
700 ft. spacing
• Optimized targeting shows a ~53% increase in cumulative production after 300 days
• Normalized well costs were $850,000 less for optimized versus original
• No detrimental production impact seen on the original wells
Represents New Optimized Completion Method

39
45%
31%
4% 10%
10%
Weighted Avg. Composite Barrel (1)
Ethane C2Propane C3Iso Butane iC4Normal Butane NC4Natural Gasoline C5+
(1) Based on NGL volumes in 2Q 2015 (2) Based on Mont Belvieu NGL prices and weighted average barrel composition for Marcellus
Marcellus NGL Pricing
Realized Marcellus NGL Prices 2014 2015
1Q 2Q 3Q 4Q 1Q 2Q
NYMEX – WTI (per bbl) $98.61 $102.97 $96.99 $73.11 $48.62 $57.88
Mont Belvieu Weighted Priced Equivalent
$37.22 $33.43 $32.14 $24.38 $17.99 $18.25
Plant Fees plus Diff. (8.02) (9.79) (10.53) (6.77) (7.10) (10.54)
Marcellus average price before NGL hedges
$29.20 $23.64 $21.61 $17.61 $10.89 $7.71
% of WTI (NGL Pre-hedge / Oil NYMEX) 30% 23% 22% 24% 22% 13%
(2)
40
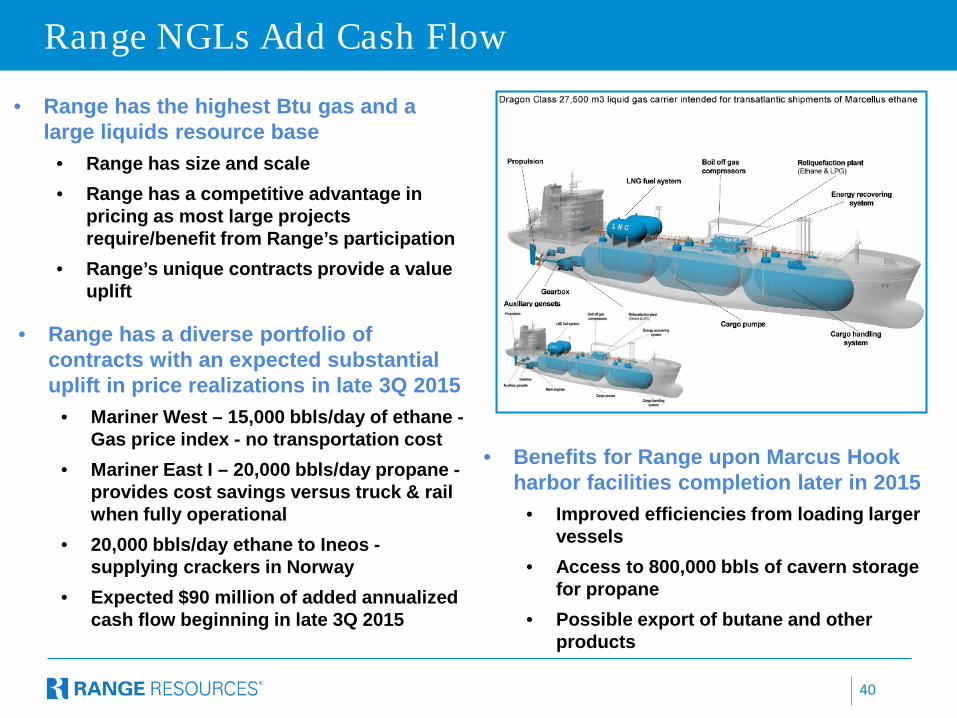
Range NGLs Add Cash Flow
• Range has a diverse portfolio of contracts with an expected substantial uplift in price realizations in late 3Q 2015
• Mariner West – 15,000 bbls/day of ethane - Gas price index - no transportation cost
• Mariner East I – 20,000 bbls/day propane - provides cost savings versus truck & rail when fully operational
• 20,000 bbls/day ethane to Ineos - supplying crackers in Norway
• Expected $90 million of added annualized cash flow beginning in late 3Q 2015
• Benefits for Range upon Marcus Hook harbor facilities completion later in 2015
• Improved efficiencies from loading larger vessels
• Access to 800,000 bbls of cavern storage for propane
• Possible export of butane and other products
• Range has the highest Btu gas and a large liquids resource base
• Range has size and scale
• Range has a competitive advantage in pricing as most large projects require/benefit from Range’s participation
• Range’s unique contracts provide a value uplift

41
Freely Flowing
Overbuilt
0
10
20
30
40
50
Bcf
/d
Appalcahia Consumption Regional Storage Injections Announced Takeaway Additions Appalachia Production
2013 2014 2015 2016 2017 2018
Appalachia Production Year End Exit Rate 13.7 17.9 20.9 23.0 26.5 27.6
Appalachia Consumption + Injections 13.4 14.6 14.2 14.6 15.0 15.2 A Appalachia Gas Surplus for Export 0.3 3.4 6.7 8.4 11.6 12.4
Fully Committed Takeaway Projects (cumulative year end) 3.4 7.3 10.8 20.5 25.0
Other Proposed Takeaway Projects (cumulative year end) 0.8 3.5 4.7 8.2
B Total Takeaway Projects (cumulative year end) 3.4 8.1 14.3 25.2 33.2
Excess Takeaway (B – A) 0.0 1.3 5.8 13.7 20.8
Takeaway Largely Overbuilt by 2016-2017
Source: Analyst estimates
• LNG exports starting in late 2015 • Appears to have sufficient takeaway
capacity by 2016
Constrained As of Year End

42
Northeast PA Operator Main Line Market Start-up Capacity –
Bcf/d Fully Committed Approved or with FERC
2014 Northeast Connector Williams Transco NE Q4'14 0.1 Y Y Iroquois Access Dominion Iroquois NE Q4'14 0.3 Y Y Rose Lake Expansion Kinder Morgan TGP NE Q4'14 0.2 Y Y
2015 Niagara Expansion Kinder Morgan TGP Canada Q4'15 0.2 Y Y Northern Access 2015 NFG National Fuel Canada Q4'15 0.1 Y Y Leidy Southeast Williams Transco Mid-Atlantic/SE Q4'15 0.5 Y Y East Side Expansion Nisource Columbia Mid-Atlantic/SE Q4'15 0.3 Y Y
2016 Northern Access 2016 NFG National Fuel Canada 2016 0.4 Y Y SoNo Iroquois Access Dominion Iroquois Canada Q2'16 0.3 N N Constitution Williams Constitution NE H2'16 0.7 Y Y Algonquin AIM Spectra Algonquin NE Q4'16 0.4 Y Y
2017 Atlantic Sunrise Williams Transco Mid-Atlantic/SE H2'17 1.7 Y Y PennEast AGT NE H2'17 1.0 Y Y Atlantic Bridge Spectra Algonquin NE H2'17 0.7 N Y
2018 Access Northeast Spectra Algonquin NE H2'18 1.0 N N Diamond East Williams Transco NE H2'18 1.0 N N TGP Northeast Expansion Kinder Morgan TGP NE H2'18 1.0 Y Y
Southwest Operator Main Line Market Start-up Capacity –
Bcf/d Fully Committed Approved or with FERC
2014 Lebanon Lateral Reversal Transcanada ANR Midwest Q1'14 0.4 Y Y Utica Backhaul Kinder Morgan TGP Midwest Q2'14 0.5 Y Y REX Seneca Lateral Tall Grass REX Midwest H1'14 0.6 Y Y TEAM 2014 Spectra TETCO Gulf Coast Q4'14 0.6 Y Y TEAM South Spectra TETCO Gulf Coast Q4'14 0.3 Y Y West Side Expansion Nisource Columbia Gulf Coast Q4'14 0.4 Y Y
2015 REX Zone 3 Full Reversal Tall Grass REX Midwest Q2'15 1.2 Y Y TGP Backhaul / Broad Run Kinder Morgan TGP Gulf Coast Q4'15 0.6 Y Y TETCO OPEN Spectra TETCO Gulf Coast Q4'15 0.6 Y Y Uniontown to Gas City Spectra TETCO Midwest Q3'15 0.4 Y Y Glen Karn 2015 Transcanada ANR Midwest Q4'15 0.8 N N
Announced Appalachian Basin Takeaway Projects – 1 of 2
Note: Data subject to change as projects are approved and built. Highlighted projects where Range is participating.
43
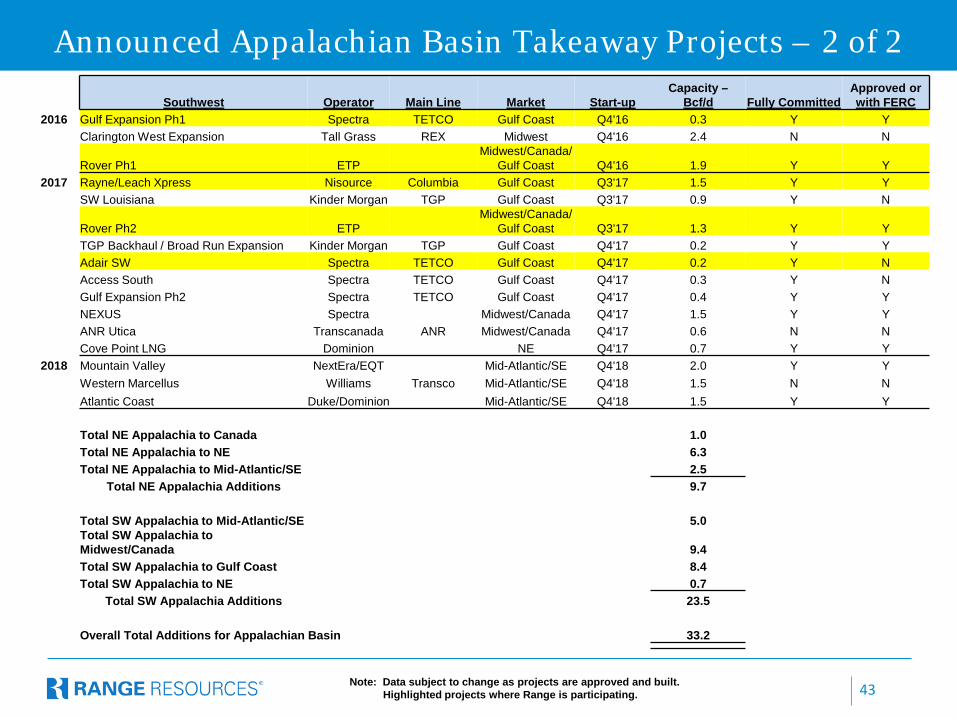
Southwest Operator Main Line Market Start-up Capacity –
Bcf/d Fully Committed Approved or with FERC
2016 Gulf Expansion Ph1 Spectra TETCO Gulf Coast Q4'16 0.3 Y Y Clarington West Expansion Tall Grass REX Midwest Q4'16 2.4 N N
Rover Ph1 ETP Midwest/Canada/
Gulf Coast Q4'16 1.9 Y Y 2017 Rayne/Leach Xpress Nisource Columbia Gulf Coast Q3'17 1.5 Y Y
SW Louisiana Kinder Morgan TGP Gulf Coast Q3'17 0.9 Y N
Rover Ph2 ETP Midwest/Canada/
Gulf Coast Q3'17 1.3 Y Y TGP Backhaul / Broad Run Expansion Kinder Morgan TGP Gulf Coast Q4'17 0.2 Y Y Adair SW Spectra TETCO Gulf Coast Q4'17 0.2 Y N Access South Spectra TETCO Gulf Coast Q4'17 0.3 Y N Gulf Expansion Ph2 Spectra TETCO Gulf Coast Q4'17 0.4 Y Y NEXUS Spectra Midwest/Canada Q4'17 1.5 Y Y ANR Utica Transcanada ANR Midwest/Canada Q4'17 0.6 N N Cove Point LNG Dominion NE Q4'17 0.7 Y Y
2018 Mountain Valley NextEra/EQT Mid-Atlantic/SE Q4'18 2.0 Y Y Western Marcellus Williams Transco Mid-Atlantic/SE Q4'18 1.5 N N Atlantic Coast Duke/Dominion Mid-Atlantic/SE Q4'18 1.5 Y Y
Total NE Appalachia to Canada 1.0 Total NE Appalachia to NE 6.3 Total NE Appalachia to Mid-Atlantic/SE 2.5
Total NE Appalachia Additions 9.7
Total SW Appalachia to Mid-Atlantic/SE 5.0 Total SW Appalachia to Midwest/Canada 9.4 Total SW Appalachia to Gulf Coast 8.4 Total SW Appalachia to NE 0.7
Total SW Appalachia Additions 23.5
Overall Total Additions for Appalachian Basin 33.2
Announced Appalachian Basin Takeaway Projects – 2 of 2
Note: Data subject to change as projects are approved and built. Highlighted projects where Range is participating.

44
Total Appalachian Production Growth is Slowing
44
0
1,000,000
2,000,000
3,000,000
4,000,000
5,000,000
6,000,000
7,000,000
8,000,000
9,000,000
10,000,000
Appalachian Pipeline Flow Date by Region (Mcf/d)
NE PA
Central PA
SW PA
WV
Utica
Shut Ins

45
Projected YE 2015 Projected YE 2016 Projected YE 2018
Regional Direction Mmbtu/day (Gross)
Transport Cost per Mmbtu
Mmbtu/day (Gross)
Transport Cost per Mmbtu
Mmbtu/day (Gross)
Transport Cost per Mmbtu
Firm Transportation
Appalachia/Local 360,000 $ 0.22 360,000 $ 0.18 360,000 $ 0.18
Gulf Coast 270,000 $ 0.30 420,000 $ 0.41 945,000 $ 0.48
Midwest/Canada 285,143 $ 0.26 285,000 $ 0.26 585,000 $ 0.50
Northeast 210,000 $ 0.57 210,000 $ 0.57 210,000 $ 0.57
Southeast 100,000 $ 0.39 100,000 $ 0.39 100,000 $ 0.39
Firm Sales/Released Capacity 175,000 -- 270,000 -- 300,000 --
Total Take-Away Capacity 1,400,000 $ 0.28 1,645,000 $ 0.28 2,500,000 $ 0.39
Appalachia Gas Transportation Arrangements
Capacity listed above reflects actual amounts of production that can flow under these arrangements. We believe these firm arrangements provide
adequate capacity to meet our growth projections through 2018 Range net production would be approximately 83% of the gross amounts shown. Does not include current intermediary pipeline capacity of > 650,000 Mmbtu/day, and assumes full utilization. Cost associated with Firm Sales/Released Capacity is assumed as a deduction to price. Based on anticipated project start dates.

46
What Does the Future’s Strip Price Indicate for Regional Basis?
TCO Pool 2015 -$0.12 2020 -$0.39
Dom South 2015 -$1.28 2020 -$0.66
TETCO M3 2015 -$0.43 2020 +$0.10
Chicago CG 2015 +$0.11 2020 -$0.13
CG Mainline 2015 -$0.08 2020 -$0.07
Dawn 2015 +$0.22 2020 -$0.12
MichCon 2015 +$0.14 2020 $0.00
Algonquin 2015 +$2.34 2020 +$1.13
Transco Z6 (NY) 2015 +$1.18 2020 +$0.99
Transco Z4 2015 -$0.00 2020 +$0.05 Source = Bloomberg, Inside-FERC Basis (07/14/15)
Prices $/Mmbtu
North East anticipated takeaway projects should
improve future basis in the Appalachian Basin
Transco Z6 (NNY)
2015 +$0.36 2020 +$0.32

47
LNG Exports – Developing Projects To-Date
Our analysis suggests at least 8 of the 38 proposed export facilities are likely to proceed by 2022, representing ~12 Bcf/d of capacity out of the proposed ~40 Bcf/d. These 8 have DOE Non-FTA approval &/or FERC EIS approval (or in advanced stages), have offtake deals signed for the majority of capacity, &/or experienced LNG operator backing.
EXPORTS 1.0 Bcf/d for the Mid-Atlantic 5.0 Bcf/d for Texas 6.0 Bcf/d for Louisiana Additional 3-5 Bcf/d in Canada probable in 2020-25 timeframe.
0
2
4
6
8
10
12
14LNG Exports by Facility - Bcf/d
Sabine Pass Elba Island Cove Point FreeportCameron Corpus Christi Lake Charles Golden Pass
Based on operator announced dates

48
Gas In Place (GIP) – Marcellus Shale
Note: Townships where Range holds ~3,000 or more acres (as of 12/31/2014), and estimated as prospective, are outlined green. GIP – Range estimates.
• GIP is a function of pressure, temperature, thermal maturity, porosity, hydrocarbon saturation and net thickness
• Two core areas have been developed in the Marcellus
• Condensate and NGLs are in gaseous form in the reservoir

49
Gas In Place (GIP) – Point Pleasant
Note: Townships where Range holds ~3,000 or more acres (as of 12/31/2014), and estimated as prospective, are outlined green. GIP – Range estimates.
Outlined portion represents the area
of the highest pressure gradients in
the Point Pleasant

50
Gas In Place (GIP) – Upper Devonian Shale
• The greatest GIP in the Upper Devonian is found in SW PA
• A significant portion of the GIP in the Upper Devonian is located in the wet gas window
Note: Townships where Range holds ~3,000 or more acres (as of 12/31/2014), and estimated as prospective, are outlined green. GIP – Range estimates.

51
Southern Appalachia– Strategic Marketing Advantages
• Nora is strategically positioned to provide gas to southeast markets
• Contracts in place for ~100 Mmcf/d at $0.20/Mmbtu above NYMEX for the next 12 months
• ~50 Mmcf/d of existing unused transport capacity to allow for planned production growth
• Recent completion technology
advances result in substantially higher returns for CBM and tight gas wells
• Recent CBM results are 2.5x better than the historical field average, with moderate cost increases of only $15,000 per well
• Deeper exploration potential upside
465,000 net acres - Range owns minerals on most of the acreage
Mineral Rights
52
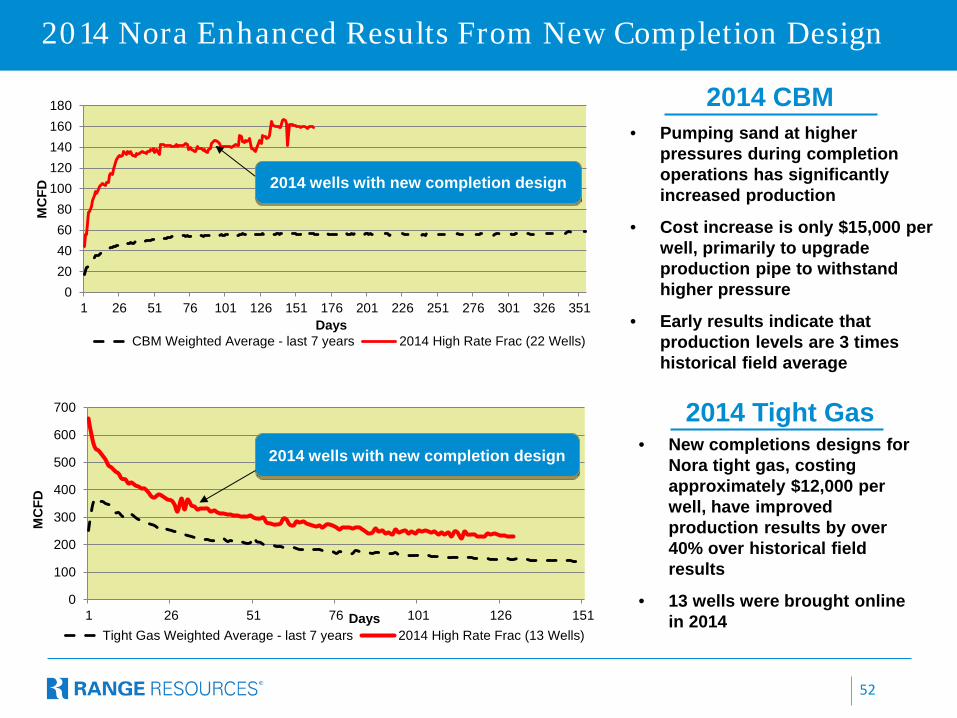
2014 Nora Enhanced Results From New Completion Design
2014 CBM • Pumping sand at higher
pressures during completion operations has significantly increased production
• Cost increase is only $15,000 per well, primarily to upgrade production pipe to withstand higher pressure
• Early results indicate that production levels are 3 times historical field average
• New completions designs for Nora tight gas, costing approximately $12,000 per well, have improved production results by over 40% over historical field results
• 13 wells were brought online in 2014
2014 Tight Gas
020406080
100120140160180
1 26 51 76 101 126 151 176 201 226 251 276 301 326 351
MC
FD
Days CBM Weighted Average - last 7 years 2014 High Rate Frac (22 Wells)
2014 wells with new completion design
0
100
200
300
400
500
600
700
1 26 51 76 101 126 151
MC
FD
Days Tight Gas Weighted Average - last 7 years 2014 High Rate Frac (13 Wells)
2014 wells with new completion design

53
Midcontinent Division
• ~360,000 net acres
• Development activity has been in the Mississippian Chat along the Nemaha Ridge
• Horizontal Granite Wash, Cleveland and Woodford potential on existing HBP acreage
2015 Planned Activity
• Turned in line 10 wells • One additional well in 2nd half of 2015

54
Financial and Reserve Detail
Appendix

55
Capital Efficiencies Driving Growth
Capital Efficiencies Driving Growth with Less Capital
Completed lateral lengths in Marcellus
expected to be > 6,000 ft. in 2015
Improved targeting and completion techniques
have increased recoveries significantly
95% of 2015 capital focused in Marcellus
Budget by Area Budget = $870 Million
Drilling Acreage & Seismic Pipelines, Facilities & Others Marcellus Nora/Midcontinent
95% 13% 83%
4% 5%
93%

56
Track Record of Building Reserves at Low Costs
(1) Excludes Utica/Point Pleasant potential
YE 2009 YE 2010 YE 2011 YE 2012 YE 2013 YE 2014
Proved Reserves (Tcfe)
3.1 4.4 5.1 6.5 8.2 10.3
Drill Bit Finding Cost (per Mcfe)
$0.69 $0.59 $0.76 $0.67 $0.57 $0.55
Net Unproved Resource Potential (Tcfe)
24 - 32 35 - 52 44 - 60 48 - 68 65 - 86 66 - 87
Proved reserves have increased by 27% per year on a compounded basis since 2009
(1)
Moved 8.8 Tcfe of Resource Potential into Proved Reserves in the Last Five Years
Track Record of Building Reserves at Low Costs

57
Ratings Agencies
• Moody’s assigned a Ba1 rating to the new senior unsecured bonds, affirmed its Ba2 rating on the subordinated notes, and maintained its positive rating outlook
• “Range’s rating affirmation and positive outlook reflect the company’s strong operating efficiency and growing production profile.”
• S&P assigned a BB+ rating to the senior unsecured bonds and affirmed its BB+ rating on the subs
57
Successful Senior Notes Offering
Range sold $750 million of senior notes due 2025 with a 4.875% coupon
Offering Outcome
• Despite upsizing the offering from $500 to $750 million, Range was able to achieve the lowest yield of any non-investment grade energy & power new issue of any maturity in 2015
• Bonds were placed primarily with high-quality, long-term holders (insurance companies and traditional “buy-and-hold” asset managers)
• Senior structure attracted a range of
buyers, including new high grade and crossover investors
3/31/2015 3/31/2015Rate Actual Pro Forma
Revolver 1.68% 912.0$ 691.1$ Sr Sub Notes
2020's 6.75% 500.0$ -$ 2021's 5.75% 500.0$ 500.0$ 2022's 5.00% 600.0$ 600.0$ 2023's 5.00% 750.0$ 750.0$
Senior Notes2025's 4.875% 750.0$
3,262.0$ 3,291.1$
Weighted Avg Bond Interest Rate: 5.53% 5.11%Corporate Avg Interest Rate: 4.45% 4.39%

58
Strong, Simple Balance Sheet
YE 2010 YE 2011 YE 2012 YE 2013 YE 2014 Q1 2015 Q2 2015
($ in millions)
Bank borrowings $274 $187 $739 $500 $723 $912 $364
Sr. Notes 750
Sr. Sub. Notes 1,686 1,788 2,139 2,641 2,350 2,350 2,350
Less: Cash (3) (0) (0) (0) (0) (0) (0)
Net debt 1,957 1,975 2,878 3,141 3,073 3,262 3,464
Common equity 2,224 2,392 2,357 2,414 3,456 3,490 3,381
Total capitalization $4,181 $4,367 $5,235 $5,555 $6,529 $6,752 $6,845
Debt-to-capitalization(1) 47% 45% 55% 57% 47% 48% 50%
Debt/EBITDAX(1) 2.8x 2.3x 3.2x 2.8x 2.6x 2.9x 3.3x
Liquidity(2) $971 $1,284 $927 $1,166 $1,172 $980 $1,527
(1) Ratios are net of cash balances. (2) Liquidity equals cash available borrowings under the revolving credit facility. (3) Pro forma for redemption of $500 million, 6.75% senior subordinated notes on 8/3.
Pro forma
Q2 2015
$881
750
1,850
(0)
3,481
3,367
6,848
51%
3.3x
$1,010
(3)

59
$500 $500
$600
$750 $750
0
100
200
300
400
500
600
700
800
900
$364
Senior Secured Revolving Credit Facility. Maximum facility size of $4 billion, with borrowing base of $3 billion and bank commitment of $2 billion.
Debt Maturities
Range maintains an orderly debt maturity ladder ( $
Mill
ions
)
Senior Subordinated Notes
Called for redemption on August 3, 2015
Senior Notes
$
Interest Rate
1.8% 6.75% 5.75% 5.0% 5.0% 4.875%

60
Period Volumes Hedged
(Mmbtu/day) Average Floor Price
( $ / Mmbtu) Average Cap Price
( $ / Mmbtu)
Gas Hedging 3Q 2015 Swaps 4Q 2015 Swaps
747,500 727,500
$3.63 $3.63
3Q 2015 Collars 4Q 2015 Collars
145,000 145,000
$4.07 $4.07
$4.56 $4.56
2016 Swaps
2017 Swaps
630,000
20,000
$3.42
$3.49
Oil Hedging 3Q 2015 Swaps 4Q 2015 Swaps
11,250 11,250
$85.87 $85.87
2016 Swaps 3,000 $70.54
Gas and Oil Hedging Status
As of 7/23/2015 – For quarterly detail of hedges, see RRC website

61
Natural Gas Liquids Hedging Status
(1) NGL hedges have Mont Belvieu as the underlying index. Conversion Factor: One barrel = 42 gallons
Period Volumes Hedged
(bbls/day) Hedged (1)
Price ($/gal)
Propane (C3) 3Q 2015 Swaps 4Q 2015 Swaps
2016 Swaps
14,000 12,000
5,500
$0.61 $0.55
$0.60
Normal Butane (NC4)
3Q 2015 Swaps 4Q 2015 Swaps
2016 Swaps
3,500 3,500
2,500
$0.72 $0.72
$0.72
Natural Gasoline (C5)
3Q 2015 Swaps 4Q 2015 Swaps
2016 Swaps
4,000 4,000
2,500
$1.16 $1.16
$1.23
As of 7/23/2015 – For quarterly detail of hedges, see RRC website

62
Contact Information
Range Resources Corporation 100 Throckmorton, Suite 1200
Fort Worth, Texas 76102 Main: 817.870.2601 Fax: 817.870.2316
Rodney Waller, Senior Vice President
David Amend, Investor Relations Manager [email protected]
Laith Sando, Research Manager
Michael Freeman, Senior Financial Analyst [email protected]
www.rangeresources.com


![[JULY]...Company Profile Established : February 29, 2012 Capital : 10 Million Baht Representative Mr. Hiroyuki Kawai, President Share Holders U-MACHINE, Inc. Bangkok](https://img.pdfslide.tips/doc/110x75/5f15eb5d72bd0b12c7003ad2/july-company-profile-established-february-29-2012-capital-10-million.jpg)