Embed Size (px)
Citation preview
Employee Attrition AnalysisIdentify / Model key indicators of employee attrition for SanDisk employees based on publicly available data
4th Aug, 2015
2
Contents
The Question1
Approach2
Analysis & Findings3
Predictive Model & Validation4
Conclusion and Client Feedback 5
The Question
Analyze patterns in profile information of past SanDisk employees to solve the following:
• Identify attributes that could be indicative of ‘risk of leaving’?
• Develop a model to predict employee attrition using the features identified
3
4
Contents
The Question1
Approach2
Analysis & Findings3
Predictive Model & Validation4
Conclusion and Client Feedback5
5
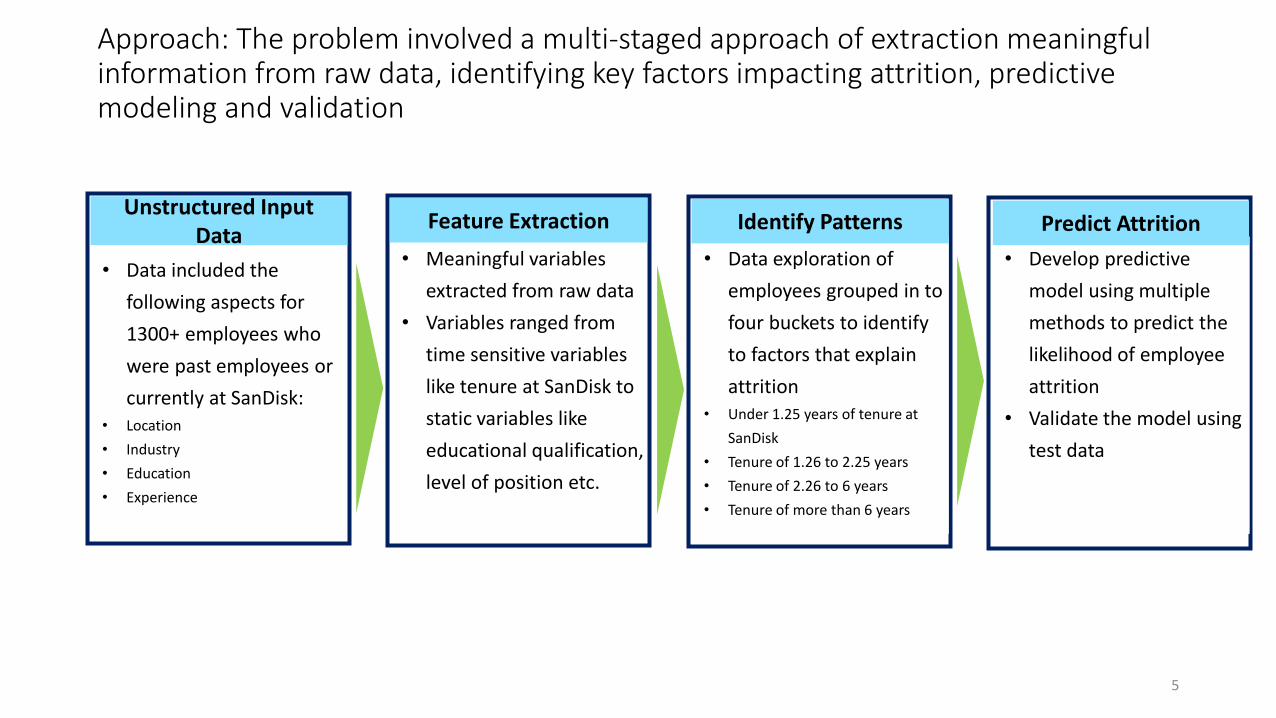
Approach: The problem involved a multi-staged approach of extraction meaningful information from raw data, identifying key factors impacting attrition, predictive modeling and validation
• Data included the
following aspects for
1300+ employees who
were past employees or
currently at SanDisk:• Location
• Industry
• Education
• Experience
• Meaningful variables
extracted from raw data
• Variables ranged from
time sensitive variables
like tenure at SanDisk to
static variables like
educational qualification,
level of position etc.
• Data exploration of
employees grouped in to
four buckets to identify
to factors that explain
attrition• Under 1.25 years of tenure at
SanDisk
• Tenure of 1.26 to 2.25 years
• Tenure of 2.26 to 6 years
• Tenure of more than 6 years
• Develop predictive
model using multiple
methods to predict the
likelihood of employee
attrition
• Validate the model using
test data
Unstructured Input Data
Feature Extraction Identify Patterns Predict Attrition
6 weeks
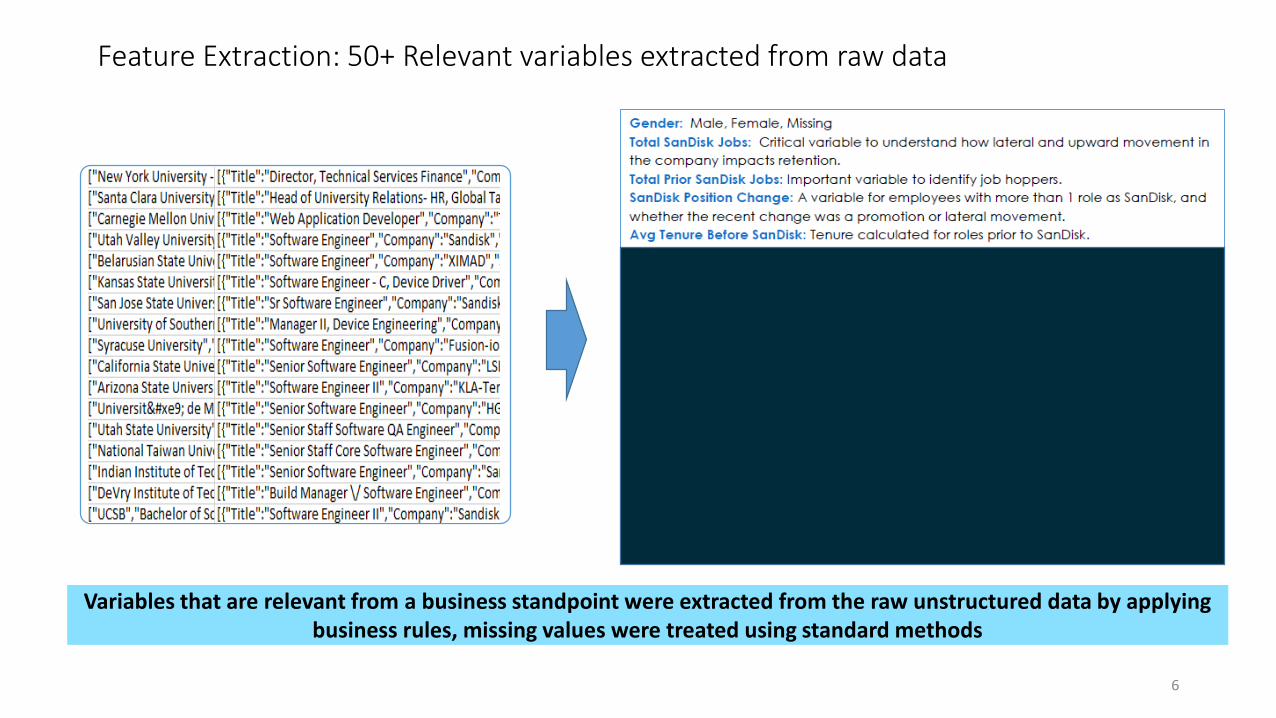
Feature Extraction: 50+ Relevant variables extracted from raw data
6
Variables that are relevant from a business standpoint were extracted from the raw unstructured data by applying business rules, missing values were treated using standard methods
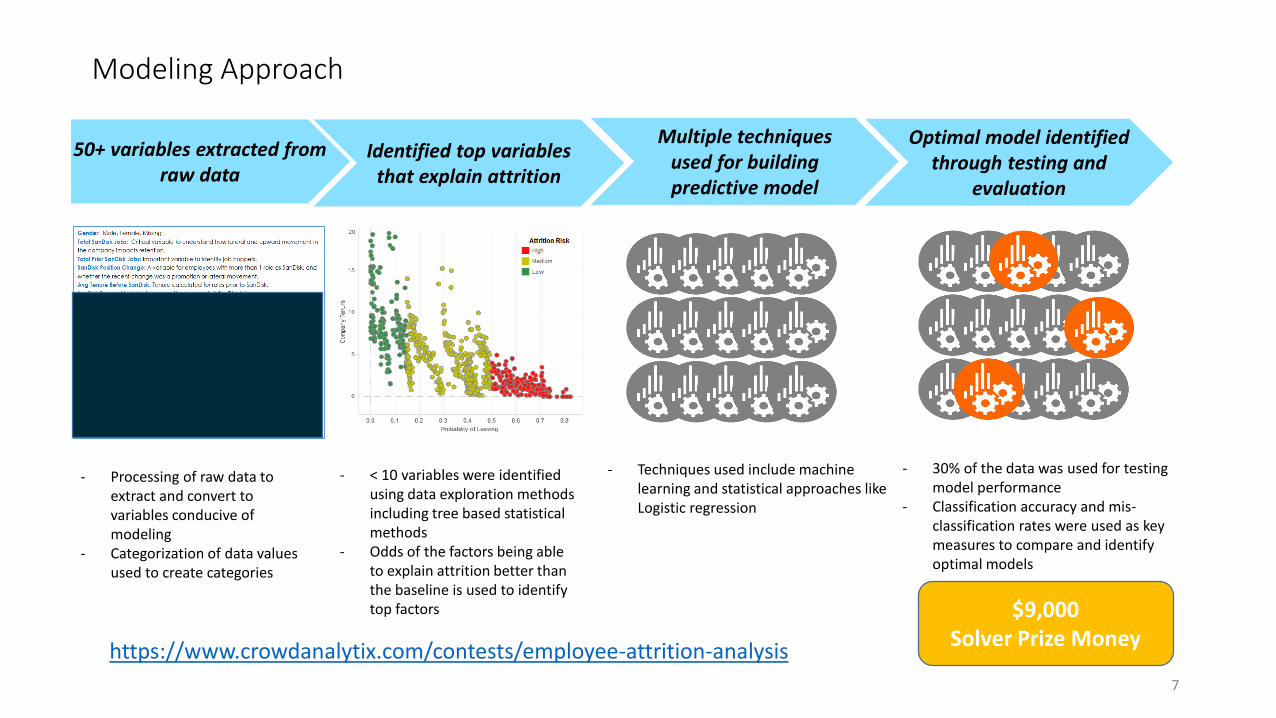
Modeling Approach
7
- Techniques used include machine learning and statistical approaches like Logistic regression
50+ variables extracted from raw data
Multiple techniques used for building predictive model
Identified top variables that explain attrition
- < 10 variables were identified using data exploration methods including tree based statistical methods
- Odds of the factors being able to explain attrition better than the baseline is used to identify top factors
- Processing of raw data to extract and convert to variables conducive of modeling
- Categorization of data values used to create categories
Optimal model identified through testing and
evaluation
- 30% of the data was used for testing model performance
- Classification accuracy and mis-classification rates were used as key measures to compare and identify optimal models
$9,000 Solver Prize Money
https://www.crowdanalytix.com/contests/employee-attrition-analysis
8
Contents
The Question1
Approach2
Analysis & Findings3
Predictive Model & Validation4
Conclusion and Client Feedback5
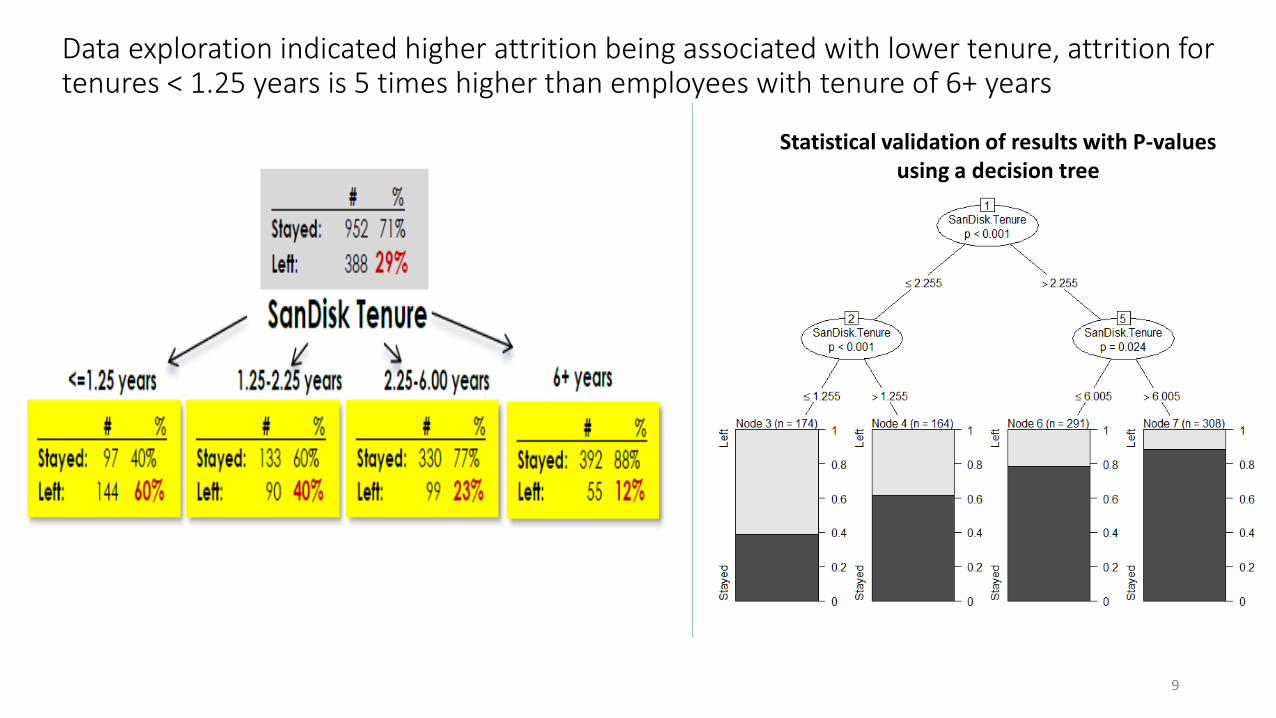
Data exploration indicated higher attrition being associated with lower tenure, attrition for tenures < 1.25 years is 5 times higher than employees with tenure of 6+ years
9
Statistical validation of results with P-values using a decision tree
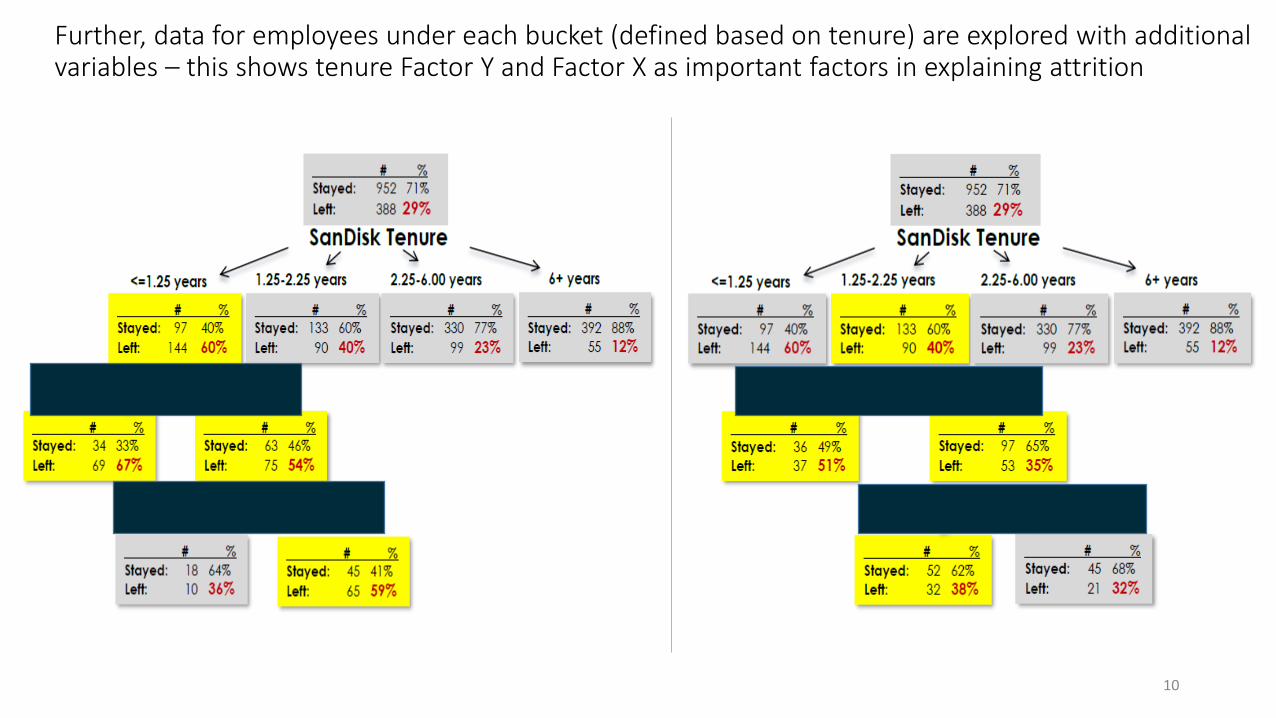
Further, data for employees under each bucket (defined based on tenure) are explored with additional variables – this shows tenure Factor Y and Factor X as important factors in explaining attrition
10
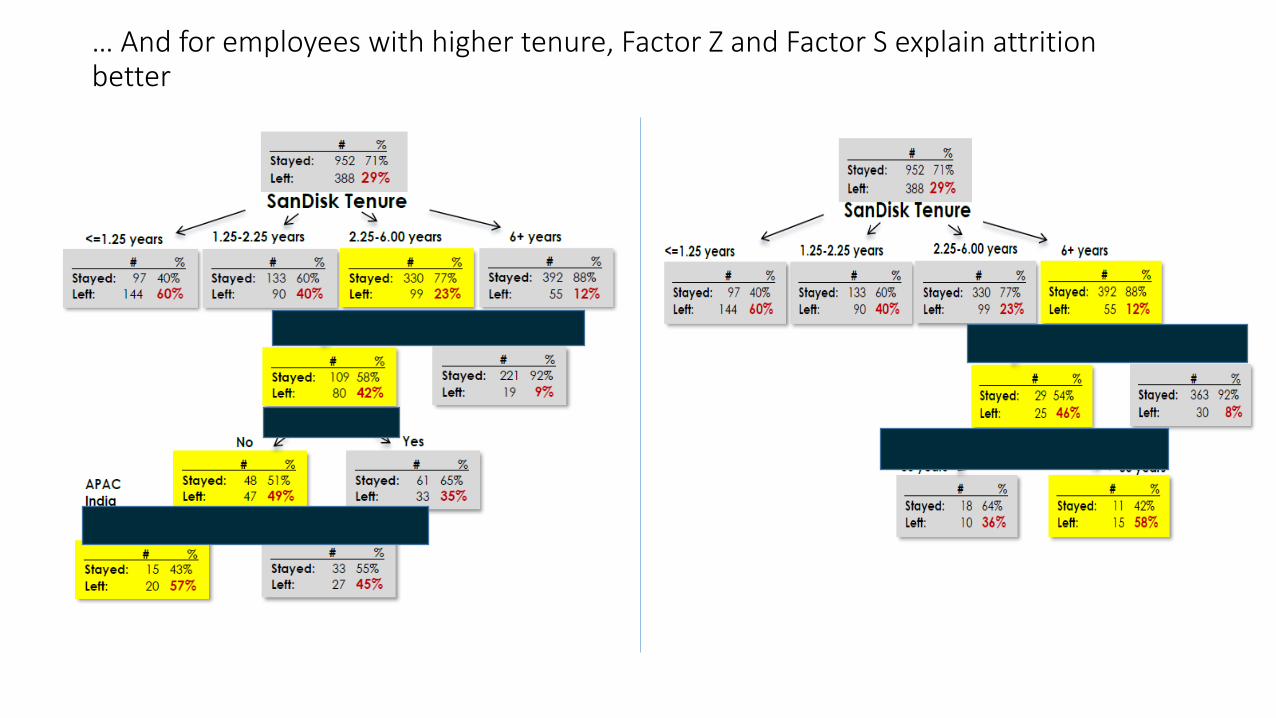
… And for employees with higher tenure, Factor Z and Factor S explain attrition better
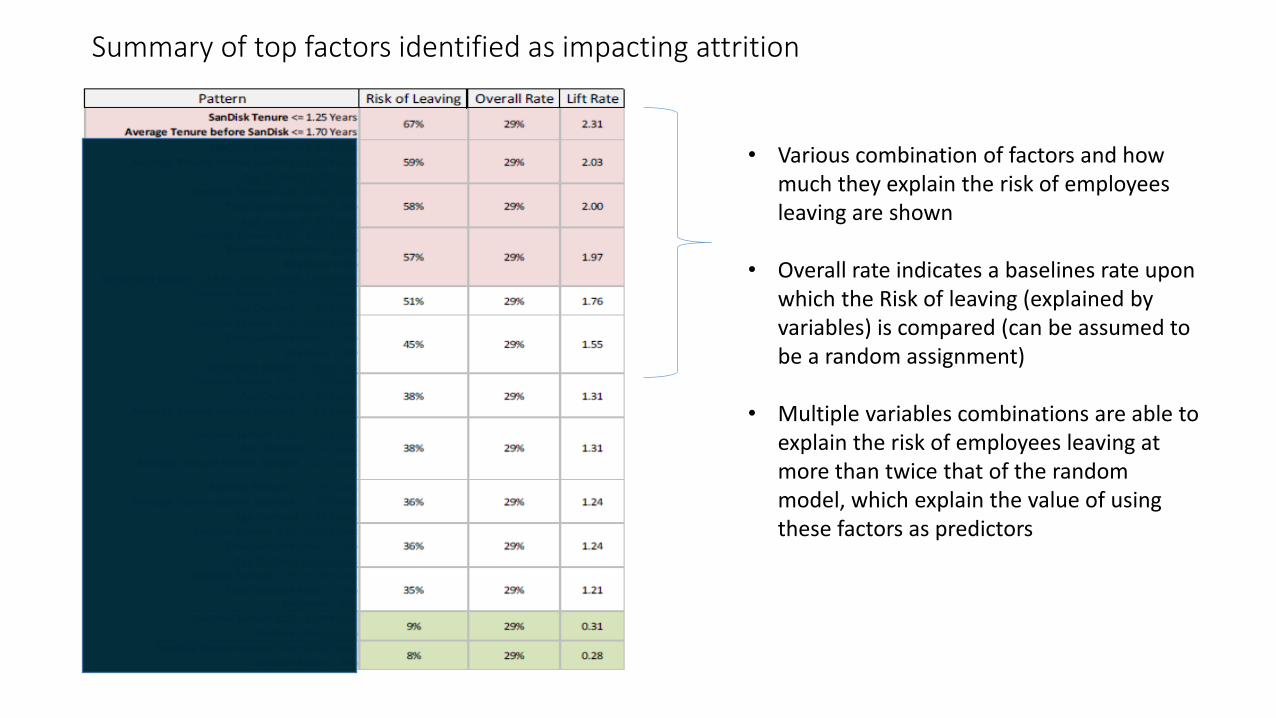
Summary of top factors identified as impacting attrition
• Various combination of factors and how much they explain the risk of employees leaving are shown
• Overall rate indicates a baselines rate upon which the Risk of leaving (explained by variables) is compared (can be assumed to be a random assignment)
• Multiple variables combinations are able to explain the risk of employees leaving at more than twice that of the random model, which explain the value of using these factors as predictors
13
Contents
The Question1
Approach2
Analysis & Findings3
Predictive Model & Validation4
Conclusion and Client Feedback5
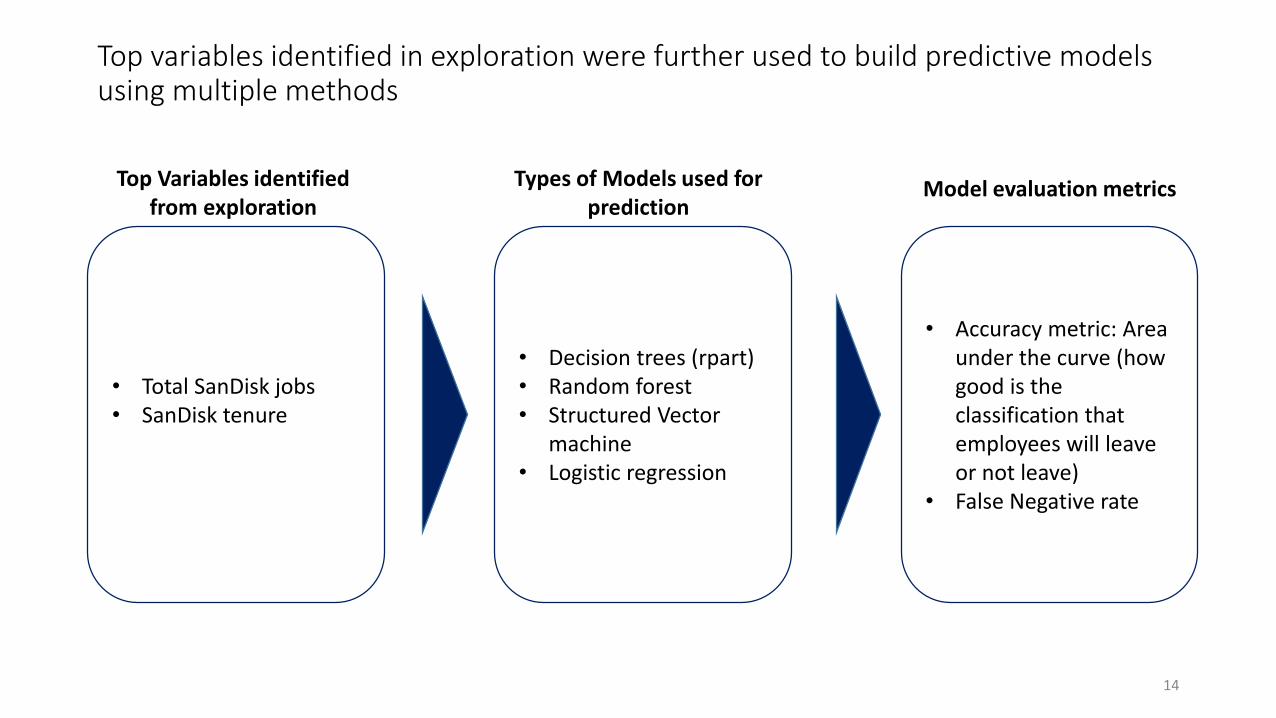
Top variables identified in exploration were further used to build predictive models using multiple methods
14
• Total SanDisk jobs• SanDisk tenure
• Decision trees (rpart)• Random forest• Structured Vector
machine• Logistic regression
• Accuracy metric: Area under the curve (how good is the classification that employees will leave or not leave)
• False Negative rate
Top Variables identified from exploration
Types of Models used for prediction
Model evaluation metrics
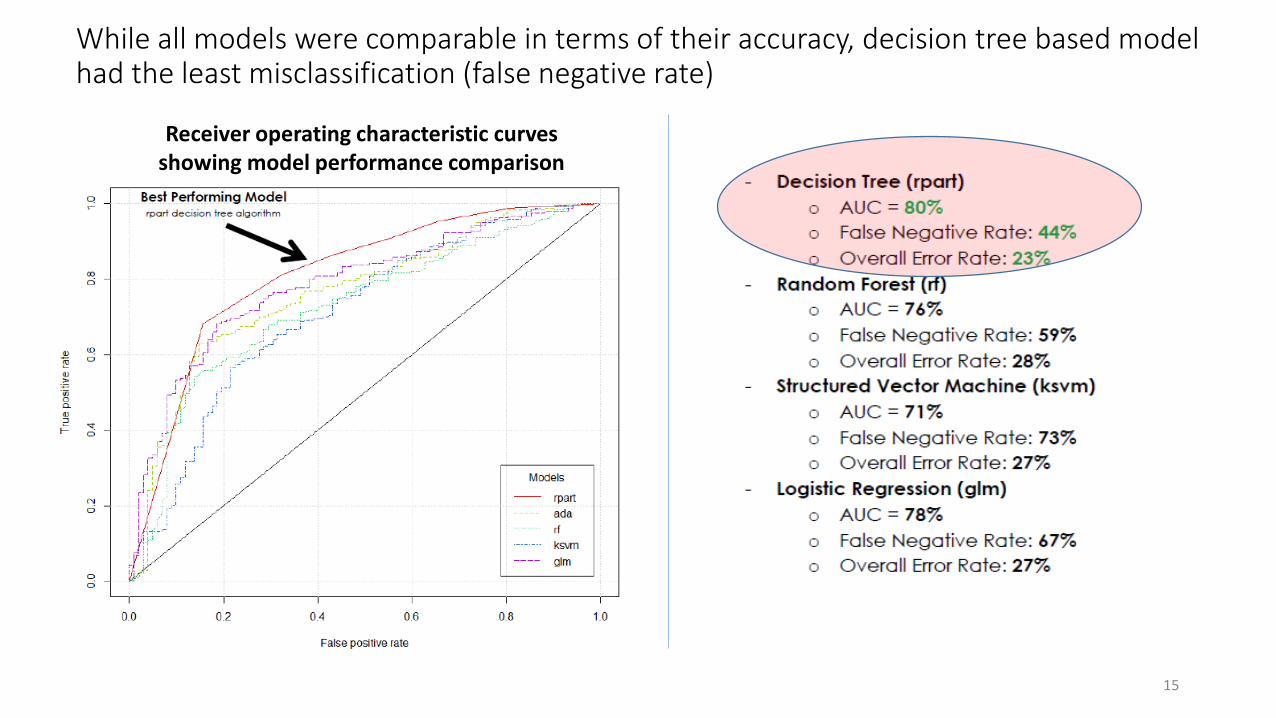
While all models were comparable in terms of their accuracy, decision tree based model had the least misclassification (false negative rate)
15
Receiver operating characteristic curves showing model performance comparison
16
Contents
The Question1
Approach2
Analysis & Findings3
Predictive Model & Validation4
Conclusion and Client Feedback5
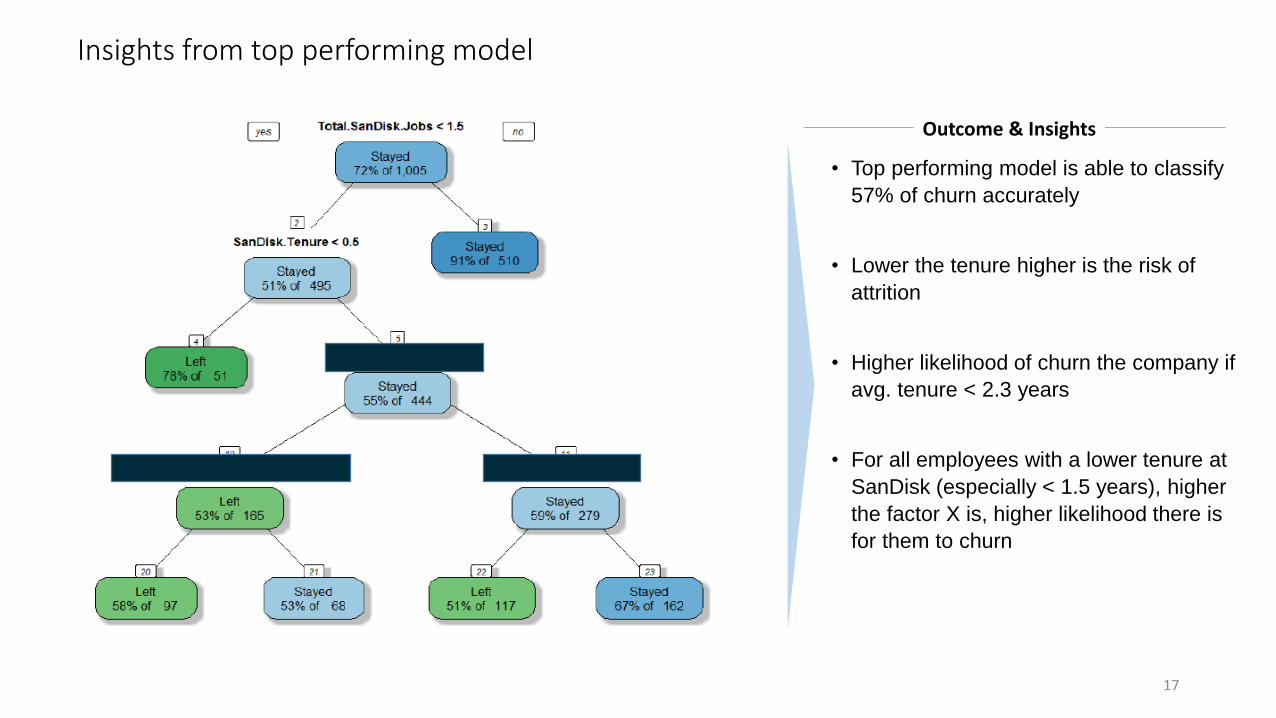
Insights from top performing model
17
• Top performing model is able to classify
57% of churn accurately
• Lower the tenure higher is the risk of
attrition
• Higher likelihood of churn the company if
avg. tenure < 2.3 years
• For all employees with a lower tenure at
SanDisk (especially < 1.5 years), higher
the factor X is, higher likelihood there is
for them to churn
Outcome & Insights
Client Feedback
18
“The greatest advantage of the crowdsourcing approach was the available talent ready to work on my
problem. I can almost guarantee that the crowdsourcing approach dedicated significantly more man-
hours on this project than I would ever been able to get through internal resources.”
Additional follow-up questions from client:
• Any noticeable change in patterns over the years, specifically in terms of attrition
• Additional factors that had been considered such as organizational performance, macro-economic environment

Thank You
19