Embed Size (px)
Citation preview
Global challenge and regional analysis –
Germany’s vulnerability and adaptation to
climate change
Ulrike Lehr, Thomas Drosdowski, Anne Nieters
Paris, July 9th 2015
July 15 page 2 2015 GWS mbH
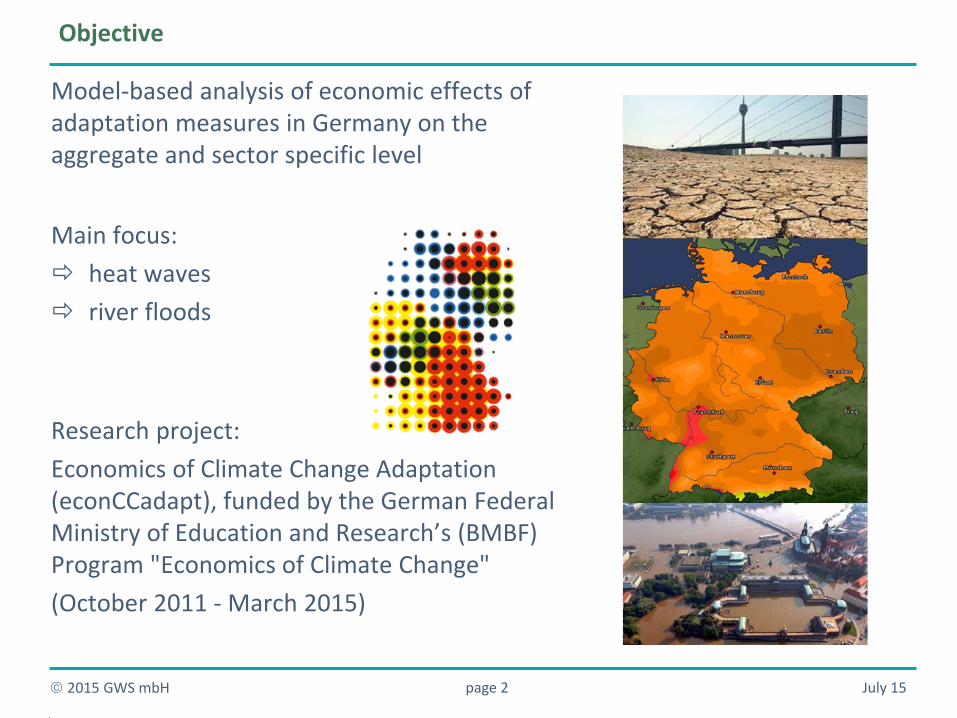
Objective
Model-based analysis of economic effects of adaptation measures in Germany on the aggregate and sector specific level
Main focus:
heat waves
river floods
Research project:
Economics of Climate Change Adaptation (econCCadapt), funded by the German Federal Ministry of Education and Research’s (BMBF) Program "Economics of Climate Change"
(October 2011 - March 2015)
July 15 page 3 2015 GWS mbH
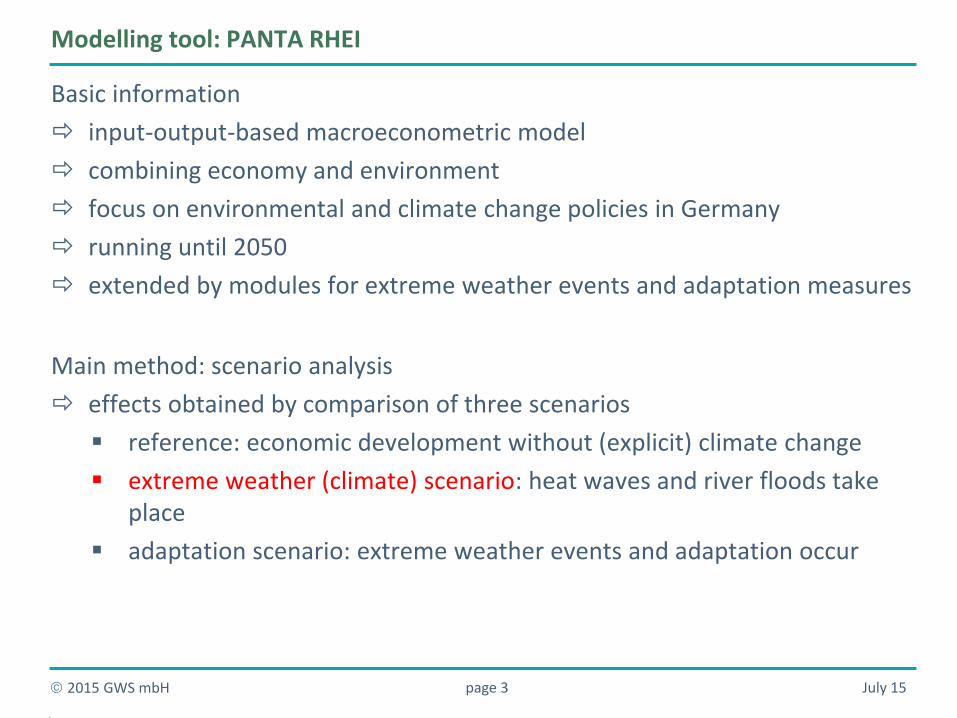
Modelling tool: PANTA RHEI
Basic information
input-output-based macroeconometric model
combining economy and environment
focus on environmental and climate change policies in Germany
running until 2050
extended by modules for extreme weather events and adaptation measures
Main method: scenario analysis
effects obtained by comparison of three scenarios
reference: economic development without (explicit) climate change
extreme weather (climate) scenario: heat waves and river floods take place
adaptation scenario: extreme weather events and adaptation occur
July 15 page 4 2015 GWS mbH
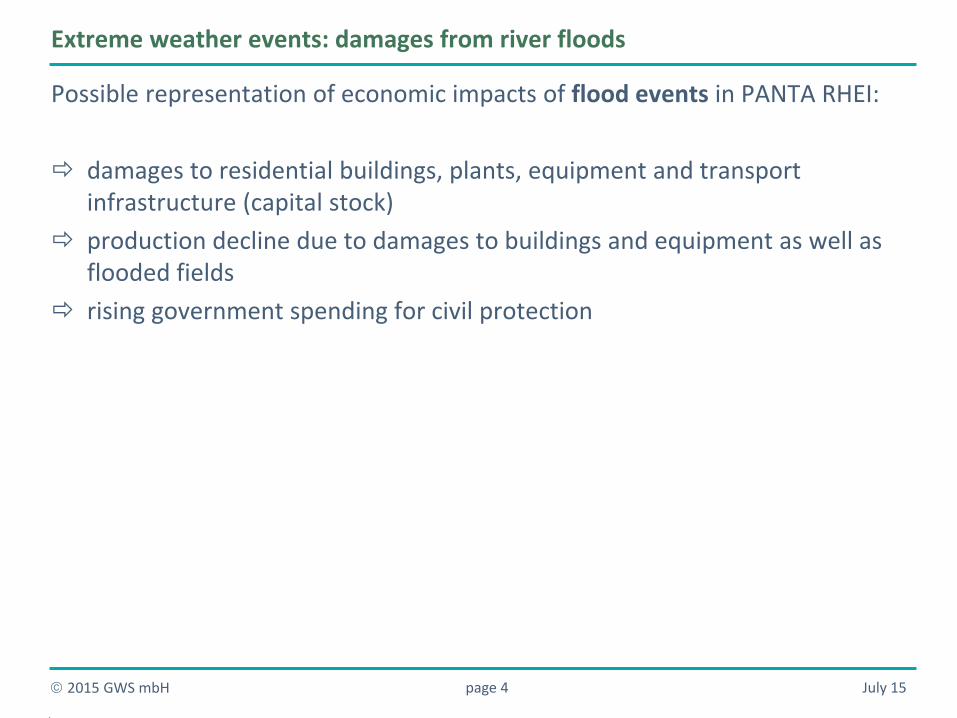
Possible representation of economic impacts of flood events in PANTA RHEI:
damages to residential buildings, plants, equipment and transport infrastructure (capital stock)
production decline due to damages to buildings and equipment as well as flooded fields
rising government spending for civil protection
Extreme weather events: damages from river floods
July 15 page 5 2015 GWS mbH
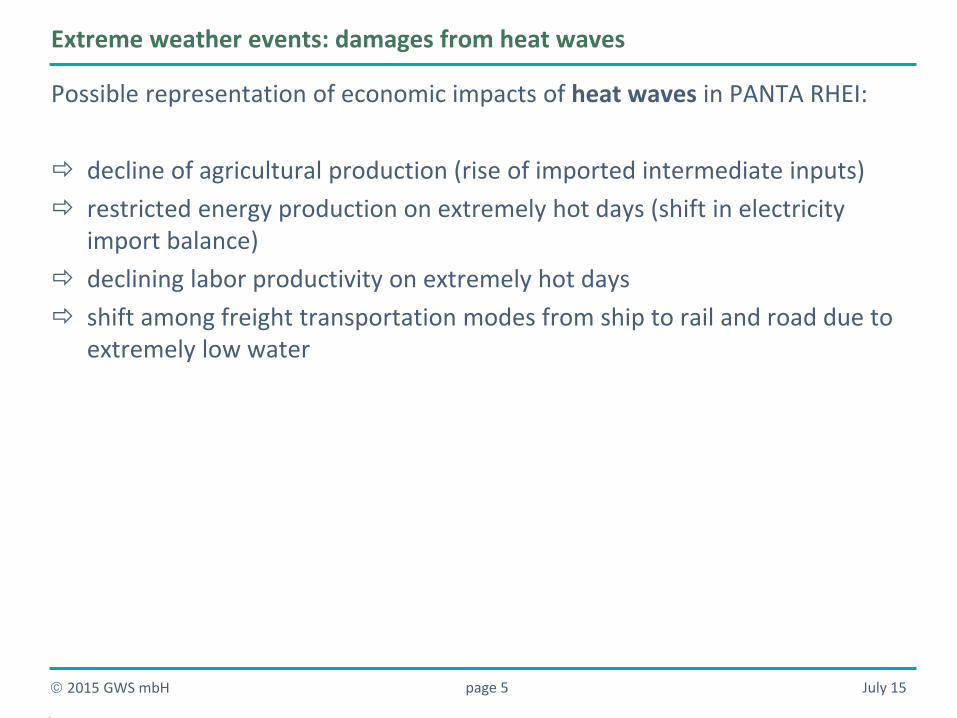
Possible representation of economic impacts of heat waves in PANTA RHEI:
decline of agricultural production (rise of imported intermediate inputs)
restricted energy production on extremely hot days (shift in electricity import balance)
declining labor productivity on extremely hot days
shift among freight transportation modes from ship to rail and road due to extremely low water
Extreme weather events: damages from heat waves
July 15 page 6 2015 GWS mbH
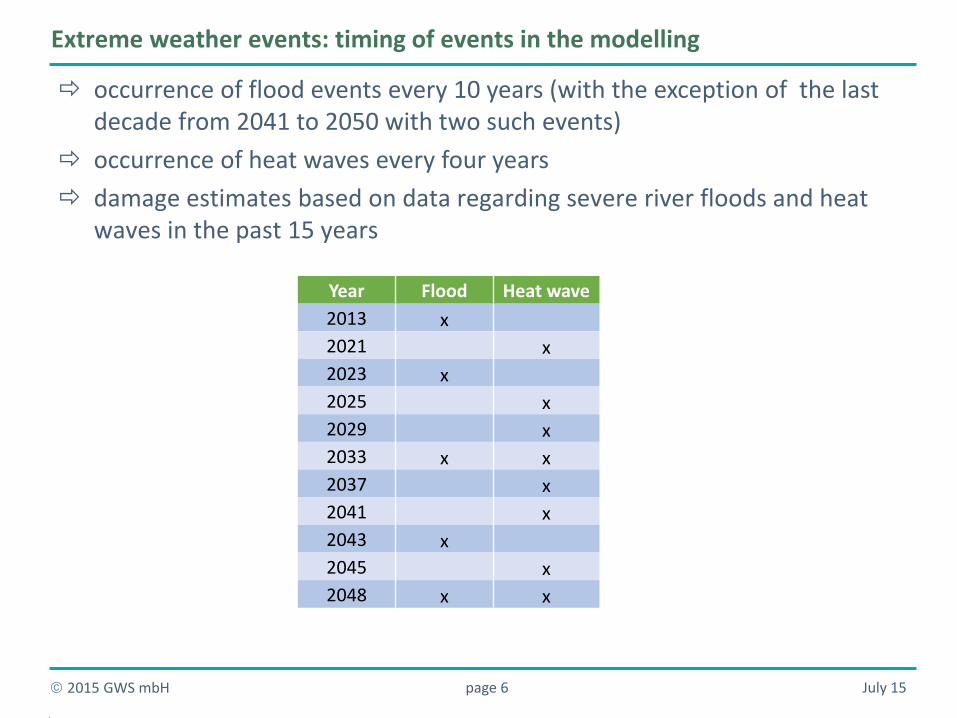
occurrence of flood events every 10 years (with the exception of the last decade from 2041 to 2050 with two such events)
occurrence of heat waves every four years
damage estimates based on data regarding severe river floods and heat waves in the past 15 years
Extreme weather events: timing of events in the modelling
Year Flood Heat wave
2013 x
2021 x
2023 x
2025 x
2029 x
2033 x x
2037 x
2041 x
2043 x
2045 x
2048 x x
July 15 page 7 2015 GWS mbH
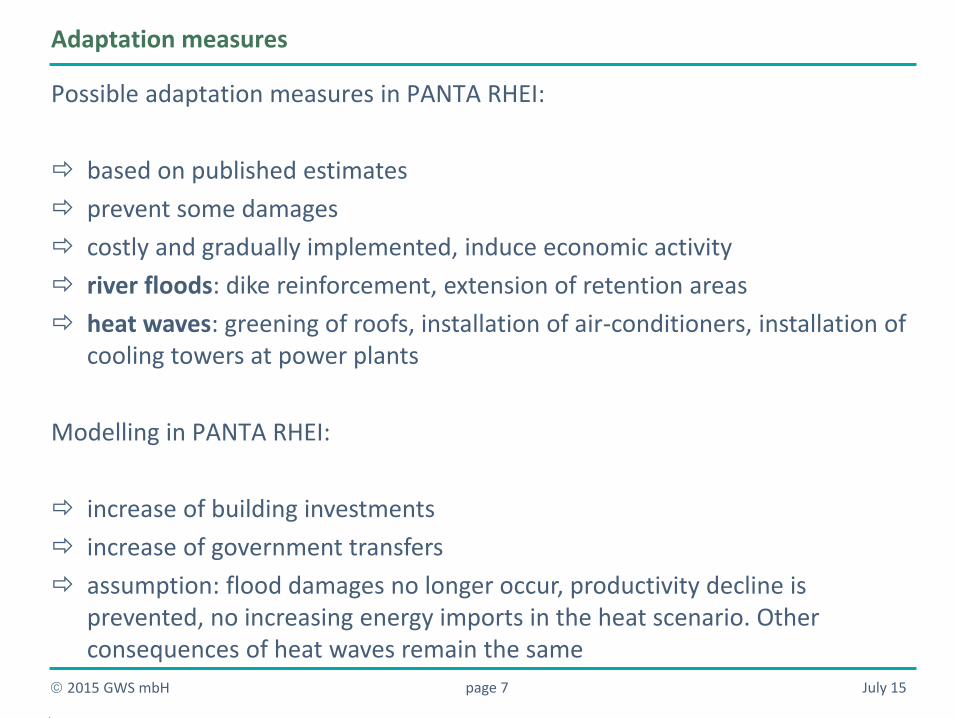
Possible adaptation measures in PANTA RHEI:
based on published estimates
prevent some damages
costly and gradually implemented, induce economic activity
river floods: dike reinforcement, extension of retention areas
heat waves: greening of roofs, installation of air-conditioners, installation of cooling towers at power plants
Modelling in PANTA RHEI:
increase of building investments
increase of government transfers
assumption: flood damages no longer occur, productivity decline is prevented, no increasing energy imports in the heat scenario. Other consequences of heat waves remain the same
Adaptation measures
July 15 page 8 2015 GWS mbH
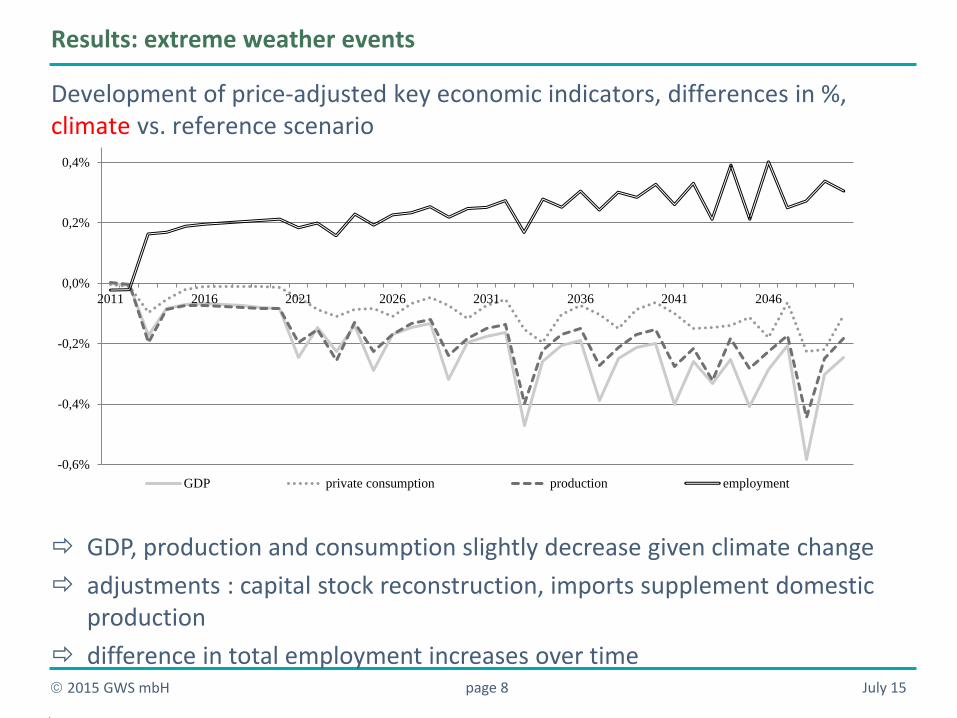
Development of price-adjusted key economic indicators, differences in %, climate vs. reference scenario
GDP, production and consumption slightly decrease given climate change
adjustments : capital stock reconstruction, imports supplement domestic production
difference in total employment increases over time
Results: extreme weather events
-0,6%
-0,4%
-0,2%
0,0%
0,2%
0,4%
2011 2016 2021 2026 2031 2036 2041 2046
GDP private consumption production employment
July 15 page 9 2015 GWS mbH
Aggregate results: adaptation measures
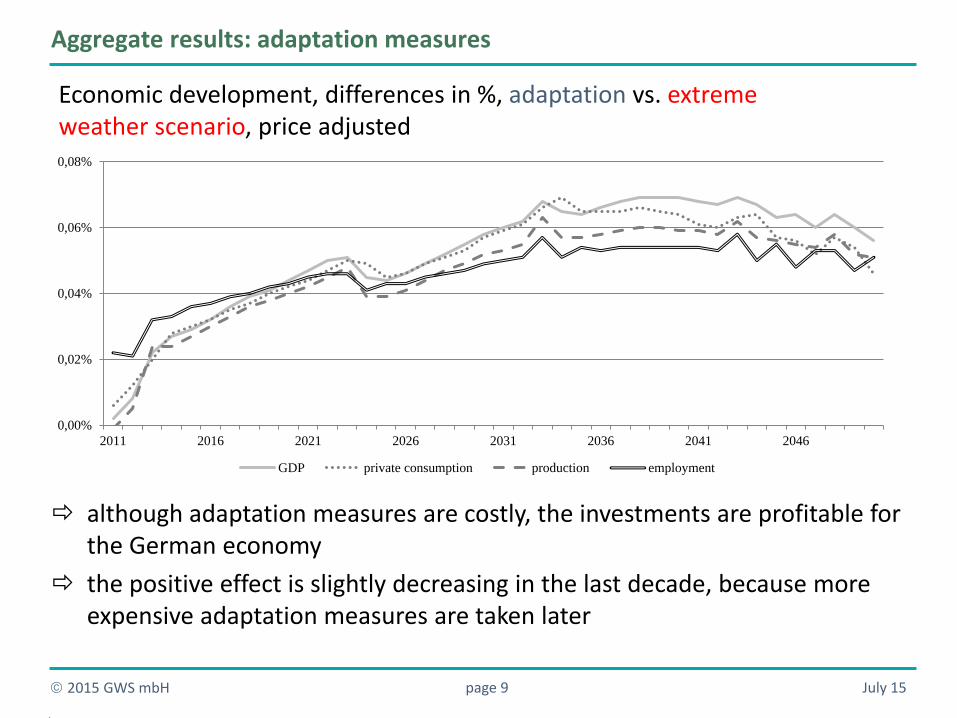
Economic development, differences in %, adaptation vs. extreme weather scenario, price adjusted
although adaptation measures are costly, the investments are profitable for the German economy
the positive effect is slightly decreasing in the last decade, because more expensive adaptation measures are taken later
0,00%
0,02%
0,04%
0,06%
0,08%
2011 2016 2021 2026 2031 2036 2041 2046
GDP private consumption production employment
July 15 page 10 2015 GWS mbH
-0,6
-0,5
-0,4
-0,3
-0,2
-0,1
0
2010 2015 2020 2025 2030 2035 2040 2045 2050
reference scenario extreme weather events adaptation
Aggregate results: adaptation measures
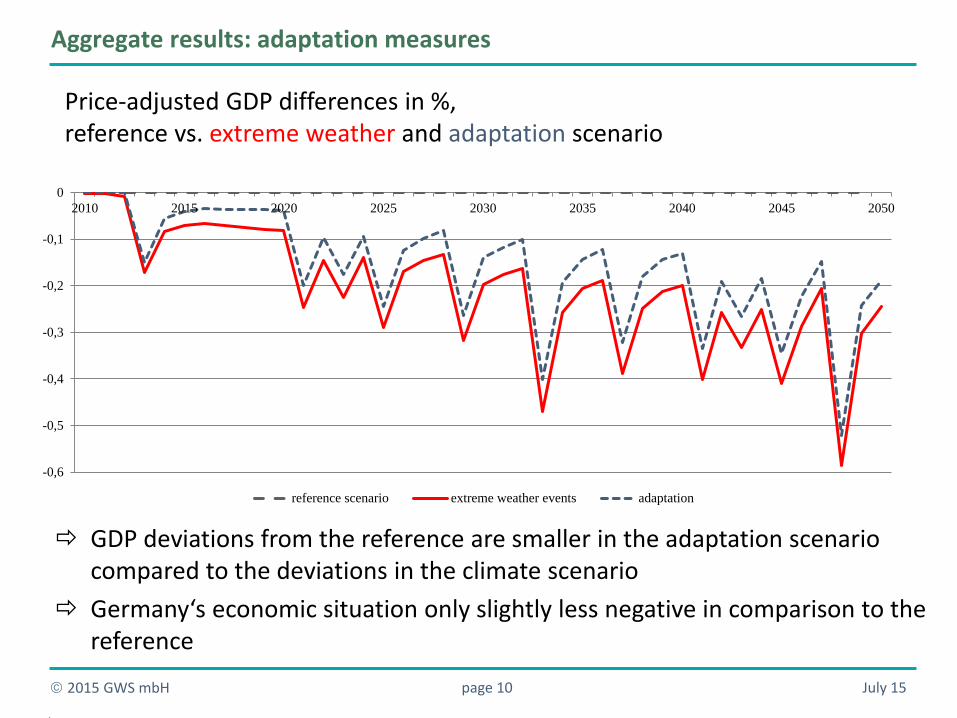
Price-adjusted GDP differences in %, reference vs. extreme weather and adaptation scenario
GDP deviations from the reference are smaller in the adaptation scenario compared to the deviations in the climate scenario
Germany‘s economic situation only slightly less negative in comparison to the reference
July 15 page 11 2015 GWS mbH
Sector-specific results: extreme weather events
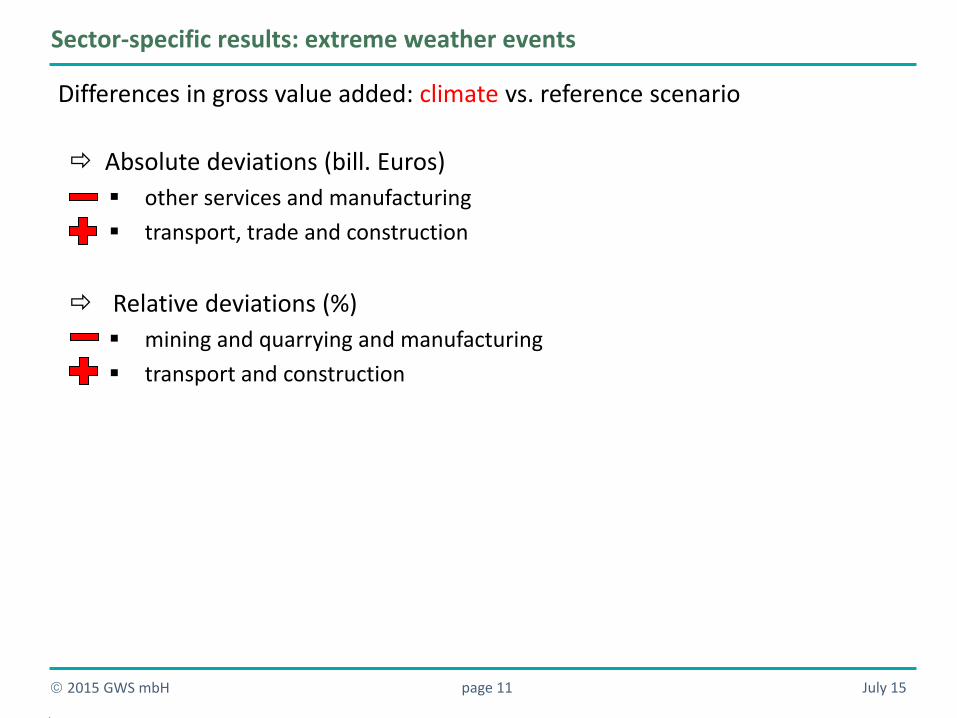
Differences in gross value added: climate vs. reference scenario
Absolute deviations (bill. Euros)
other services and manufacturing
transport, trade and construction
Relative deviations (%)
mining and quarrying and manufacturing
transport and construction
July 15 page 12 2015 GWS mbH
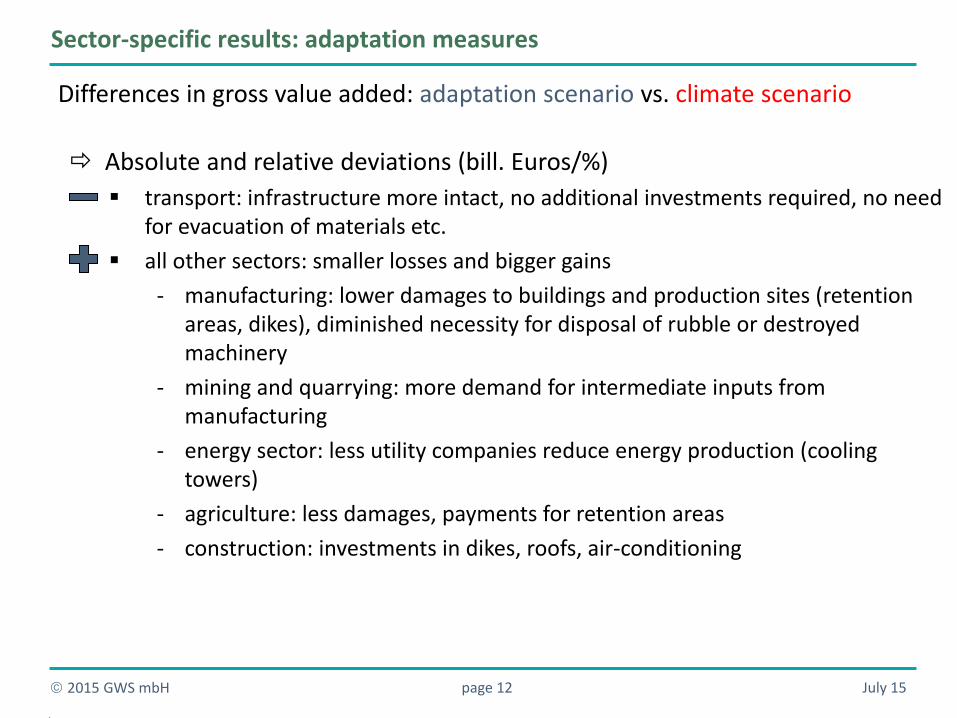
Sector-specific results: adaptation measures
Differences in gross value added: adaptation scenario vs. climate scenario
Absolute and relative deviations (bill. Euros/%)
transport: infrastructure more intact, no additional investments required, no need for evacuation of materials etc.
all other sectors: smaller losses and bigger gains
- manufacturing: lower damages to buildings and production sites (retention areas, dikes), diminished necessity for disposal of rubble or destroyed machinery
- mining and quarrying: more demand for intermediate inputs from manufacturing
- energy sector: less utility companies reduce energy production (cooling towers)
- agriculture: less damages, payments for retention areas
- construction: investments in dikes, roofs, air-conditioning
July 15 page 13 2015 GWS mbH
Conclusions: modelling results
total economic effects of heat waves and river floods are expected to become
slightly (but increasingly) negative in Germany
conservative assessment, since other extreme weather events not modelled
the most negatively affected sector (gross value added) is manufacturing
some sectors (e.g. transport) profit from climate change
adaptation measures diminish the negative aggregate effects
residual damages remain, mitigation strategies may be preferred
due to adaptation negative effects on the sectors decrease, whereas the positive
effects increase
July 15 page 14 2015 GWS mbH
Conclusions: general insights
the data situation is still unsatisfactory
input-output-based macro models need to be improved for better analysis of
extreme weather events
an aggregate view is incomplete, because of heterogeneous impacts across German
regions
global consequences of climate change such as shifts in foreign trade need to be
taken into account
Thank you for your attention!
For more: [email protected]
www.gws-os.com
Nieters, A., Drosdowski, T. & Lehr, U. (2015): Do extreme weather events damage the German economy? GWS Discussion Paper 15/2, Osnabrück.
July 15 page 16 2015 GWS mbH
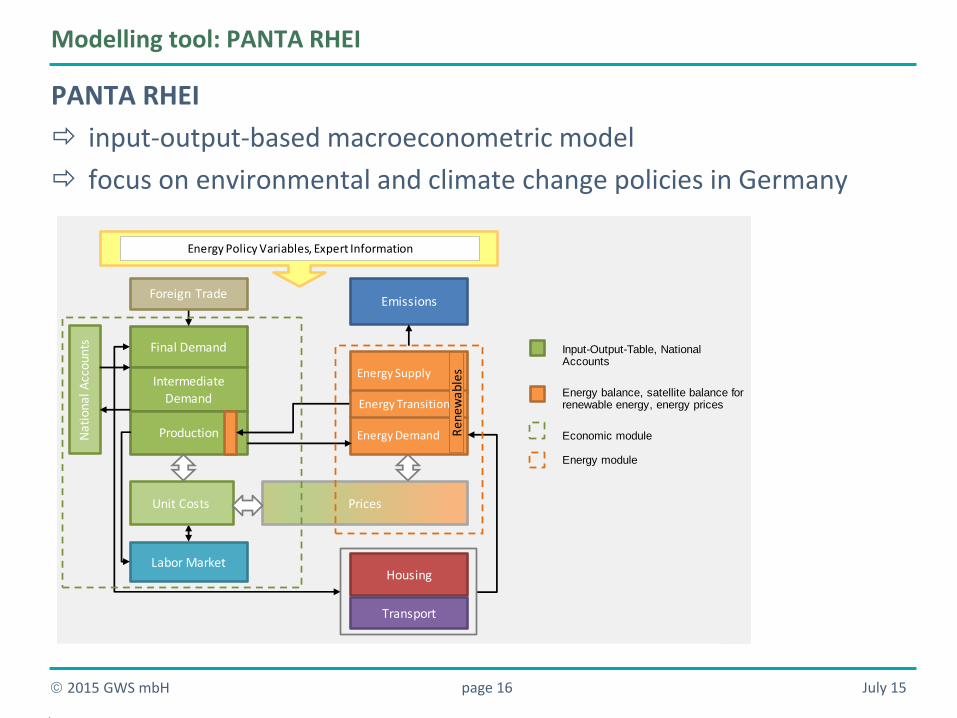
Modelling tool: PANTA RHEI
PANTA RHEI
input-output-based macroeconometric model
focus on environmental and climate change policies in Germany
Input-Output-Table, NationalAccounts
Energy balance, satellite balance forrenewable energy, energy prices
Economic module
Energy module
Final Demand
Intermediate Demand
Production
Unit Costs
Energy Supply
Prices
Emissions
HousingLabor Market
Foreign Trade
Energy Demand
Transport
Energy Policy Variables, Expert Information
Energy Transition
Ren
ewab
les
Nat
iona
l Acc
ount
s
July 15 page 17 2015 GWS mbH
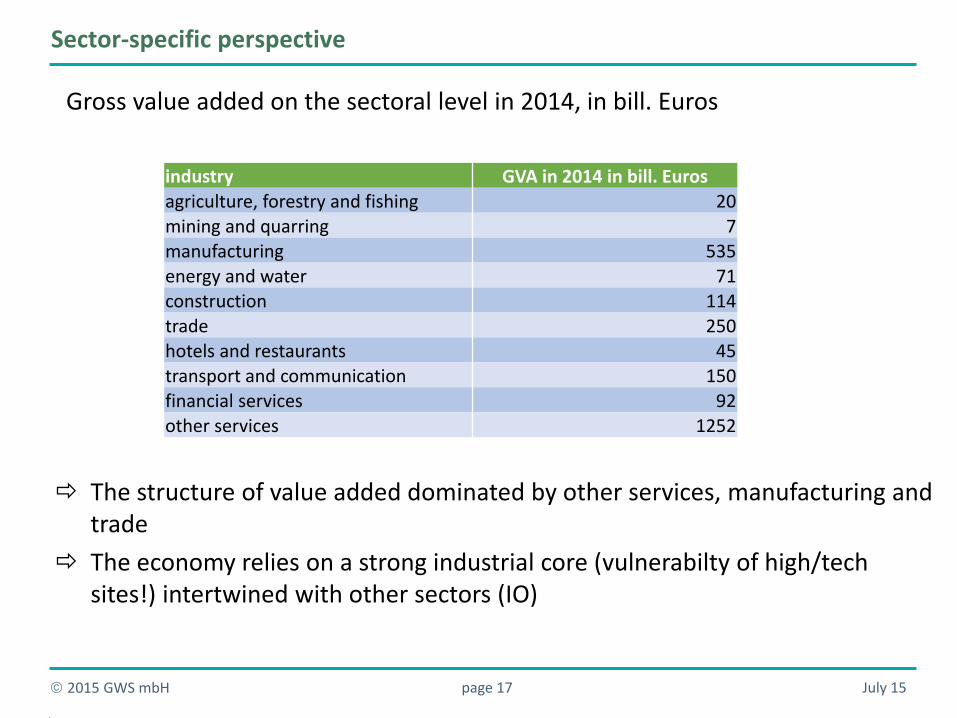
Sector-specific perspective
Gross value added on the sectoral level in 2014, in bill. Euros
The structure of value added dominated by other services, manufacturing and trade
The economy relies on a strong industrial core (vulnerabilty of high/tech sites!) intertwined with other sectors (IO)
industry GVA in 2014 in bill. Euros
agriculture, forestry and fishing 20 mining and quarring 7
manufacturing 535
energy and water 71 construction 114
trade 250 hotels and restaurants 45
transport and communication 150 financial services 92
other services 1252
July 15 page 18 2015 GWS mbH
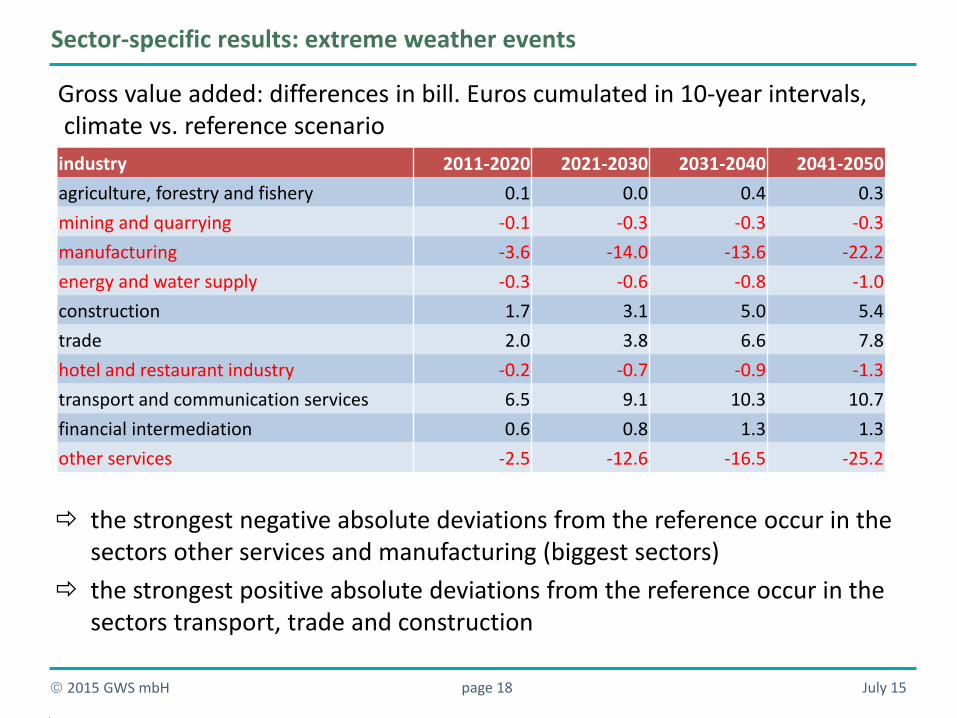
Sector-specific results: extreme weather events
Gross value added: differences in bill. Euros cumulated in 10-year intervals, climate vs. reference scenario
the strongest negative absolute deviations from the reference occur in the sectors other services and manufacturing (biggest sectors)
the strongest positive absolute deviations from the reference occur in the sectors transport, trade and construction
industry 2011-2020 2021-2030 2031-2040 2041-2050
agriculture, forestry and fishery 0.1 0.0 0.4 0.3
mining and quarrying -0.1 -0.3 -0.3 -0.3
manufacturing -3.6 -14.0 -13.6 -22.2
energy and water supply -0.3 -0.6 -0.8 -1.0
construction 1.7 3.1 5.0 5.4
trade 2.0 3.8 6.6 7.8
hotel and restaurant industry -0.2 -0.7 -0.9 -1.3
transport and communication services 6.5 9.1 10.3 10.7
financial intermediation 0.6 0.8 1.3 1.3
other services -2.5 -12.6 -16.5 -25.2
July 15 page 19 2015 GWS mbH
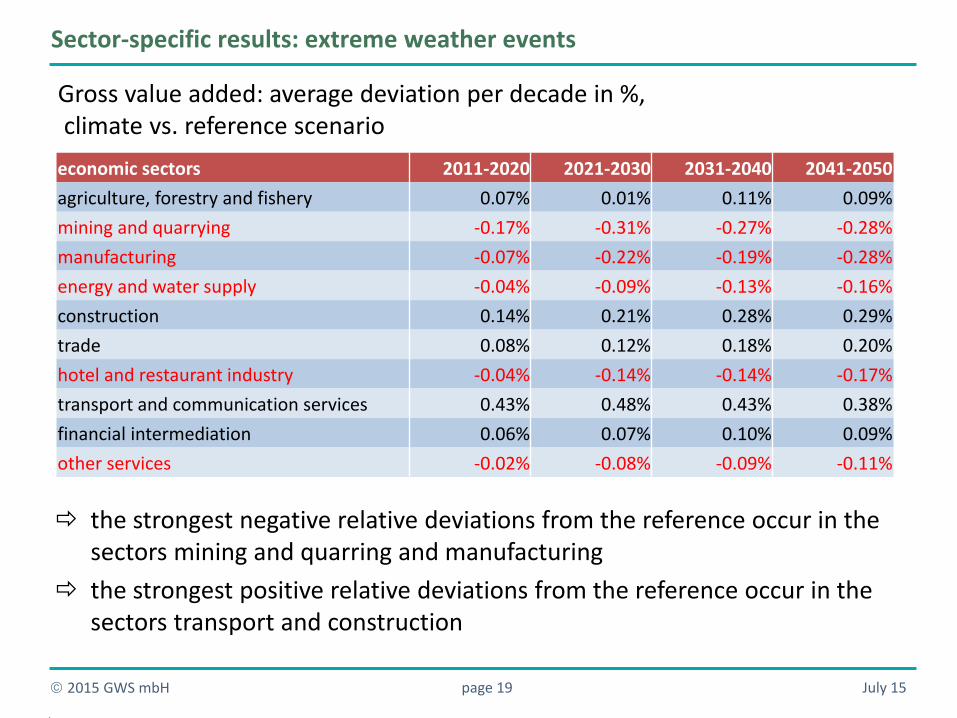
Sector-specific results: extreme weather events
Gross value added: average deviation per decade in %, climate vs. reference scenario
the strongest negative relative deviations from the reference occur in the sectors mining and quarring and manufacturing
the strongest positive relative deviations from the reference occur in the sectors transport and construction
economic sectors 2011-2020 2021-2030 2031-2040 2041-2050
agriculture, forestry and fishery 0.07% 0.01% 0.11% 0.09%
mining and quarrying -0.17% -0.31% -0.27% -0.28%
manufacturing -0.07% -0.22% -0.19% -0.28%
energy and water supply -0.04% -0.09% -0.13% -0.16%
construction 0.14% 0.21% 0.28% 0.29%
trade 0.08% 0.12% 0.18% 0.20%
hotel and restaurant industry -0.04% -0.14% -0.14% -0.17%
transport and communication services 0.43% 0.48% 0.43% 0.38%
financial intermediation 0.06% 0.07% 0.10% 0.09%
other services -0.02% -0.08% -0.09% -0.11%
July 15 page 20 2015 GWS mbH
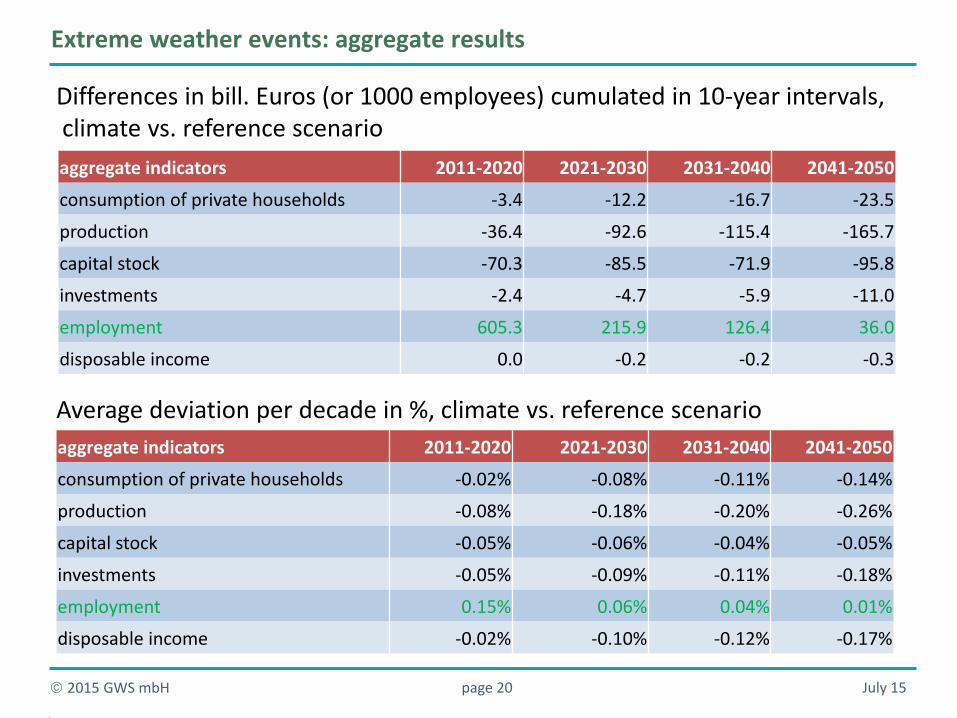
Differences in bill. Euros (or 1000 employees) cumulated in 10-year intervals, climate vs. reference scenario
Average deviation per decade in %, climate vs. reference scenario
Extreme weather events: aggregate results
aggregate indicators 2011-2020 2021-2030 2031-2040 2041-2050
consumption of private households -3.4 -12.2 -16.7 -23.5
production -36.4 -92.6 -115.4 -165.7
capital stock -70.3 -85.5 -71.9 -95.8
investments -2.4 -4.7 -5.9 -11.0
employment 605.3 215.9 126.4 36.0
disposable income 0.0 -0.2 -0.2 -0.3
aggregate indicators 2011-2020 2021-2030 2031-2040 2041-2050
consumption of private households -0.02% -0.08% -0.11% -0.14%
production -0.08% -0.18% -0.20% -0.26%
capital stock -0.05% -0.06% -0.04% -0.05%
investments -0.05% -0.09% -0.11% -0.18%
employment 0.15% 0.06% 0.04% 0.01%
disposable income -0.02% -0.10% -0.12% -0.17%
July 15 page 21 2015 GWS mbH
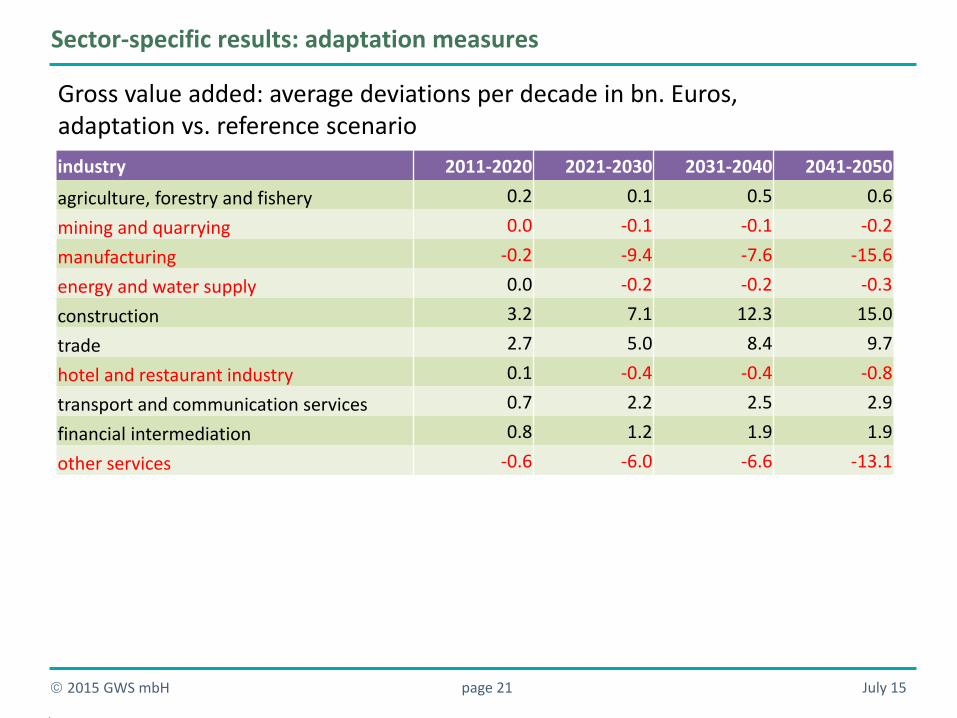
Sector-specific results: adaptation measures
Gross value added: average deviations per decade in bn. Euros, adaptation vs. reference scenario
industry 2011-2020 2021-2030 2031-2040 2041-2050
agriculture, forestry and fishery 0.2 0.1 0.5 0.6
mining and quarrying 0.0 -0.1 -0.1 -0.2
manufacturing -0.2 -9.4 -7.6 -15.6
energy and water supply 0.0 -0.2 -0.2 -0.3
construction 3.2 7.1 12.3 15.0
trade 2.7 5.0 8.4 9.7
hotel and restaurant industry 0.1 -0.4 -0.4 -0.8
transport and communication services 0.7 2.2 2.5 2.9
financial intermediation 0.8 1.2 1.9 1.9
other services -0.6 -6.0 -6.6 -13.1
July 15 page 22 2015 GWS mbH
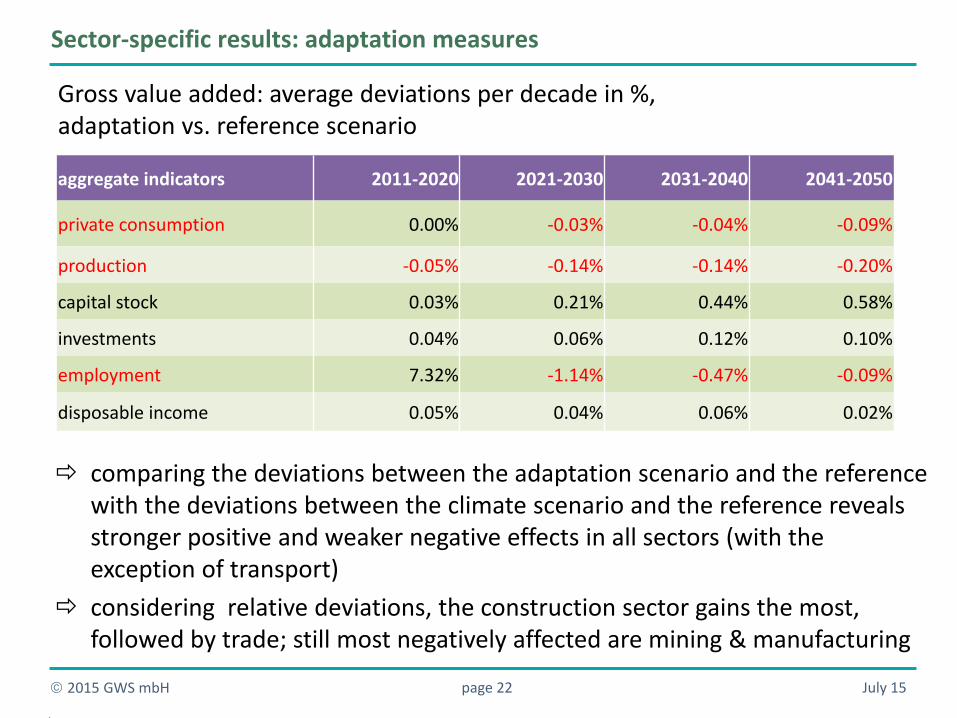
Sector-specific results: adaptation measures
Gross value added: average deviations per decade in %, adaptation vs. reference scenario
comparing the deviations between the adaptation scenario and the reference with the deviations between the climate scenario and the reference reveals stronger positive and weaker negative effects in all sectors (with the exception of transport)
considering relative deviations, the construction sector gains the most, followed by trade; still most negatively affected are mining & manufacturing
aggregate indicators 2011-2020 2021-2030 2031-2040 2041-2050
private consumption 0.00% -0.03% -0.04% -0.09%
production -0.05% -0.14% -0.14% -0.20%
capital stock 0.03% 0.21% 0.44% 0.58%
investments 0.04% 0.06% 0.12% 0.10%
employment 7.32% -1.14% -0.47% -0.09%
disposable income 0.05% 0.04% 0.06% 0.02%
July 15 page 23 2015 GWS mbH
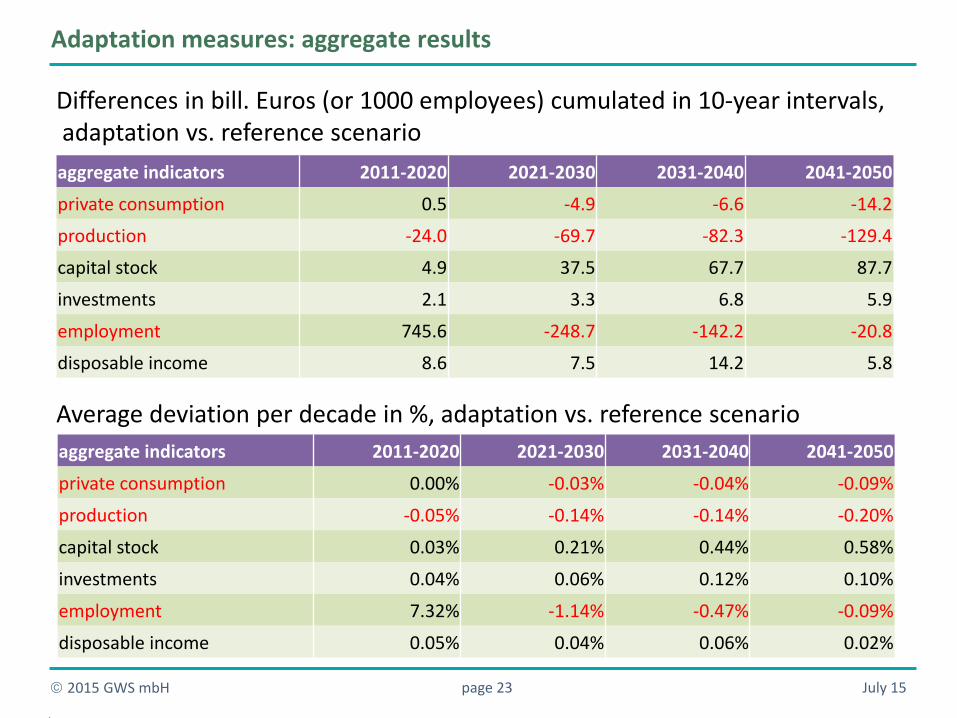
Differences in bill. Euros (or 1000 employees) cumulated in 10-year intervals, adaptation vs. reference scenario
Average deviation per decade in %, adaptation vs. reference scenario
Adaptation measures: aggregate results
aggregate indicators 2011-2020 2021-2030 2031-2040 2041-2050
private consumption 0.00% -0.03% -0.04% -0.09%
production -0.05% -0.14% -0.14% -0.20%
capital stock 0.03% 0.21% 0.44% 0.58%
investments 0.04% 0.06% 0.12% 0.10%
employment 7.32% -1.14% -0.47% -0.09%
disposable income 0.05% 0.04% 0.06% 0.02%
aggregate indicators 2011-2020 2021-2030 2031-2040 2041-2050
private consumption 0.5 -4.9 -6.6 -14.2
production -24.0 -69.7 -82.3 -129.4
capital stock 4.9 37.5 67.7 87.7
investments 2.1 3.3 6.8 5.9
employment 745.6 -248.7 -142.2 -20.8
disposable income 8.6 7.5 14.2 5.8
July 15 page 24 2015 GWS mbH
Contact: Dr. Ulrike Lehr Heinrichstraße 30 49080 Osnabrück Telefon: 0541-40933-xxx Email: [email protected] www.gws-os.com
Thank you for your attention!