Embed Size (px)
Citation preview
Deepak KaulSolution Consultant, Compuware APM
dynaTrace
We help organizations optimize the performance and value of their business-critical applications
• Web, non-Web, mobile, streaming, cloud-based applications• Rapid issue notification with actionable diagnostics• Insight into performance impacts business (revenue, brand, cost)
SaaS, Cloud-Based and
On-Premises Offerings
• Rapid startup and payback
*”Trends: The Diversification Of End User Experiencing Monitoring”, Forrester Research, Inc., July 5, 2011
4,000+ Customers Worldwide
• 2,500+ enterprise customers
• 1,500+ SMB customers
Global Reach• 80+ offices • 29 countries • 100s of partners• Global service
delivery
Recognized as Industry Leader
• Gartner:Leader in APM magic quadrant
• Forrester Research: “…a complete view of end user experience”*
• Ovum: “Game-changing”
A New Generation of APM
.
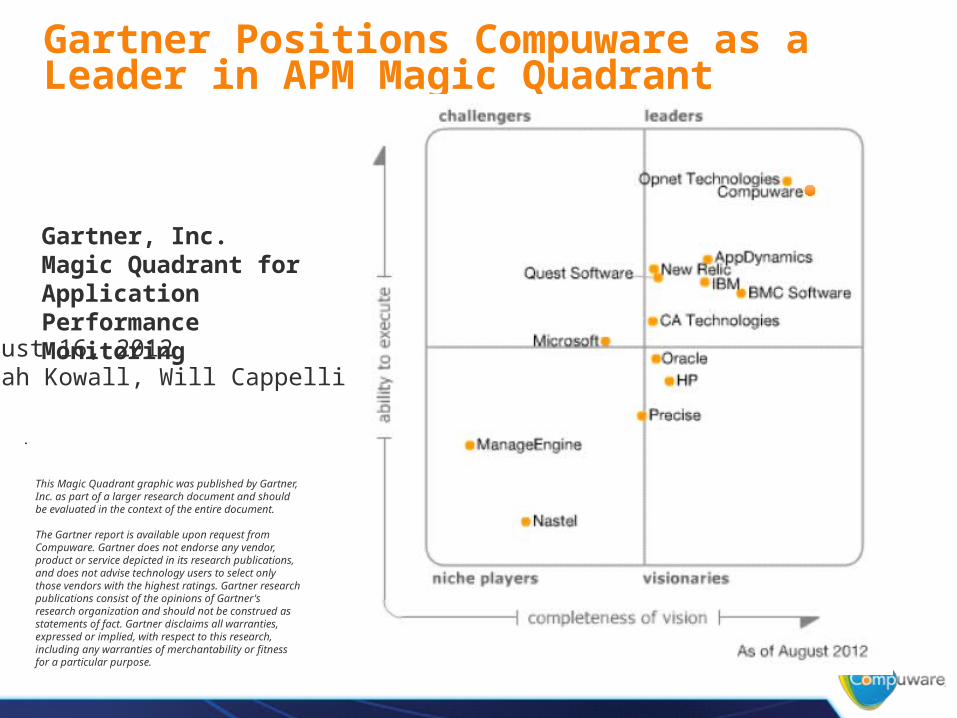
Gartner Positions Compuware as a Leader in APM Magic Quadrant
.
Gartner, Inc. Magic Quadrant for Application Performance Monitoring
August 16, 2012Jonah Kowall, Will Cappelli
This Magic Quadrant graphic was published by Gartner, Inc. as part of a larger research document and should be evaluated in the context of the entire document. The Gartner report is available upon request from Compuware. Gartner does not endorse any vendor, product or service depicted in its research publications, and does not advise technology users to select only those vendors with the highest ratings. Gartner research publications consist of the opinions of Gartner's research organization and should not be construed as statements of fact. Gartner disclaims all warranties, expressed or implied, with respect to this research, including any warranties of merchantability or fitness for a particular purpose.
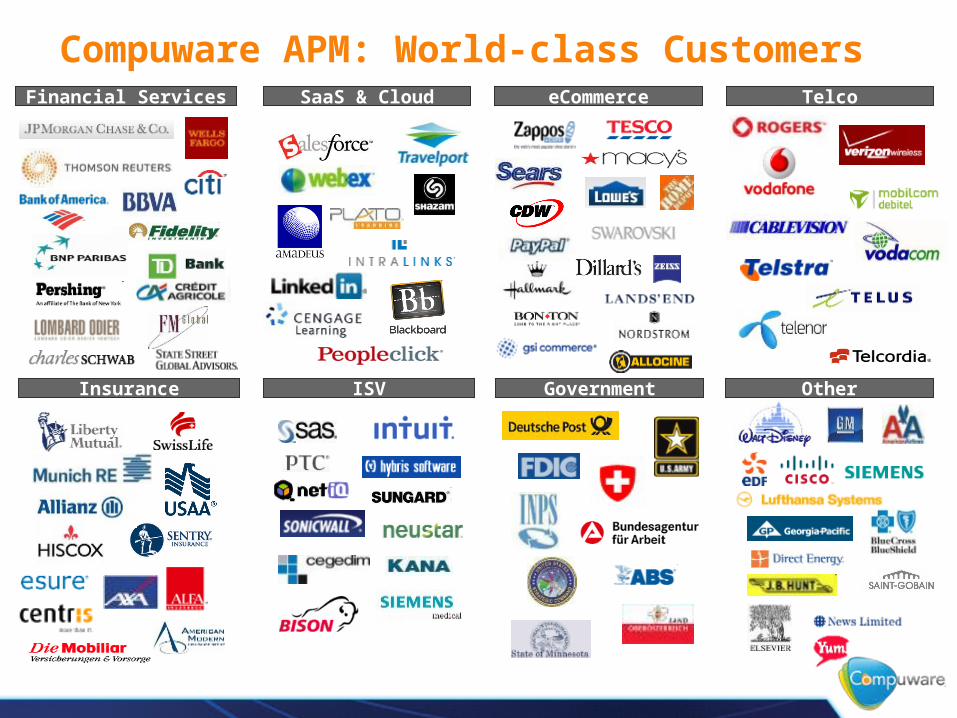
Compuware APM: World-class CustomersFinancial Services eCommerceSaaS & Cloud
OtherISV Government
Telco
Insurance
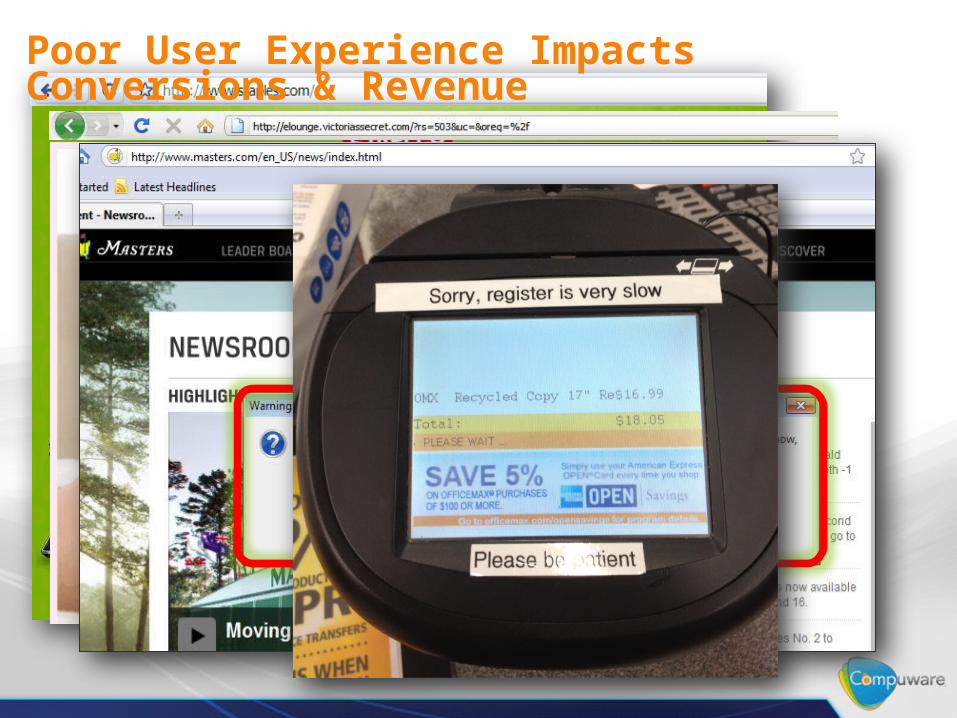
Poor User Experience Impacts Conversions & Revenue
6
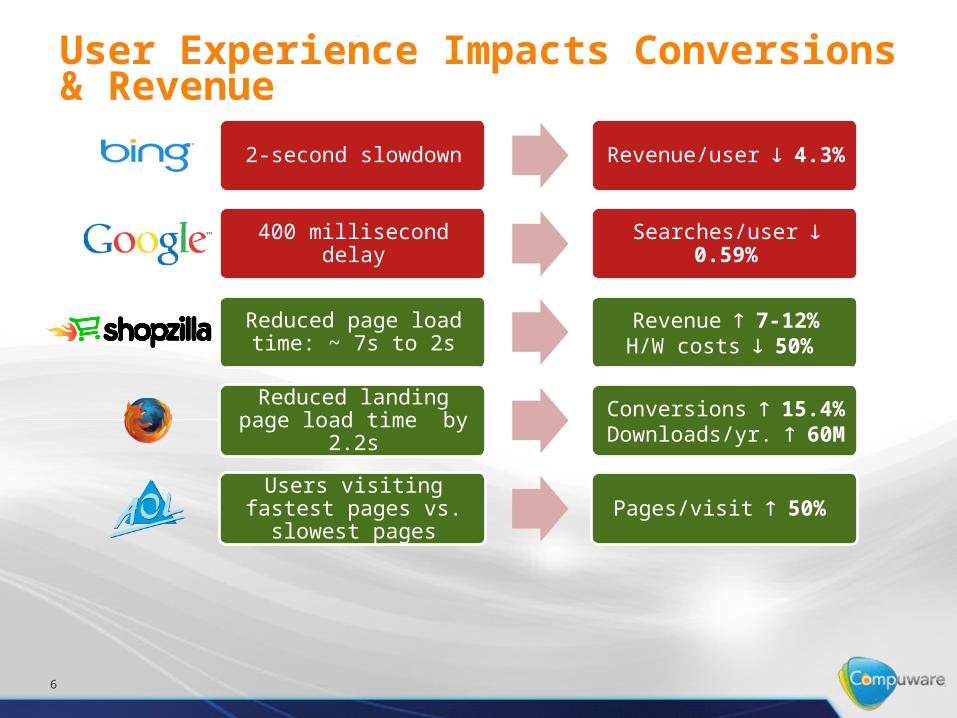
User Experience Impacts Conversions & Revenue
2-second slowdown Revenue/user 4.3%
400 millisecond delay Searches/user 0.59%
Reduced page load time: ~ 7s to 2s
Revenue 7-12%H/W costs 50%
Reduced landing page load time by 2.2s
Conversions 15.4%Downloads/yr. 60M
Users visiting fastest pages vs. slowest pages Pages/visit 50%
Browsers
Devices
Cloud, CDNs
Real Use
rs
Web 2.0
Web Tier
App., db Tier
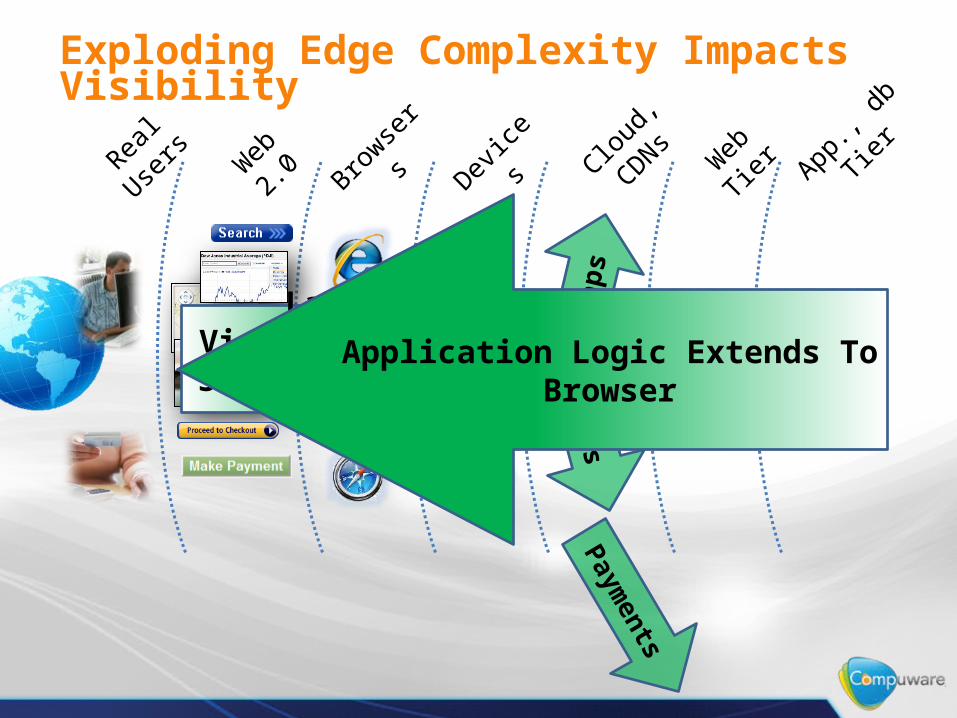
Exploding Edge Complexity Impacts Visibility
Lack Of Visibility Into 3rd Party Service Calls
Ads
Map
s
Payments
Application Logic Extends To Browser
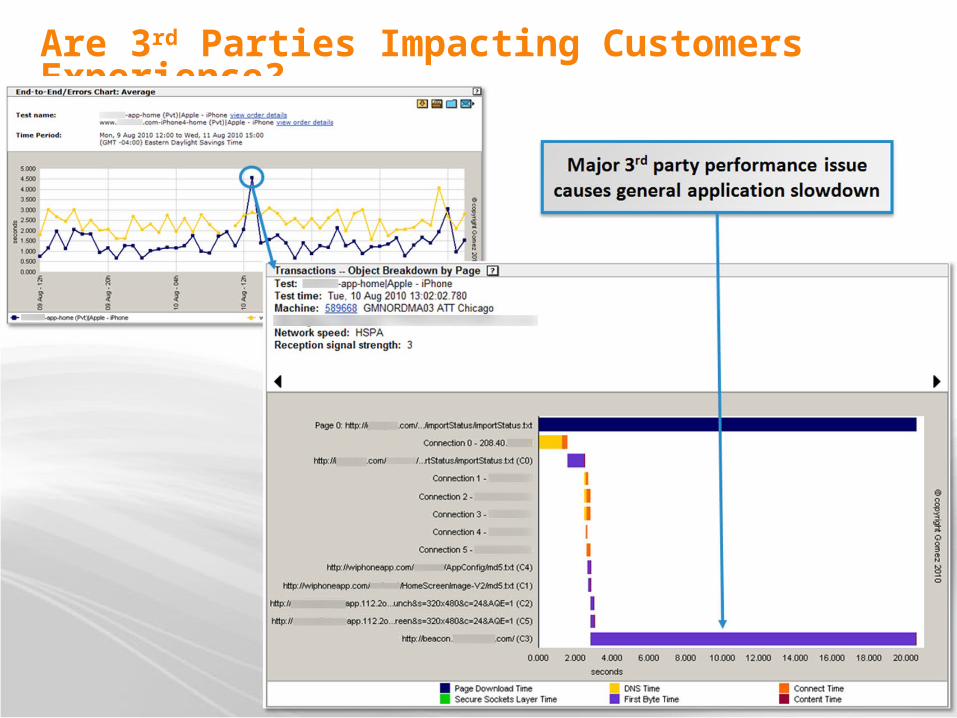
Are 3rd Parties Impacting Customers Experience?
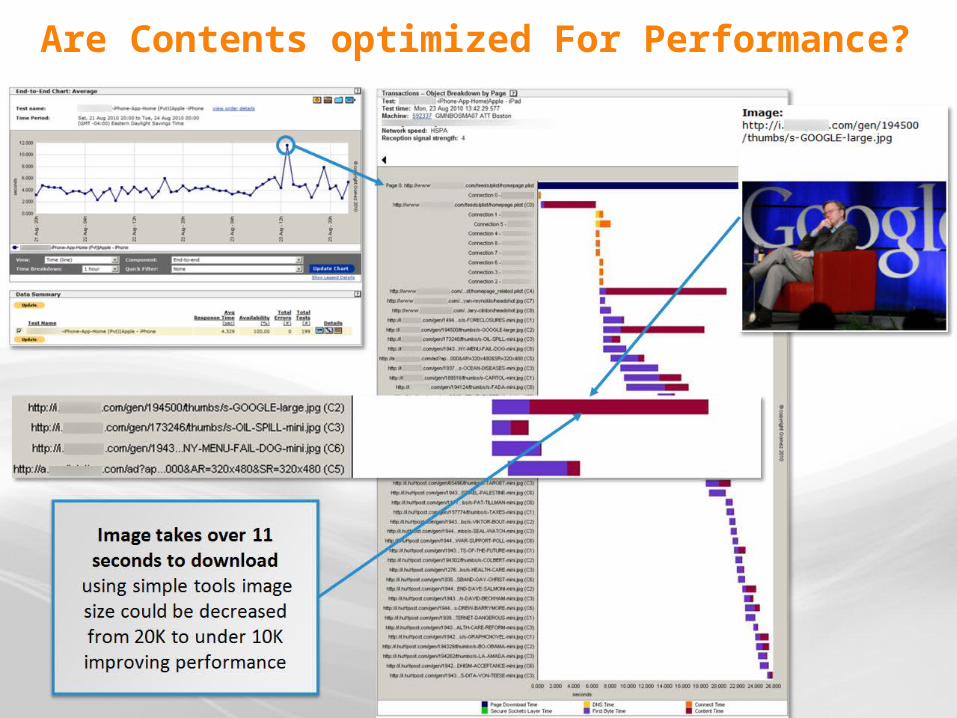
Are Contents optimized For Performance?
Backbone• Synthetic
monitoring• Load testing
Backbone• Synthetic
monitoring• Load testing
Last Mile• Synthetic
monitoring• Load testing
Last Mile• Synthetic
monitoring• Load testing
Real Users• User
experiencemanagement
Real Users• User
experiencemanagement
Application
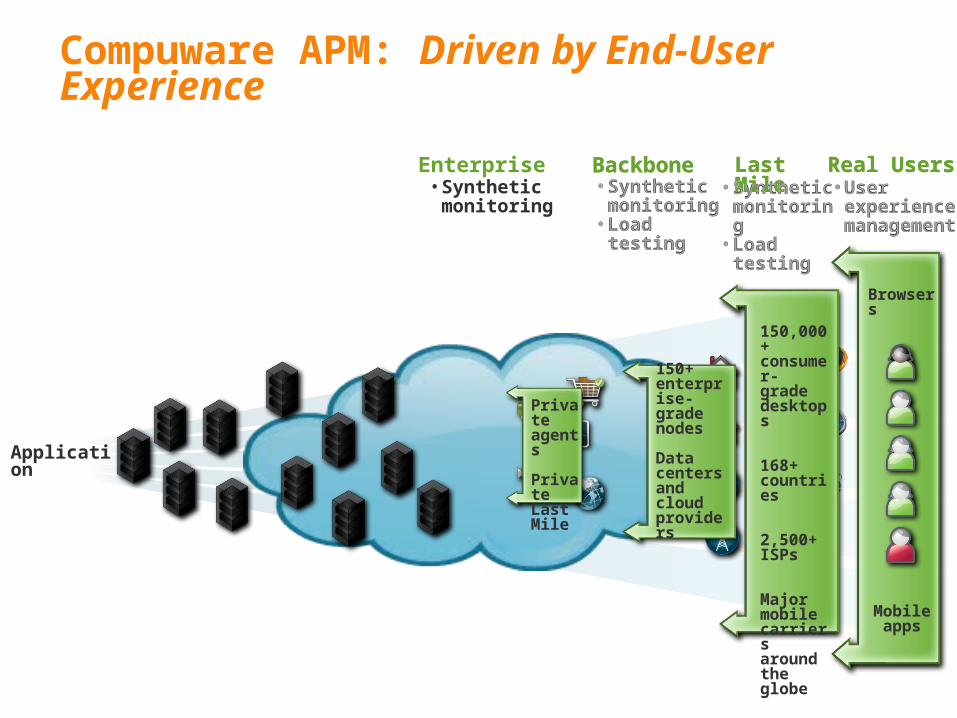
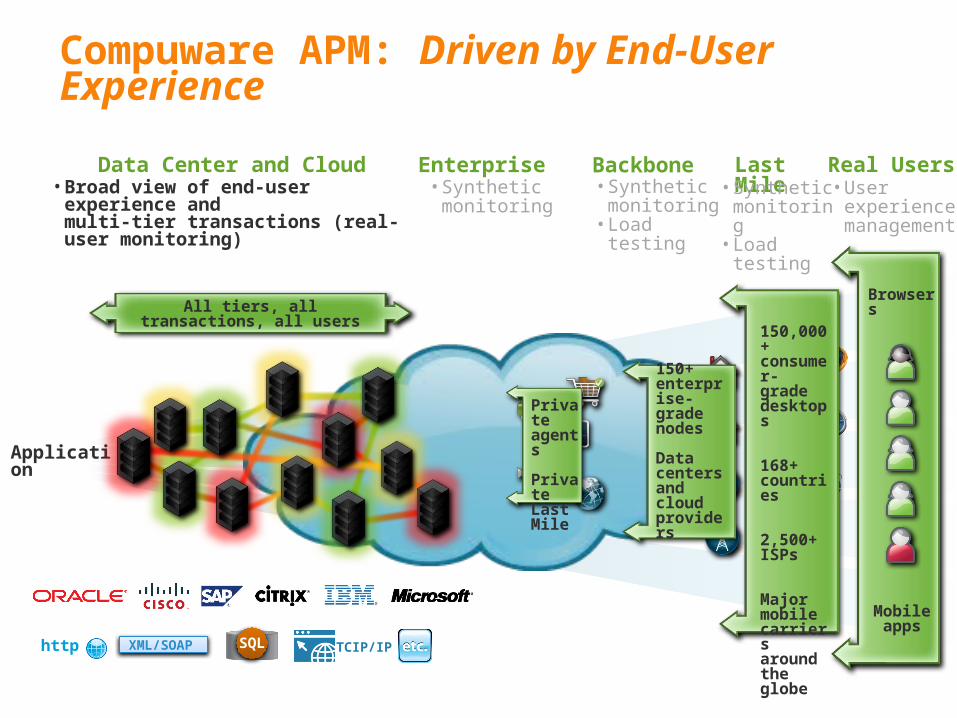
Compuware APM: Driven by End-User Experience
Private agents
Private Last Mile
150+ enterprise-grade nodes
Data centers and cloud providers
150,000+ consumer- grade desktops
168+ countries
2,500+ISPs
Major mobile carriers around the globe
Browsers
Mobile apps
Enterprise• Synthetic
monitoring
Application
Compuware APM: Driven by End-User Experience
Backbone• Synthetic
monitoring• Load testing
Last Mile• Synthetic
monitoring• Load testing
Enterprise• Synthetic
monitoring• Broad view of end-user experience and
multi-tier transactions (real-user monitoring)
Data Center and Cloud
XML/SOAPhttp SQL TCIP/IP
150,000+ consumer- grade desktops
168+ countries
2,500+ISPs
Major mobile carriers around the globe
All tiers, all transactions, all users
Private agents
Private Last Mile
Browsers
Mobile apps
150+ enterprise-grade nodes
Data centers and cloud providers
Real Users• User
experiencemanagement
Deep analysis
Application
Browsers
Mobile apps
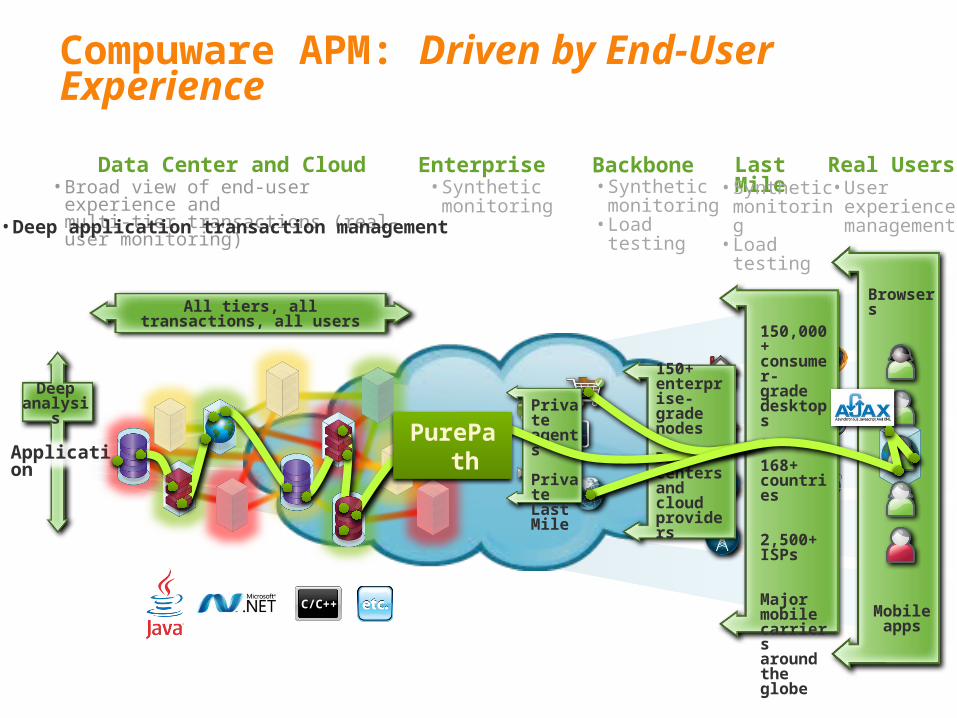
Compuware APM: Driven by End-User Experience
C/C++
Private agents
Private Last Mile
150,000+ consumer- grade desktops
168+ countries
2,500+ISPs
Major mobile carriers around the globe
Backbone• Synthetic
monitoring• Load testing
Last Mile• Synthetic
monitoring• Load testing
Enterprise• Synthetic
monitoring• Broad view of end-user experience and
multi-tier transactions (real-user monitoring)
Data Center and Cloud
• Deep application transaction management
All tiers, all transactions, all users
150+ enterprise-grade nodes
Data centers and cloud providers
PurePath
Real Users• User
experiencemanagement
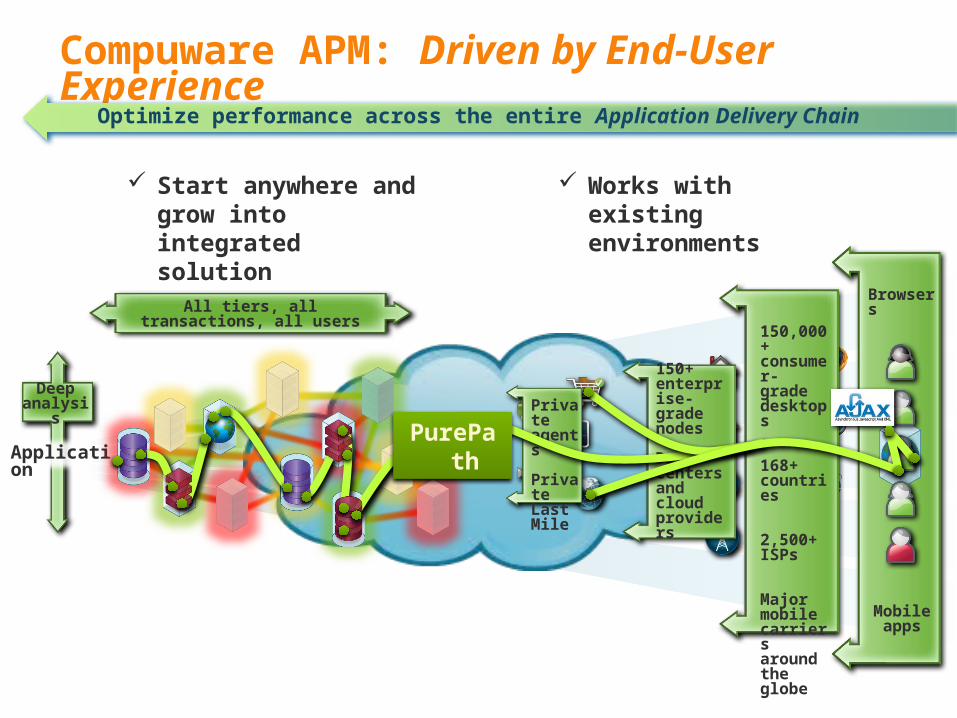
Compuware APM: Driven by End-User ExperienceOptimize performance across the entire Application Delivery Chain
Start anywhere and grow into integrated solution
Works with existing environments
Deep analysis
Application
Private agents
Private Last Mile
150,000+ consumer- grade desktops
168+ countries
2,500+ISPs
Major mobile carriers around the globe
All tiers, all transactions, all users
150+ enterprise-grade nodes
Data centers and cloud providers
PurePath
Browsers
Mobile apps
dynaTrace
Compuware Confidential – Do Not Duplicate
Compuware Confidential – Do Not Duplicate
Compuware Confidential – Do Not Duplicate
a
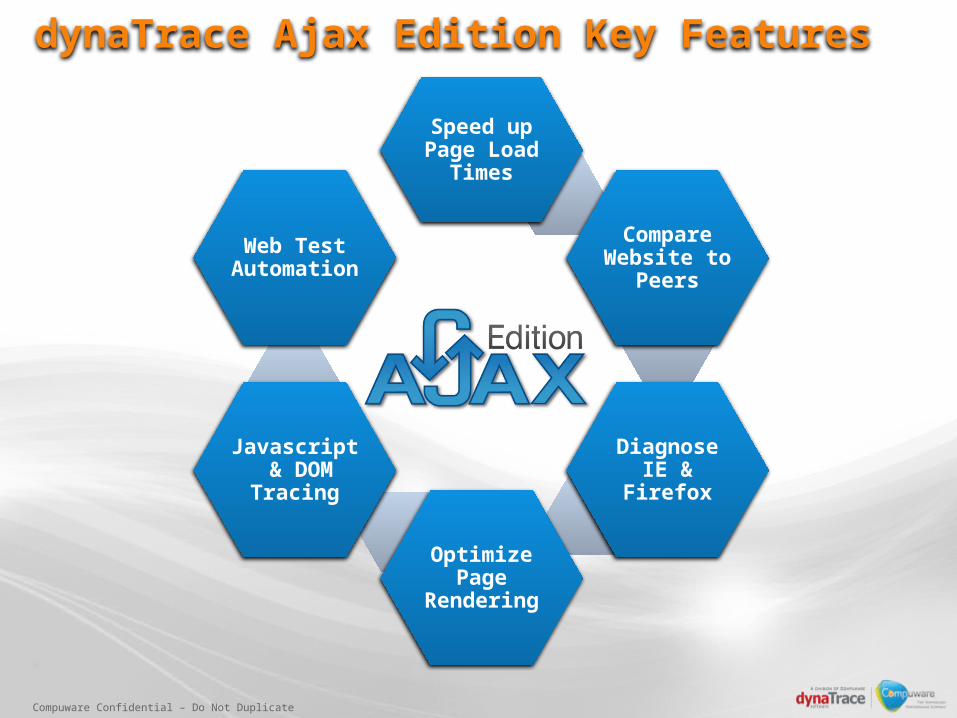
Speed up Page Load Times
Compare Website to
Peers
Diagnose IE & Firefox
Optimize Page Rendering
Javascript & DOM Tracing
Web Test Automation
dynaTrace Ajax Edition Key Features
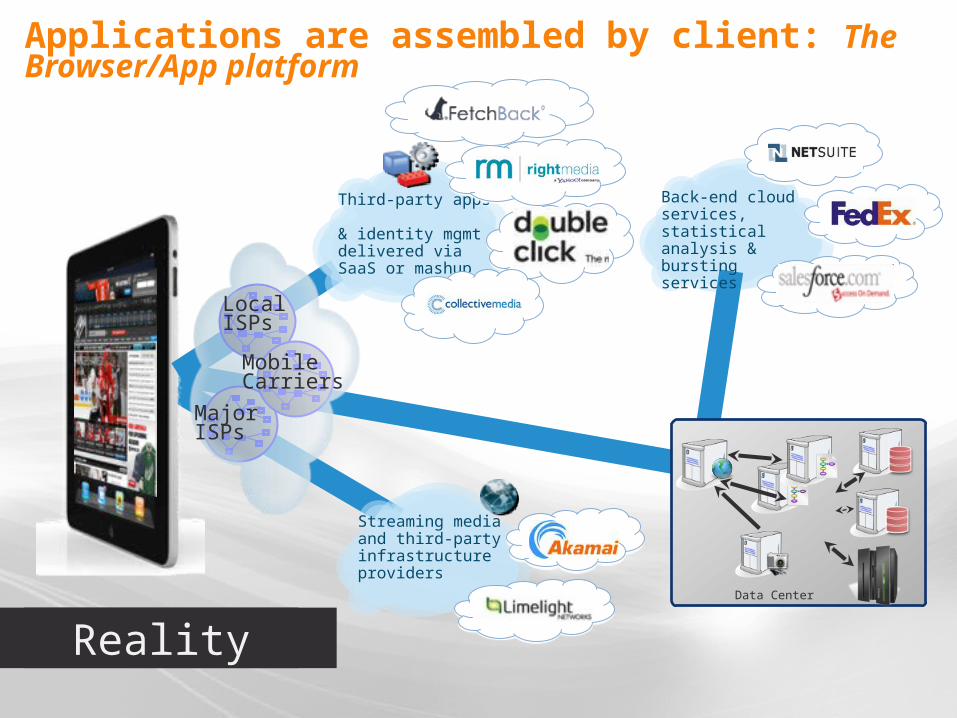
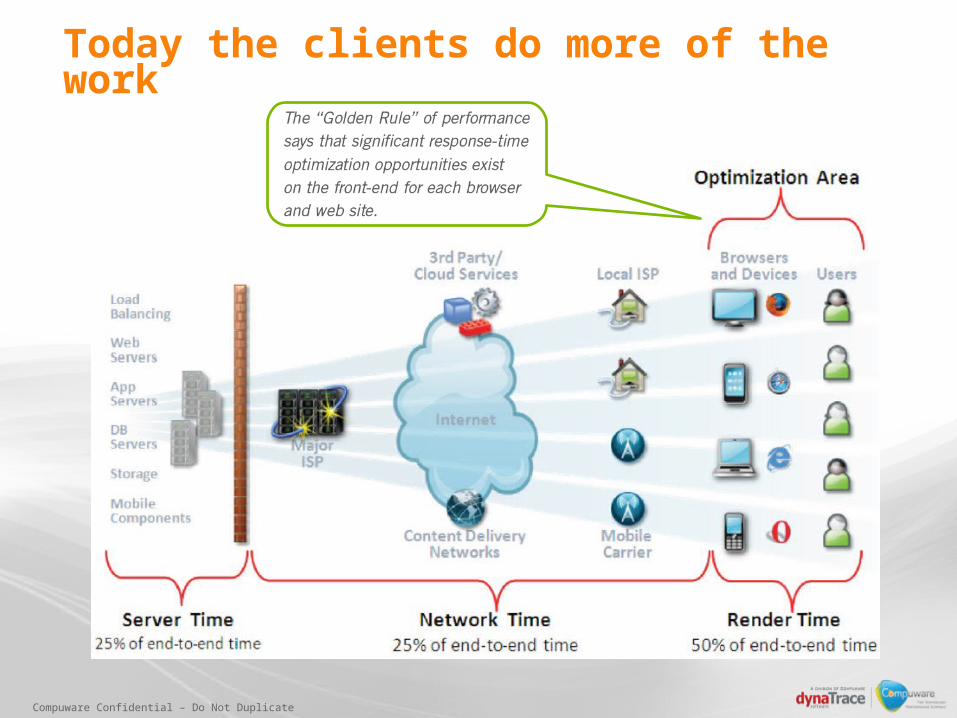
Back-end cloud services, statistical analysis & bursting services
Applications are assembled by client: The Browser/App platform
Streaming media and third-party infrastructure providers
Data Center
Third-party apps & identity mgmt delivered via SaaS or mashup
Local ISPs
Mobile Carriers
MajorISPs
Perception Reality
Compuware Confidential – Do Not Duplicate
Today the clients do more of the work
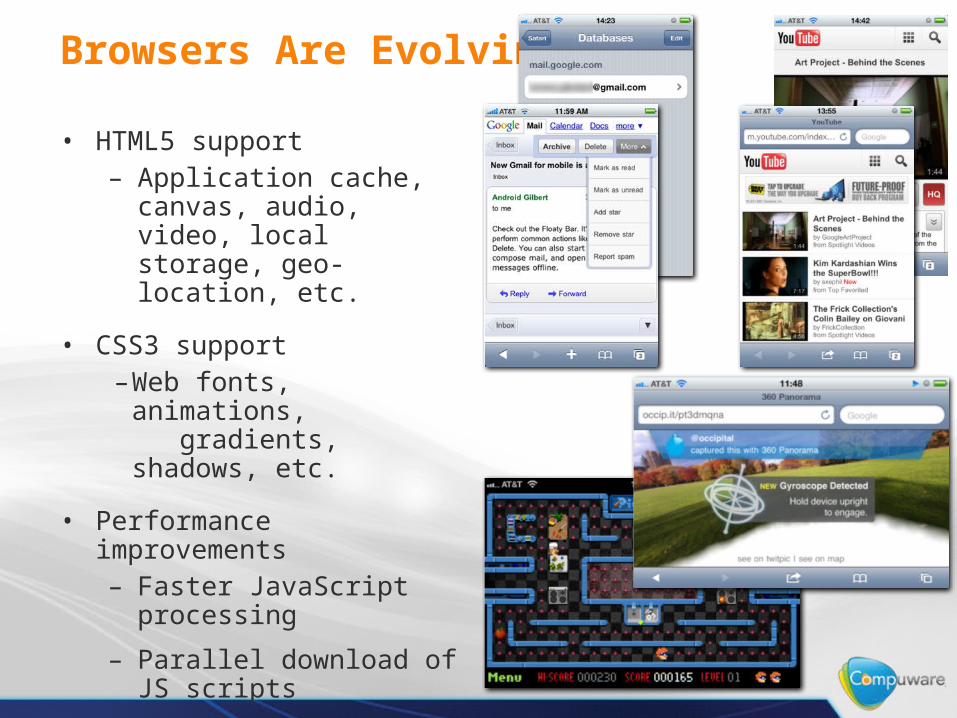
Browsers Are Evolving
• HTML5 support– Application cache, canvas,
audio, video, local storage, geo-location, etc.
• CSS3 support–Web fonts, animations,
gradients, shadows, etc.
• Performance improvements– Faster JavaScript processing
– Parallel download of JS scripts
– More parallel connections
– Resource pre-fetching
– Multi-threading in JS
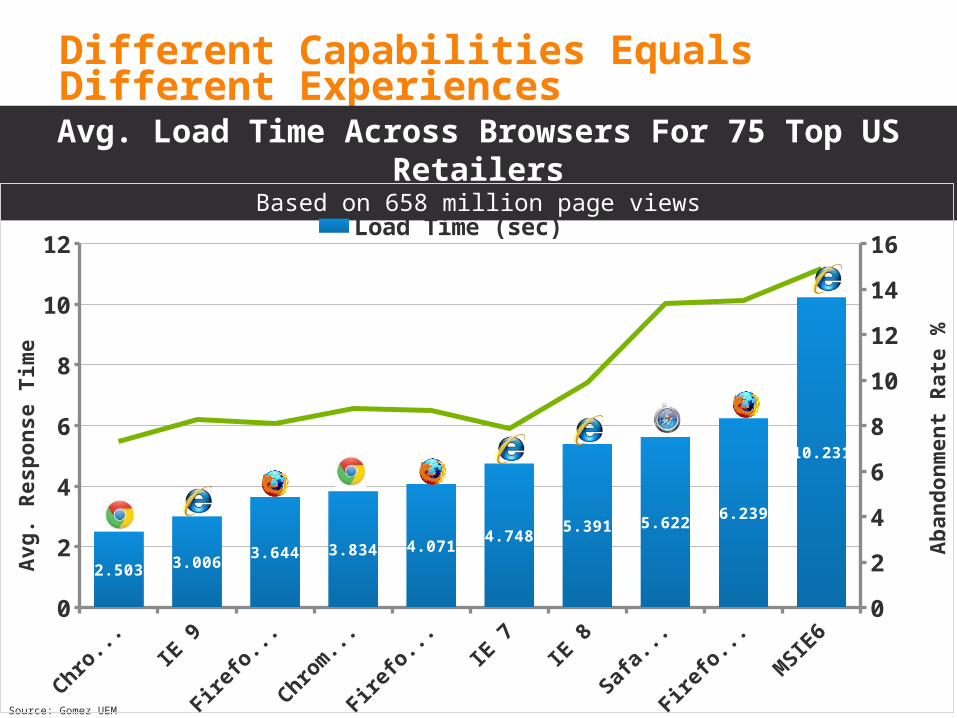
Different Capabilities Equals Different Experiences
Source: Gomez UEM
Avg. Load Time Across Browsers For 75 Top US RetailersBased on 658 million page views
Chrome23IE
9
Firefox 1
4
Chrome 20
Firefox 1
3IE
7IE
8
Safar
i 5
Firefox3
.6MSIE
60
2
4
6
8
10
12
0
2
4
6
8
10
12
14
16
2.503 3.0063.644 3.834 4.071
4.7485.391 5.622 6.239
10.231
Load Time (sec) Abandonment Rate (%)
Avg.
Res
pons
e Ti
me
Aban
donm
ent R
ate
%
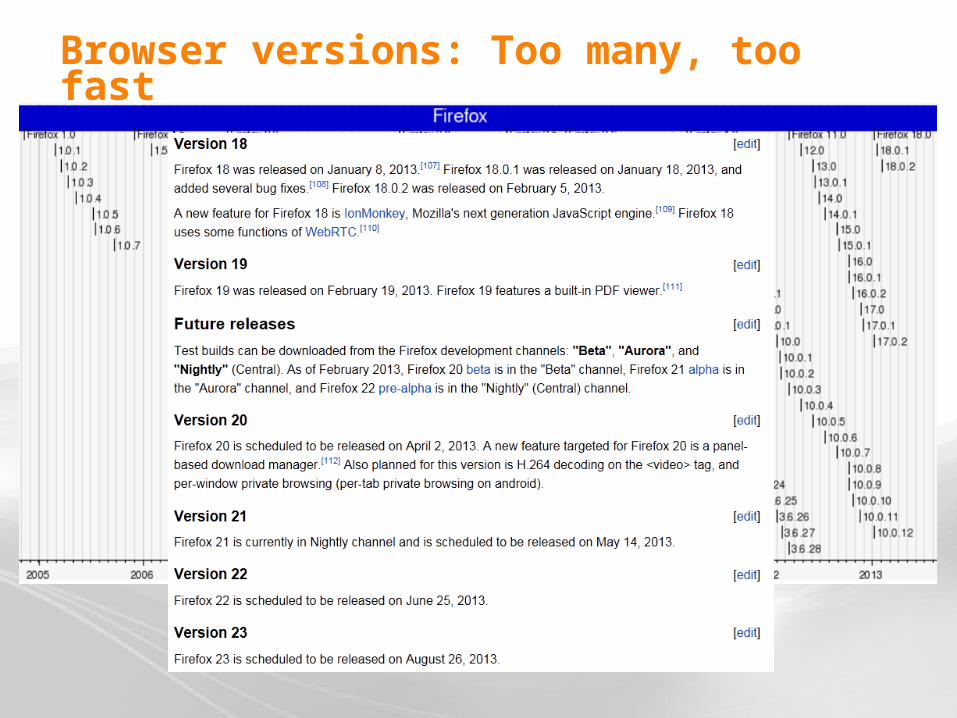
Browser versions: Too many, too fast
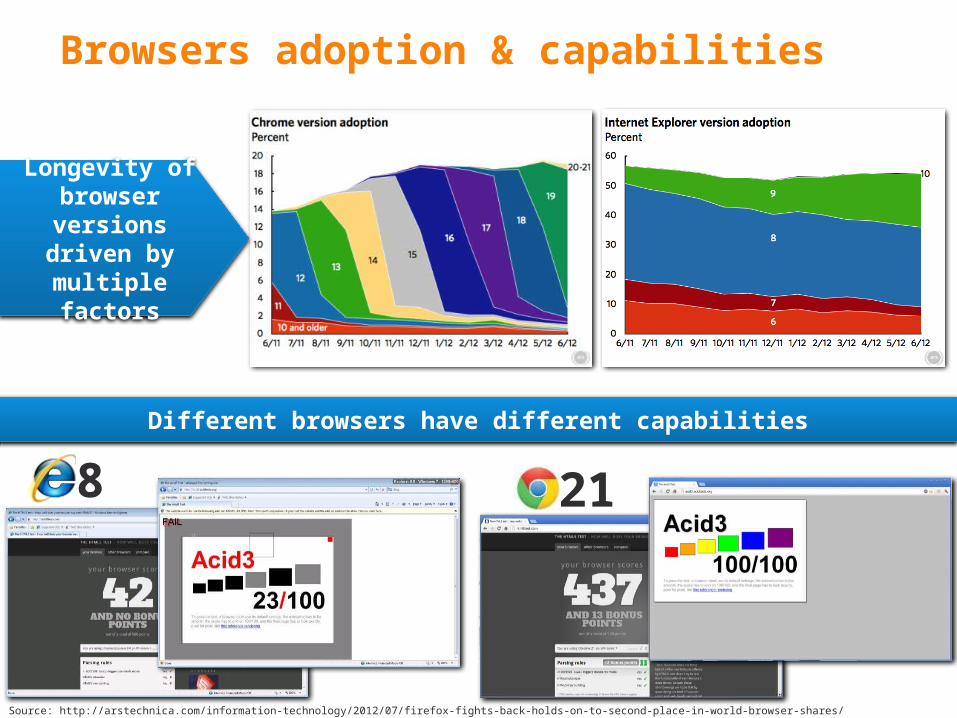
Browsers adoption & capabilities
Source: http://arstechnica.com/information-technology/2012/07/firefox-fights-back-holds-on-to-second-place-in-world-browser-shares/
Longevity of browser versions
driven by multiple factors
Different browsers have different capabilities
8 21
Compuware Confidential – Do Not Duplicate
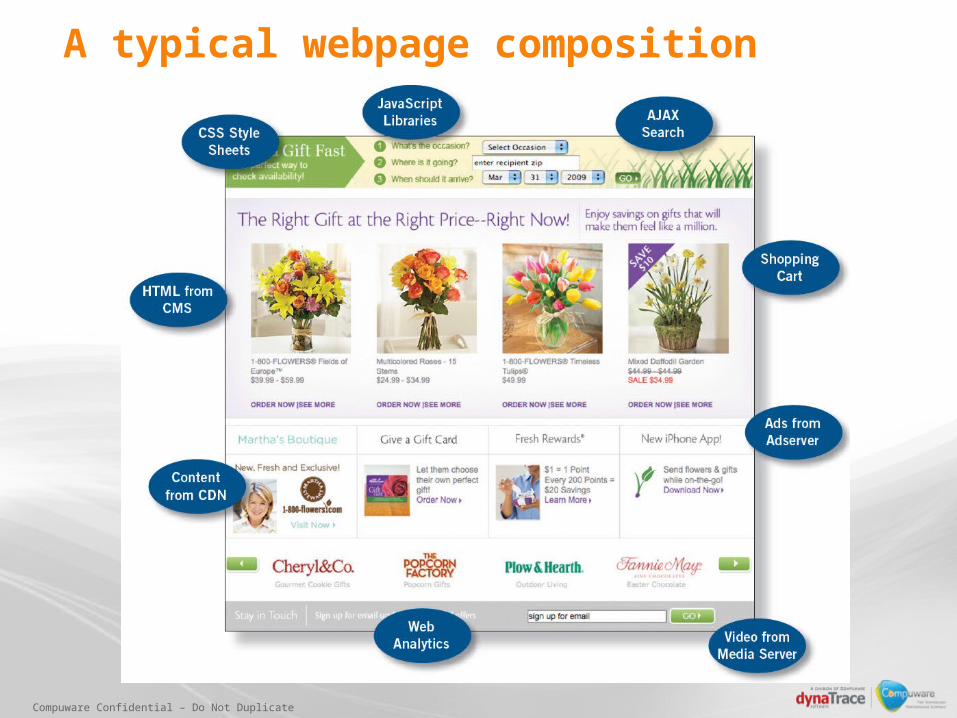
A typical webpage composition

Compuware Confidential – Do Not Duplicate
A typical webpage composition
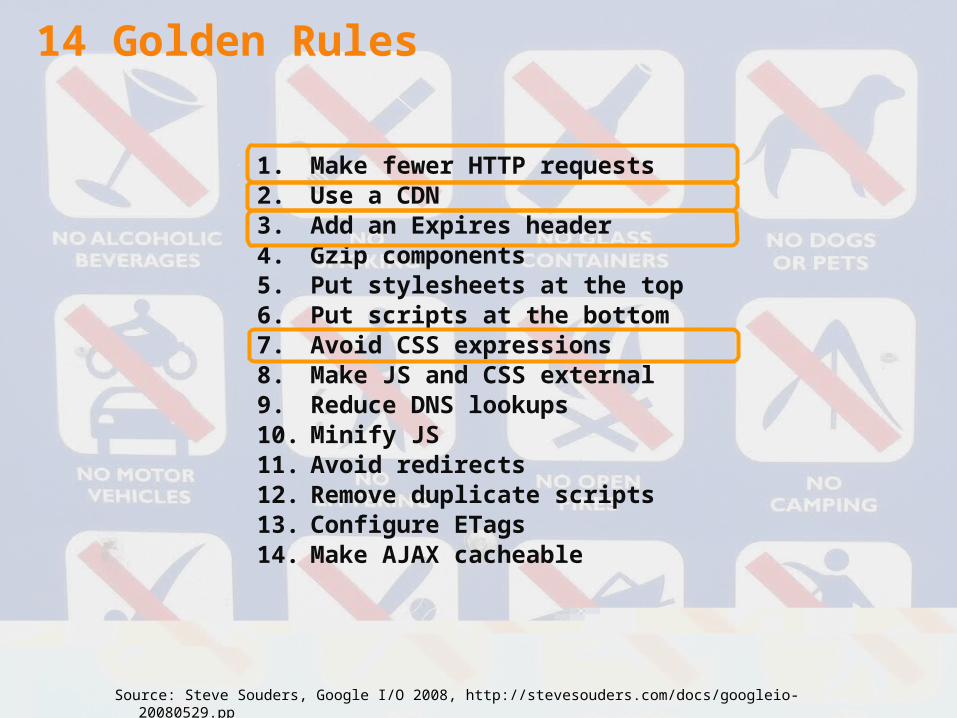
1. Make fewer HTTP requests2. Use a CDN3. Add an Expires header4. Gzip components5. Put stylesheets at the top6. Put scripts at the bottom7. Avoid CSS expressions8. Make JS and CSS external9. Reduce DNS lookups10. Minify JS11. Avoid redirects12. Remove duplicate scripts13. Configure ETags14. Make AJAX cacheable
Source: Steve Souders, Google I/O 2008, http://stevesouders.com/docs/googleio-20080529.pp
14 Golden Rules
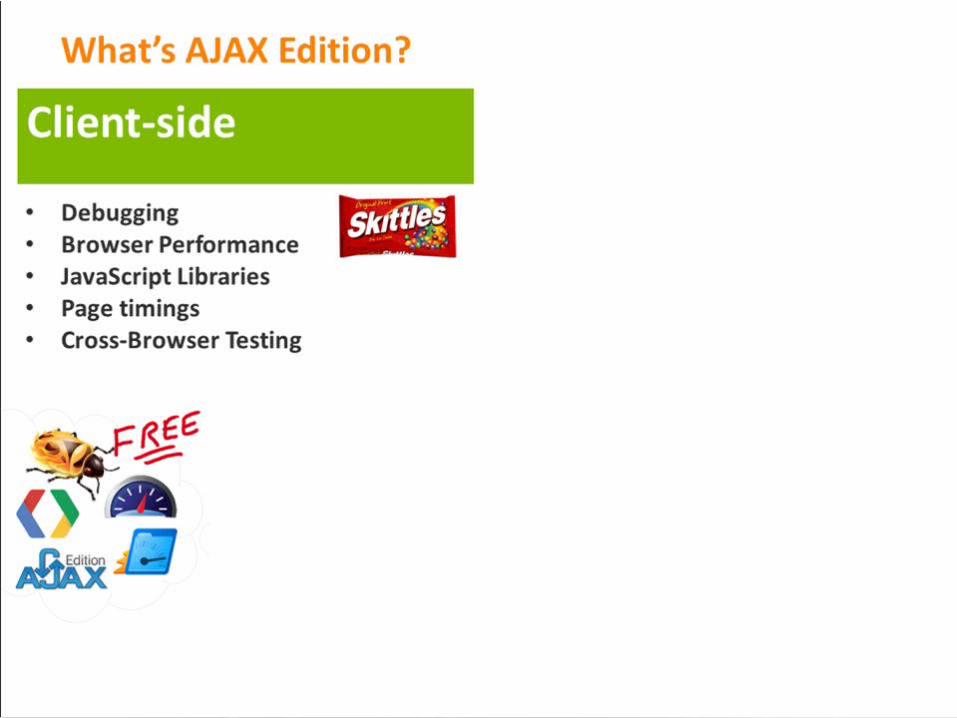
dynaTrace - Ajax Edition Demo
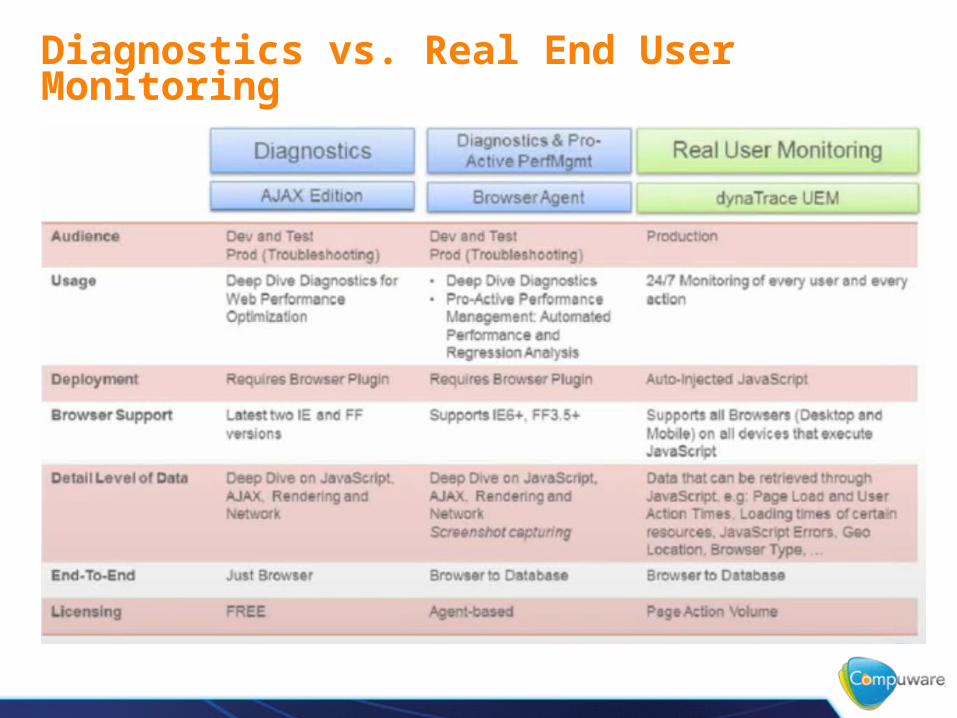
Diagnostics vs. Real End User Monitoring
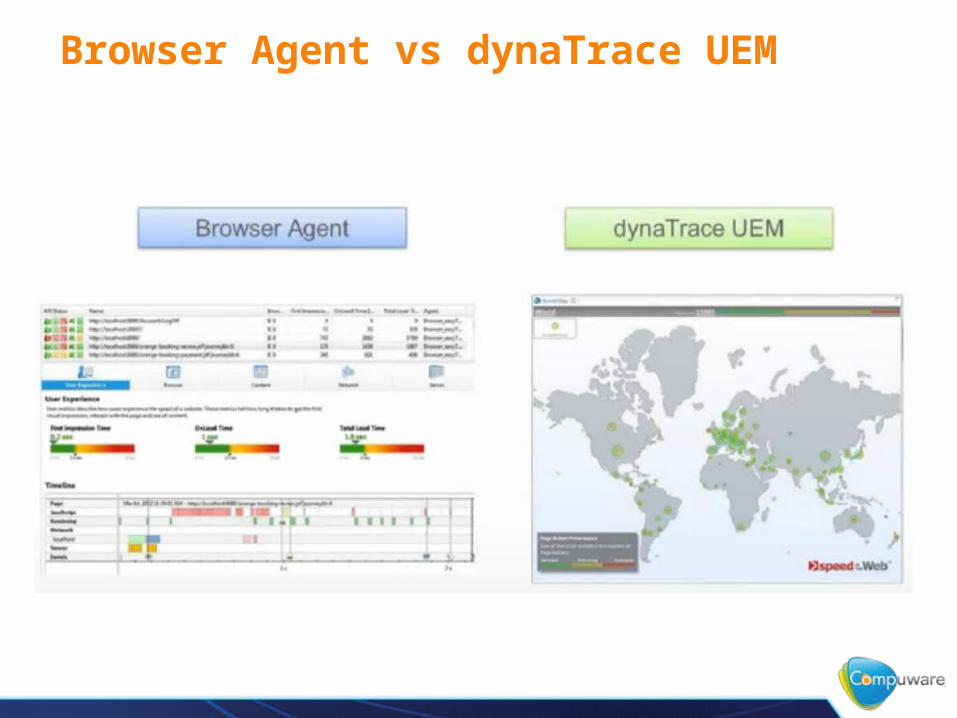
Browser Agent vs dynaTrace UEM
Q&A
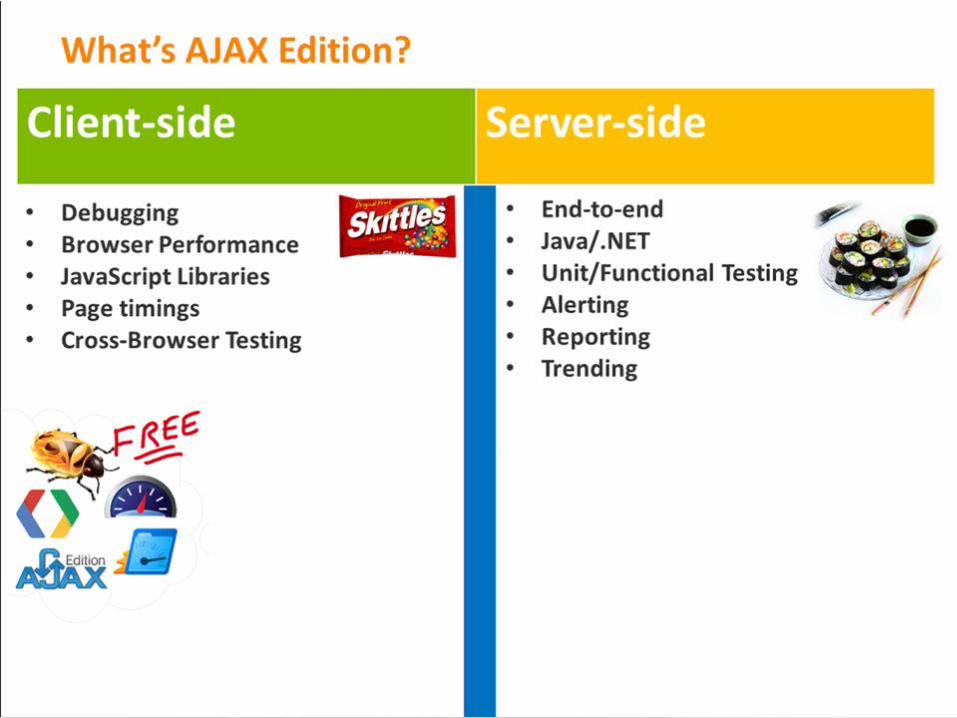
dynaTrace Ajax Edition
Deepak KaulSolution Consultant, Compuware APM