Embed Size (px)
Citation preview
Building Resilient Services in GoGopherCon Korea 201515 August 2015
장재휴Developer, Purpleworks
Who am I
purpleworks
Ruby, C#, Go, etc.
Resiliency
References
sourcegraph.com/blog/live/gophercon2015/123664481750(https://sourcegraph.com/blog/live/gophercon2015/123664481750)
1. Careful Coding
1. Careful Coding: #Error Handling & Clean-up
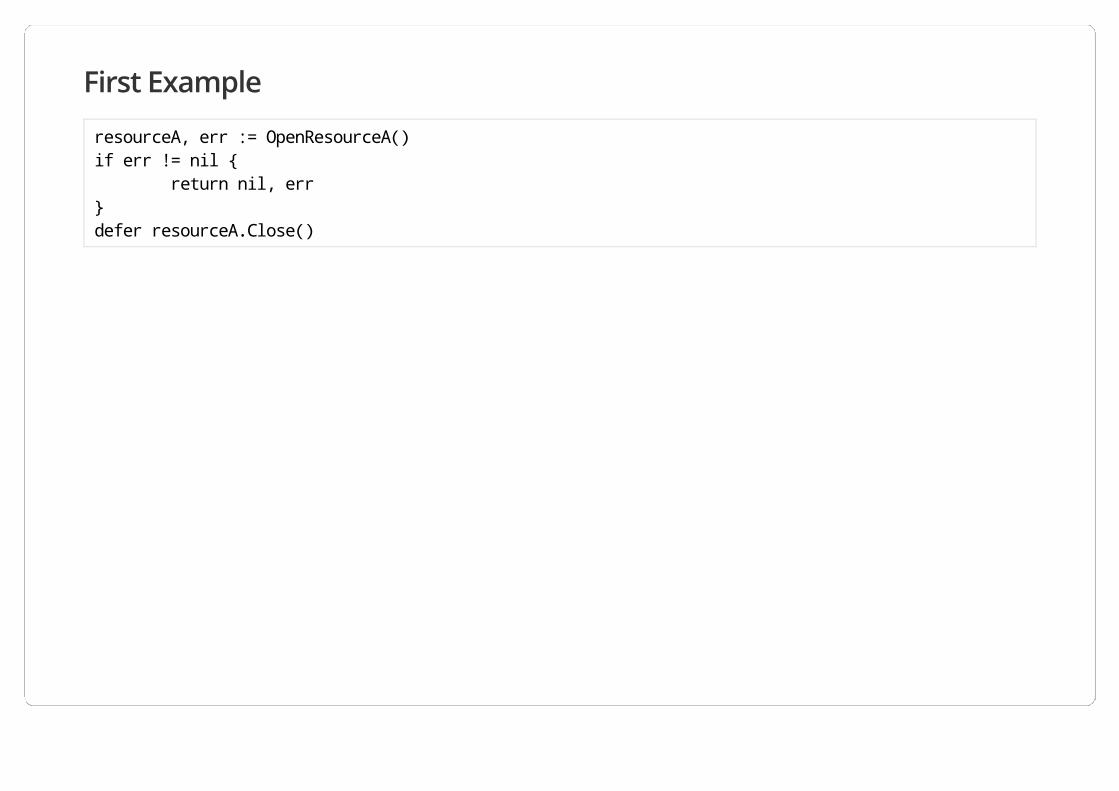
First Example
resourceA, err := OpenResourceA()if err != nil { return nil, err}defer resourceA.Close()
What About nil?
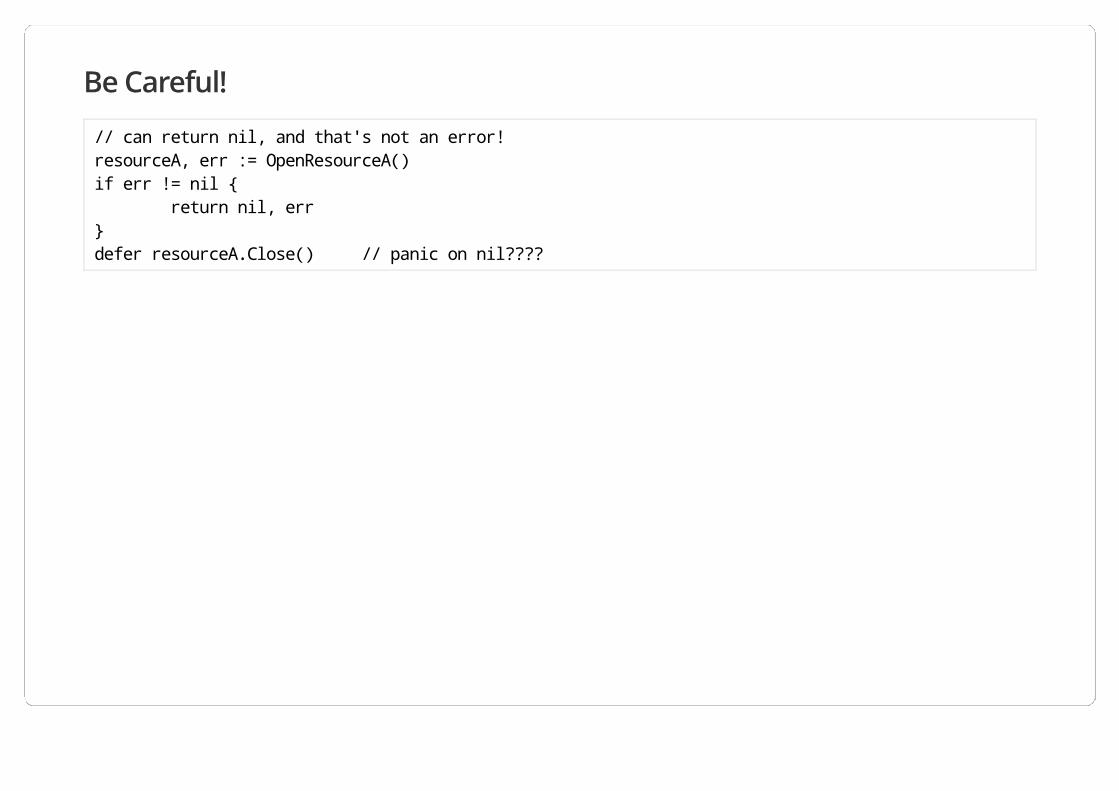
Be Careful!
// can return nil, and that's not an error!resourceA, err := OpenResourceA()if err != nil { return nil, err}defer resourceA.Close() // panic on nil????
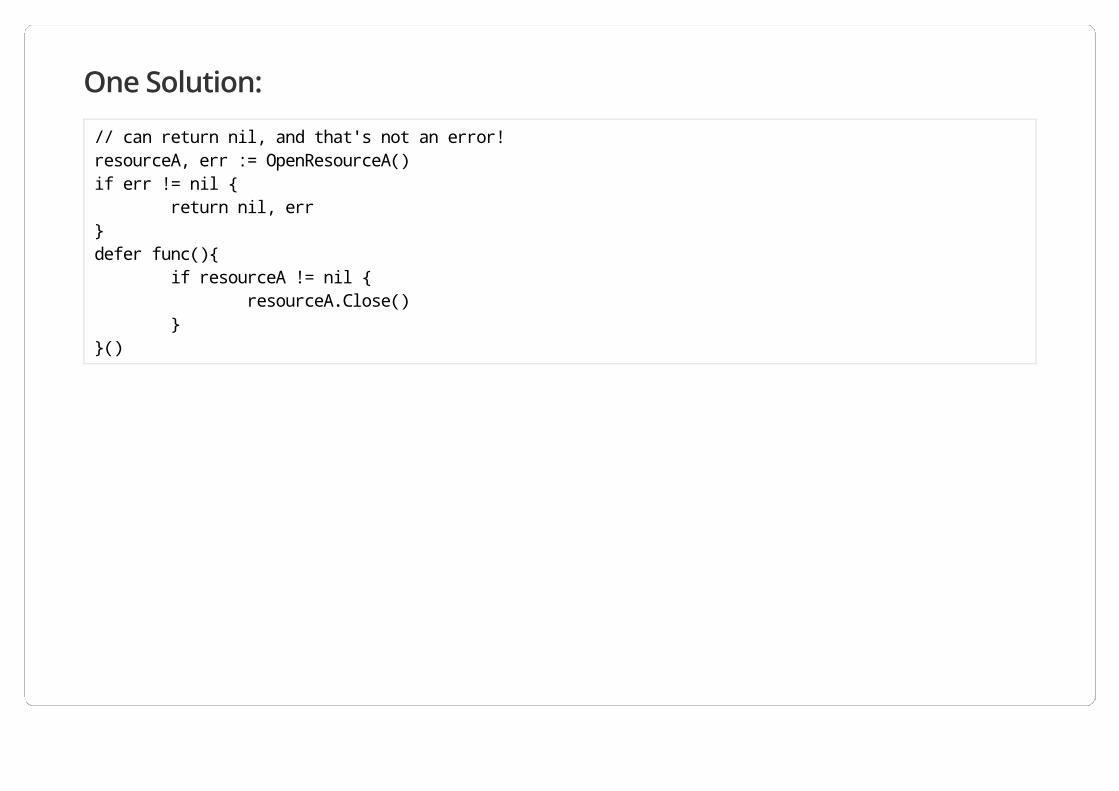
One Solution:
// can return nil, and that's not an error!resourceA, err := OpenResourceA()if err != nil { return nil, err}defer func(){ if resourceA != nil { resourceA.Close() }}()
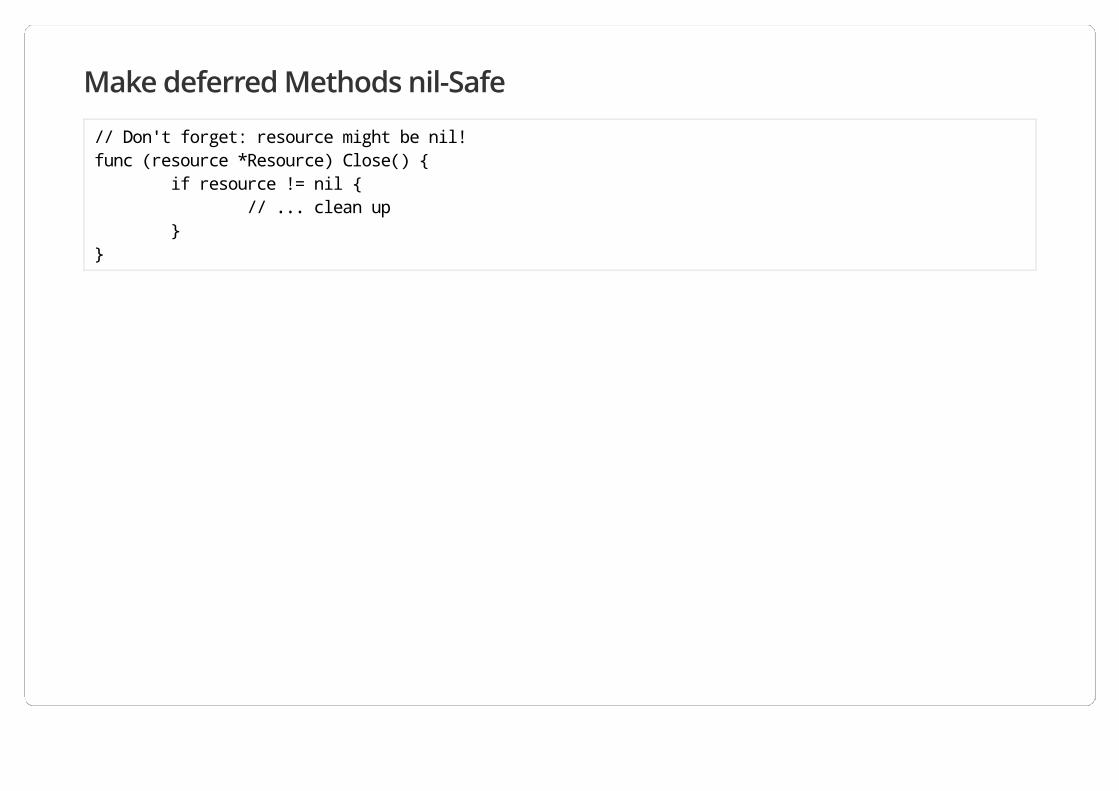
Make deferred Methods nil-Safe
// Don't forget: resource might be nil!func (resource *Resource) Close() { if resource != nil { // ... clean up }}
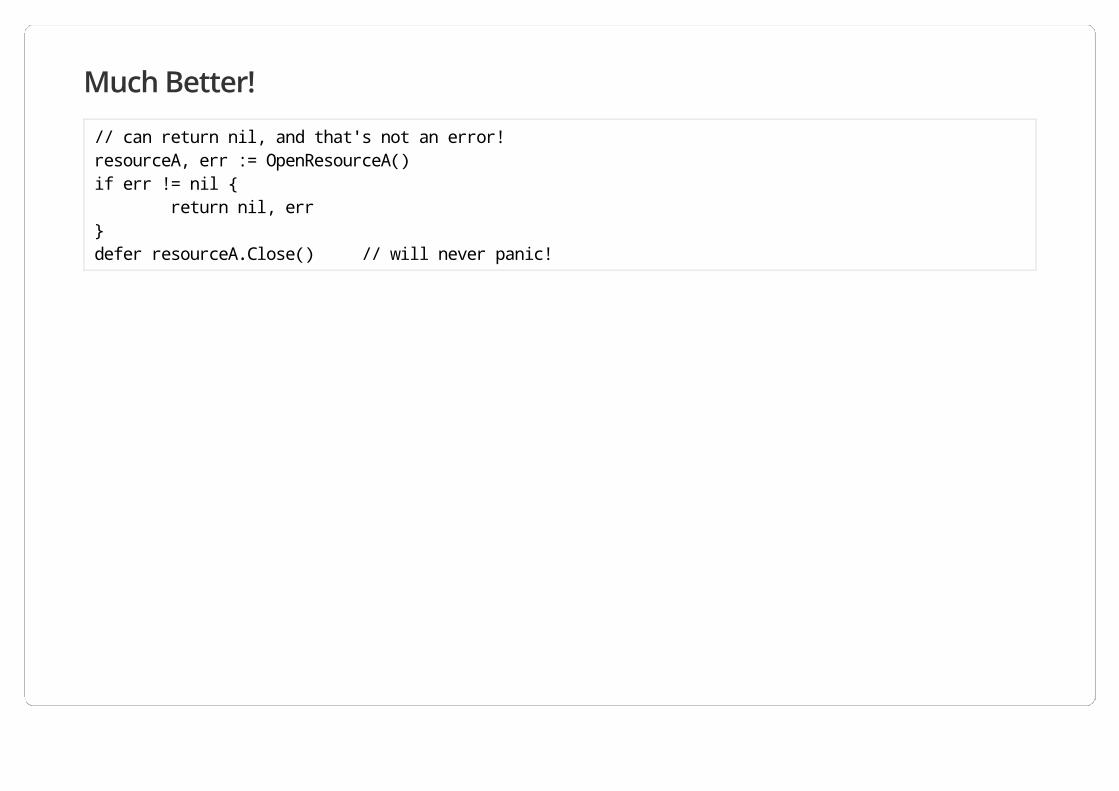
Much Better!
// can return nil, and that's not an error!resourceA, err := OpenResourceA()if err != nil { return nil, err}defer resourceA.Close() // will never panic!
1. Careful Coding: #Channels
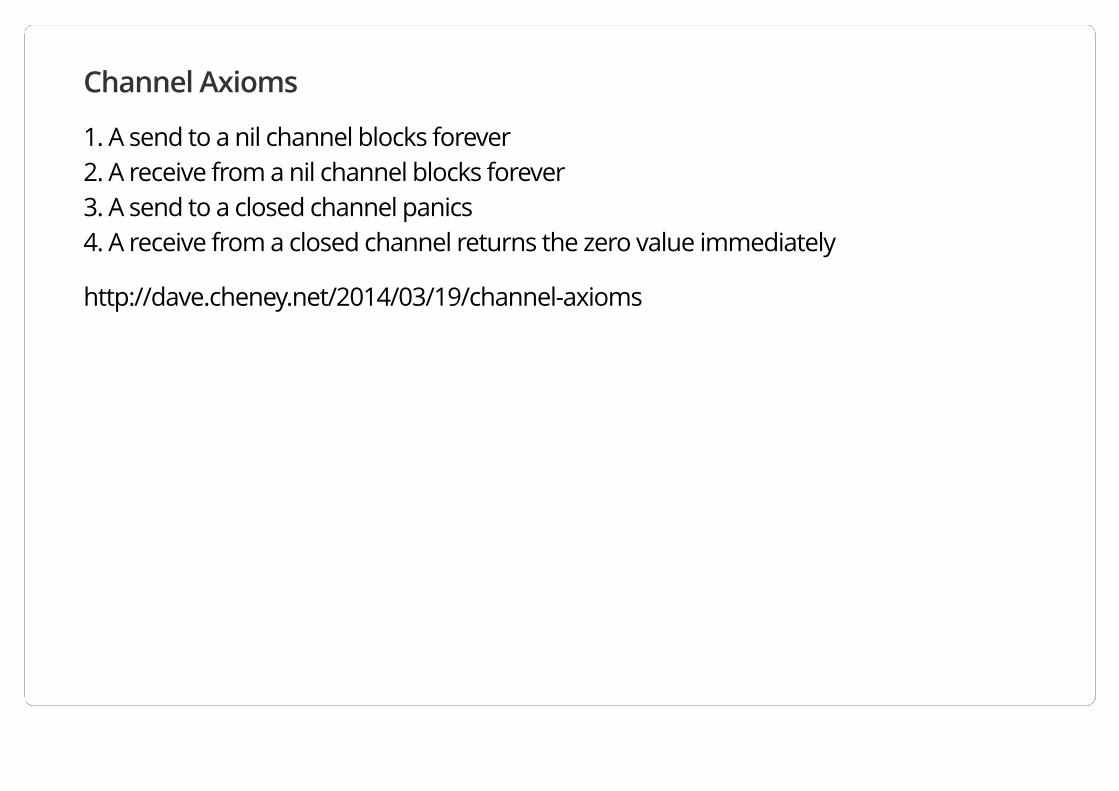
Channel Axioms
1. A send to a nil channel blocks forever 2. A receive from a nil channel blocks forever 3. A send to a closed channel panics 4. A receive from a closed channel returns the zero value immediately
http://dave.cheney.net/2014/03/19/channel-axioms
1.Careful Coding: #Panics
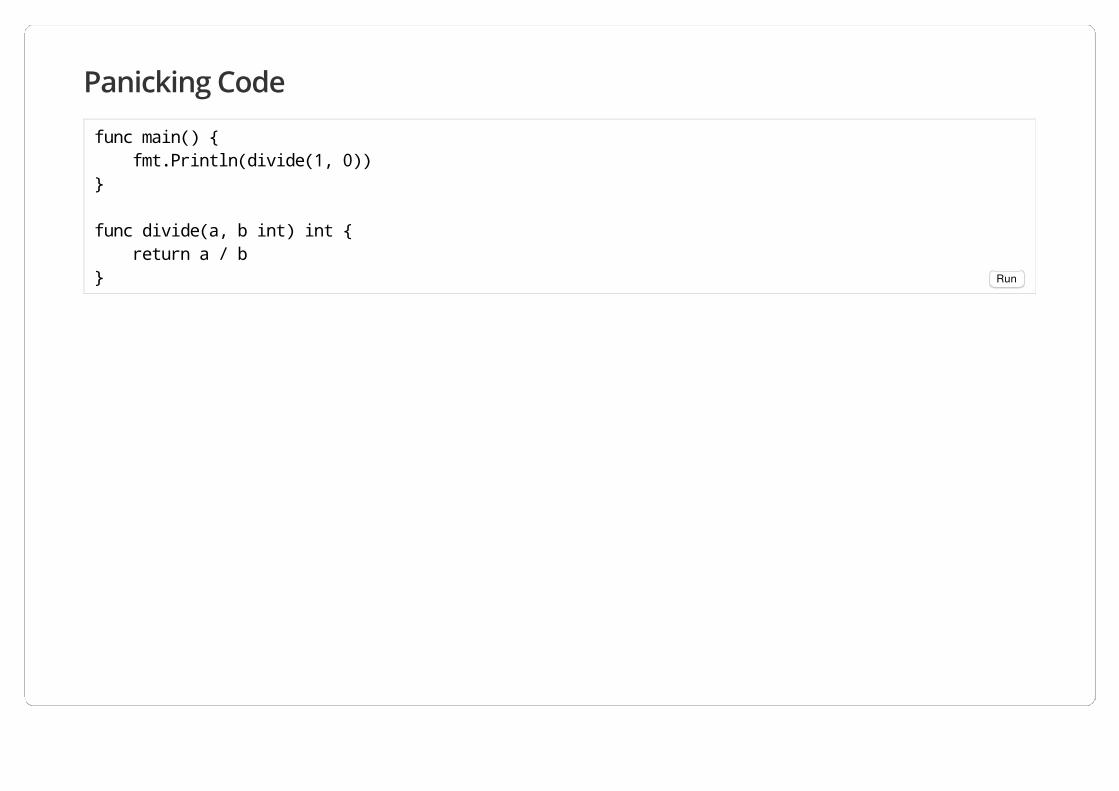
Panicking Code
func main() { fmt.Println(divide(1, 0))}
func divide(a, b int) int { return a / b} Run
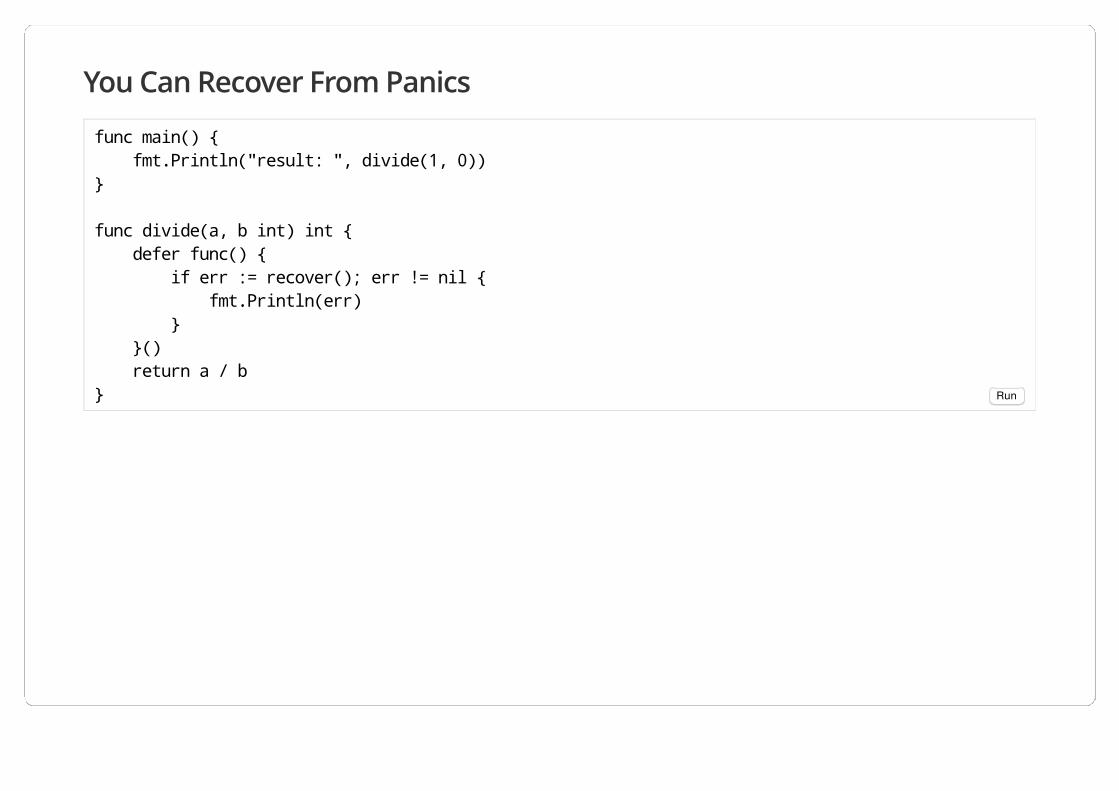
You Can Recover From Panics
func main() { fmt.Println("result: ", divide(1, 0))}
func divide(a, b int) int { defer func() { if err := recover(); err != nil { fmt.Println(err) } }() return a / b} Run
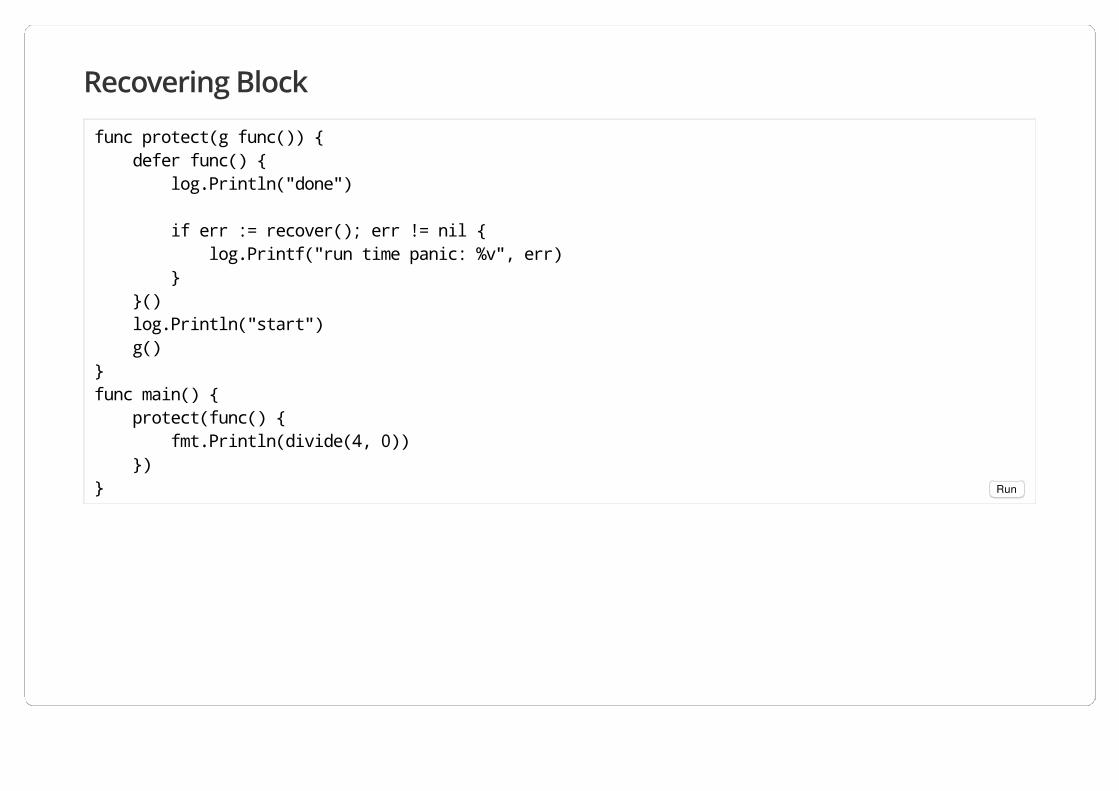
Recovering Block
func protect(g func()) { defer func() { log.Println("done")
if err := recover(); err != nil { log.Printf("run time panic: %v", err) } }() log.Println("start") g()}func main() { protect(func() { fmt.Println(divide(4, 0)) })} Run

1. Careful Coding: #Avoid Race Conditions!
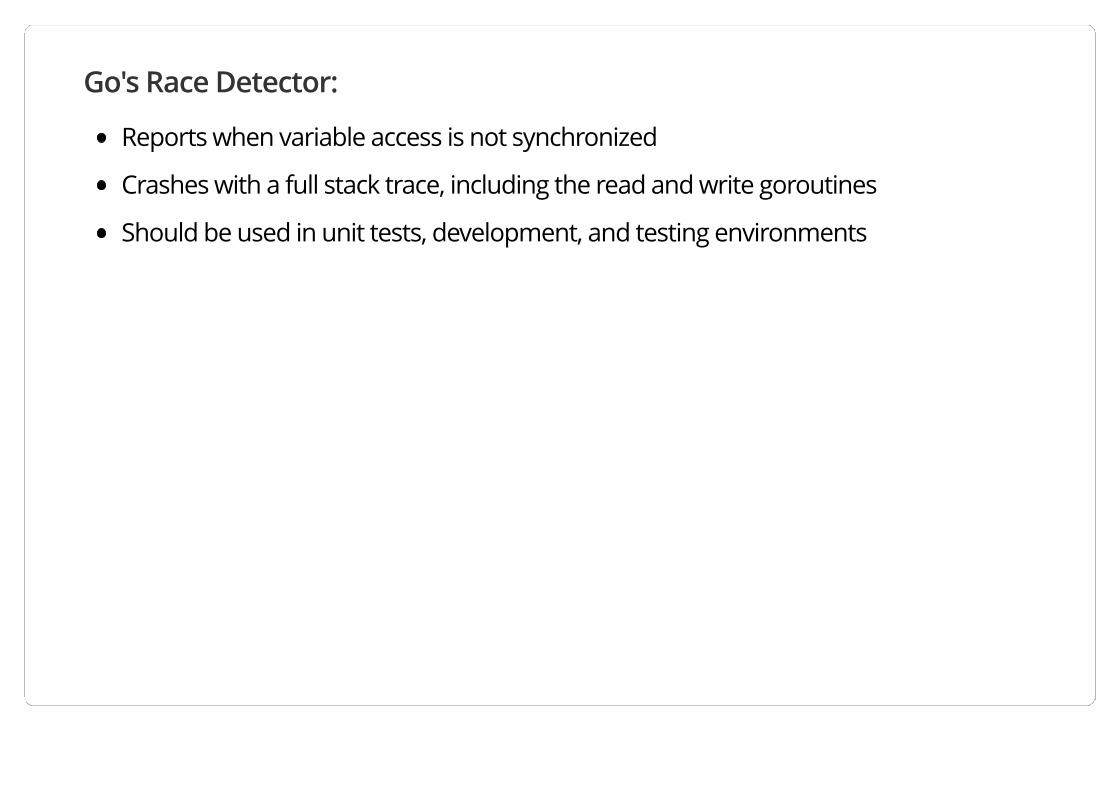
Go's Race Detector:
Reports when variable access is not synchronized
Crashes with a full stack trace, including the read and write goroutines
Should be used in unit tests, development, and testing environments
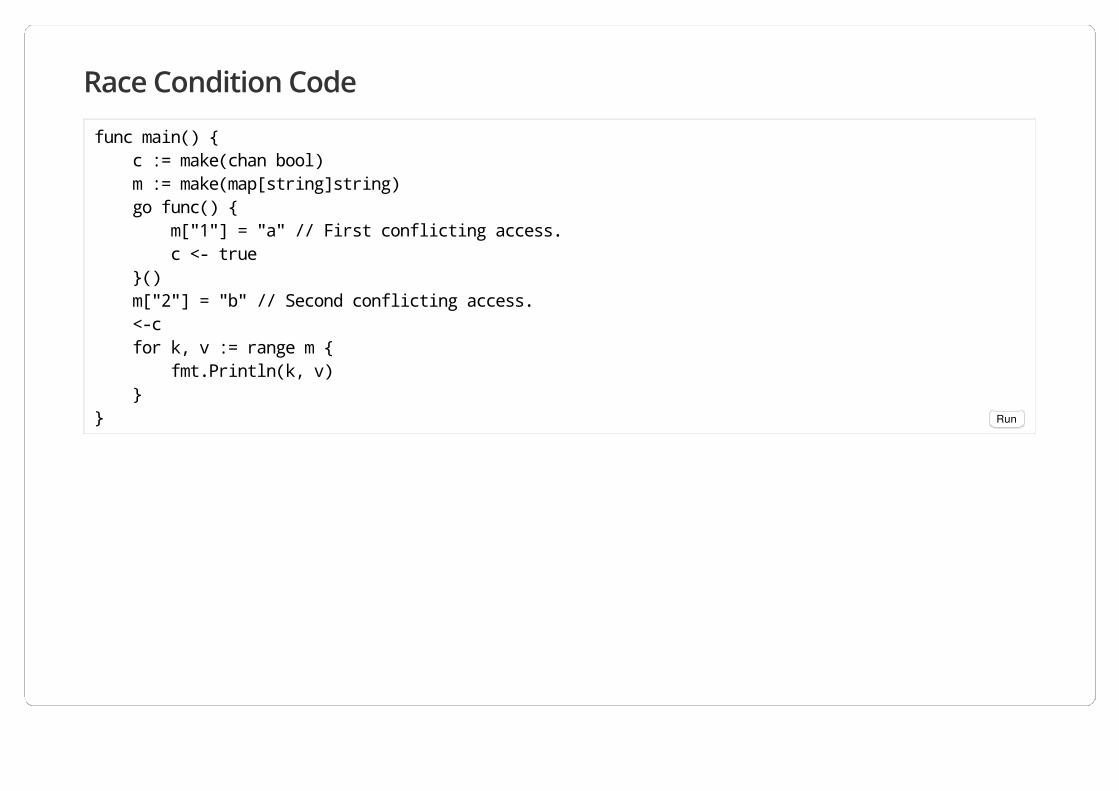
Race Condition Code
func main() { c := make(chan bool) m := make(map[string]string) go func() { m["1"] = "a" // First conflicting access. c <- true }() m["2"] = "b" // Second conflicting access. <-c for k, v := range m { fmt.Println(k, v) }} Run
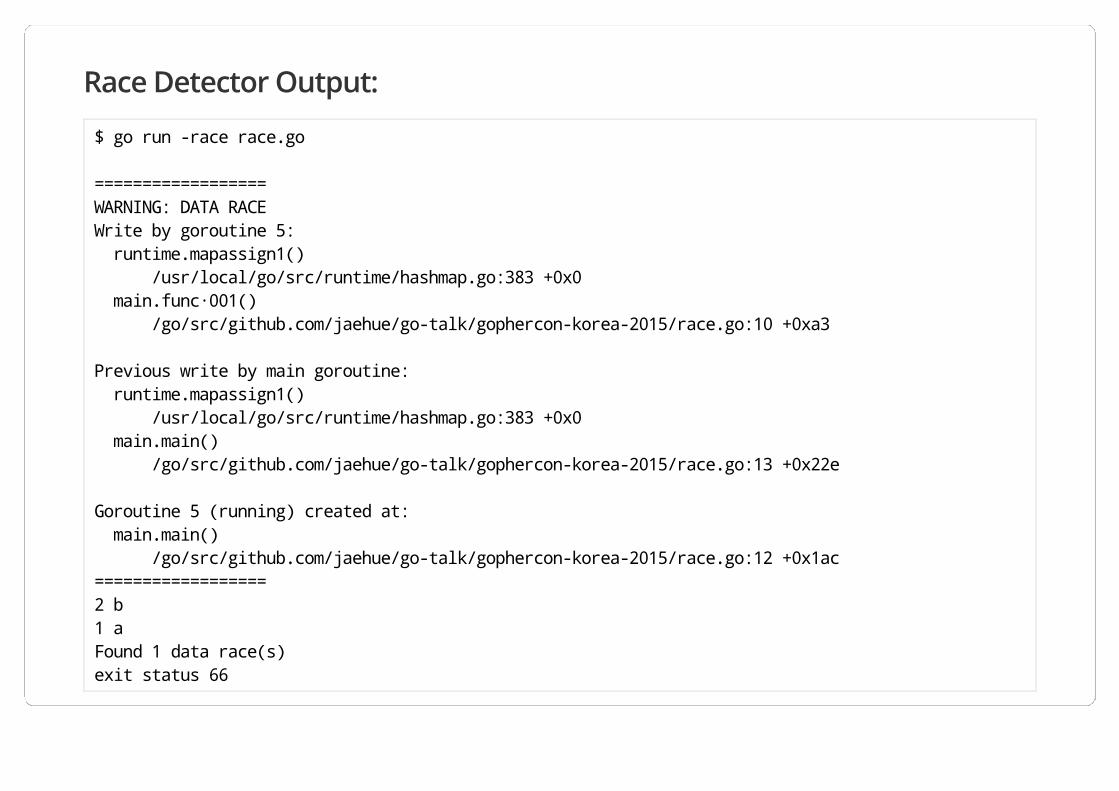
Race Detector Output:
$ go run -race race.go
==================WARNING: DATA RACEWrite by goroutine 5: runtime.mapassign1() /usr/local/go/src/runtime/hashmap.go:383 +0x0 main.func·001() /go/src/github.com/jaehue/go-talk/gophercon-korea-2015/race.go:10 +0xa3
Previous write by main goroutine: runtime.mapassign1() /usr/local/go/src/runtime/hashmap.go:383 +0x0 main.main() /go/src/github.com/jaehue/go-talk/gophercon-korea-2015/race.go:13 +0x22e
Goroutine 5 (running) created at: main.main() /go/src/github.com/jaehue/go-talk/gophercon-korea-2015/race.go:12 +0x1ac==================2 b1 aFound 1 data race(s)exit status 66
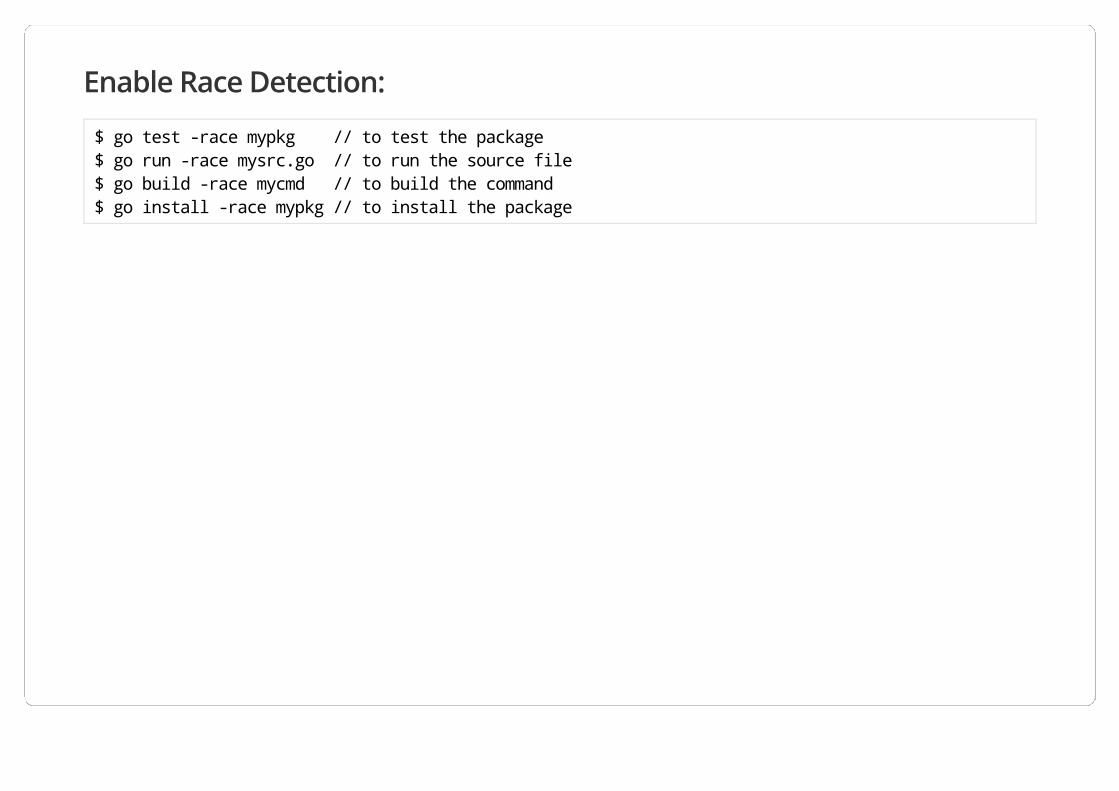
Enable Race Detection:
$ go test -race mypkg // to test the package$ go run -race mysrc.go // to run the source file$ go build -race mycmd // to build the command$ go install -race mypkg // to install the package
1. Careful Coding: #Implement Timeouts
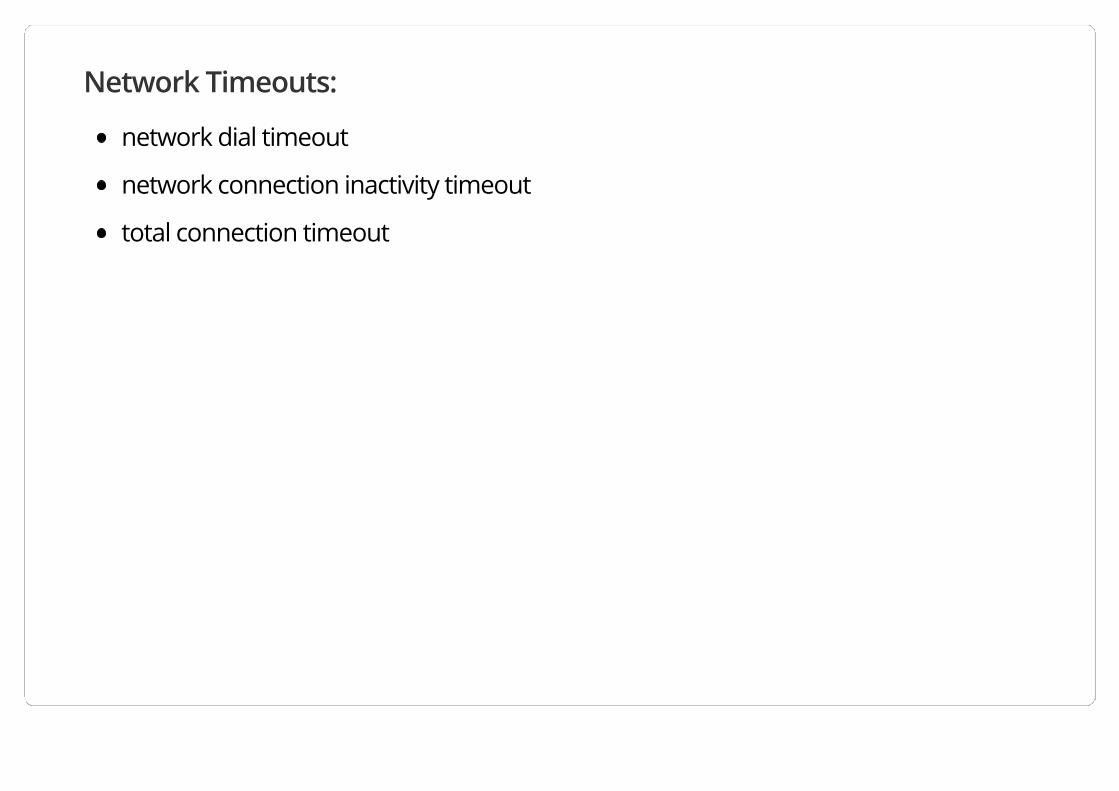
Network Timeouts:
network dial timeout
network connection inactivity timeout
total connection timeout
TEST ALL THE THINGS!
2. Know Your Service
2. Know Your Service: #How Does It Use Memory?
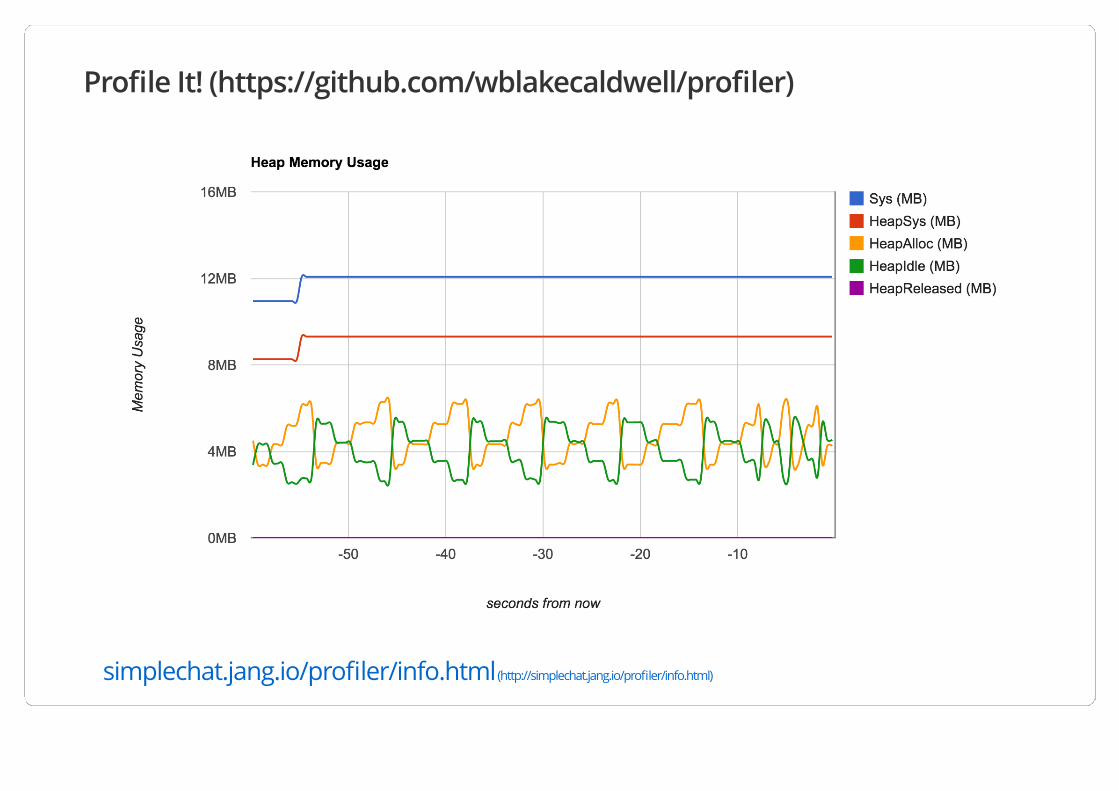
Profile It! (https://github.com/wblakecaldwell/profiler)
simplechat.jang.io/profiler/info.html (http://simplechat.jang.io/profiler/info.html)
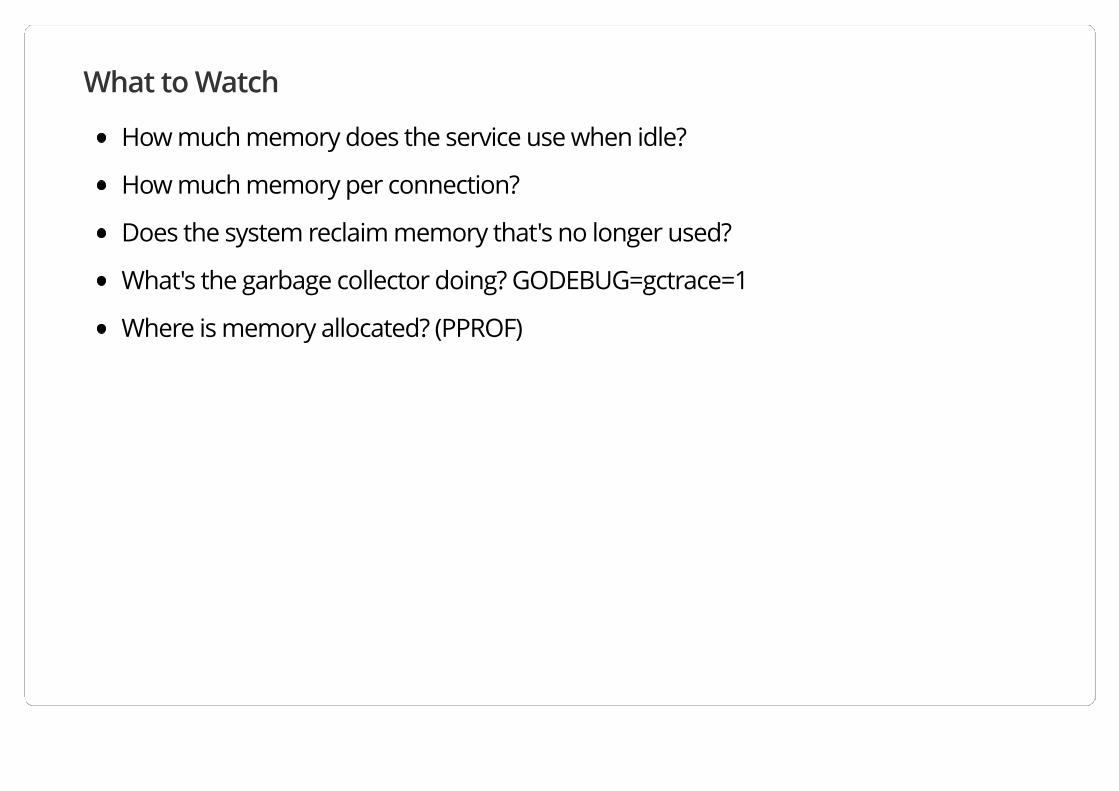
What to Watch
How much memory does the service use when idle?
How much memory per connection?
Does the system reclaim memory that's no longer used?
What's the garbage collector doing? GODEBUG=gctrace=1
Where is memory allocated? (PPROF)
2. Know Your Service: #PPROF
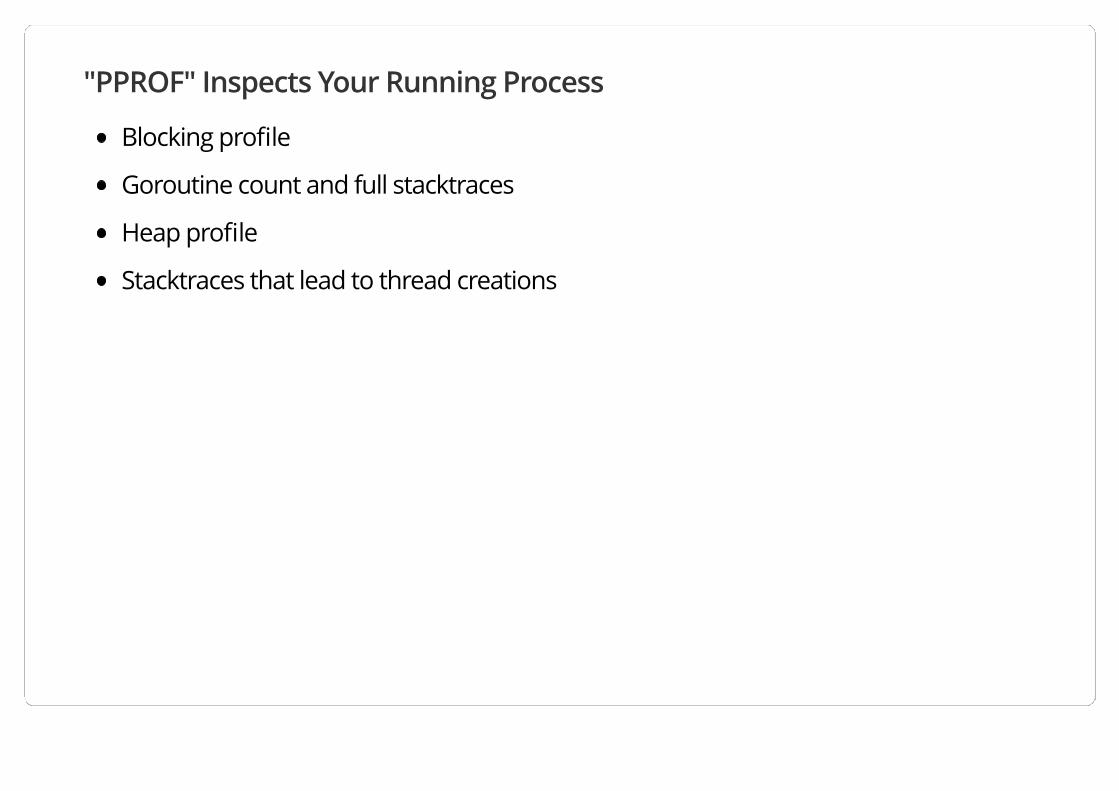
"PPROF" Inspects Your Running Process
Blocking profile
Goroutine count and full stacktraces
Heap profile
Stacktraces that lead to thread creations
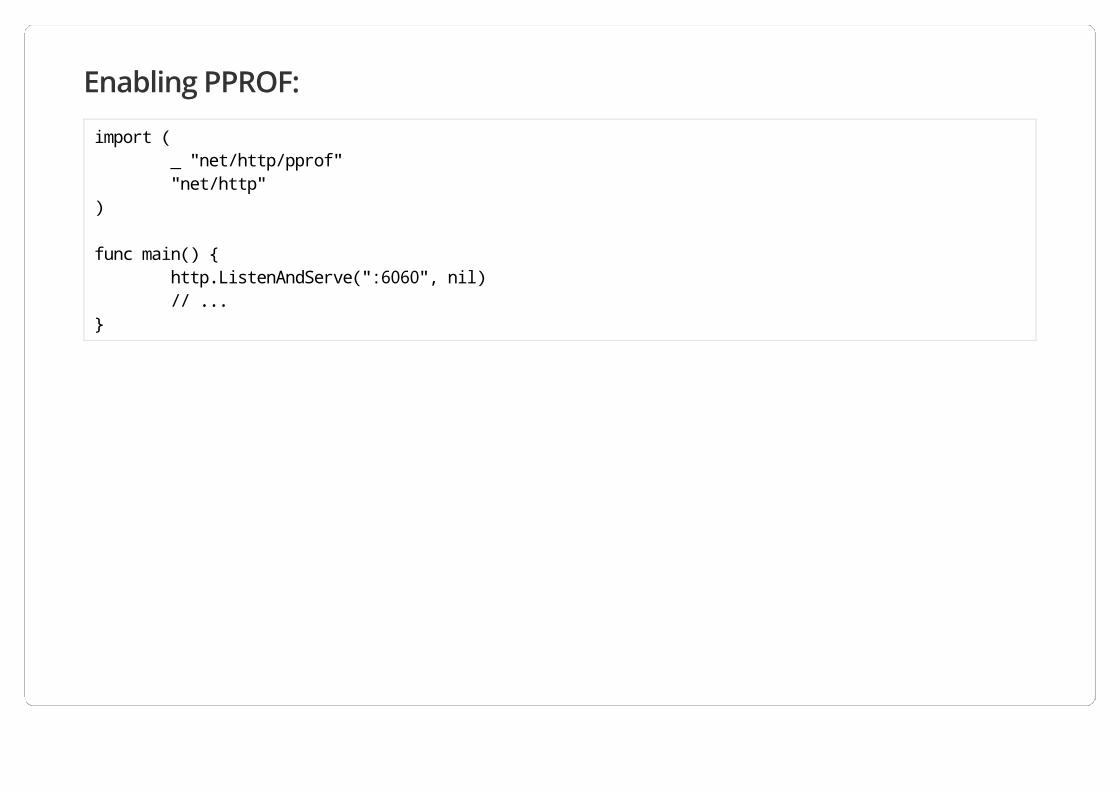
Enabling PPROF:
import ( _ "net/http/pprof" "net/http")
func main() { http.ListenAndServe(":6060", nil) // ...}
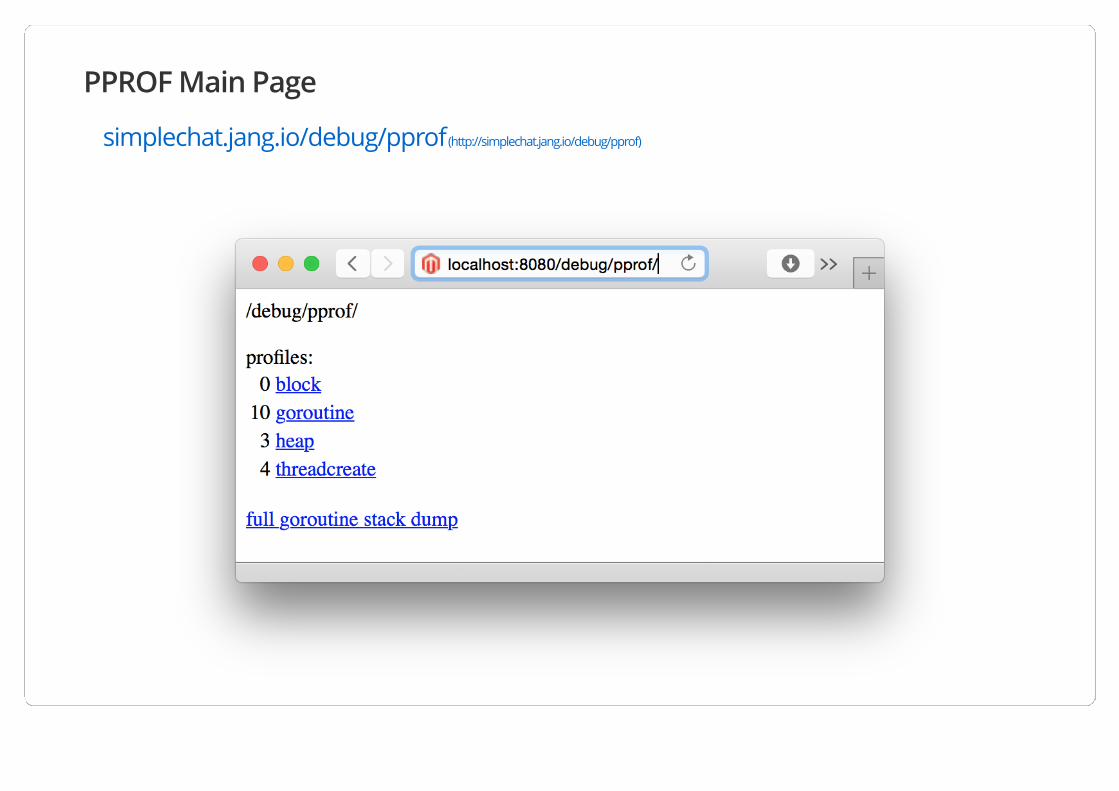
PPROF Main Page
simplechat.jang.io/debug/pprof (http://simplechat.jang.io/debug/pprof)
Use PPROF To Tell You:
How many goroutines when nobody is connected?
How many goroutines per connection?
Are all goroutines cleaned up after all connections close?
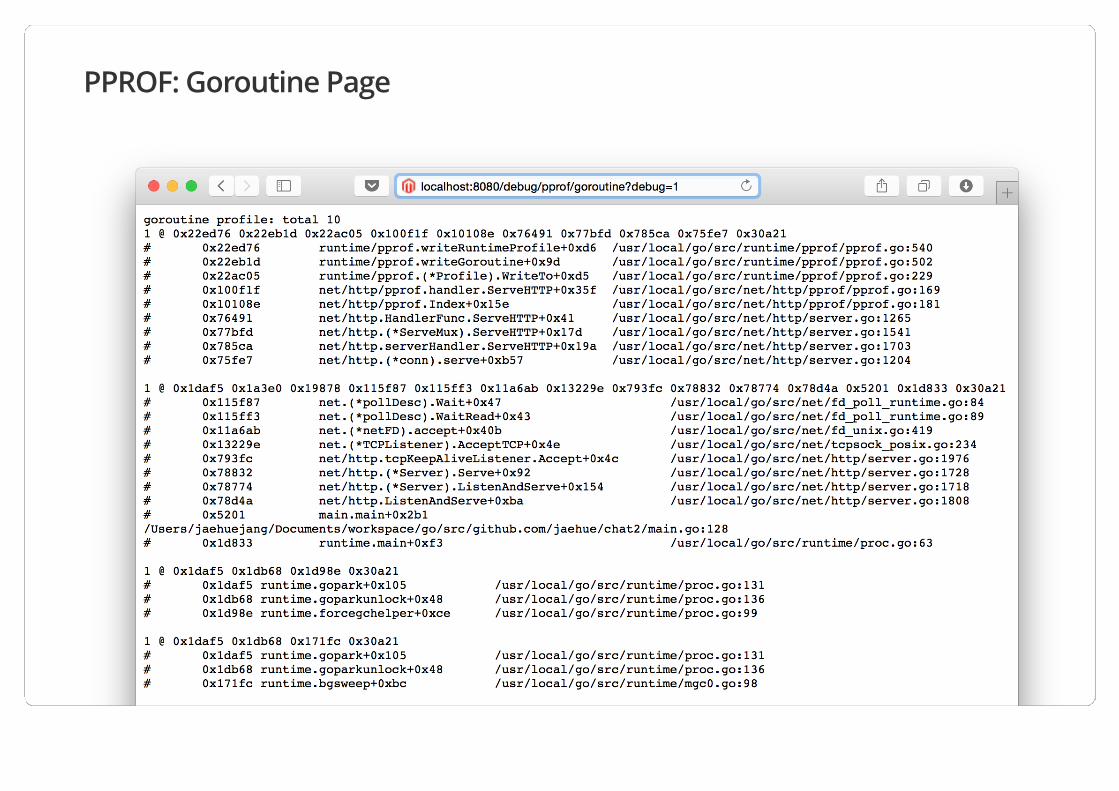
PPROF: Goroutine Page
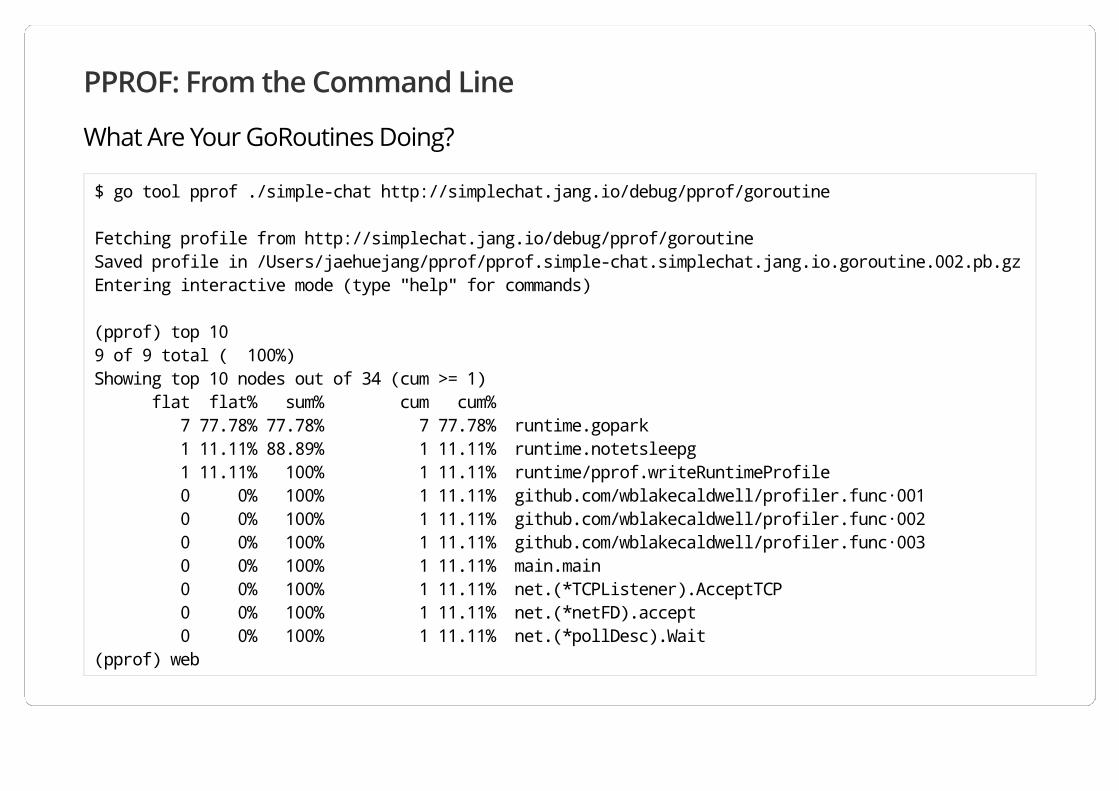
PPROF: From the Command Line
What Are Your GoRoutines Doing?
$ go tool pprof ./simple-chat http://simplechat.jang.io/debug/pprof/goroutine
Fetching profile from http://simplechat.jang.io/debug/pprof/goroutineSaved profile in /Users/jaehuejang/pprof/pprof.simple-chat.simplechat.jang.io.goroutine.002.pb.gzEntering interactive mode (type "help" for commands)
(pprof) top 109 of 9 total ( 100%)Showing top 10 nodes out of 34 (cum >= 1) flat flat% sum% cum cum% 7 77.78% 77.78% 7 77.78% runtime.gopark 1 11.11% 88.89% 1 11.11% runtime.notetsleepg 1 11.11% 100% 1 11.11% runtime/pprof.writeRuntimeProfile 0 0% 100% 1 11.11% github.com/wblakecaldwell/profiler.func·001 0 0% 100% 1 11.11% github.com/wblakecaldwell/profiler.func·002 0 0% 100% 1 11.11% github.com/wblakecaldwell/profiler.func·003 0 0% 100% 1 11.11% main.main 0 0% 100% 1 11.11% net.(*TCPListener).AcceptTCP 0 0% 100% 1 11.11% net.(*netFD).accept 0 0% 100% 1 11.11% net.(*pollDesc).Wait(pprof) web
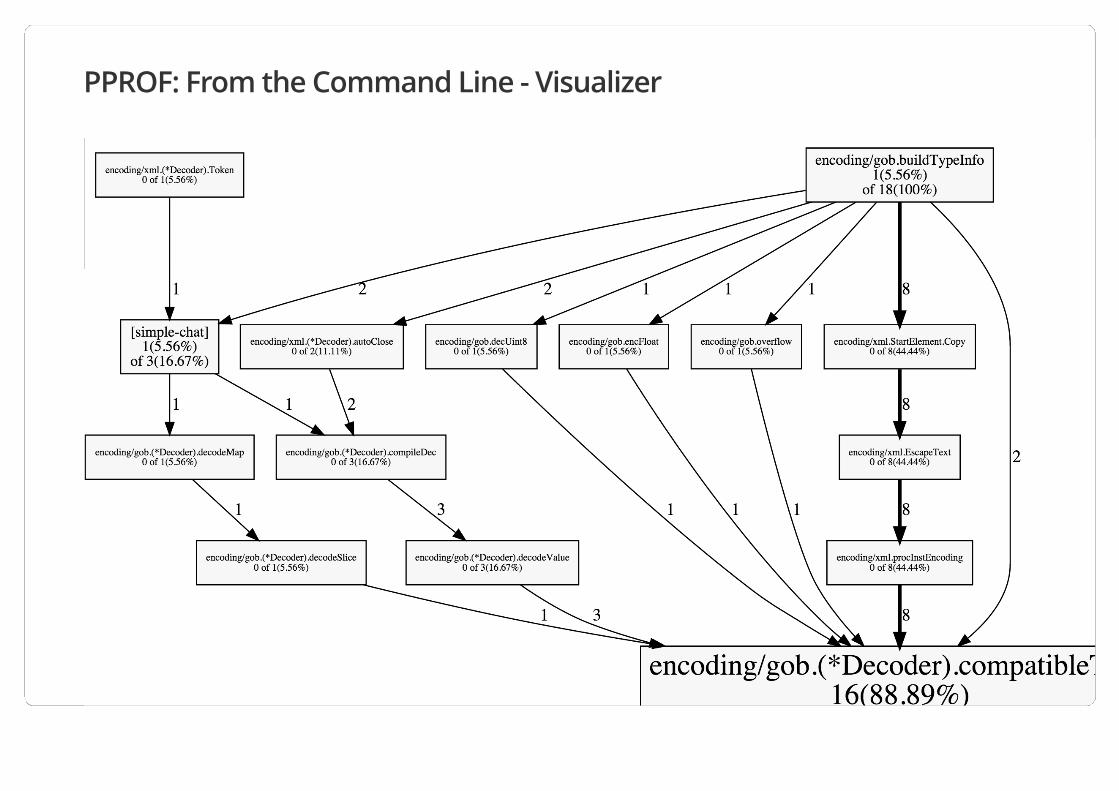
PPROF: From the Command Line - Visualizer
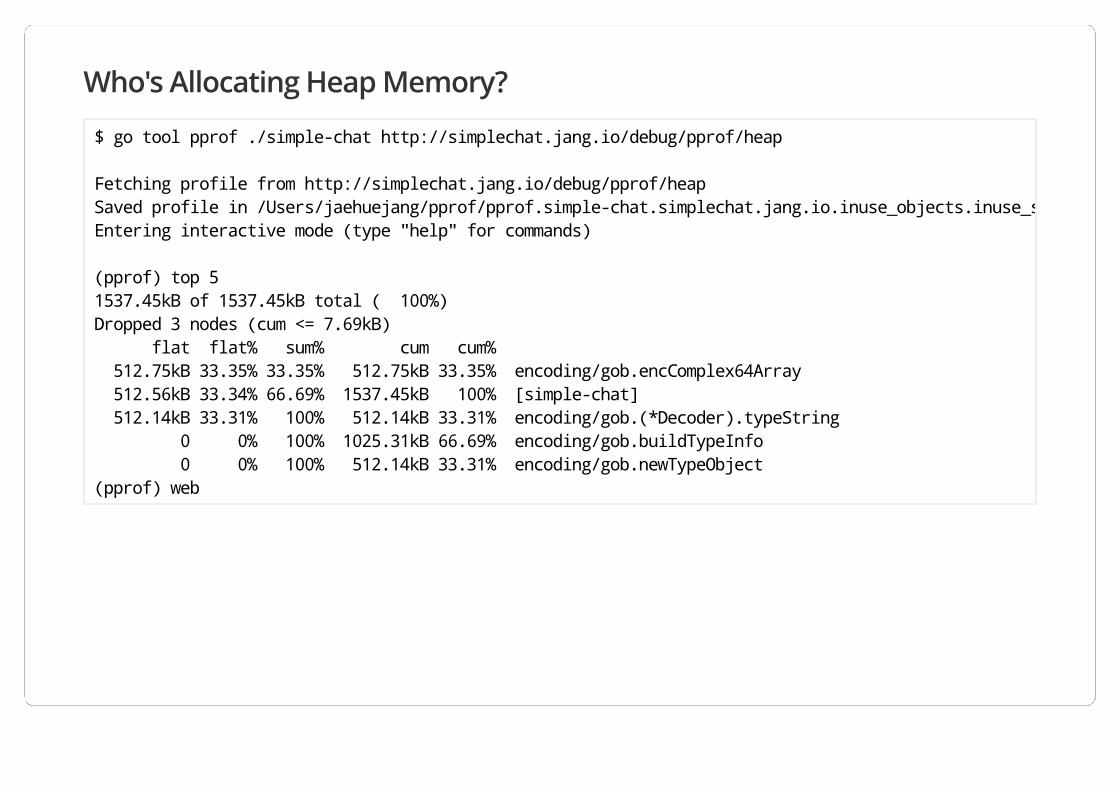
Who's Allocating Heap Memory?
$ go tool pprof ./simple-chat http://simplechat.jang.io/debug/pprof/heap
Fetching profile from http://simplechat.jang.io/debug/pprof/heapSaved profile in /Users/jaehuejang/pprof/pprof.simple-chat.simplechat.jang.io.inuse_objects.inuse_space.002.pb.gzEntering interactive mode (type "help" for commands)
(pprof) top 51537.45kB of 1537.45kB total ( 100%)Dropped 3 nodes (cum <= 7.69kB) flat flat% sum% cum cum% 512.75kB 33.35% 33.35% 512.75kB 33.35% encoding/gob.encComplex64Array 512.56kB 33.34% 66.69% 1537.45kB 100% [simple-chat] 512.14kB 33.31% 100% 512.14kB 33.31% encoding/gob.(*Decoder).typeString 0 0% 100% 1025.31kB 66.69% encoding/gob.buildTypeInfo 0 0% 100% 512.14kB 33.31% encoding/gob.newTypeObject(pprof) web
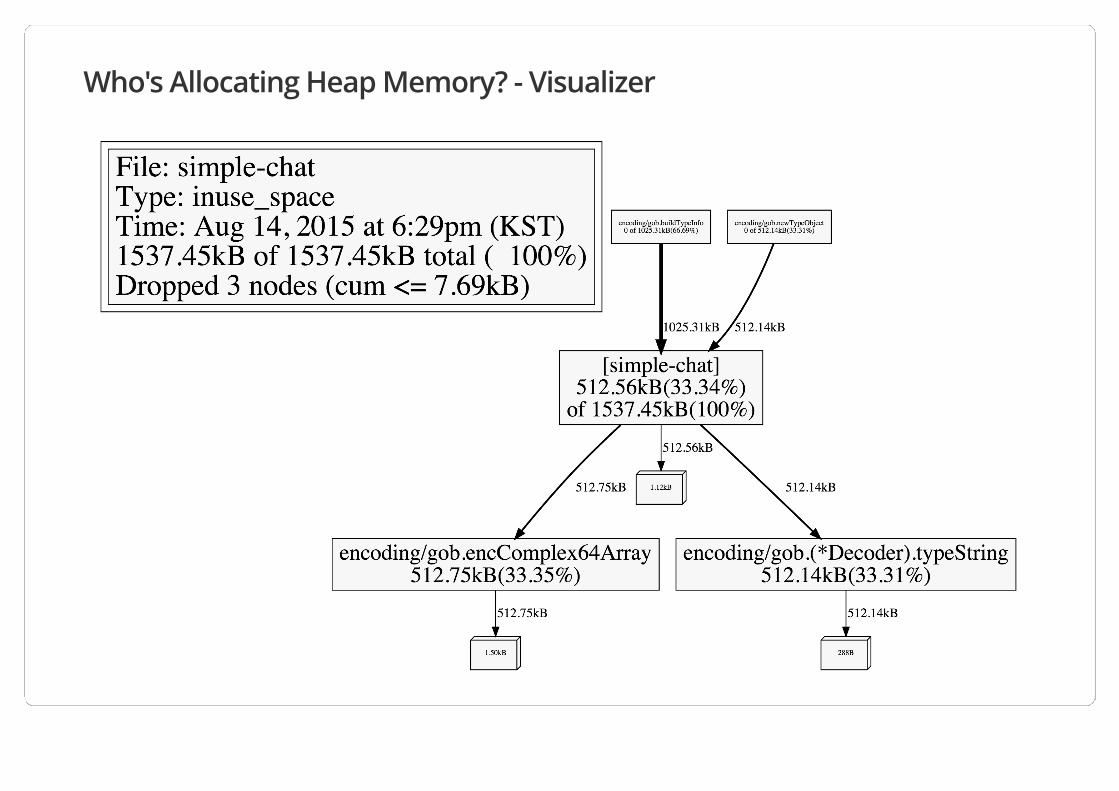
Who's Allocating Heap Memory? - Visualizer
2. Know Your Service: #Watch It Run
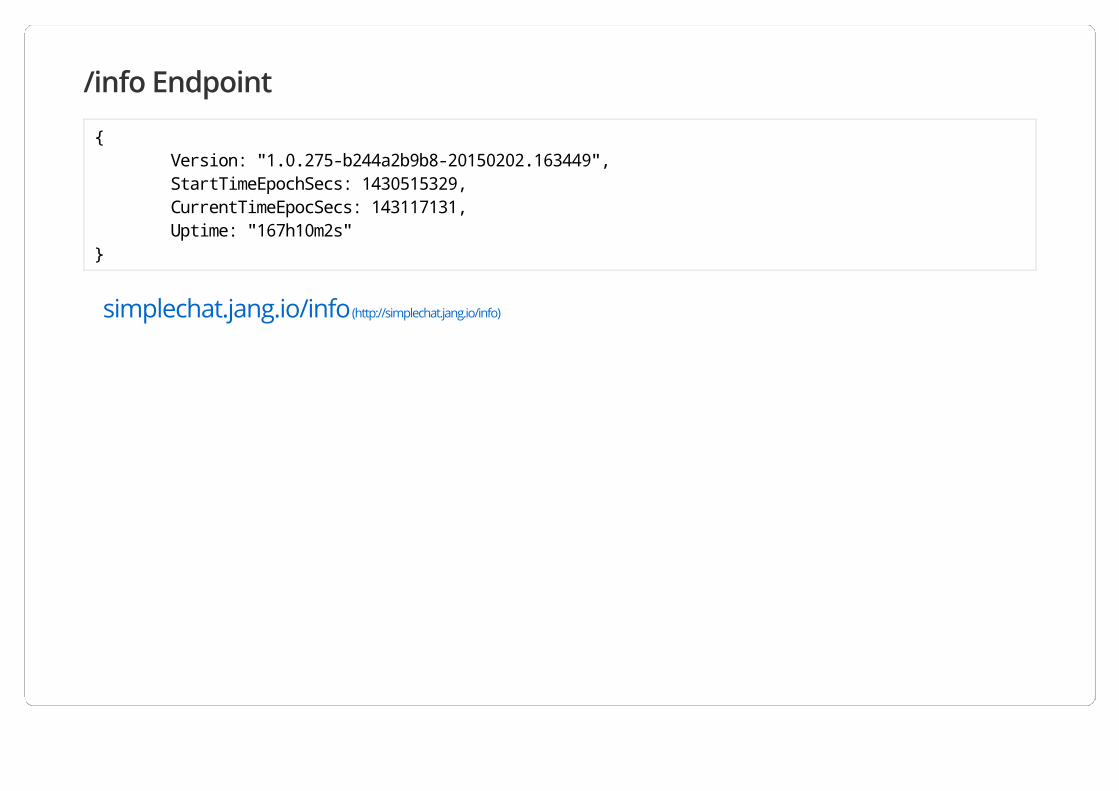
/info Endpoint
{ Version: "1.0.275-b244a2b9b8-20150202.163449", StartTimeEpochSecs: 1430515329, CurrentTimeEpocSecs: 143117131, Uptime: "167h10m2s"}
simplechat.jang.io/info (http://simplechat.jang.io/info)
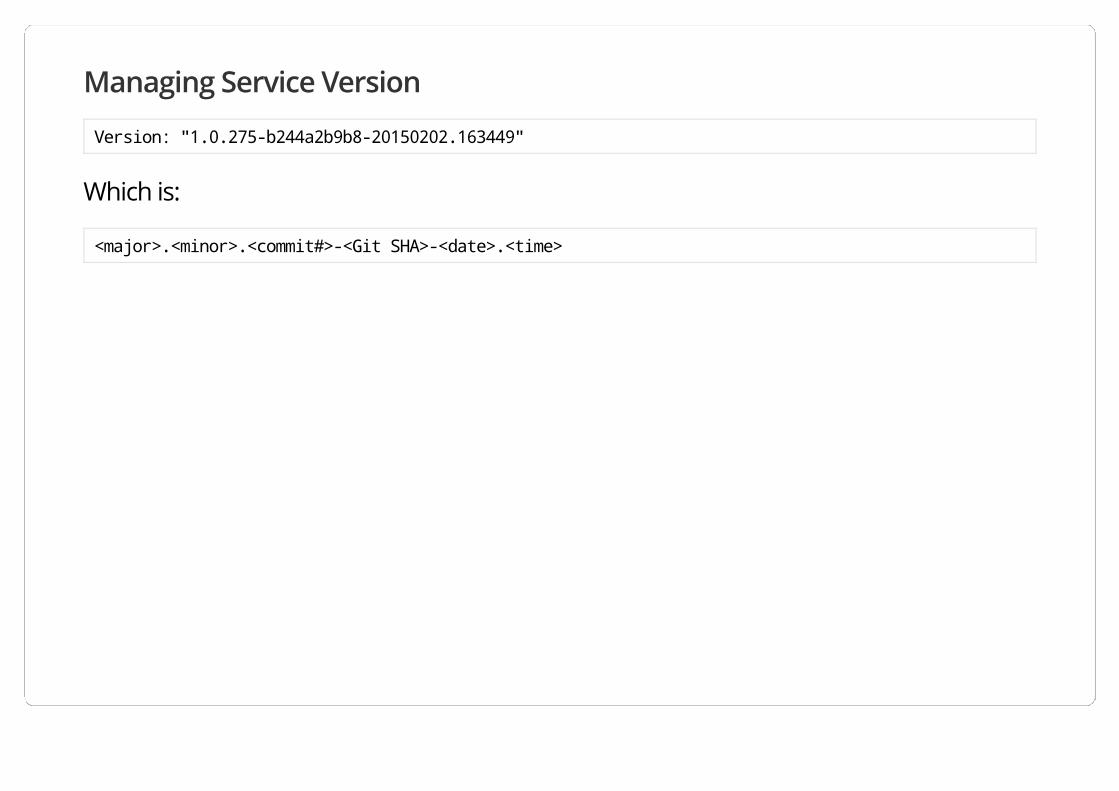
Managing Service Version
Version: "1.0.275-b244a2b9b8-20150202.163449"
Which is:
<major>.<minor>.<commit#>-<Git SHA>-<date>.<time>
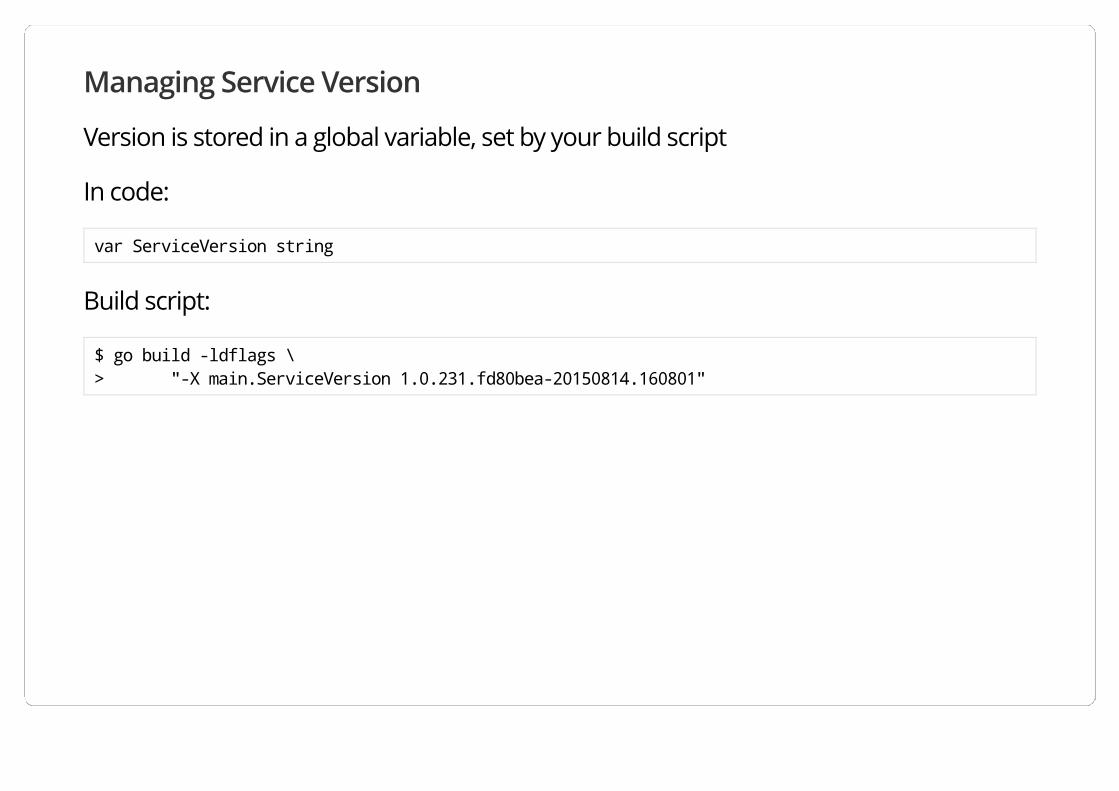
Managing Service Version
Version is stored in a global variable, set by your build script
In code:
var ServiceVersion string
Build script:
$ go build -ldflags \> "-X main.ServiceVersion 1.0.231.fd80bea-20150814.160801"

2. Know Your Service: #Keep Good Logs!
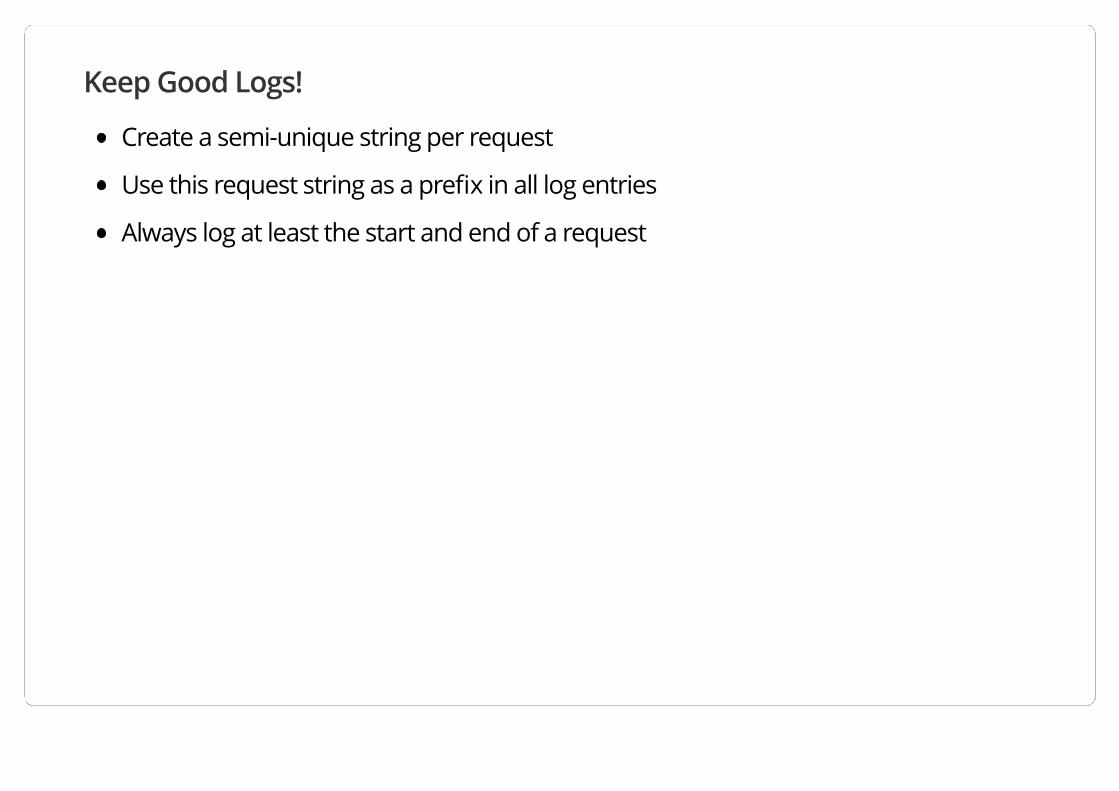
Keep Good Logs!
Create a semi-unique string per request
Use this request string as a prefix in all log entries
Always log at least the start and end of a request
2. Know Your Service: #Connection Status
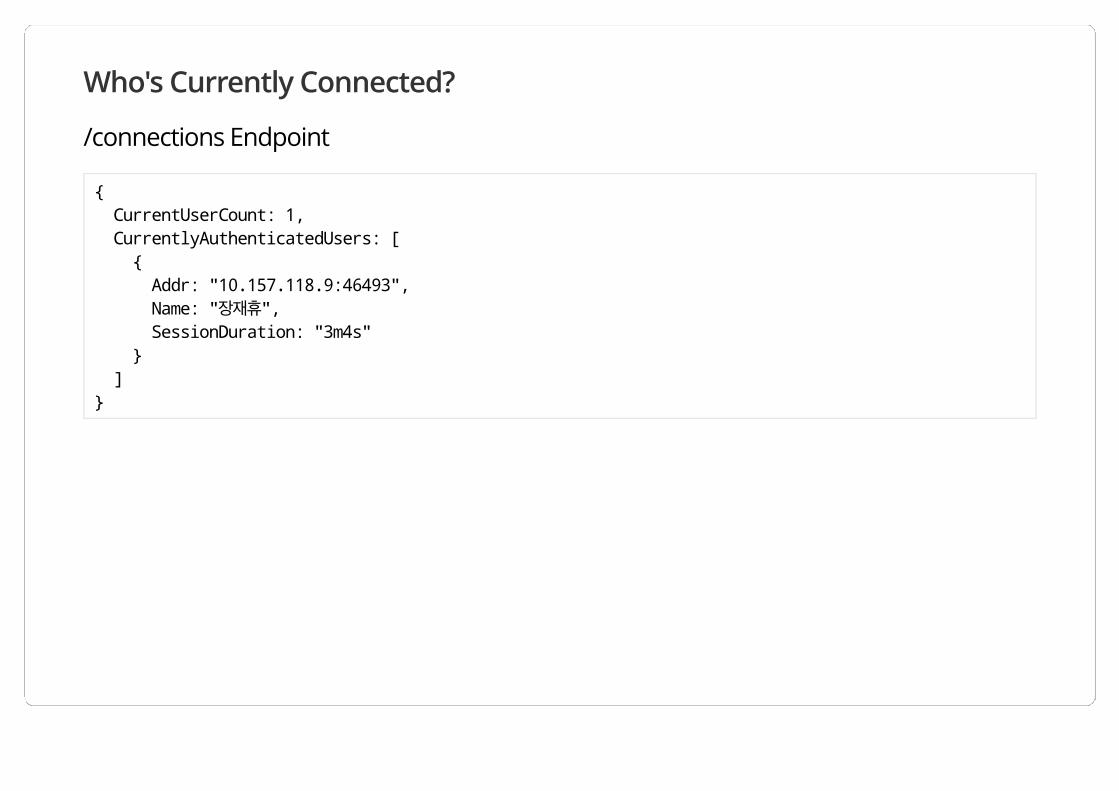
Who's Currently Connected?
/connections Endpoint
{ CurrentUserCount: 1, CurrentlyAuthenticatedUsers: [ { Addr: "10.157.118.9:46493", Name: "장재휴", SessionDuration: "3m4s" } ]}
Conclusion
Thank you
장재휴Developer, [email protected] (mailto:[email protected])
http://blog.remotty.com/ (http://blog.remotty.com/)