Embed Size (px)
Citation preview

HP – MET - 01
RECORD OF DAILY RAINFALL DATAAgency: {e.g., State Water Data Centre, I & CAD Department, A.P. >
Sub-Division : ….……………………….. Division : ….…………………..…..
Station Name : …………………………….. Station Code : …………………….……
Independent River : ……………………..………. Local River : ...……………………..…
District : ………………………..… Latitude : ….° ….′ ….″ Longitude : ….° ….′ ….″
Year : …………Month : …………..…
Date Rainfall Observed at0830 hrs. (mm)
Remarks
1
2
3
4
5
6
7
8
9
10
11
12
13
14
15
16
17
18
19
20
21
22
23
24
25
26
27
28
29
30
31
Total
No. of Rainy Days
Observer’s remarks : ………………...…………………………………………………….………………………………………………………………………………………………….….
Form filled by: Manuscript checked: Data entered & checked by: Primary validation done by:
Observer Supervisor/J.E. DPC Assistant Assistant Hydrologist

HP – MET - 02
RECORD OF TWICE-DAILY RAINFALL DATAAgency: {e.g., State Water Data Centre, I & CAD Department, A.P. >
Sub-Division : ….……………………….. Division : ….…………………..…..
Station Name : …………………………….. Station Code : …………………….……
Independent River : ……………………..………. Local River : ...……………………..…
District : ………………………..… Latitude : ….° ….′ ….″ Longitude : ….° ….′ ….″
Year : …………Month : …………..…
Rainfall (mm) Observed atDate
1730 hrs.(Previous Day)
0830 hrs.
Daily Rainfall(mm)
Remarks
1
2
3
4
5
6
7
8
9
10
11
12
13
14
15
16
17
18
19
20
21
22
23
24
25
26
27
28
29
30
31
Total
No. of Rainy Days
Observer’s remarks : ………………...…………………………………………………….………………………………………………………………………………………………….….Form filled by: Manuscript checked: Data entered & checked by: Primary validation done by:
Observer Supervisor/J.E. DPC Assistant Assistant Hydrologist

HP – MET - 03RECORD OF HOURLY RAINFALL DATA Agency: {e.g., State Water Data Centre, I & CAD Department, A.P. >
Sub-Division : ….……………………….. Division : ….…………………..…..
Station Name : …………………………….. Station Code : …………………….…… Independent River : ……………………..………. Local River : ...……………………..… District : ………………………………
Latitude : ….° ….
′ ….
″ Longitude : ….
° ….′ ….″
Year : …………… Month : ………………..…
Rainfall Amounts (mm) for Clock Hours (Indian Standard Time) Ending AtDate
0100 0200 0300 0400 0500 0600 0700 0800 0900 1000 1100 1200 1300 1400 1500 1600 1700 1800 1900 2000 2100 2200 2300 2400
Total
1
2
3
4
5
6
7
8
9
10
11
12
13
14
15
16
17
18
19
20
21
22
23
24
25
26
27
28
29
30
31
Total
Observer’s remarks : ………………...……………………………………………………………………………………………………………………………………………………………………………………….…
Form filled by: Manuscript checked: Data entered & checked by: Primary validation done by:
Observer Supervisor/J.E. DPC Assistant Assistant Hydrologist

HP – MET -04
RECORD OF DAILY CLIMATIC DATA<Agency: {e.g., State Water Data Centre, I & CAD Department, A.P. >
Sub-Division : ….……………………….. Division : ….…………………..…..
Station Name : …………………………….. Station Code : …………………….……
Independent River : ……………………..………. Local River : ...……………………..…
District : ………………………..… Latitude : ….° ….′ ….″ Longitude : ….° ….′ ….″
Year : …………… Month : ……………..…
(ALL OBSERVATIONS ARE AT 0830 HRS. IST)
Date Min.Temp.
Max.Temp.
DryBulb
Temp.
WetBulb
Temp.
Rel.Humi.
Inst.Wind
Speed
Av.Wind
Speed
Wind
Direction
PanWaterTemp
PanEvapo-ration
Rain-fall
Remarks
( °C ) ( °C ) ( °C ) ( °C ) (%) (Km/h) (Km/h) (16pts.) ( °C) (mm) (mm)
1
2
3
4
5
6
7
8
9
10
11
12
13
14
15
16
17
18
19
20
21
22
23
24
25
26
27
28
29
30
31
Total
Av.
Observer’s remarks : ………………...…………………………………………………….……….……………………………………………………………………………………………….………..Form filled by: Manuscript checked: Data entered & checked by: Primary validation done by:
Observer Supervisor/J.E. DPC Assistant Assistant Hydrologist
HP – MET - 05RECORD OF TWICE-DAILY CLIMATIC DATA Agency: {e.g., State Water Data Centre, I & CAD Department, A.P. >
Sub-Division : ….……………………….. Division : ….…………………..…..
Station Name : …………………………….. Station Code : …………………….…… Independent River : ……………………..………. Local River : ...……………………..… District : ………………………………
Latitude : ….° ….
′ ….
″ Longitude : ….
° ….′ ….″
Year : …………… Month : ………………..…(OBSERVATIONS ARE AT 0830 & 1730 HRS. IST)
Pan Evapo. (mm) Rainfall (mm)Min. Temp.
( °C )
Max. Temp.
( °C )
Dry Bulb Temp.
( °C )
Wet Bulb Temp.
( °C )
Rel. Humidity
(%)
Inst. Wind Speed
(Km/h)
Av. Wind Speed
(Km/h)
Wind Direct.
(16pts.)
Pan WaterTemp.
( °C)
Date
0830 1730 0830 1730 0830 1730 0830 1730 0830 1730 0830 1730 0830 1730 0830 1730 0830 1730 0830
1730
(Prev. Day) 0830
1730
(Prev. Day)
Remarks
1
2
3
4
5
6
7
8
9
10
11
12
13
14
15
16
17
18
19
20
21
22
23
24
25
26
27
28
29
30
31
Total
Av.
Observer’s remarks : ………………...……………………………………………………………………………………………………………………………………………………………………………………….…
Form filled by: Manuscript checked: Data entered & checked by: Primary validation done by:
Observer Supervisor/J.E. DPC Assistant Assistant Hydrologist

HP – MET - 06
RECORD OF HOURLY SUNSHINE DURATION DATA<Agency: {e.g., State Water Data Centre, I & CAD Department, A.P. >
Sub-Division : ….……………………….. Division : ….…………………..…..
Station Name : …………………………….. Station Code : …………………….……
Independent River : ……………………..………. Local River : ...……………………..…
District : ………………………..… Latitude : ….° ….′ ….″ Longitude : ….° ….′ ….″
Year : …………… Month : ……………..…
Bright Sunshine Duration (in hrs.) Tabulated for Clock Hrs. (IST) Ending AtDate
0600 0700 0800 0900 1000 1100 1200 1300 1400 1500 1600 1700 1800 1900
DailyTotal
Remarks
1
2
3
4
5
6
7
8
9
10
11
12
13
14
15
16
17
18
19
20
21
22
23
24
25
26
27
28
29
30
31
Total
Observer’s remarks : ………………...…………………………………………………….……….……………………………………………………………………………………………….………..Form filled by: Manuscript checked: Data entered & checked by: Primary validation done by:
Observer Supervisor/J.E. DPC Assistant Assistant Hydrologist

HP – MET - 07RECORD OF HOURLY TEMPERATURE DATA Agency: {e.g., State Water Data Centre, I & CAD Department, A.P. >
Sub-Division : ….……………………….. Division : ….…………………..…..
Station Name : …………………………….. Station Code : …………………….…… Independent River : ……………………..………. Local River : ...……………………..… District : ………………………………
Latitude : ….° ….
′ ….
″ Longitude : ….
° ….′ ….″
Year : …………… Month : ………………..…
Temperature ( ° C) at Clock Hours (Indian Standard Time)Date
0100 0200 0300 0400 0500 0600 0700 0800 0900 1000 1100 1200 1300 1400 1500 1600 1700 1800 1900 2000 2100 2200 2300 2400
Average
1
2
3
4
5
6
7
8
9
10
11
12
13
14
15
16
17
18
19
20
21
22
23
24
25
26
27
28
29
30
31
Observer’s remarks : ………………...……………………………………………………………………………………………………………………………………………………………………………………….…
Form filled by: Manuscript checked: Data entered & checked by: Primary validation done by:
Observer Supervisor/J.E. DPC Assistant Assistant Hydrologist

HP – MET - 08RECORD OF HOURLY RELATIVE HUMIDITY DATA Agency: {e.g., State Water Data Centre, I & CAD Department, A.P. >
Sub-Division : ….……………………….. Division : ….…………………..…..
Station Name : …………………………….. Station Code : …………………….…… Independent River : ……………………..………. Local River : ...……………………..… District : ………………………………
Latitude : ….° ….
′ ….
″ Longitude : ….
° ….′ ….″
Year : …………… Month : ………………..…
Relative Humidity (%) at Clock Hours (Indian Standard Time)Date
0100 0200 0300 0400 0500 0600 0700 0800 0900 1000 1100 1200 1300 1400 1500 1600 1700 1800 1900 2000 2100 2200 2300 2400
Average
1
2
3
4
5
6
7
8
9
10
11
12
13
14
15
16
17
18
19
20
21
22
23
24
25
26
27
28
29
30
31
Observer’s remarks : ………………...……………………………………………………………………………………………………………………………………………………………………………………….…
Form filled by: Manuscript checked: Data entered & checked by: Primary validation done by:
Observer Supervisor/J.E. DPC Assistant Assistant Hydrologist

HP – SW - 01
RECORD OF MULTIPLE TIMES A DAY STAGE DATA<Agency: {e.g., State Water Data Centre, I & CAD Department, A.P.} >Sub-Division : ….……………………….. Division : ….…………………..…..
Station Name : …………………………….. Station Code : …………………….……
Independent River : ……………………..………. Local River : ...……………………..…
District : ………………………..… Latitude : ….° ….′ ….″ Longitude : ….° ….′ ….″
R.L. of Gauge Zero : …………… (m+m.s.l) Year : …………Month : …………..…
Stage (m) Observed atDate
<0800 hrs.> <1300 hrs.> <1800 hrs.>
Remarks
1
2
3
4
5
6
7
8
9
10
11
12
13
14
15
16
17
18
19
20
21
22
23
24
25
26
27
28
29
30
31
Total
Av.
Observer’s remarks : ………………...…………………………………………………….………………………………………………………………………………………………….….Form filled by: Manuscript checked: Data entered & checked by: Primary validation done by:
Observer Supervisor/J.E. DPC Assistant Assistant Hydrologist

HP – SW - 02
RECORD OF STAGE AND TEMPERATURE DATA<Agency: {e.g., State Water Data Centre, I & CAD Department, A.P. >
Sub-Division : ….……………………….. Division : ….…………………..…..
Station Name : …………………………….. Station Code : …………………….……
Independent River : ……………………..………. Local River : ...……………………..…
District : ………………………..… Latitude : ….° ….′ ….″ Longitude : ….° ….′ ….″
R.L. of Gauge Zero : …………… (m+m.s.l.) Year : …………Month : …………..…
Stage (m) Observed at Temperatures ( °C )
River Water Min. Atm. Max. Atm.
Date
<0800 hrs.> <1300 hrs.> <1800 hrs.> <0800 hrs.> 0830 hrs. 0830 hrs.
Remarks
1
2
3
4
5
6
7
8
9
10
11
12
13
14
15
16
17
18
19
20
21
22
23
24
25
26
27
28
29
30
31
Total
Av.
Observer’s remarks : ………………...…………………………………………………….………………………………………………………………………………………………….….Form filled by: Manuscript checked: Data entered & checked by: Primary validation done by:
Observer Supervisor/J.E. DPC Assistant Assistant Hydrologist

HP – SW - 03
RECORD OF HOURLY STAGE DATA <Agency: {e.g., State Water Data Centre, I & CAD Department, A.P. >
Sub-Division : ….……………………….. Division : ….…………………..…..
Station Name : …………………………….. Station Code : …………………….…… Independent River : ……………………..………. Local River : ...……………………..… District : ………………………………
Latitude : ….° ….
′ ….
″ Longitude : ….
° ….′ ….″
R.L. of Gauge Zero : …………… (m+m.s.l.) Year : …………… Month : ………………..…
Stage (m) at Clock Hours (Indian Standard Time)Date
0100 0200 0300 0400 0500 0600 0700 0800 0900 1000 1100 1200 1300 1400 1500 1600 1700 1800 1900 2000 2100 2200 2300 2400
Average
1
2
3
4
5
6
7
8
9
10
11
12
13
14
15
16
17
18
19
20
21
22
23
24
25
26
27
28
29
30
31
Observer’s remarks : ………………...……………………………………………………………………………………………………………………………………………………………………………………….…
Form filled by: Manuscript checked: Data entered & checked by: Primary validation done by:
Observer Supervisor/J.E. DPC Assistant Assistant Hydrologist

HP – SW - 04
RECORD OF VELOCITY MEASUREMENTS FOR STAGE-DISCHARGE OBSERVATION <Agency : {e.g., State W ater Data Centre, I & CAD Department, A.P. >
Sub-Division : … .… … … … … … … … … .. Division : … .… … … … … … … ..… ..Station Name : .… … … … … … … … … … … … … Station Code : … … … … … … … … … … … District : … … … … … … … … … … … … … .
Independent River : … … .… … … … … … … … ..… … .. Local River : ...… … … … … … … … ..….. Latitude : … .° … .
′ … .
″ Longitude : … .
° … .′ … .″
R.L. of Gauge Zero : … … … … .. (m+m.s.l.) Date of Observation : … … … … … Tim e at Start : … … … … … Tim e at End : … … … … …
General Inform ation Location of discharge site : Temporary ∋ Distance from perm anent site : … … … … … (m) U/S ∋
Permanent ∋ D/S ∋Mode of crossing : … … … … … … … … … Method of vel. Obser. : … … … … … … … Sounding taken with : … … … … … … … … …Sounding weight used : … … … … … .… Units: … … … ..Condition of water : … … … … … … … … … Condition of weather : … … … … … … … … … River water temp. : … … … … At. temp. : … … … … … … …W ind direction w.r.t current : … … … … … ( °
) Strength of wind : … … … … … .… … … .. Average wind speed : … … … … … ... (km/h)
Gauge Inform ation Current Meter Information
Mean Gauge Reading (m )Perm anent Site Tem porary Site
At StartAt EndMean
Mean W ater Level (m +m.s.l): … … … … … … …
Current m eter used : … … … … … ..… … Rating Eq. of C.M. : … … … … … ..… …Date of last rating : … … … … … ..… … Since when in use : … … … … … ..… …Rated spin : … … … … .. (sec.) Spin before m easure.: … … … … .. (sec.)Spin after m easure.: … … … … … (sec.) No. of days in use : .… … …
.
Gauging Information Method of suspending m eter : … … … … … … … … … Weight used with meter: … … … .. Units: … … … .. No. of com partments : … … … …
Co
mp
art
me
nt
No
.
No
. o
f S
ec
tio
ns
Se
cti
on
No
.
Ob
se
rve
d D
ep
t h(m
)
Ve
rtic
al
An
gle
(De
g.)
Air
lin
eC
orr
ec
tio
n (
m)
We
tlin
eC
orr
ec
tio
n (
m)
Co
rre
cte
d W
ate
rD
ep
th (
m)
Co
ntr
i.
for
We
tte
d P
eri
. (m
)
Se
gm
en
tal
Are
a(m
2)
No
. o
f V
elo
cit
yO
bs
erv
ati
on
s
De
pth
of
Ob
se
-rv
ati
on
Po
int
No
. o
fR
ev
olu
tio
ns
Tim
e T
ak
en
(se
c.)
Po
int
Ve
loc
ity
(m/s
ec
.)
Me
an
Ve
loc
ity
(m/s
ec
.)
An
gle
of
Ob
liq
ue
. (D
eg
.)
Ve
loc
ity
Co
rr.
foO
bli
qu
e.
(m/s
ec
.
Dri
ft D
ista
nc
e(m
)
Tim
e f
or
Dri
ft(s
ec
.)
Dri
ft C
orr
ec
tio
n(m
/se
c.)
Fin
al
Me
an
Ve
loc
ity
(m
/se
c.
Se
gm
en
tal
Dis
ch
. (
cu
me
c. )
Re
ma
rks
Top Width (T) : … … … … (m) Wetted Peri. (P) : … … … . (m) Total Area (A) : … ...… … … (m 2) Total D ischarge (Q): … … … … … (cumecs)
Max. Point Velocity : … … … … (m/sec.) Hyd. Radius (R=A/P) : … … ..… (m) Hyd. Depth (A/T) : … .… … … .. (m) Mean Velocity (V) : … … … .… … (m/sec.)
Surface Slope Observation
Surface Slope Observation by Leveling Surface Slope Observation by Staff GaugeDistancefrom CGL
Difference inDistances (m) Level
Reading (m )Difference in
Level Reading (m )Slope Mean
SlopeGauge
Reading (m )Difference in
Gauge Reading (m )Slope Mean
Slope… … .. m U/S0 m… … .. m D/S
Chezy’s Value (C = V/(RS)0.5
: … … … … … … … … … Manning’s Value (N = R1/6
/C): … … … … … … … … … … … … ..
Characteristics of river bed : … … … … … … … … … … … … … … … … … … … … Class of roughness under which it fa lls: … … … … … … … … … … … … … … … … … ..…
Observer’s remarks : … … … … ...… … … … … … … … … … … … … … … … … … … … … … … … … … … … … … … … … … … … … … … … … … … … … … … … … … … … … … … … .… .
Form filled by: Manuscript checked: Data entered & checked by: Primary validation done by:
Observer Supervisor/J.E. DPC Assistant Assistant Hydrologist
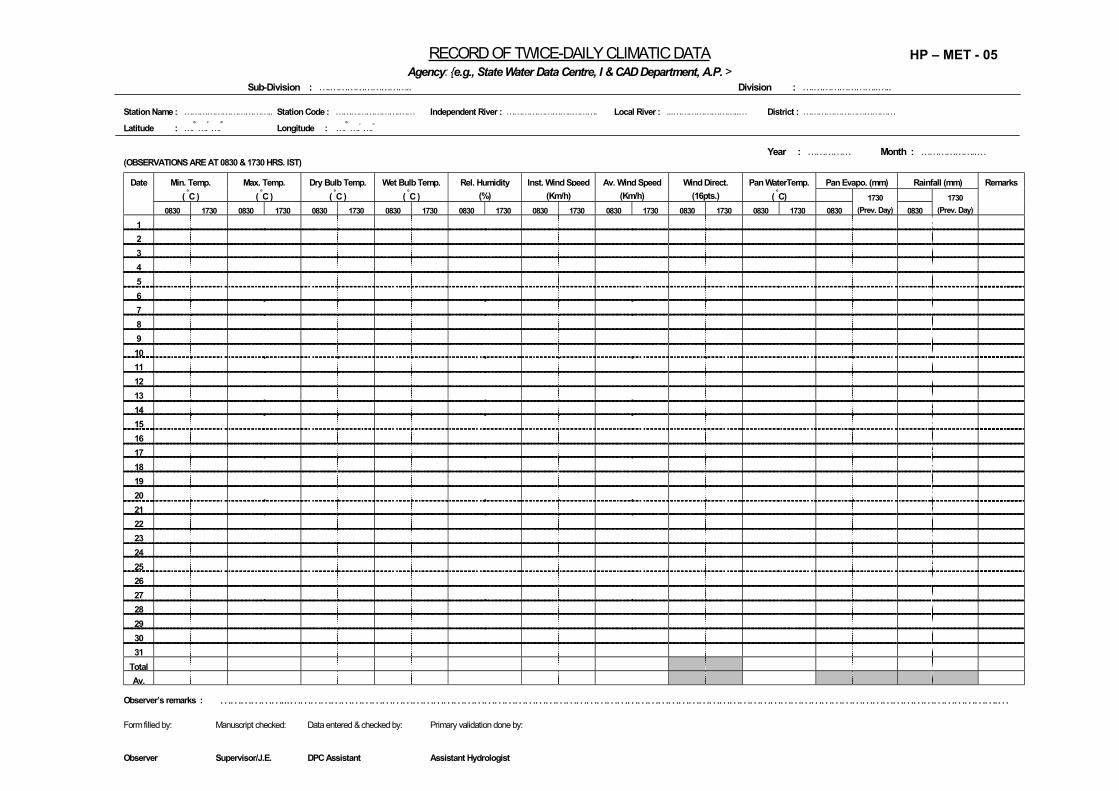
HP – SW - 05
RECORD OF SUMMARY OF STAGE-DISCHARGE OBSERVATIONS <Agency: {e.g., State Water Data Centre, I & CAD Department, A.P. >
Sub-Division : ….……………………….. Division : ….…………………..…..Station Name : .………………………………… Station Code : …………………………… District : ………………………………….
Independent River : …….……………………..…….. Local River : ...……………………..….. Latitude : ….° ….
′ ….
″ Longitude : ….
° ….′ ….″
R.L. of Gauge Zero : ………….. (m+m.s.l.) Year: …………… Month(s): ……………
Dat
e
Av.
Tim
e of
Obs
erva
tion
Obs
erva
tion
No.
Mea
n G
auge
Rea
ding
(m)
Mea
n W
ater
Leve
l (m
+msl
)
Dis
char
ge(c
umec
.)
Obs
erve
d/C
ompu
ted
Are
a(m
2 )
Sur
face
Slo
pe
Top
Wid
th(m
)
Wet
ted
Per
imet
er(m
)
Hyd
raul
ic R
adiu
s(m
)
Mea
n Ve
loci
ty(m
/sec
.)
Man
ning
’s N
Gra
dien
t(m
/day
)
Fall
(m)
Mod
e of
Cro
ssin
g
Met
hod
of V
elo-
city
Obs
erva
tion
No.
of V
ertic
als/
Floa
t Com
pt.
Max
. Vel
ocity
(m/s
ec.)
Wea
ther
Con
ditio
n
Win
d V
eloc
ity(k
m/h
)
Win
d D
irec
tion
(16
pts.
)
Rem
arks
Observer’s remarks : …………...…………………………………………………………………………………………………………………………………………………….….
Form filled by: Manuscript checked: Data entered & checked by: Primary validation done by:
Observer Supervisor/J.E. DPC Assistant Assistant Hydrologist

HP – SW - 07
RECORD OF SUSPENDED SEDIMENT SUMMARY DATA
Agency: Central Water Commission, C&SR, Coimbatore
Sub-Division: ……………………… Division: ………………………
Name : …………………………….. Station Code : …………………….……Independent River : ……………………..………. Local River : ...……………………..…District : ………………………..… Latitude : ….° ….′ ….″ Longitude : ….° ….′ ….″
R.L. of Gauge Zero : …………… (m+m.s.l.) Year : …………Month : …………..…
Suspended sediment concentration (g/l)Date Time ofobservation
GaugeReading(m)
WaterLevel (m)
TotalDischarge(cusec)
CoarseFraction
MediumFraction
FineFraction
Total
Remarks
1
2
3
4
5
6
7
8
9
10
11
12
13
14
15
16
17
18
19
20
21
22
23
24
25
26
27
28
29
30
31
Observer’s remarks: ………………………………………………………………………………………………………………………….……………………………………………………………………………………………………………………………………………………
Form filled by: Manuscript checked: Data entered & checked by: Primary validation done by:
Observer Supervisor/J.E. DPC Assistant Assistant Hydrologist

HP – WQ - 01
RECORD OF SAMPLE IDENTIFICATION<Agency: {e.g., State Water Data Centre, I & CAD Department, A.P.} >
Sub-Division:……….……………………….. Division:…………….….…………………..…..
Sample code
Observer Agency Project
Date Time Station code
Container Preservation TreatmentParametercode
Glass PVC PE Teflon None Cool Acid Other None Decant Filter
(1) Gen
(2) Bact
(3) BOD(4) COD, NH3,NO3
-
(5) H. Metals
(6)Tr. Organics
Source of sample
Waterbody Point Approach Medium Matrix
o Rivero Draino Canalo Reservoir
o Main currento Right banko Left bank
o Bridgeo Boato Wading
o Watero Susp mattero Biotao Sediment
o Fresho Brackisho Salto Effluent
Sample type o Grab o Time-comp o Flow-comp o Depth-integ o Width-integ
Sample device o Weighted bottle o Pump o Depth sampler
Field determinations
Temp oC pH EC µmho/cm DO mg/L
Odourcode
(1) Odour free(2) Rotten eggs(3) Burnt sugar(4) Soapy(5) Fishy
(6) Septic(7) Aromatic(8) Chlorinous(9) Alcoholic(10) Unpleasant
Colourcode
(1) Light brown(2) Brown(3) Dark brown(4) Light green(5) Green
(6) Dark green(7) Clear(8) Other (specify)
Remarks
Weather o Sunny o Cloudy o Rainy o Windy
Water vel. m/s o High (> 0.5) o Medium (0.1-0.5) o Low (< 0.1) o Standing
Water use o None o Cultivation o Bathing & washing o Cattle washingo Melon/vegetable farming in river bed

HP – WQ - 01

HP – WQ - 02
RECORD OF WQ SAMPLE IDENTIFICATION<Agency: {e.g., State Water Data Centre, I & CAD Department, A.P.} >
Sub-Division:……….……………………….. Division:…………….….…………………..…..D
ate/
Tim
ere
ceiv
ed a
t la
b.
Dat
e/T
ime
colle
cted
Sta
tio
n c
od
e
Pro
ject
Co
llect
ing
agen
cy/c
olle
cto
r
Pre
serv
atio
n
Par
amet
er c
od
e
Lab
. Sam
ple
No
.
(1) (2) (3) (4) (5) (6) (7) (8)
Note:- Column (3) gives the station code conventionally followed by the monitoring agency.- Column (4) gives the project under which the sample is collected.- Column (7) corresponds to the parameter(s) code given in the sample identification form.- Column (8) gives the laboratory sample number assigned to the sample as it is received in the
laboratory. Note that the numbering has two parts separated by a hyphen. The first part isassigned in a sequential manner as samples are received from various stations. If two samplesare collected at the same time from a station for different sets of analysis, the first part of thenumber is the same. The second part corresponds to the parameter code.
- The results of the analyses of all the samples having the same first part of the code would beentered in the data entry system as one sample having the same station code and time of samplecollection.

HP – WQ – 03
RECORD OF WQ DATA AND VALIDATIONName of Laboratory: Laboratory code:
Data record
Field determinations General Nutrients Org matter Alkalinity Hardness Major ions Other inorganics Coliforms Biol
Lab
sam
ple
No
Sta
tio
n c
od
e
Da
te o
f c
oll
ecti
on
pH
EC
, µm
ho
/cm
DO
, m
g/L
Te
mp
, o
C
Co
lou
r, c
od
e
Od
ou
r, c
od
e
pH
EC
, µm
ho
/cm
TD
S,
mg
/L
TS
S,
mg
/L
NH
3, m
g N
/L
NO
2- +N
O3- ,
mg
N/L
To
tal
P,
mg
/L
BO
D,
mg
/L
CO
D,
mg
/L
Ph
en
, m
g C
aC
O3/
L
To
tal,
mg
Ca
CO
3/L
To
tal,
mg
Ca
CO
3/L
Ca
++,
mg
Ca
CO
3/L
Ca
++,
mg
/L
Mg
++,
mg
/L
Na
+,
mg
/L
K+,
mg
/L
Cl- ,
mg
/L
SO
4--,
mg
/L
CO
3--,
mg
/L
HC
O3- ,
mg
/L
Si,
mg
/L
F- ,
mg
/L
B,
mg
/L
To
tal,
MP
N/1
00
mL
Fa
ec
al,
MP
N/1
00
mL
Ch
loro
ph
yll-
A,
µg/L
(1) (2) (3) (4) (5) (6) (7) (8) (9) (10) (11) (12) (13) (14) (15) (16) (17) (18) (19) (20) (21) (22) (23) (24) (25) (26) (27) (28) (29) (30) (31) (32) (33) (34) (35) (36)
Data validation
Cations Anions Ion balance EC balCarbon
balCO3
-- bal Verification criteria Checked by Remarks
La
b
sa
mp
leN
o
Sta
tio
n c
od
e
Ca
++,
me
q/L
Mg
++,
me
q/L
Na
+,
me
q/L
K+,
me
q/L
To
tal
cati
on
s
Cl- ,
me
q/L
SO
4--,
me
q/L
CO
3--,
me
q/L
,
HC
O3- ,
me
q/L
NO
2- +N
O3- ,
me
q/L
To
tal
anio
ns
{(41)-(47)} / {(41)+(47)} (39) / (42) (12) / (11) (18) / (17)If (10) < 8.3,is (19)=0 ?
(1) (2) (37) (38) (39) (40) (41) (42) (43) (44) (45) (46) (47) (48) (49) (50) (51) (52) (53) (54) (55)
(48) < 0.1(49) = 0.8-1.2
(50 ) = 0.55-0.9(51) > 1
(52) = yes