Embed Size (px)
Citation preview

5/12/2016 Profiling and optimizing Go programs
http://localhost:3999/gomeetup.slide#1 1/84
Pro�ling and optimizing Goprograms14 July 2016
Marko KevacSoftware Engineer, Badoo

5/12/2016 Profiling and optimizing Go programs
http://localhost:3999/gomeetup.slide#1 2/84
Introduction

5/12/2016 Profiling and optimizing Go programs
http://localhost:3999/gomeetup.slide#1 3/84
What is pro�ling and optimization?

5/12/2016 Profiling and optimizing Go programs
http://localhost:3999/gomeetup.slide#1 4/84
Pro�ling on Linux

5/12/2016 Profiling and optimizing Go programs
http://localhost:3999/gomeetup.slide#1 5/84
Pro�ling on OSX
OSX pro�ling �xed in El Capitan. Previous versions need binary patch.
godoc.org/rsc.io/pprof_mac_�x (https://godoc.org/rsc.io/pprof_mac_�x)

5/12/2016 Profiling and optimizing Go programs
http://localhost:3999/gomeetup.slide#1 6/84
CPU
github.com/gperftools/gperftools (https://github.com/gperftools/gperftools)

5/12/2016 Profiling and optimizing Go programs
http://localhost:3999/gomeetup.slide#1 7/84
CPU
pprof is a sampling pro�ler.
All pro�lers in Go can be started in a di�erent ways, but all of them can be broken intocollection and visualization phase.
Example.

5/12/2016 Profiling and optimizing Go programs
http://localhost:3999/gomeetup.slide#1 8/84
Example
package perftest import ( "regexp" "strings" "testing" ) var haystack = Lorem ipsum dolor sit amet ... auctor ... elit ... func BenchmarkSubstring(b *testing.B) { for i := 0; i < b.N; i++ { strings.Contains(haystack, "auctor") } } func BenchmarkRegex(b *testing.B) { for i := 0; i < b.N; i++ { regexp.MatchString("auctor", haystack) } }

5/12/2016 Profiling and optimizing Go programs
http://localhost:3999/gomeetup.slide#1 9/84
Benchmark
$ go test -bench=. testing: warning: no tests to run BenchmarkSubstring-8 10000000 194 ns/op BenchmarkRegex-8 200000 7516 ns/op PASS ok github.com/mkevac/perftest00 3.789s

5/12/2016 Profiling and optimizing Go programs
http://localhost:3999/gomeetup.slide#1 10/84
Pro�ling
$ GOGC=off go test -bench=BenchmarkRegex -cpuprofile cpu.out testing: warning: no tests to run BenchmarkRegex-8 200000 6773 ns/op PASS ok github.com/mkevac/perftest00 1.491s
GOGC=o� turns o� garbage collector
Turning o� GC can be bene�cial for short programs.
When started with -cpupro�le, go test puts binary in our working dir.

5/12/2016 Profiling and optimizing Go programs
http://localhost:3999/gomeetup.slide#1 11/84
Visualization
Linux
$ go tool pprof perftest00.test cpu.out (pprof) web
OSX
$ open https://www.xquartz.org $ ssh -Y server $ go tool pprof perftest00.test cpu.out (pprof) web
Other
$ go tool pprof -svg ./perftest00.test ./cpu.out > cpu.svg $ scp ... $ open cpu.svg

5/12/2016 Profiling and optimizing Go programs
http://localhost:3999/gomeetup.slide#1 12/84
Visualization

5/12/2016 Profiling and optimizing Go programs
http://localhost:3999/gomeetup.slide#1 13/84

5/12/2016 Profiling and optimizing Go programs
http://localhost:3999/gomeetup.slide#1 14/84
Visualization

5/12/2016 Profiling and optimizing Go programs
http://localhost:3999/gomeetup.slide#1 15/84
Fix
package perftest import ( "regexp" "strings" "testing" ) var haystack = Lorem ipsum dolor sit amet ... auctor ... elit ... var pattern = regexp.MustCompile("auctor") func BenchmarkSubstring(b *testing.B) { for i := 0; i < b.N; i++ { strings.Contains(haystack, "auctor") } } func BenchmarkRegex(b *testing.B) { for i := 0; i < b.N; i++ { pattern.MatchString(haystack) } }

5/12/2016 Profiling and optimizing Go programs
http://localhost:3999/gomeetup.slide#1 16/84
Benchmark
$ go test -bench=. testing: warning: no tests to run BenchmarkSubstring-8 10000000 170 ns/op BenchmarkRegex-8 5000000 297 ns/op PASS ok github.com/mkevac/perftest01 3.685s
What about call graph?

5/12/2016 Profiling and optimizing Go programs
http://localhost:3999/gomeetup.slide#1 17/84
Visualization
We don't see compilation at all.

5/12/2016 Profiling and optimizing Go programs
http://localhost:3999/gomeetup.slide#1 18/84
Ways to start CPU pro�ler
1. go test -cpupro�le=cpu.out 2. pprof.StartCPUPro�le() and pprof.StopCPUPro�le() or Dave Cheney great packagegithub.com/pkg/pro�le (https://github.com/pkg/pro�le)
3. import _ "net/http/pprof"
Example

5/12/2016 Profiling and optimizing Go programs
http://localhost:3999/gomeetup.slide#1 19/84
Example
package main import ( "net/http" _ "net/http/pprof" ) func cpuhogger() { var acc uint64 for { acc += 1 if acc&1 == 0 { acc <<= 1 } } } func main() { go http.ListenAndServe("0.0.0.0:8080", nil) cpuhogger() }

5/12/2016 Profiling and optimizing Go programs
http://localhost:3999/gomeetup.slide#1 20/84
Visualization
$ go tool pprof http://localhost:8080/debug/pprof/profile?seconds=5 (pprof) web (pprof) top 4.99s of 4.99s total ( 100%) flat flat% sum% cum cum% 4.99s 100% 100% 4.99s 100% main.cpuhogger 0 0% 100% 4.99s 100% runtime.goexit 0 0% 100% 4.99s 100% runtime.main (pprof) list cpuhogger Total: 4.99s No source information for main.cpuhogger
No disassembly? No source code? We need binary.

5/12/2016 Profiling and optimizing Go programs
http://localhost:3999/gomeetup.slide#1 21/84
Visualization
$ go tool pprof pproftest http://localhost:8080/debug/pprof/profile?seconds=5 (pprof) list cpuhogger Total: 4.97s ROUTINE ======================== main.cpuhogger in /home/marko/goprojects/src/github.com/mkevac/pproftest/main.go 4.97s 4.97s (flat, cum) 100% of Total . . 6:) . . 7: . . 8:func cpuhogger() { . . 9: var acc uint64 . . 10: for { 2.29s 2.29s 11: acc += 1 1.14s 1.14s 12: if acc&1 == 0 { 1.54s 1.54s 13: acc <<= 1 . . 14: } . . 15: } . . 16:} . . 17: . . 18:func main() {
5/12/2016 Profiling and optimizing Go programs
http://localhost:3999/gomeetup.slide#1 22/84
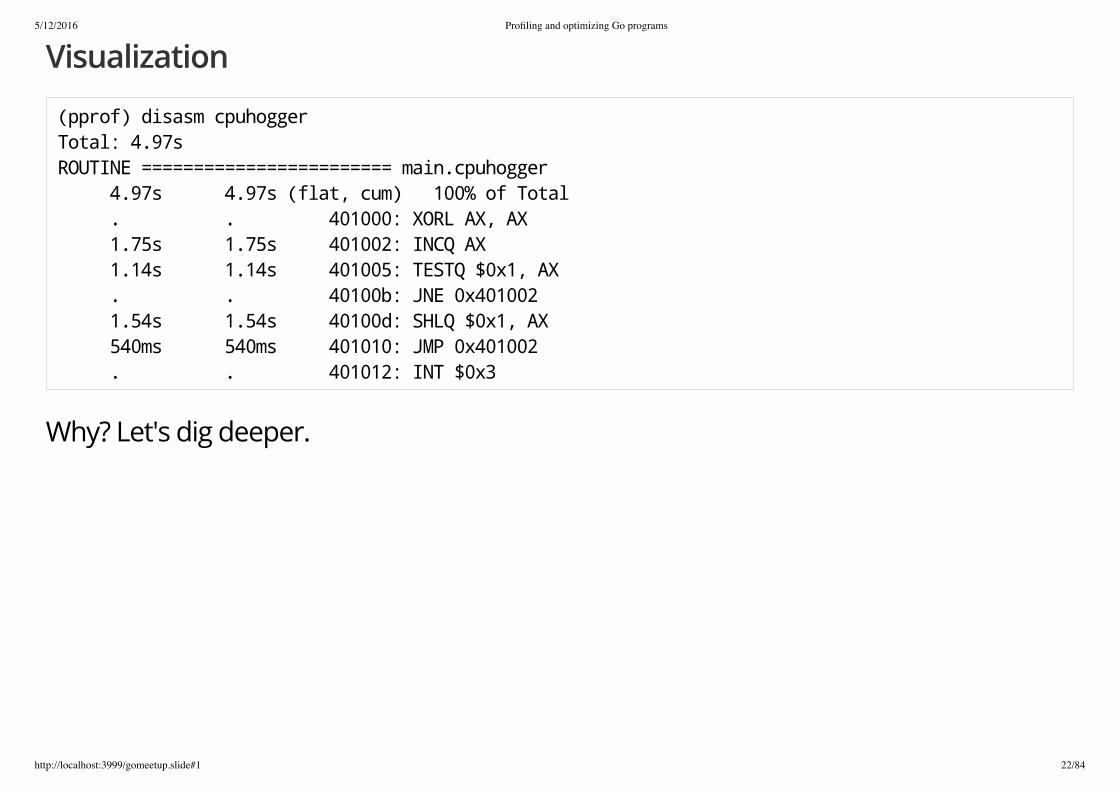
Visualization
(pprof) disasm cpuhogger Total: 4.97s ROUTINE ======================== main.cpuhogger 4.97s 4.97s (flat, cum) 100% of Total . . 401000: XORL AX, AX 1.75s 1.75s 401002: INCQ AX 1.14s 1.14s 401005: TESTQ $0x1, AX . . 40100b: JNE 0x401002 1.54s 1.54s 40100d: SHLQ $0x1, AX 540ms 540ms 401010: JMP 0x401002 . . 401012: INT $0x3
Why? Let's dig deeper.

5/12/2016 Profiling and optimizing Go programs
http://localhost:3999/gomeetup.slide#1 23/84
Why?
$ curl http://localhost:8080/debug/pprof/profile?seconds=5 -o /tmp/cpu.log $ strings /tmp/cpu.log | grep cpuhogger
/debug/pprof/symbol for acquiring symbols binary for disassembly binary and source code for source code
Currently there is no way to specify path to source code (same as "dir" command ingdb) :-(
Binary that you give to pprof and binary that is running must be the same!
Not deep enough?

5/12/2016 Profiling and optimizing Go programs
http://localhost:3999/gomeetup.slide#1 24/84
How pprof works?
1. Current desktop and server OS's implement preemptive scheduling(https://en.wikipedia.org/wiki/Preemption_(computing)) or preemptive multitasking (oposing to cooperative
multitasking). 2. Hardware sends signal to OS and OS executes scheduler which can preemptworking process and put other process on it's place. 3. pprof works in similar fashion. 4. man setitimer (http://man7.org/linux/man-pages/man2/setitimer.2.html) and SIGPROF
5. Go sets handler for SIGPROF which gets and saves stack traces for allgoroutines/threads. 6. Separate goroutine gives this data to user.
Bug in SIGPROF signal delivery (http://research.swtch.com/macpprof) was the reason why pro�ling on OSX
pre El Capitain did not work.

5/12/2016 Profiling and optimizing Go programs
http://localhost:3999/gomeetup.slide#1 25/84
How pprof works?
Cons
1. Signals are not cheap. Do not expect more than 500 signals per second. Defaultfrequency in Go runtime is 100 HZ. 2. In non standard builds (-buildmode=c-archive or -buildmode=c-shared) pro�ler donot work by default. 3. User space process do not have access to kernel stack trace.
Pros
Go runtime has all the knowledge about internal stu�.

5/12/2016 Profiling and optimizing Go programs
http://localhost:3999/gomeetup.slide#1 26/84
Linux system pro�lers
var haystack = Lorem ipsum dolor sit amet ... auctor ... elit ... func UsingSubstring() bool { found := strings.Contains(haystack, "auctor") return found } func UsingRegex() bool { found, _ := regexp.MatchString("auctor", haystack) return found } func main() { go func() { for { UsingSubstring() } }() for { UsingRegex() } }

5/12/2016 Profiling and optimizing Go programs
http://localhost:3999/gomeetup.slide#1 27/84
Systemtap
Systemtap script -> C code -> Kernel module stap utility do all these things for you. Including kernel module loading and unloading.

5/12/2016 Profiling and optimizing Go programs
http://localhost:3999/gomeetup.slide#1 28/84
Systemtap
Getting probe list:
$ stap -l 'process("systemtap").function("main.*")' process("systemtap").function("[email protected]:16") process("systemtap").function("[email protected]:11") process("systemtap").function("[email protected]:32") process("systemtap").function("[email protected]:22") process("systemtap").function("[email protected]:21")
Getting probe list with function arguments
$ stap -L 'process("systemtap").function("runtime.mallocgc")' process("systemtap").function("runtime.mallocgc@src/runtime/malloc.go:553") $shouldhelpgc:bool $noscan:bool $scanSize:uintptr $dataSize:uintptr $x:void* $s:struct runtime.mspan* $c:struct runtime.mcache* $assistG:structruntime.g* $size:uintptr $typ:runtime._type* $needzero:bool $~r3:void*
Systemtap do not understand where Go keeps return value, so we can get inmanually:
printf("%d\n", user_int64(register("rsp") + 8))

5/12/2016 Profiling and optimizing Go programs
http://localhost:3999/gomeetup.slide#1 29/84
Systemtap
global etime global intervals probe $1.call { etime = gettimeofday_ns() } probe $1.return { intervals <<< (gettimeofday_ns() - etime)/1000 } probe end { printf("Duration min:%dus avg:%dus max:%dus count:%d\n", @min(intervals), @avg(intervals), @max(intervals), @count(intervals)) printf("Duration (us):\n") print(@hist_log(intervals)); printf("\n") }

5/12/2016 Profiling and optimizing Go programs
http://localhost:3999/gomeetup.slide#1 30/84
Systemtap
$ sudo stap main.stap 'process("systemtap").function("main.UsingSubstring")' CDuration min:0us avg:1us max:586us count:1628362 Duration (us): value |-------------------------------------------------- count 0 | 10 1 |@@@@@@@@@@@@@@@@@@@@@@@@@@@@@@@@@@@@@@@@@@@@@@@@@ 1443040 2 |@@@@@ 173089 4 | 6982 8 | 4321 16 | 631 32 | 197 64 | 74 128 | 13 256 | 4 512 | 1 1024 | 0 2048 | 0

5/12/2016 Profiling and optimizing Go programs
http://localhost:3999/gomeetup.slide#1 31/84
Systemtap
$ ./systemtap runtime: unexpected return pc for main.UsingSubstring called from 0x7fffffffe000 fatal error: unknown caller pc runtime stack: runtime.throw(0x494e40, 0x11) /home/marko/go/src/runtime/panic.go:566 +0x8b runtime.gentraceback(0xffffffffffffffff, 0xc8200337a8, 0x0, 0xc820001d40, 0x0, 0x0, 0x7fffffff, 0x7fff2fa88030, 0x0, 0x0, ...) /home/marko/go/src/runtime/traceback.go:311 +0x138c runtime.scanstack(0xc820001d40) /home/marko/go/src/runtime/mgcmark.go:755 +0x249 runtime.scang(0xc820001d40) /home/marko/go/src/runtime/proc.go:836 +0x132 runtime.markroot.func1() /home/marko/go/src/runtime/mgcmark.go:234 +0x55 runtime.systemstack(0x4e4f00) /home/marko/go/src/runtime/asm_amd64.s:298 +0x79 runtime.mstart() /home/marko/go/src/runtime/proc.go:1087

5/12/2016 Profiling and optimizing Go programs
http://localhost:3999/gomeetup.slide#1 32/84
Systemtap
Crash when Go's garbage collector gets its call trace. Probably caused by trampoline that systemtap puts in our code to handle its probes.
goo.gl/N8XH3p (https://goo.gl/N8XH3p)
No �x yet.
But Go is not alone. There are problems with uretprobes trampoline in C++ too(https://sourceware.org/bugzilla/show_bug.cgi?id=12275) (2010-)

5/12/2016 Profiling and optimizing Go programs
http://localhost:3999/gomeetup.slide#1 33/84
Systemtap
package main import ( "bytes" "fmt" "math/rand" "time" ) func ToString(number int) string { return fmt.Sprintf("%d", number) } func main() { r := rand.New(rand.NewSource(time.Now().UnixNano())) var buf bytes.Buffer for i := 0; i < 1000; i++ { value := r.Int() % 1000 value = value - 500 buf.WriteString(ToString(value)) } }

5/12/2016 Profiling and optimizing Go programs
http://localhost:3999/gomeetup.slide#1 34/84
Systemtap
global intervals probe process("systemtap02").function("main.ToString").call { intervals <<< $number } probe end { printf("Variables min:%dus avg:%dus max:%dus count:%d\n", @min(intervals), @avg(intervals), @max(intervals), @count(intervals)) printf("Variables:\n") print(@hist_log(intervals)); printf("\n") }

5/12/2016 Profiling and optimizing Go programs
http://localhost:3999/gomeetup.slide#1 35/84
Systemtap
Variables min:-499us avg:8us max:497us count:1000 Variables: value |-------------------------------------------------- count -256 |@@@@@@@@@@@@@@@@@@@@@@@@@@@@@@@@@@@@@@@@@ 249 -128 |@@@@@@@@@@@@@@@@@@@@ 121 -64 |@@@@@@@@@@ 60 -32 |@@@@@@ 36 -16 |@@ 12 -8 |@ 8 -4 | 5 -2 | 3 -1 | 2 0 | 2 1 | 2 2 | 3 4 |@ 7 8 | 4 16 |@@@ 20 32 |@@@@@ 33 64 |@@@@@@@ 44 128 |@@@@@@@@@@@@@@@@@@ 110 256 |@@@@@@@@@@@@@@@@@@@@@@@@@@@@@@@@@@@@@@@@@@@@@@ 279

5/12/2016 Profiling and optimizing Go programs
http://localhost:3999/gomeetup.slide#1 36/84
perf and perf_events
$ sudo perf top -p $(pidof systemtap)

5/12/2016 Profiling and optimizing Go programs
http://localhost:3999/gomeetup.slide#1 37/84

5/12/2016 Profiling and optimizing Go programs
http://localhost:3999/gomeetup.slide#1 38/84
perf and perf_events

5/12/2016 Profiling and optimizing Go programs
http://localhost:3999/gomeetup.slide#1 39/84

5/12/2016 Profiling and optimizing Go programs
http://localhost:3999/gomeetup.slide#1 40/84
Brendan Gregg Flame Graphs
www.brendangregg.com/�amegraphs.html (http://www.brendangregg.com/�amegraphs.html)
Systems Performance: Enterprise and the Cloud
goo.gl/556Hs2 (http://goo.gl/556Hs2)
$ sudo perf record -F 99 -g -p $(pidof systemtap) -- sleep 10 [ perf record: Woken up 1 times to write data ] [ perf record: Captured and wrote 0.149 MB perf.data (1719 samples) ] $ sudo perf script | ~/tmp/FlameGraph/stackcollapse-perf.pl > out.perf-folded $ ~/tmp/FlameGraph/flamegraph.pl out.perf-folded > perf-kernel.svg

5/12/2016 Profiling and optimizing Go programs
http://localhost:3999/gomeetup.slide#1 41/84
Brendan Gregg Flame Graphs
Kernel stack traces!

5/12/2016 Profiling and optimizing Go programs
http://localhost:3999/gomeetup.slide#1 42/84
Memory
What if we were in C/C++ world? Valgrind! Massif!
#include <stdlib.h> #include <unistd.h> #include <string.h> int main() { const size_t MB = 1024*1024; const unsigned count = 20; char **buf = calloc(count, sizeof(*buf)); for (unsigned i = 0; i < count; i++) { buf[i] = calloc(1, MB); memset(buf[i], 0xFF, MB); sleep(1); } for (unsigned i = 0; i < count; i++) { free(buf[i]); sleep(1); } free(buf); }

5/12/2016 Profiling and optimizing Go programs
http://localhost:3999/gomeetup.slide#1 43/84
Vagrind and Massif
26.20 :: | ::: # | @@: : #:: | ::@ : : #: :: | ::::: @ : : #: : :::: | :: : : @ : : #: : : : :: | :::: : : @ : : #: : : : : : | ::::: :: : : @ : : #: : : : : ::::: | ::: : : :: : : @ : : #: : : : : :: : @@ | ::: : : : :: : : @ : : #: : : : : :: : @ :: | ::@: : : : : :: : : @ : : #: : : : : :: : @ : ::: | ::: @: : : : : :: : : @ : : #: : : : : :: : @ : : ::: | ::: : @: : : : : :: : : @ : : #: : : : : :: : @ : : :: :: | ::: : : @: : : : : :: : : @ : : #: : : : : :: : @ : : :: : :: | ::::: : : : @: : : : : :: : : @ : : #: : : : : :: : @ : : :: : : :::: |:: : : : : : @: : : : : :: : : @ : : #: : : : : :: : @ : : :: : : : : : |@: : : : : : @: : : : : :: : : @ : : #: : : : : :: : @ : : :: : : : : :@ |@: : : : : : @: : : : : :: : : @ : : #: : : : : :: : @ : : :: : : : : :@ |@: : : : : : @: : : : : :: : : @ : : #: : : : : :: : @ : : :: : : : : :@ |@: : : : : : @: : : : : :: : : @ : : #: : : : : :: : @ : : :: : : : : :@ 0 +----------------------------------------------------------------------->s 0 39.13

5/12/2016 Profiling and optimizing Go programs
http://localhost:3999/gomeetup.slide#1 44/84
Valgrind and Massif
Valgrind rede�nes all memory allocation functions (malloc, calloc, new, free, etc.). Go do not use them. Go has their own memory allocator which uses mmap or sbrk.

5/12/2016 Profiling and optimizing Go programs
http://localhost:3999/gomeetup.slide#1 45/84
Memory
Valgrind can catch mmap/sbrk, but there is no point.
All other memory pro�ling tools work in the same fashion.
We can theoretically use perf/systemtap
Or we can use rich internal tools

5/12/2016 Profiling and optimizing Go programs
http://localhost:3999/gomeetup.slide#1 46/84
Memory
Go can collect information about allocations with some rate (once in 512KiB bydefault).
pprof can visualize it.
Similar to CPU pro�ling, we have three ways to collect data. Let's use net/http/pprofthis time.

5/12/2016 Profiling and optimizing Go programs
http://localhost:3999/gomeetup.slide#1 47/84
Example
import _ "net/http/pprof" func allocAndKeep() { var b [][]byte for { b = append(b, make([]byte, 1024)) time.Sleep(time.Millisecond) } } func allocAndLeave() { var b [][]byte for { b = append(b, make([]byte, 1024)) if len(b) == 20 { b = nil } time.Sleep(time.Millisecond) } } func main() { go allocAndKeep() go allocAndLeave() http.ListenAndServe("0.0.0.0:8080", nil) }

5/12/2016 Profiling and optimizing Go programs
http://localhost:3999/gomeetup.slide#1 48/84
go tool pprof
alloc_space - allocated bytes
alloc_objects - number of allocated objects
inuse_space - allocated bytes that are in use (live)
inuse_objects - number of allocated objects that are in use (live)
We expect inuse to show only allocAndKeep() and alloc to show both functions.

5/12/2016 Profiling and optimizing Go programs
http://localhost:3999/gomeetup.slide#1 49/84
go tool pprof
$ go tool pprof -inuse_space memtest http://localhost:8080/debug/pprof/heap Fetching profile from http://localhost:8080/debug/pprof/heap Saved profile in /home/marko/pprof/pprof.memtest.localhost:8080.inuse_objects.inuse_space.005.pb.gzEntering interactive mode (type "help" for commands) (pprof) top 15.36MB of 15.36MB total ( 100%) Dropped 2 nodes (cum <= 0.08MB) flat flat% sum% cum cum% 15.36MB 100% 100% 15.36MB 100% main.allocAndKeep 0 0% 100% 15.36MB 100% runtime.goexit $ go tool pprof -alloc_space memtest http://localhost:8080/debug/pprof/heap Fetching profile from http://localhost:8080/debug/pprof/heap Saved profile in /home/marko/pprof/pprof.memtest.localhost:8080.alloc_objects.alloc_space.008.pb.gzEntering interactive mode (type "help" for commands) (pprof) top 54.49MB of 54.49MB total ( 100%) Dropped 8 nodes (cum <= 0.27MB) flat flat% sum% cum cum% 27.97MB 51.33% 51.33% 29.47MB 54.08% main.allocAndKeep 23.52MB 43.17% 94.49% 25.02MB 45.92% main.allocAndLeave 3MB 5.51% 100% 3MB 5.51% time.Sleep 0 0% 100% 54.49MB 100% runtime.goexit

5/12/2016 Profiling and optimizing Go programs
http://localhost:3999/gomeetup.slide#1 50/84
Sleep?
Looks like predicted. But what is with sleep?
(pprof) list time.Sleep Total: 54.49MB ROUTINE ======================== time.Sleep in /home/marko/go/src/runtime/time.go 3MB 3MB (flat, cum) 5.51% of Total . . 48:func timeSleep(ns int64) { . . 49: if ns <= 0 { . . 50: return . . 51: } . . 52: 3MB 3MB 53: t := new(timer) . . 54: t.when = nanotime() + ns . . 55: t.f = goroutineReady . . 56: t.arg = getg() . . 57: lock(&timers.lock) . . 58: addtimerLocked(t)

5/12/2016 Profiling and optimizing Go programs
http://localhost:3999/gomeetup.slide#1 51/84
Implicit allocations
package printtest import ( "bytes" "fmt" "testing" ) func BenchmarkPrint(b *testing.B) { var buf bytes.Buffer var s string = "test string" for i := 0; i < b.N; i++ { buf.Reset() fmt.Fprintf(&buf, "string is: %s", s) } }
Benchmark?

5/12/2016 Profiling and optimizing Go programs
http://localhost:3999/gomeetup.slide#1 52/84
Benchmark
$ go test -bench=. -benchmem testing: warning: no tests to run BenchmarkPrint-8 10000000 128 ns/op 16 B/op 1 allocs/op PASS ok github.com/mkevac/converttest 1.420s

5/12/2016 Profiling and optimizing Go programs
http://localhost:3999/gomeetup.slide#1 53/84
Pro�ling
$ go test -bench=. -memprofile=mem.out -memprofilerate=1
mempro�lerate sets pro�ling rate. 1 means all allocations.
$ go tool pprof -alloc_space converttest.test mem.out
(pprof) top 15.41MB of 15.48MB total (99.59%) Dropped 73 nodes (cum <= 0.08MB) flat flat% sum% cum cum% 15.41MB 99.59% 99.59% 15.43MB 99.67% github.com/mkevac/converttest.BenchmarkPrint 0 0% 99.59% 15.47MB 99.93% runtime.goexit 0 0% 99.59% 15.42MB 99.66% testing.(*B).launch 0 0% 99.59% 15.43MB 99.67% testing.(*B).runN

5/12/2016 Profiling and optimizing Go programs
http://localhost:3999/gomeetup.slide#1 54/84
Pro�ling
(pprof) list BenchmarkPrint Total: 15.48MB ROUTINE ======================== github.com/mkevac/converttest.BenchmarkPrint in /home/marko/goprojects/src/github.com/mkevac/converttest/convert_test.go 15.41MB 15.43MB (flat, cum) 99.67% of Total . . 9:func BenchmarkPrint(b *testing.B) { . . 10: var buf bytes.Buffer . . 11: var s string = "test string" . . 12: for i := 0; i < b.N; i++ { . . 13: buf.Reset() 15.41MB 15.43MB 14: fmt.Fprintf(&buf, "string is: %s", s) . . 15: } . . 16:}

5/12/2016 Profiling and optimizing Go programs
http://localhost:3999/gomeetup.slide#1 55/84
Pro�ling
(pprof) list fmt.Fprintf Total: 15.48MB ROUTINE ======================== fmt.Fprintf in /home/marko/go/src/fmt/print.go 0 12.02kB (flat, cum) 0.076% of Total . . 175:// These routines end in 'f' and take a format string. . . 176: . . 177:// Fprintf formats according to a format specifier and writes to w. . . 178:// It returns the number of bytes written and any write error encountered. . . 179:func Fprintf(w io.Writer, format string, a ...interface{}) (n int, err error) { . 11.55kB 180: p := newPrinter() . 480B 181: p.doPrintf(format, a) . . 182: n, err = w.Write(p.buf) . . 183: p.free() . . 184: return . . 185:} . . 186:

5/12/2016 Profiling and optimizing Go programs
http://localhost:3999/gomeetup.slide#1 56/84
Disassembly
. . 466edb: CALL bytes.(*Buffer).Reset(SB)
. . 466ee0: LEAQ 0x98b6b(IP), AX
. . 466ee7: MOVQ AX, 0x70(SP)
. . 466eec: MOVQ $0xb, 0x78(SP)
. . 466ef5: MOVQ $0x0, 0x60(SP)
. . 466efe: MOVQ $0x0, 0x68(SP)
. . 466f07: LEAQ 0x70d92(IP), AX
. . 466f0e: MOVQ AX, 0(SP)
. . 466f12: LEAQ 0x70(SP), AX
. . 466f17: MOVQ AX, 0x8(SP)
. . 466f1c: MOVQ $0x0, 0x10(SP)
15.41MB 15.41MB 466f25: CALL runtime.convT2E(SB)
. . 466f2a: MOVQ 0x18(SP), AX
. . 466f2f: MOVQ 0x20(SP), CX
. . 466f34: MOVQ AX, 0x60(SP)
. . 466f39: MOVQ CX, 0x68(SP)
. . 466f3e: LEAQ 0x10b35b(IP), AX
. . 466f45: MOVQ AX, 0(SP)
. . 466f49: MOVQ 0x58(SP), AX
. . 466f4e: MOVQ AX, 0x8(SP)
. . 466f53: LEAQ 0x99046(IP), CX
. . 466f5a: MOVQ CX, 0x10(SP)

5/12/2016 Profiling and optimizing Go programs
http://localhost:3999/gomeetup.slide#1 57/84
. . 466f5f: MOVQ $0xd, 0x18(SP)
. . 466f68: LEAQ 0x60(SP), CX
. . 466f6d: MOVQ CX, 0x20(SP)
. . 466f72: MOVQ $0x1, 0x28(SP)
. . 466f7b: MOVQ $0x1, 0x30(SP)
. 12.02kB 466f84: CALL fmt.Fprintf(SB)

5/12/2016 Profiling and optimizing Go programs
http://localhost:3999/gomeetup.slide#1 58/84
fprintf
func Fprintf(w io.Writer, format string, a ...interface{}) (n int, err error)
interface{} same as void*... but it's not

5/12/2016 Profiling and optimizing Go programs
http://localhost:3999/gomeetup.slide#1 59/84
Go internal types
string, chan, func, slice, interface, etc.

5/12/2016 Profiling and optimizing Go programs
http://localhost:3999/gomeetup.slide#1 60/84
Empty interface
var s string = “marko” var a interface{} = &s
no allocation
var s string = “marko” var a interface{} = s
16 bytes allocation

5/12/2016 Profiling and optimizing Go programs
http://localhost:3999/gomeetup.slide#1 61/84
Empty interface

5/12/2016 Profiling and optimizing Go programs
http://localhost:3999/gomeetup.slide#1 62/84
Fix
package main import ( "bytes" "testing" ) func BenchmarkPrint(b *testing.B) { var buf bytes.Buffer var s string = "test string" for i := 0; i < b.N; i++ { buf.Reset() buf.WriteString("string is: ") buf.WriteString(s) } }
Benchmark?

5/12/2016 Profiling and optimizing Go programs
http://localhost:3999/gomeetup.slide#1 63/84
Benchmark
$ go test -bench=BenchmarkPrint -benchmem testing: warning: no tests to run BenchmarkPrint-8 50000000 27.5 ns/op 0 B/op 0 allocs/op PASS ok github.com/mkevac/converttest01 1.413s
0 allocations and 4x speed

5/12/2016 Profiling and optimizing Go programs
http://localhost:3999/gomeetup.slide#1 64/84
Implicit allocation
String and char * pretty much the same in C. But not in Go.
package main import ( "fmt" ) func main() { var array = []byte{'m', 'a', 'r', 'k', 'o'} if string(array) == "marko" { fmt.Println("equal") } }

5/12/2016 Profiling and optimizing Go programs
http://localhost:3999/gomeetup.slide#1 65/84
Implicit allocation
Always check your assumptions. Go runtime, Go compiler and Go tools are better with each day. Some optimization you read about in 2010 could be not needed. Or can be harmful.

5/12/2016 Profiling and optimizing Go programs
http://localhost:3999/gomeetup.slide#1 66/84
Example (again)
package main import ( "bytes" "testing" "unsafe" ) var s string func BenchmarkConvert(b *testing.B) { var buf bytes.Buffer var array = []byte{'m', 'a', 'r', 'k', 'o', 0} for i := 0; i < b.N; i++ { buf.Reset() s = string(array) buf.WriteString(s) } }

5/12/2016 Profiling and optimizing Go programs
http://localhost:3999/gomeetup.slide#1 67/84
Benchmark
$ go test -bench=. -benchmem testing: warning: no tests to run BenchmarkConvert-8 30000000 42.1 ns/op 8 B/op 1 allocs/op
5/12/2016 Profiling and optimizing Go programs
http://localhost:3999/gomeetup.slide#1 68/84
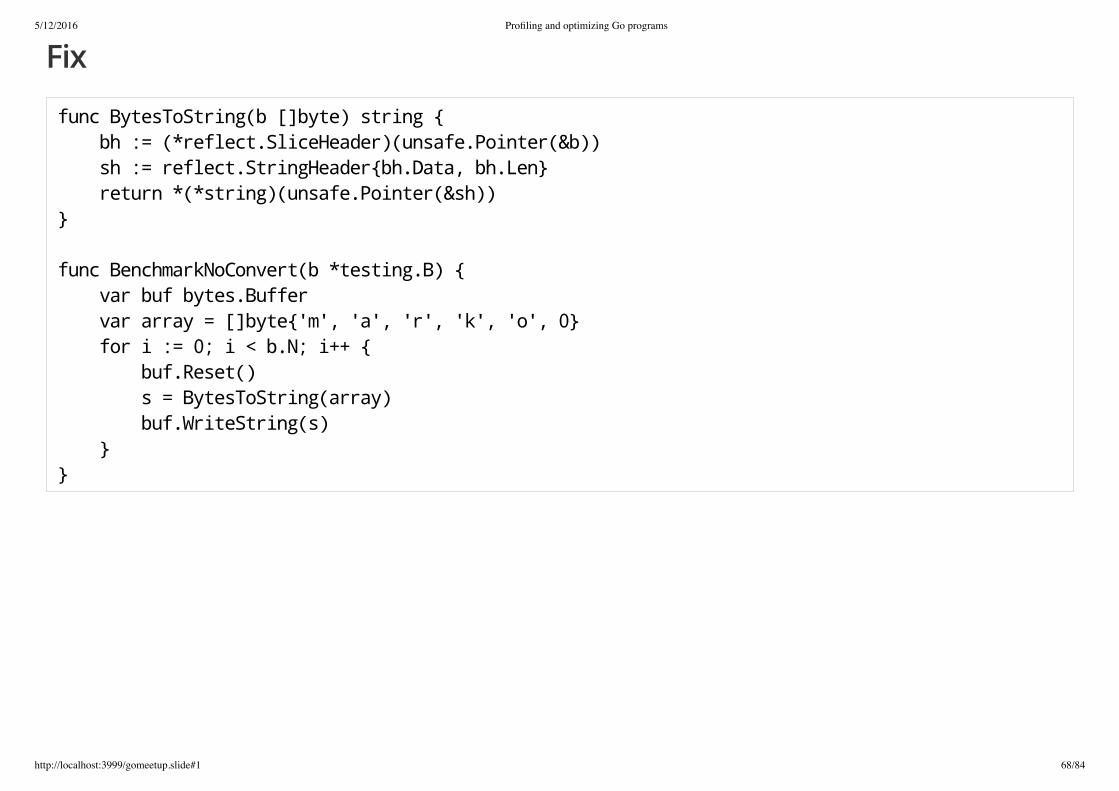
Fix
func BytesToString(b []byte) string { bh := (*reflect.SliceHeader)(unsafe.Pointer(&b)) sh := reflect.StringHeader{bh.Data, bh.Len} return *(*string)(unsafe.Pointer(&sh)) } func BenchmarkNoConvert(b *testing.B) { var buf bytes.Buffer var array = []byte{'m', 'a', 'r', 'k', 'o', 0} for i := 0; i < b.N; i++ { buf.Reset() s = BytesToString(array) buf.WriteString(s) } }

5/12/2016 Profiling and optimizing Go programs
http://localhost:3999/gomeetup.slide#1 69/84
Benchmark
$ go test -bench=. -benchmem testing: warning: no tests to run BenchmarkConvert-8 30000000 44.5 ns/op 8 B/op 1 allocs/op BenchmarkNoConvert-8 100000000 19.2 ns/op 0 B/op 0 allocs/op PASS ok github.com/mkevac/bytetostring 3.332s

5/12/2016 Profiling and optimizing Go programs
http://localhost:3999/gomeetup.slide#1 70/84
Tracing
Go runtime writes almost everything it does. Scheduling, channel operations, locks, thread creation, ...
Full list in runtime/trace.go
For visualization go tool trace uses same JS package that Chrome uses for page loadingvisualization.
Example.

5/12/2016 Profiling and optimizing Go programs
http://localhost:3999/gomeetup.slide#1 71/84
debugcharts
github.com/mkevac/debugcharts (http://github.com/mkevac/debugcharts)
runtime.ReadMemStats() once a second

5/12/2016 Profiling and optimizing Go programs
http://localhost:3999/gomeetup.slide#1 72/84
Example
import ( "net/http" _ "net/http/pprof" "time" _ "github.com/mkevac/debugcharts" ) func CPUHogger() { var acc uint64 t := time.Tick(2 * time.Second) for { select { case <-t: time.Sleep(50 * time.Millisecond) default: acc++ } } } func main() { go CPUHogger() go CPUHogger() http.ListenAndServe("0.0.0.0:8181", nil) }

5/12/2016 Profiling and optimizing Go programs
http://localhost:3999/gomeetup.slide#1 73/84
Tracing
$ curl http://localhost:8181/debug/pprof/trace?seconds=10 -o trace.out
Sometimes all you can visualize is 1-3 seconds.
$ go tool trace -http "0.0.0.0:8080" ./tracetest trace.out

5/12/2016 Profiling and optimizing Go programs
http://localhost:3999/gomeetup.slide#1 74/84
Tracing

5/12/2016 Profiling and optimizing Go programs
http://localhost:3999/gomeetup.slide#1 75/84
Tracing

5/12/2016 Profiling and optimizing Go programs
http://localhost:3999/gomeetup.slide#1 76/84
Tracing

5/12/2016 Profiling and optimizing Go programs
http://localhost:3999/gomeetup.slide#1 77/84
proc stop and proc start

5/12/2016 Profiling and optimizing Go programs
http://localhost:3999/gomeetup.slide#1 78/84
runtime.ReadMemStats()
180 // ReadMemStats populates m with memory allocator statistics. 181 func ReadMemStats(m *MemStats) { 182 stopTheWorld("read mem stats") 183 184 systemstack(func() { 185 readmemstats_m(m) 186 }) 187 188 startTheWorld() 189 }
Production? No!

5/12/2016 Profiling and optimizing Go programs
http://localhost:3999/gomeetup.slide#1 79/84
Conclusion
There are so much more

5/12/2016 Profiling and optimizing Go programs
http://localhost:3999/gomeetup.slide#1 80/84
Conlusion
CPU pro�ler
Memory pro�ler
All allocations tracing
Escape analysis
Lock/Contention pro�ler
Scheduler tracing
Tracing
GC tracing
Real time memory statistics
System pro�lers like perf and systemtap.
But no tool will replace deep understanding of how your program works from start to�nish.

5/12/2016 Profiling and optimizing Go programs
http://localhost:3999/gomeetup.slide#1 81/84
I hope that today's crash course was helpful.

5/12/2016 Profiling and optimizing Go programs
http://localhost:3999/gomeetup.slide#1 82/84
Stay curious

5/12/2016 Profiling and optimizing Go programs
http://localhost:3999/gomeetup.slide#1 83/84
Thank you
Marko KevacSoftware Engineer, [email protected] (mailto:[email protected])
@mkevac (http://twitter.com/mkevac)

5/12/2016 Profiling and optimizing Go programs
http://localhost:3999/gomeetup.slide#1 84/84