Embed Size (px)
DESCRIPTION
Citation preview

Performance Methodology
@ Salesforce Tina Luo(Performance Engineer)

Why Do We Care Performance?
User Experience
Decrease the hardware cost
More customer can be served
AGENDA
Performance Team Overview
Key Performance Metrics
How Do We Test Performance?
Tools
Q&A

Performance Team Overview
Dedicated Large Performance Team
Application
UI&Mobile
Platform
Core
Automation&
Tool
Perf
Infrastructure
Key Performance Metrics
Average Response Time
Throughput
CPU Utilization
Memory Utilization
Memory Allocated
GC Count
Db Buffer Get
Db CPU Utilization

How Do We Test Performance?
Proactive
• Feature Test
• Regression Test
Passive
• Production Analysis

Feature Test
Requirement
• Target Load
• Target Performance
• Performance Overhead
• Comparison with Old Feature
Performance Test
• Test Data Shape
• Load Test
• Capture and analyze the performance metrics

Regression Test
Often Come From Feature Test
Regularly Monitor Performance Of Key Features
• Run nightly or weekly
Fully Automated!
• Internal Performance Test Framework
Creation of Performance Workload
• Data Shape
• Estimate load from production
• Test Coverage

How to Identify Cause of Regression?
CPU, Response Time: Yourkit
Memory Allocation: GC log, Heapaudit, Heapdump,
VisualVM, Yourkit
DB Buffer get: Awr Diff Tool, SQL tracing, Explain Plan

Production Analysis
Production Performance Monitor Tools
• Dashboard
Splunk
• 1. What features do they use
• 2. How the features are used
• 3. How do they perform in production

Some Tools Used
Jmeter
• Load Generator
• Integrated with Internal performance test framework
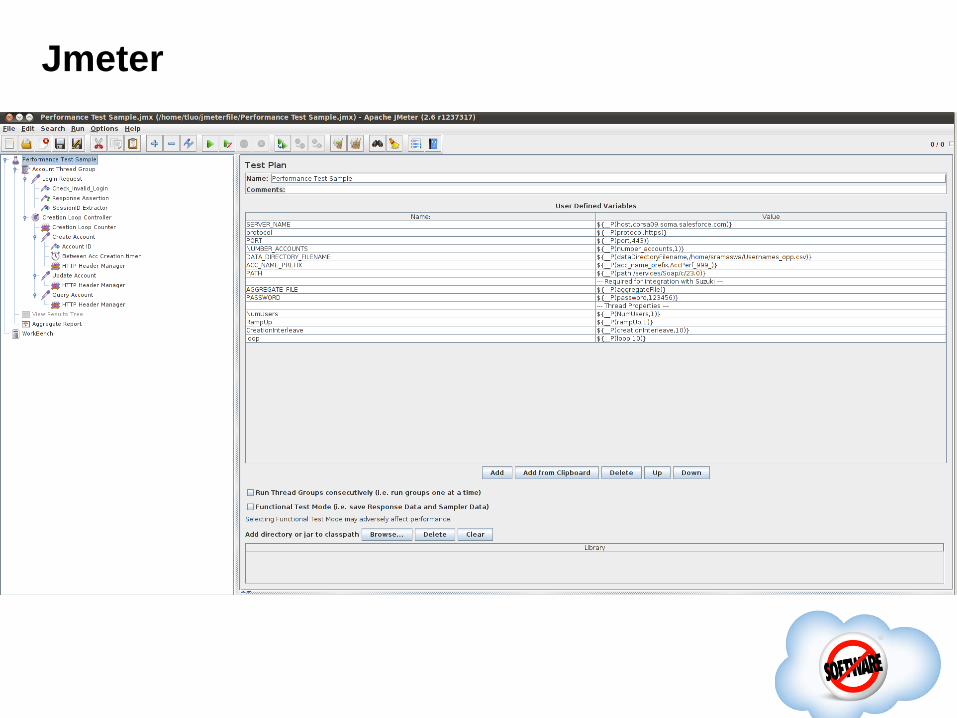
Jmeter

Splunk
Log analyzing tool
Search, monitor, and analyze machine-generated big
data
Production analysis
Internal performance run log analyzer
Data Shape

Splunk

Yourkit
Java Profiler
• CPU Profilling
• Memory Profilling
Help Find CPU Hotspot, cause of the regression,
memory leak.
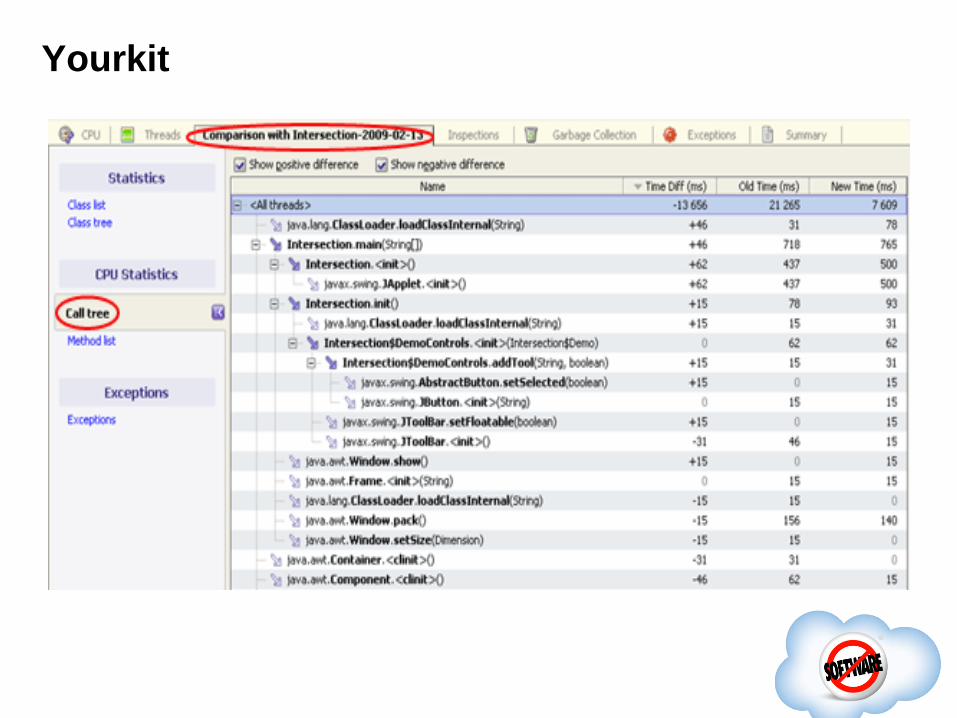
Yourkit
HeapAudit
Java Memory Profiller
Open source project by Foursquare
Java agent built on top of ASM
Three modes: Static, Dynamic, Hybrid
Only collect allocation of objects you are interested in
https://github.com/foursquare/heapaudit

Comparison with Yourkit
Yourkit HeapAudit
pros Provides complete
understanding of memory
allocations mapped to
callstacks
Provides enough information to
understand our allocation
pattern,
Small size of result file,
Automated,
Low overhead
Cons
Manual analysis
Large Size of result file
Pretty slow
Don’t have stack trace
How HeapAudit detect memory regression (Demo)
Diff Results are sorted in two ways: Objects Allocation
and Classes Allocation
Object Allocation
• Most different object will be shown in the top.
• Under the object, a list of classes which allocate that object will
be shown in the order.
Class Allocation
• The most different class will be shown in the top
• Under the class, a list of methods of that class will be shown in
order
• Under the method, a lot of objects will be shown in order.

Conclusion
Log is your best friend
Automate your work
Software quality is as important as software quantity

Thanks!

Question?

特别感谢 QCon上海合作伙伴