Embed Size (px)
Citation preview
FIRSTQUARTER 2016April 21st, 2016
Tele2 AB
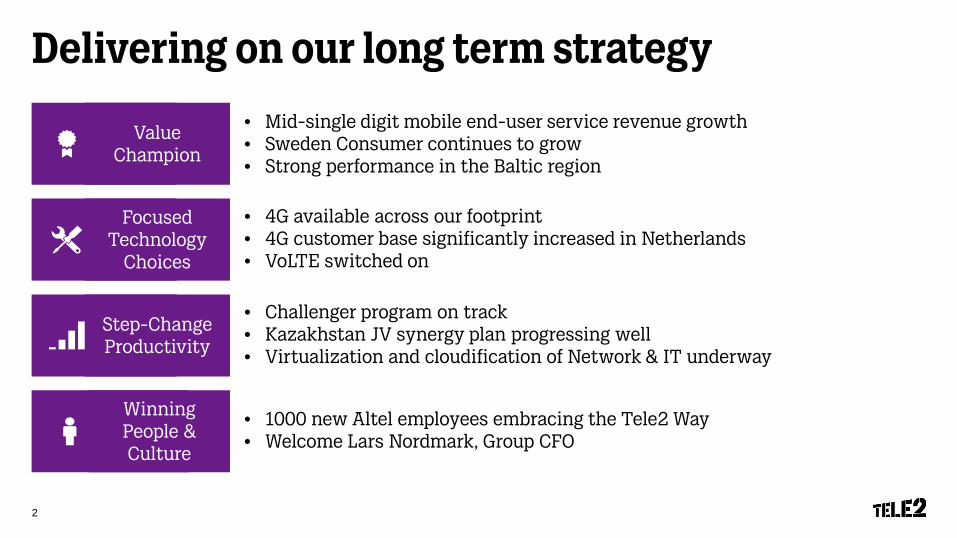
Delivering on our long term strategy
Winning People & Culture
Value Champion
Step-Change Productivity
Focused Technology
Choices
• 4G available across our footprint• 4G customer base significantly increased in Netherlands• VoLTE switched on
• Mid-single digit mobile end-user service revenue growth• Sweden Consumer continues to grow• Strong performance in the Baltic region
• Challenger program on track • Kazakhstan JV synergy plan progressing well• Virtualization and cloudification of Network & IT underway
• 1000 new Altel employees embracing the Tele2 Way• Welcome Lars Nordmark, Group CFO
2
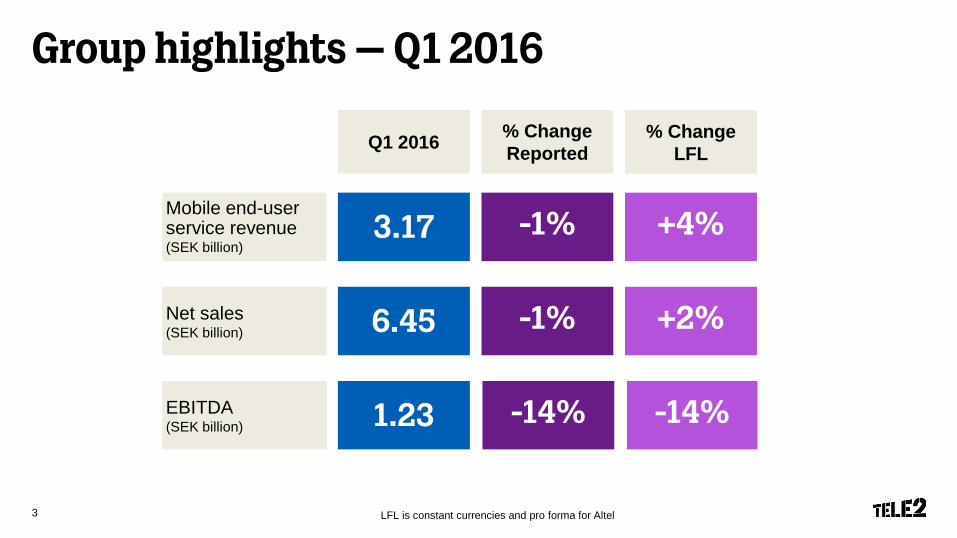
Group highlights – Q1 2016
Q1 2016 % Change Reported
LFL is constant currencies and pro forma for Altel
% ChangeLFL
Mobile end-user service revenue(SEK billion)
3.17 -1% +4%
EBITDA(SEK billion) 1.23 -14% -14%
Net sales(SEK billion) 6.45 -1% +2%
3
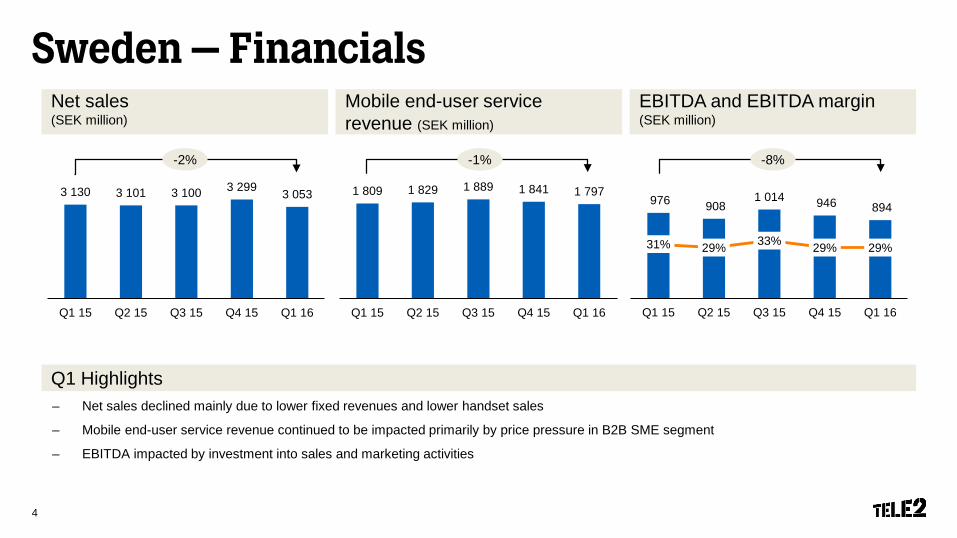
Sweden – FinancialsNet sales(SEK million)
Mobile end-user servicerevenue (SEK million)
– Net sales declined mainly due to lower fixed revenues and lower handset sales
– Mobile end-user service revenue continued to be impacted primarily by price pressure in B2B SME segment
– EBITDA impacted by investment into sales and marketing activities
Q1 Highlights
EBITDA and EBITDA margin(SEK million)
1 809 1 829 1 889 1 841 1 797
Q1 15 Q2 15 Q3 15 Q4 15 Q1 160
200
400
600
800
1,000
1,200
1,400
1,600
1,800
2,000
976 9081 014 946 894
31% 29% 33% 29% 29%
0%
10%
20%
30%
40%
50%
60%
Q1 15 Q2 15 Q3 15 Q4 15 Q1 160
200
400
600
800
1,000
1,2003 130 3 101 3 100 3 299 3 053
Q1 15 Q2 15 Q3 15 Q4 15 Q1 160
500
1,000
1,500
2,000
2,500
3,000
3,500
-1%-2% -8%
4
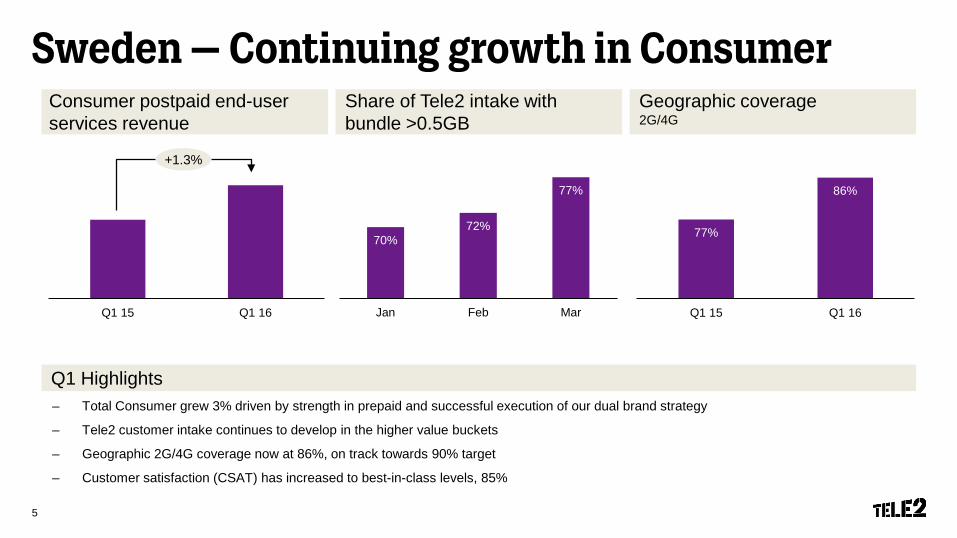
Sweden – Continuing growth in ConsumerConsumer postpaid end-user services revenue
Share of Tele2 intake with bundle >0.5GB
– Total Consumer grew 3% driven by strength in prepaid and successful execution of our dual brand strategy
– Tele2 customer intake continues to develop in the higher value buckets
– Geographic 2G/4G coverage now at 86%, on track towards 90% target
– Customer satisfaction (CSAT) has increased to best-in-class levels, 85%
Q1 Highlights
Geographic coverage2G/4G
Q1 15 Q1 16
70%72%
77%
Jan Feb Mar
+1.3%
77%
86%
Q1 15 Q1 16
5
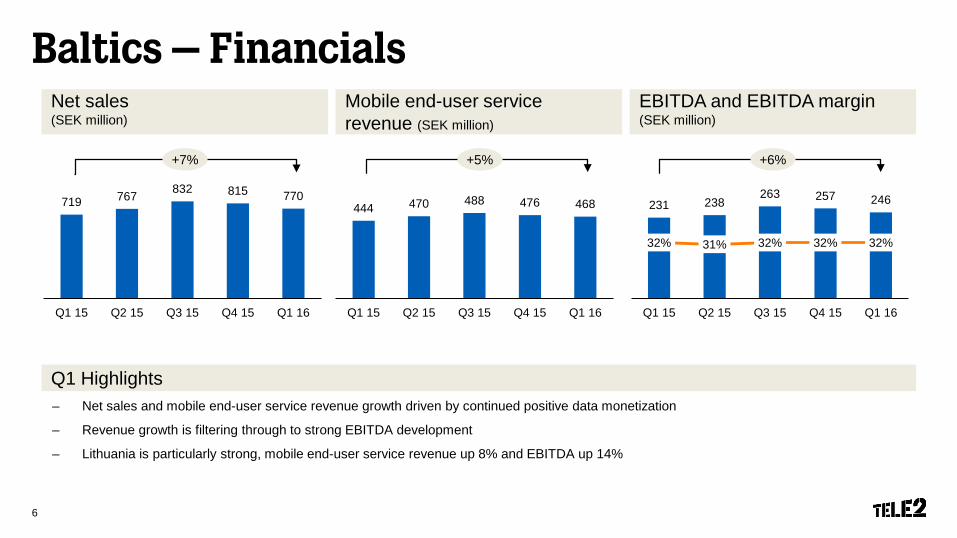
Baltics – Financials
Q1 Highlights
Net sales(SEK million)
EBITDA and EBITDA margin(SEK million)
Mobile end-user service revenue (SEK million)
444 470 488 476 468
Q1 15 Q2 15 Q3 15 Q4 15 Q1 160
100
200
300
400
500
600
231 238263 257 246
32% 31% 32% 32% 32%
0%
10%
20%
30%
40%
50%
60%
Q1 15 Q2 15 Q3 15 Q4 15 Q1 160
50
100
150
200
250
300
719 767 832 815 770
Q1 15 Q2 15 Q3 15 Q4 15 Q1 160
100
200
300
400
500
600
700
800
900
– Net sales and mobile end-user service revenue growth driven by continued positive data monetization
– Revenue growth is filtering through to strong EBITDA development
– Lithuania is particularly strong, mobile end-user service revenue up 8% and EBITDA up 14%
+5%+7% +6%
6
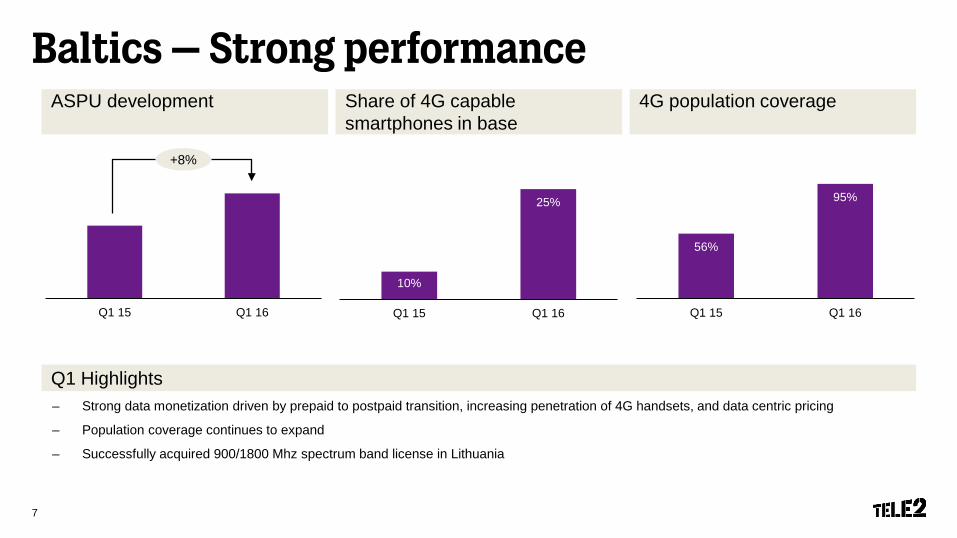
Baltics – Strong performanceASPU development Share of 4G capable
smartphones in base
Q1 Highlights
4G population coverage
– Strong data monetization driven by prepaid to postpaid transition, increasing penetration of 4G handsets, and data centric pricing
– Population coverage continues to expand
– Successfully acquired 900/1800 Mhz spectrum band license in Lithuania.
56%
95%
Q1 15 Q1 16Q1 15 Q1 16
10%
25%
Q1 15 Q1 16
+8%
7
Netherlands – Financials
Q1 Highlights– Mobile end-user service revenue growth reflects improved intake building through the quarter
– Momentum was stronger in March after the launch of the iPhone and new SIM-only propositions
– EBITDA impacted as expected by costs associated with mobile growth and network rollout partly offset by property one-off (+SEK 73M)
Net sales(SEK million)
EBITDA (SEK million)
Mobile end-user service revenue (SEK million)
305 332 364403
322
Q1 15 Q2 15 Q3 15 Q4 15 Q1 160
50
100
150
200
250
300
350
400
450
141 147122
35
-31
Q1 15 Q2 15 Q3 15 Q4 15 Q1 16
-35
-15
5
25
45
65
85
105
125
145
165
1 402 1 390 1 440 1 512 1 441
Q1 15 Q2 15 Q3 15 Q4 15 Q1 160
200
400
600
800
1,000
1,200
1,400
1,600
+6%+3% -122%
8
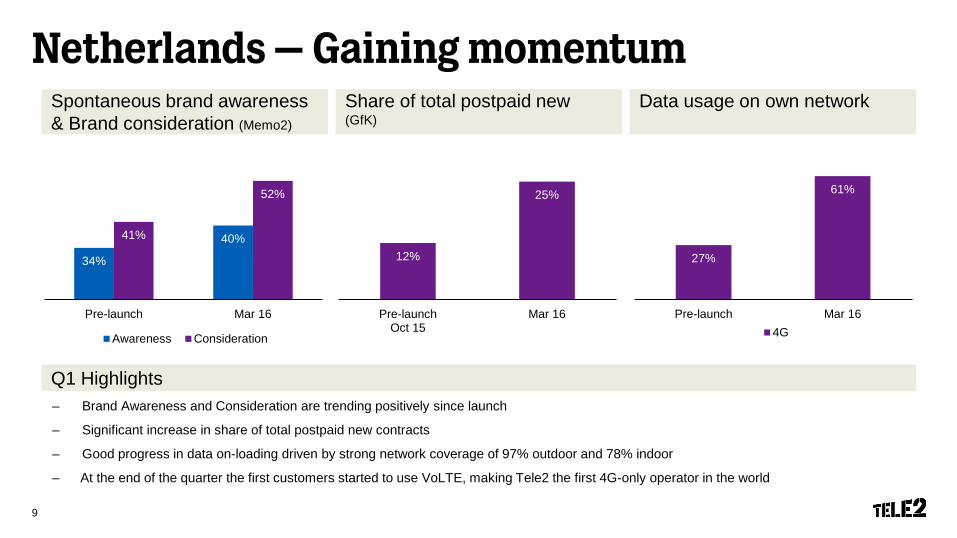
Netherlands – Gaining momentumSpontaneous brand awareness & Brand consideration (Memo2)
Share of total postpaid new(GfK)
Data usage on own network
Q1 Highlights– Brand Awareness and Consideration are trending positively since launch
– Significant increase in share of total postpaid new contracts
– Good progress in data on-loading driven by strong network coverage of 97% outdoor and 78% indoor
– At the end of the quarter the first customers started to use VoLTE, making Tele2 the first 4G-only operator in the world
27%
61%
Pre-launch Mar 164G
34%
40%41%
52%
Pre-launch Mar 16
Awareness Consideration
12%
25%
Pre-launchOct 15
Mar 16
9
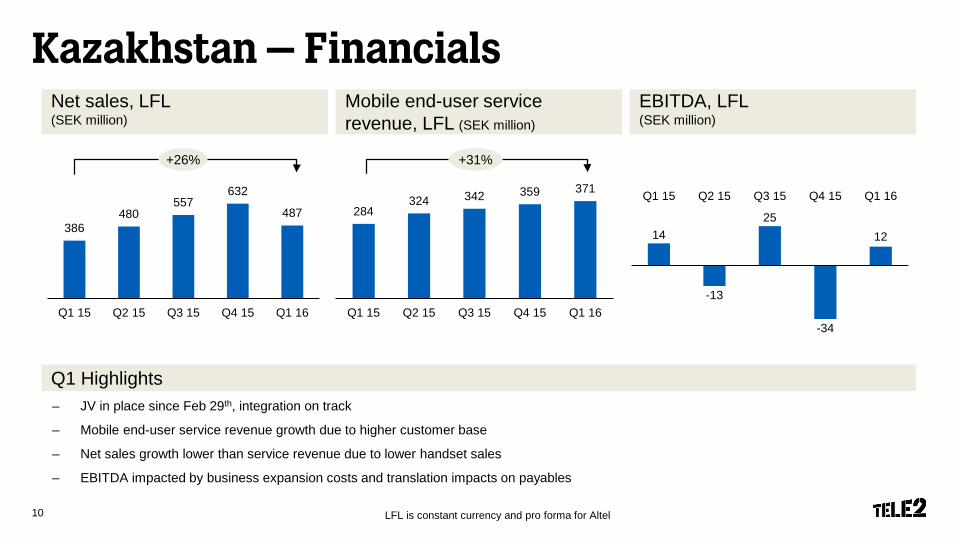
– JV in place since Feb 29th, integration on track
– Mobile end-user service revenue growth due to higher customer base
– Net sales growth lower than service revenue due to lower handset sales
– EBITDA impacted by business expansion costs and translation impacts on payables
Kazakhstan – Financials
Q1 Highlights
LFL is constant currency and pro forma for Altel
Net sales, LFL (SEK million)
EBITDA, LFL (SEK million)
Mobile end-user service revenue, LFL (SEK million)
284324 342 359 371
Q1 15 Q2 15 Q3 15 Q4 15 Q1 160
50
100
150
200
250
300
350
400
14
-13
25
-34
12
Q1 15 Q2 15 Q3 15 Q4 15 Q1 16
-35
-25
-15
-5
5
15
25
35
386480
557632
487
Q1 15 Q2 15 Q3 15 Q4 15 Q1 160
100
200
300
400
500
600
700
+31%+26%
10
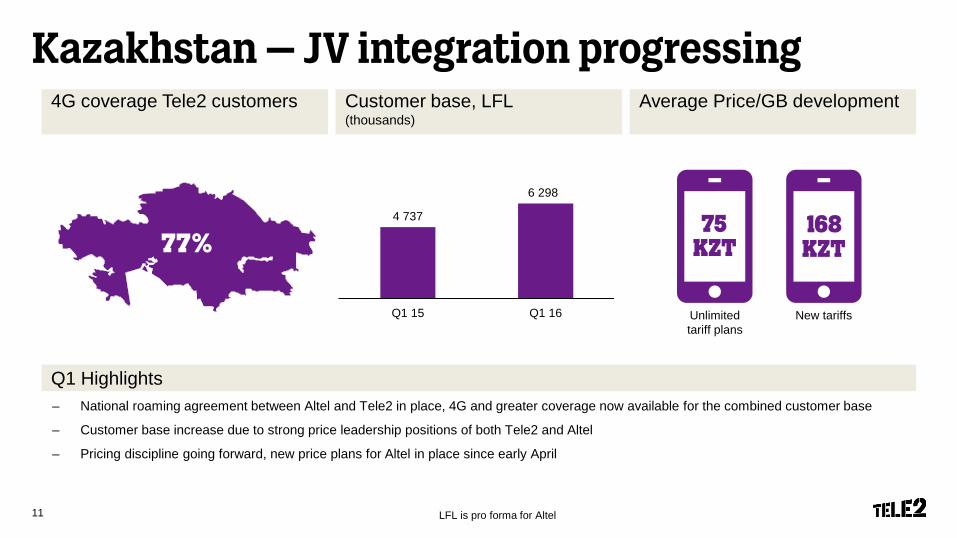
Kazakhstan – JV integration progressingCustomer base, LFL(thousands)
Average Price/GB development
Q1 Highlights
4G coverage Tele2 customers
LFL is pro forma for Altel
– National roaming agreement between Altel and Tele2 in place, 4G and greater coverage now available for the combined customer base
– Customer base increase due to strong price leadership positions of both Tele2 and Altel
– Pricing discipline going forward, new price plans for Altel in place since early April
4 737
6 298
Q1 15 Q1 16
77%
Unlimitedtariff plans
New tariffs
75 168KZT KZT
11
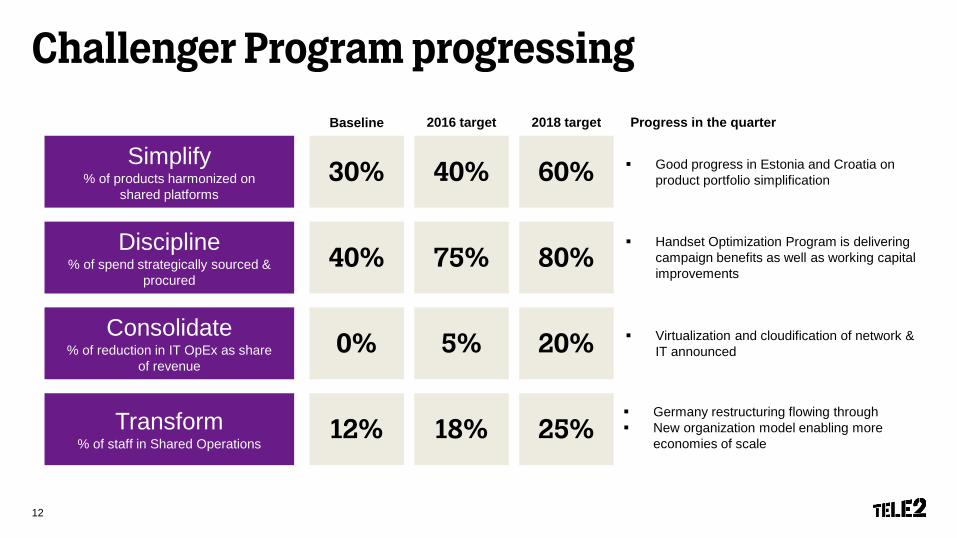
Challenger Program progressing
Simplify% of products harmonized on
shared platforms
Discipline% of spend strategically sourced &
procured
Consolidate% of reduction in IT OpEx as share
of revenue
Transform% of staff in Shared Operations
2016 target 2018 targetBaseline
30% 40% 60%
40% 75% 80%
0% 5% 20%
12% 18% 25%
Progress in the quarter
Handset Optimization Program is delivering campaign benefits as well as working capital improvements
Virtualization and cloudification of network & IT announced
Germany restructuring flowing through New organization model enabling more
economies of scale
Good progress in Estonia and Croatia on product portfolio simplification
12

Financial Overview
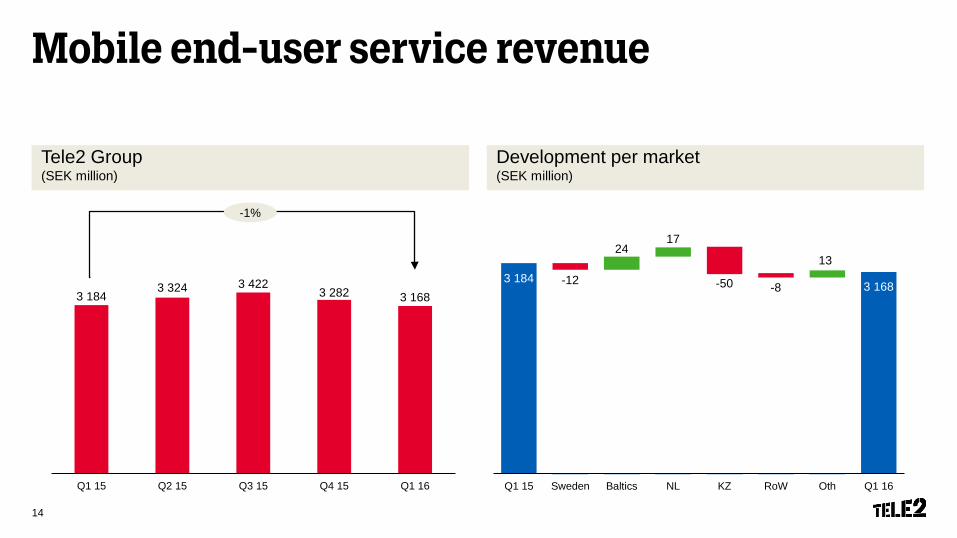
3 1843 168-12
2417
-50 -8
Q1 15 Sweden Baltics NL KZ RoW Oth Q1 16
Mobile end-user service revenue
Tele2 Group(SEK million)
3 1843 324 3 422
3 282 3 168
Q1 15 Q2 15 Q3 15 Q4 15 Q1 16
-1%
Development per market(SEK million)
13
14
1 428
1 226
-82
15
-1726 32
-1
Q1 15 Sweden Baltics NL KZ RoW Oth Q1 16
EBITDA
Tele2 Group(SEK million)
1 428 1 393
1 599
1 337
1 226
21.9% 21.1% 23.5%19.3% 19.0%
600
800
1000
1200
1400
1600
1800
Q1 15 Q2 15 Q3 15 Q4 15 Q1 160.00%
10.00%
20.00%
30.00%
40.00%
50.00%
60.00%
70.00%
80.00%
90.00%
EBITDA margin
-14%
Development per market(SEK million)
15
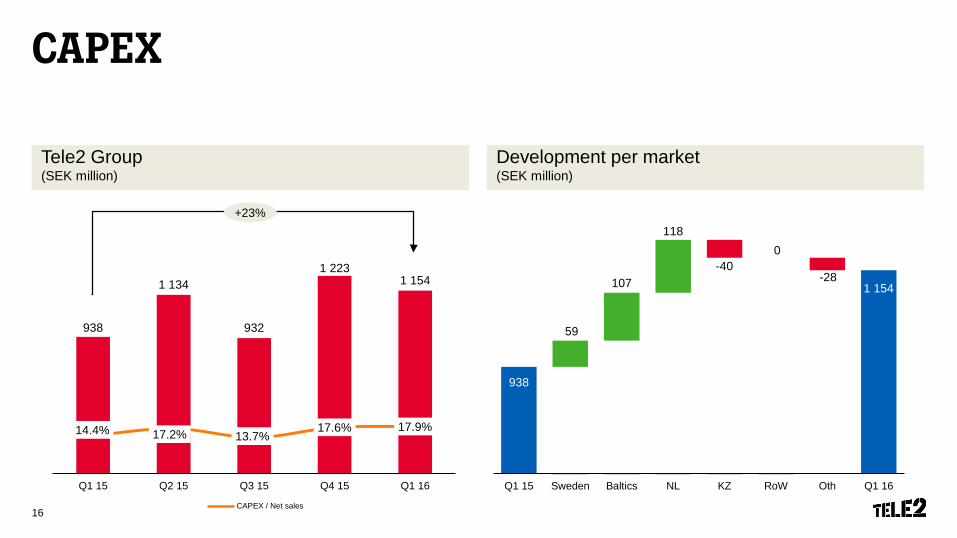
CAPEX
Tele2 Group(SEK million)
938
1 134
932
1 2231 154
14.4% 17.2% 13.7%17.6% 17.9%
300
500
700
900
1,100
1,300
Q1 15 Q2 15 Q3 15 Q4 15 Q1 160.00%
10.00%
20.00%
30.00%
40.00%
50.00%
60.00%
70.00%
80.00%
90.00%
CAPEX / Net sales
+23%
Development per market(SEK million)
938
1 154
59
107
118
-400
-28
Q1 15 Sweden Baltics NL KZ RoW Oth Q1 16
16
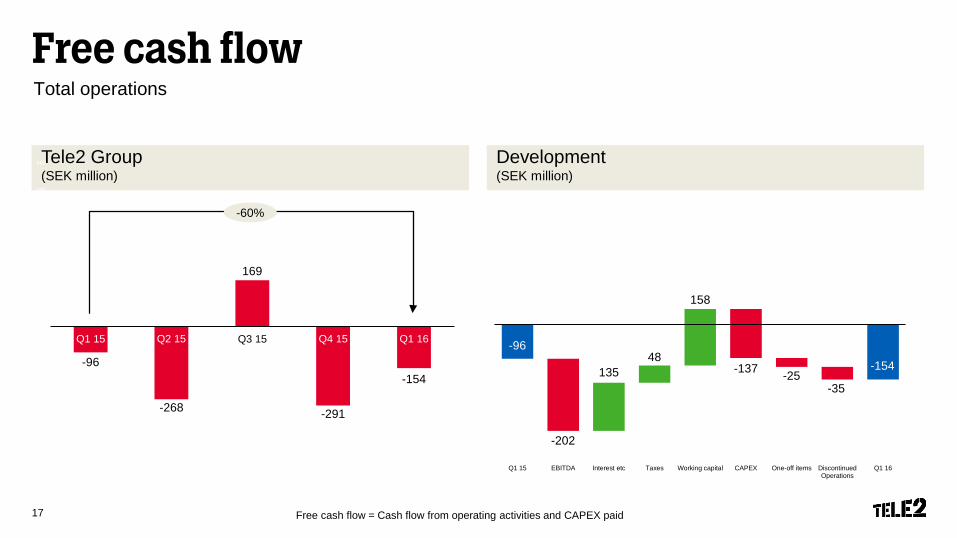
Free cash flowTotal operations
Tele2 Group(SEK million)
Development (SEK million)
Free cash flow = Cash flow from operating activities and CAPEX paid
-96
-268
169
-291
-154
-400
-300
-200
-100
0
100
200
300
400
500
600
Q1 15 Q2 15 Q3 15 Q4 15 Q1 16
-35
-96
-202
13548
158
-137 -25-154
Q1 15 EBITDA Interest etc Taxes Working capital CAPEX One-off items DiscontinuedOperations
Q1 16
-60%
17
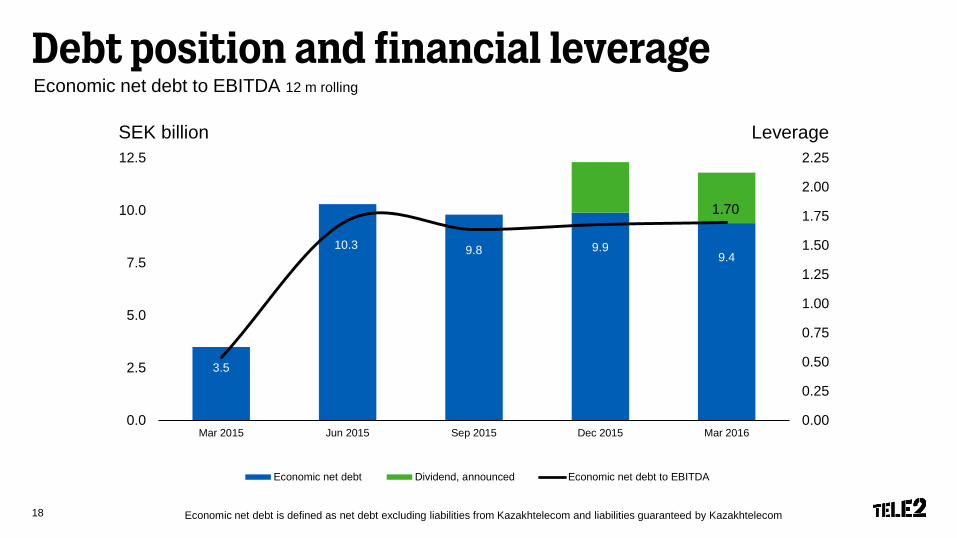
Debt position and financial leverageEconomic net debt to EBITDA 12 m rolling
3.5
10.3 9.8 9.99.4
0.00
0.25
0.50
0.75
1.00
1.25
1.50
1.75
2.00
2.25
0.0
2.5
5.0
7.5
10.0
12.5
Mar 2015 Jun 2015 Sep 2015 Dec 2015 Mar 2016
Economic net debt Dividend, announced Economic net debt to EBITDA
Economic net debt is defined as net debt excluding liabilities from Kazakhtelecom and liabilities guaranteed by Kazakhtelecom
1.70
LeverageSEK billion
18
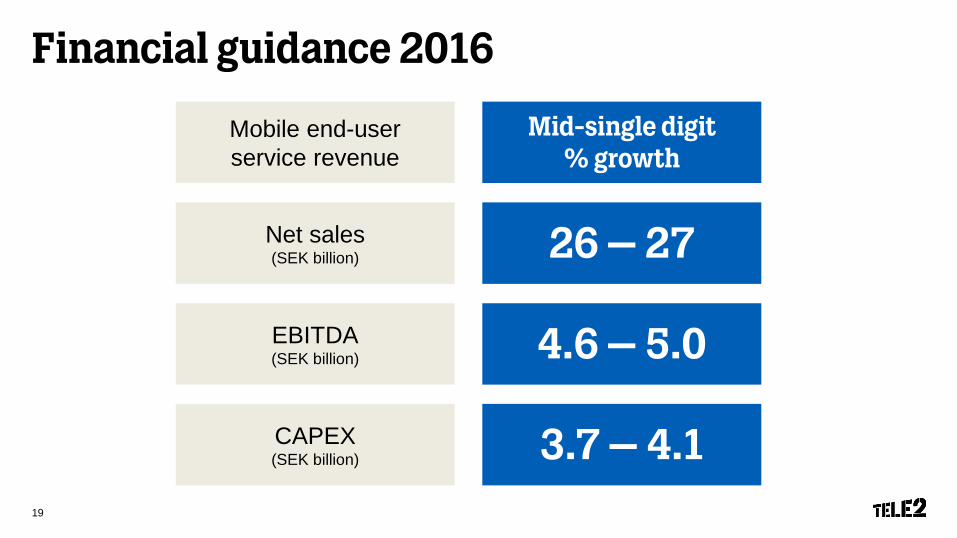
Financial guidance 2016
Net sales(SEK billion)
EBITDA(SEK billion)
26 – 27
4.6 – 5.0
CAPEX(SEK billion) 3.7 – 4.1
Mobile end-user service revenue
Mid-single digit % growth
19
Summary
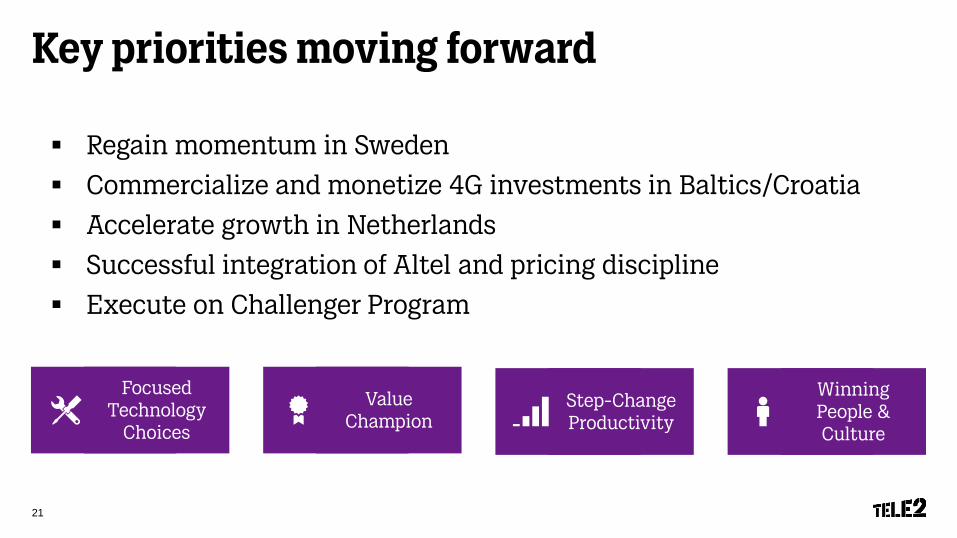
Key priorities moving forward
Regain momentum in Sweden
Commercialize and monetize 4G investments in Baltics/Croatia
Accelerate growth in Netherlands
Successful integration of Altel and pricing discipline
Execute on Challenger Program
Winning People & Culture
Value Champion
Step-Change Productivity
Focused Technology
Choices
21
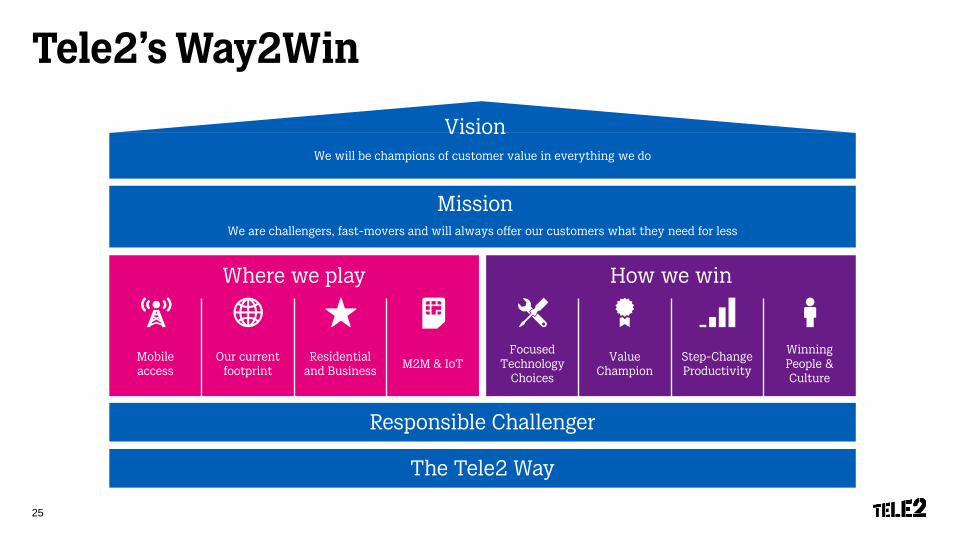
Tele2’s Way2Win
The Tele2 Way
We are challengers, fast-movers and will always offer our customers what they need for less
We will be champions of customer value in everything we do
How we win
Focused Technology
Choices
Value Champion
Step-Change Productivity
Winning People & Culture
Vision
Mission
Where we play
Mobile access
Our current footprint
Residential and Business
M2M & IoT
Responsible Challenger
25
THEEND