Embed Size (px)
DESCRIPTION
This technical white paper – jointly produced by SAP and IBM – describes a project to test the performance of the SAP® Convergent Invoicing package. This software is used in various service industries, such as telecommunications, electronic toll collection, transportation, postal services, and Internet-based retail business. The test scenario was built around the requirements of a large telecommunications company...
Citation preview

Technical White Paper
SAP and IBM Demonstrate Capability of Handling High Billing Volume in a Telecommunications ScenarioTesting Performance and Scalability of the SAP® Convergent Invoicing Package with IBM Workload-Optimized Solutions and IBM Easy Tier
Participating Groups
•SAP Value Prototyping, Center of
Excellence, SAP Germany
•IBM SAP International Competence
Center, IBM Germany
•IBM Research and Development,
IBM R & D Germany

2
SAP and IBM Demonstrate Capability of Handling High Billing Volume in a Telecommunications Scenario
Table of Contents
5 Huge Billing Volumes:
A Challenge to the
Telecommunications Industry
5 Scope of the Proof of Concept
6 System Maintenance Not in
Project Scope
6 Component Overview of SAP
Landscape Used in Project
6 SAP Convergent Invoicing,
Version 6
7 IBM DB2 LUW 9.7 Optimized
for SAP Software
8 IBM eX5 Enterprise Systems
9 IBM Storwize V7000
10 IBM Easy Tier
11 Design of the SAP Landscape
11 SAP System Setup
12 DB2 Best Practices
25 Scenario Description
26 Scenario Execution
28 Results and Achievements
31 Best Practices and
Conclusions
48 Resources

3
SAP and IBM Demonstrate Capability of Handling High Billing Volume in a Telecommunications Scenario
Telecommunications Scenario
The company has 50 million active
customers, each placing 30 calls a
day, producing a total of 1.5 billion
billable items (BITs) per day, where
each BIT represents one phone call,
one SMS, or one other unit of service
(for example, a ringtone or music
download).
Executive Summary
This technical white paper – jointly pro-
duced by SAP and IBM – describes a
project to test the performance of the
SAP® Convergent Invoicing package.
This software is used in various service
industries, such as telecommunications,
electronic toll collection, transportation,
postal services, and Internet-based
retail business. The test scenario was
built around the requirements of a large
telecommunications company.
The requirements of the company in the
scenario helped establish the following
key performance indicators (KPIs) for
the test. The following tasks had to be
accomplished in less than 18 hours:
•Upload of 1.5 billion BITs, with a mini-
mum of 100,000 BITs uploaded per
second
•Billing of 2.5 million business partners,
which includes the aggregation of
2.275 billion BITs
•Invoicing of 2.5 million business part-
ners (customers)
The performance project demonstrated
that all KPIs could be met by using the
following hardware: IBM System x X5
server, IBM Storwize V7000, IBM DB2,
and SUSE Linux Enterprise Server.

SAP and IBM Demonstrate Capability of Handling High Billing Volume in a Telecommunications Scenario
4
This technical white paper describes the:
•Data environment chosen for billing
and invoicing and the scenarios tested
•Underlying IT infrastructure, SAP sys-
tem setup, and design reasons
•Database approach, design, and tun-
ing recommendations as implemented
on the IBM DB2 database
Project Team
Dilip Radhakrishnan SAP Project manager
Peter Jäger SAP Project coach SAP
Markus Fehling IBM Project coach IBM
Storage specialist
Gerrit Graefe SAP Development architect, order to cash
Michael Stafenk SAP Value prototyping, DB2 expert
Ingo Dahm SAP Value prototyping, Linux expert
Torsten Fellhauer SAP Value prototyping, network expert
Elke Hartmann-Bakan IBM DB2 specialist
Holger Hellmuth IBM DB2 specialist
Jörn Klauke IBM DB2 specialist
Thomas Rech IBM DB2 specialist
Maik Gasterstädt IBM Storage specialist
Summary of Results
IBM Easy Tier1 was able to shorten
the processing time for all three
tasks (upload, billing, and invoicing)
from 23 hours to 16.5 hours, a reduc-
tion of over 30%. In addition, by using
storage virtualization, IBM Storwize
V7000 eliminated any storage perfor-
mance bottlenecks.
1 IBM Easy Tier is a software function within the IBM storage systems, designed to increase the IOPS performance. For more information, refer to the section about IBM Easy Tier on p. 10.

SAP and IBM Demonstrate Capability of Handling High Billing Volume in a Telecommunications Scenario
5
Huge Billing Volumes:
A Challenge to the
Telecommunications Industry
Telecommunications companies face
the challenge of keeping detailed
information about millions of daily calls
and SMS messages – for both report-
ing and billing purposes. For example,
companies might need to recalculate
offered and applied tariffs based on the
buying behavior and usage pattern of
consumers.2 Large telecommunications
companies therefore frequently have to
aggregate billions of BITs every month
when they bill their customers. This high
transaction volume applies not only to
the telecommunications industry but
also to others such as:
•Web shops with customers download-
ing millions of music titles per day
•Postal services managing millions of
letters and packages
•Toll collection agencies tracking thou-
sands of cars passing each day along
hundreds of roads
•Transportation companies shipping
tens of thousands of containers
across the world
To process billions of records or trans-
actions per day, enterprises need a
high-performance IT infrastructure
that allows batch jobs to run quickly.
Consequently, companies are looking
to exploit technologies that promise to
significantly reduce the runtime of batch
jobs.
IBM Easy Tier can play an important
role here. The goal of this performance
project was to prove that IBM Easy Tier
can help reduce the overall batch
runtime.
Scope of the Proof of Concept
The main objective of the project was to
prove the capability of SAP Convergent
Invoicing to handle large data volumes
using an IBM enterprise-class, Intel
processor–based architecture, and to
demonstrate how much the customer
might benefit from intelligent storage
system architectures, such as IBM Easy
Tier. Accordingly, the project chose the
kind of data volume a large telecommu-
nications company might be expected
to handle:
•50 million business partners (custom-
ers) in the system
•30 billable items per business partner
per day, where each BIT represents
one call or one SMS message
•2.5 million bills per day
The project operated under the
assumption that all business partners
(customers) would receive a monthly
bill and that the telecommunications
company performs billing runs only on
weekdays in order to keep weekend
system load low to allow for mainte-
nance. This assumption lead to the
project team using the following data
volumes:
•Upload of 1.5 billion BITs per day
•Billing of 2.5 billion BITs per day,
distributed evenly over 2.5 million busi-
ness partners (customers)
•Invoicing of 2.5 million bills per day
2 This happens, for example, with mobile phone customers when the first free phone calls (or SMS messages) are not managed directly by the telecommunications company’s own network. The company will receive the billable items from roaming partners with some delay. The order of incoming BITs might not be in the same order as the calls were made. In this case a recalculation is necessary to determine which call is free and which is not. Depending on the result, the price per call might need to be recalculated as well..
SAP and IBM Demonstrate Capability of Handling High Billing Volume in a Telecommunications Scenario
6
These three tasks had to be processed
in less than 18 hours, allowing time for
further steps in the order-to-cash sce-
nario, such as payment, dunning runs,
or data extractions from the business
warehouse.
The proof of concept focused on
performance tuning of the upload
and billing part, because these parts
consume more than 90% of the entire
batch runtime. To make this test as real-
istic as possible, the project team tuned
performance with an SAP production
system in mind. This meant that every
tuning setting was verified as if it were
applicable to a real SAP production
environment. In other words, there was
no artificial benchmarking.
System Maintenance Not in
Project Scope
The project scope did not include system
maintenance, such as SAP software
upgrades or integrated backups, and
the paper does not cover this aspect. In
addition, the concepts of high availability
(HA) and disaster recovery (DR) are not
treated.
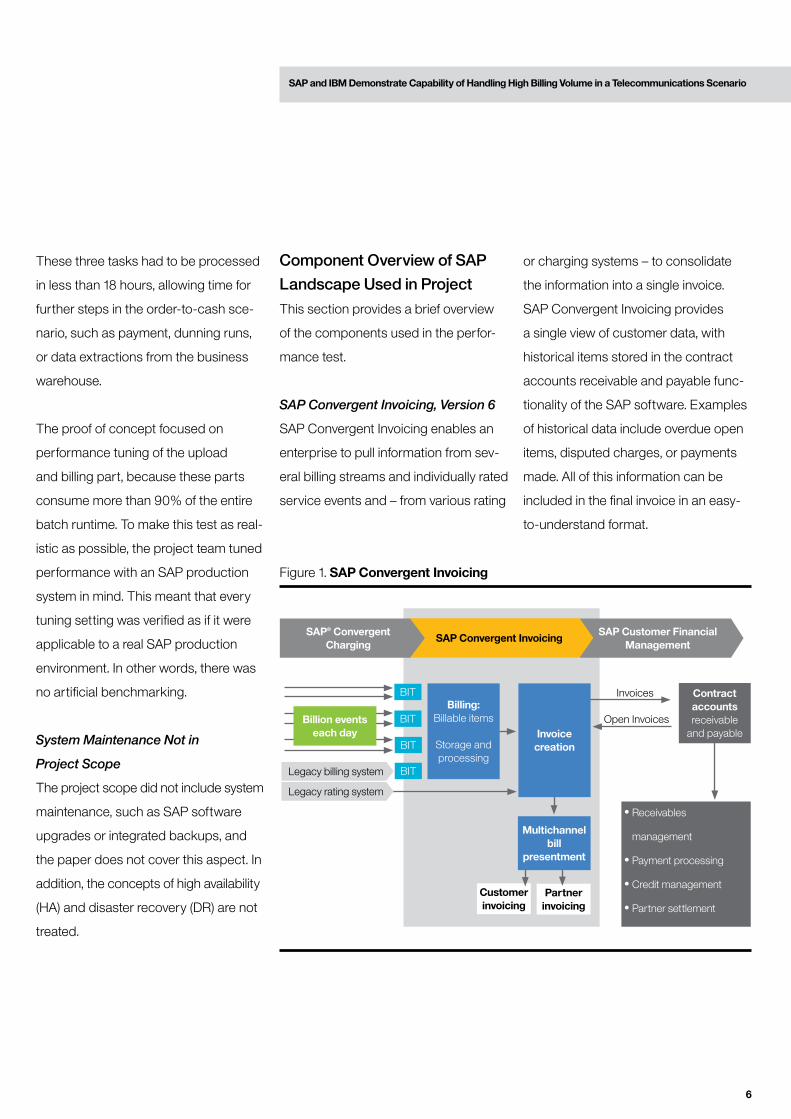
Component Overview of SAP
Landscape Used in Project
This section provides a brief overview
of the components used in the perfor-
mance test.
SAP Convergent Invoicing, Version 6
SAP Convergent Invoicing enables an
enterprise to pull information from sev-
eral billing streams and individually rated
service events and – from various rating
or charging systems – to consolidate
the information into a single invoice.
SAP Convergent Invoicing provides
a single view of customer data, with
historical items stored in the contract
accounts receivable and payable func-
tionality of the SAP software. Examples
of historical data include overdue open
items, disputed charges, or payments
made. All of this information can be
included in the final invoice in an easy-
to-understand format.
Figure 1. SAP Convergent Invoicing
Billing:Billable items
Storage andprocessing
BIT
BIT
BIT
BITLegacy billing system
Legacy rating system
Billion eventseach day
Customerinvoicing
Partnerinvoicing
Multichannel bill
presentment
•Receivables
management
•Payment processing
•Credit management
•Partner settlement
Invoices
Open Invoices
Contract accountsreceivable
and payable
SAP Customer Financial Management
SAP Convergent Invoicing SAP® Convergent
Charging
Invoicecreation

SAP and IBM Demonstrate Capability of Handling High Billing Volume in a Telecommunications Scenario
7
SAP solutions, improve performance,
and help ensure a cohesive combina-
tion of application and database work.
IBM DB2 9, optimized for SAP software,
is an example.
Figure 2 illustrates the evolving road
map of DB2 optimized for the SAP soft-
ware, looking back through four past
releases and forward into the future.
The road map shows how both com-
panies introduce new functionality in a
planned way with smooth migrations
from one version to the next.
IBM DB2 optimized for SAP software
is the only SAP-supported database
available that operates on all SAP-
supported hardware environments from
Linux, Microsoft Windows, and UNIX to
IBM System i and IBM System z. DB2
provides the widest choice of support
for server, storage, and virtualization
technology for SAP deployments. Plus,
it can be shipped and integrated with
SAP applications as a single product.
IBM and SAP experts are dedicated to
working closely together to help ensure
that IBM DB2 sets the standard for all
other databases in the SAP ecosystem.
In addition, IBM and SAP teams are
performing joint projects that focus on a
range of areas, including performance,
benchmarking, functionality over first
of a kind (the project was breaking new
ground with these tests), best practices,
or combinations thereof.
IBM DB2 LUW 9.7 Optimized for
SAP Software
SAP applications generate a vast
amount of data in day-to-day opera-
tions, so no infrastructure component
is more important than the database.
IBM has pioneered the development
of data management technologies that
reduce the total cost of ownership for
SAP NetWeaver® 2004Streamlined admin •Streamlined install •
2005
2006
2007
2008
2009
2010
2011
2012
2013
SAP NetWeaver 7.0Embedded database •
TCO: self-tuning •Minimal admin •
SAP NetWeaver 7.0 EHP 1Database performance warehouse •Integrated workload management •
SAP NetWeaver 7.0 SR3Turnkey compression and HA solution •
Integrated MDC advisor •Deferred table creation •
SAP NetWeaver 7.0 and higherIntegrated near-line storage •
Integration of DB2 pureScale •MDC advisor stage 2 •
Version 8.2.2• Automatic storage admin• Deployment optimized for SAP
Version 9.1• Compression• Storage limits removed• Selected autonomic/TCO features
Version 9.5• Integrated FlashCopy• Threaded architecture• DPF scaling improvements• Integrated and automatic HA and DR
Version 9.7• Full 360-degree monitoring• Near-0 storage admin• Extending online operations• Even deeper deep compression
DB2 9.8 pureScale• OLTP scale out• Continuous availability• Seamless OS and hardware maintenance
Figure 2. DB2 Optimized for the SAP Road Map
MDC = Multidimensional clusteringTCO = Total cost of ownershipDPF = Database partition feature

SAP and IBM Demonstrate Capability of Handling High Billing Volume in a Telecommunications Scenario
8
For SAP and IBM customers, this tight
collaboration means real tangible value
in terms of performance, attractive
license and maintenance fees, easy
usability, and innovative technology that
can result in real savings. Specifically,
IBM DB2 provides real value by:
•Improving the SAP system response
time by up to 40%, protecting existing
hardware investment3
•Reducing, via compression, SAP
data storage needs by up to 70%,
dramatically saving on energy
costs, administration, and hardware
investment4
•Enabling automated SAP features that
can reduce database administration
time by 30% and free up resources to
better manage the business5
The proof of concept was meant to
be based on a combination of perfor-
mance, throughput, and best practices
with data volumes that had never been
tested before for that particular appli-
cation setup. Therefore, the layout and
setup of the database engine took
those aspects into account. It was
essentially a compromise between best
practices and performance require-
ments. To effectively handle this large
amount of data, the team applied DB2
compression, which reduced the calcu-
lated storage needs by approximately
60% – from 50 TB to 20 TB.
IBM eX5 Enterprise Systems
The IBM eX5 product portfolio – repre-
senting the fifth generation of servers
built on Enterprise X-Architecture – was
used as the SAP application server
in the proof of concept. IBM servers
with IBM eX5 technology are a major
component in ever-changing IT infra-
structures; they offer significant new
capabilities and features that address
the key requirements for customers with
SAP solution landscapes.
The IBM System x server portfolio
provides an ideal platform for SAP
applications that run virtualized in a
private cloud environment. With mul-
tiple workloads running on the same
server, performance remains important,
but reliability and availability become
more critical than ever. Enterprise serv-
ers with IBM eX5 technology are a key
component in a dynamic infrastructure
and offer significant new capabilities
and features that address the following
key requirements for SAP virtualization
solutions:
•Maximum memory with unique expan-
sion capabilities
•Fast and integrated data storage
options
•Logical partitioning of the IBM System
x server (FlexNode)
The ability to modify the memory
capacity independently of the proces-
sors, and the new high-speed local
storage options, mean this system
can be highly utilized, yielding the best
return on application investment. These
systems enable enterprises to grow
their processing, I/O, and memory
dimensions, provision what they need
now, and expand the system to meet
future requirements.
Memory Access for eX5 (MAX5)
MAX5 is the name of the memory scal-
ability subsystems – memory expansion
that can be added to eX5 servers.
MAX5 for the rack-mounted systems
3 SAP IT case study, GK12-4329-00 (12/07).4 Refer to www.ibm.com/solutions/sap/us/en/landing/J233701A22235G06.html.5 IWB case study, SPC03025-CHEN-01 (04/08).

SAP and IBM Demonstrate Capability of Handling High Billing Volume in a Telecommunications Scenario
9
(System x3690 X5, System x3850 X5,
and System x3950 X5) is in the form
of a 1U device that attaches below the
server.
IBM System x3690 X5
The x3690 X5 is positioned for SAP
large application servers and SAP
distributed applications. Often, it’s not
the capacity of processors that limits
virtualized systems for SAP solutions.
Instead, SAP virtualization solutions
depend more on the memory capac-
ity of the host systems. With MAX5
memory expansion the overall systems
can scale up without adding additional
servers or licenses.
The IBM System x3690 X5 is a scalable
2U, two-socket rack-optimized server.
The x3690 X5 is a system with the
same benefits known from the flagship
system x3850 X5.
See the following Web page:
www-03.ibm.com/systems/x
/hardware/enterprise.
The IBM System x3690 X5 has the fol-
lowing main features:
•Two Intel Xeon E7 2800/4800/8800
series (up to 10 core) or two Intel
Xeon 7500 or 6500 families (up to
8-cores)
•Max 1 TB RAM with MAX5 technology
IBM System x3850 X5
IBM System x enterprise servers are
the ideal platform for business-critical
and complex SAP applications, such
as database processing, customer
relationship management, and enter-
prise resource planning, as well as
highly consolidated, virtualized server
environments.
With multiple workloads running on
the same server, performance remains
important but reliability and availabil-
ity become more critical than ever.
Servers with IBM eX5 technology
are a major component in a dynamic
infrastructure and offer significant new
capabilities and features that address
key requirements for customers with
SAP landscapes.
The IBM System x3850 X5 has the fol-
lowing main features:
•Four Xeon E7 2800/4800/8800
series (6 core/8 core/10 core) or Xeon
6500/7500 series
•Scalable to eight sockets by connect-
ing two x3850 X5 servers together
•Up to 3 TB RAM with MAX5 technology
IBM Storwize V7000
Storwize V7000 is a powerful midrange
disk system, designed to be easy to use
and to enable rapid deployment without
additional resources. Storwize V7000
system is virtual storage that offers
greater efficiency and flexibility through
built-in solid-state drive (SSD) optimiza-
tion and thin provisioning technologies.
Storwize V7000 advanced functions
also enable the nondisruptive migration
of data from existing storage, simplify-
ing implementation and minimizing
disruption to users. Storwize V7000 also
enables the virtualization and reuse of
existing disk systems, supporting a
greater potential return on investment
(ROI).
See the following Web page:
www-03.ibm.com/systems/storage
/disk/storwize_v7000/index.html.

SAP and IBM Demonstrate Capability of Handling High Billing Volume in a Telecommunications Scenario
10
IBM Easy Tier
IBM Easy Tier is software functionality
within the IBM storage systems, and is
available for IBM Storwize V7000 as well
as IBM System Storage SAN Volume
Controller and IBM System Storage
DS8000 series.
Easy Tier is designed to decrease the
I/O response time and thereby increase
the input/output operations per second
(IOPS) performance. Easy Tier deter-
mines the appropriate tier of storage,
based on data access requirements,
and then automatically and nondisrup-
tively moves data to the appropriate tier
at the subvolume or sub-LUN (logical
unit number) level; typically between
SSDs and hard disk drives (HDDs). This
feature is designed to reduce, if not
eliminate, the amount of manual effort
involved.
The most critical workload for stor-
age systems is online transaction
processing (OLTP), more precisely
the random-read part of this work-
load. Because the workload is mostly
random, the to-be-read data must
be located physically; the data is not
stored in any cache. This results in a
lengthy response time in the case of
HDDs. Here, SSDs have a much bet-
ter response time; because they do
not have any mechanical parts, the
response time is just a fraction of the
HDD response time, even under load.
Because of performance aspects, the
best solution might be to store the
entire SAP database on SSDs. Even
though SSDs are much more expensive
compared to HDDs, nevertheless the
price per performance is cheaper for
SSDs. Easy Tier actually combines both
technologies, achieving low price per
capacity with HDDs and low price per
performance with SSDs.
Basically, Easy Tier monitors the per-
formance requirements of a virtual disk
(VDisk, LUN); it measures IOPS per
large block.

SAP and IBM Demonstrate Capability of Handling High Billing Volume in a Telecommunications Scenario
11
If a high clipping level is reached, the
data blocks are marked as “hot” and
moved from the lower, slower tier (HDD)
to the higher, faster tier (SSD). In addi-
tion, after the data has been cooled
(the IOPS requirements per block have
decreased) and the low clipping level
has been reached, the data is migrated
back from SSD to HDD.
Value of IBM Easy Tier to SAP
The workload of systems supporting
the SAP ERP application is defined by
OLTP. Typically, not all data in the SAP
system’s database will be accessed
during a given time frame (for example,
24 hours). Statistically, there are con-
tiguous areas accessed, and some of
them will be hot. The change rate of
the hot areas is not within minutes, but
most likely will remain over a longer
period of time – for example, 24 hours.
Here, Easy Tier is able to move these
hot areas from HDD to SSD, and as a
result, the SAP transaction time will be
reduced.
Design of the SAP Landscape
This section describes the setup of the
SAP landscape used for the perfor-
mance test.
SAP System Setup
The system landscape consisted of two
different SAP systems, with the SAP IDs
ETG and ETL. The ETG system simu-
lated the rating engine, which usually
generates the billable items (BITs), was
not part of the performance evaluation,
and is not described in this paper. The
ETG system was installed on four rack
server blades: three blades were used
because the application server, the
SAP database (DB), and SAP central
instance (CI) were installed on the fourth
blade.
From ETG, the billable items were sent
to the ETL system, which was the main
test system (DB and CI). This setup
guaranteed that the creation of BITs
would not influence the throughput of
the upload phase in the ETL target sys-
tem. Before the test started, the team
ensured that the injector system (ETG)
was not the limiting factor of the upload.
Figure 3. IBM Easy Tier
Easy Tier managed storage pool
SSD arrays
“Hot” blocksmigrate up
HDD arrays
Logical volumeStorwize V7000
“Cold” blocks migrate down
SAP and IBM Demonstrate Capability of Handling High Billing Volume in a Telecommunications Scenario
12
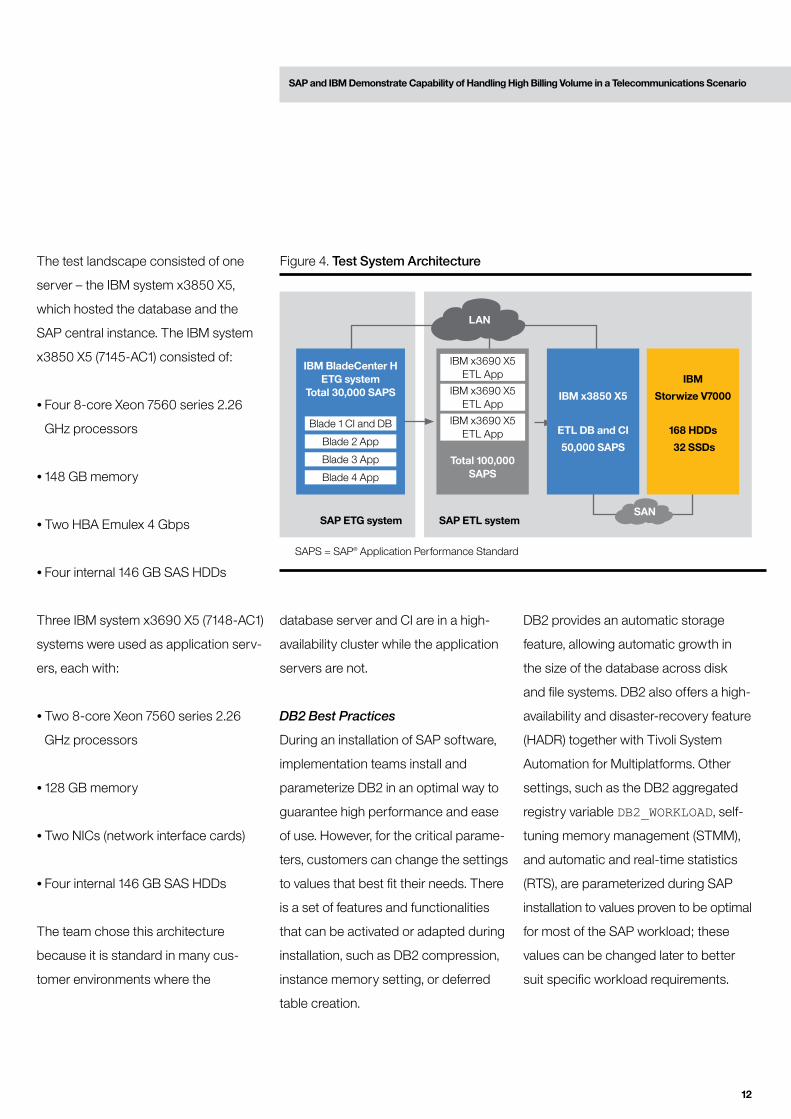
The test landscape consisted of one
server – the IBM system x3850 X5,
which hosted the database and the
SAP central instance. The IBM system
x3850 X5 (7145-AC1) consisted of:
•Four 8-core Xeon 7560 series 2.26
GHz processors
•148 GB memory
•Two HBA Emulex 4 Gbps
•Four internal 146 GB SAS HDDs
Three IBM system x3690 X5 (7148-AC1)
systems were used as application serv-
ers, each with:
•Two 8-core Xeon 7560 series 2.26
GHz processors
•128 GB memory
•Two NICs (network interface cards)
•Four internal 146 GB SAS HDDs
The team chose this architecture
because it is standard in many cus-
tomer environments where the
database server and CI are in a high-
availability cluster while the application
servers are not.
DB2 Best Practices
During an installation of SAP software,
implementation teams install and
parameterize DB2 in an optimal way to
guarantee high performance and ease
of use. However, for the critical parame-
ters, customers can change the settings
to values that best fit their needs. There
is a set of features and functionalities
that can be activated or adapted during
installation, such as DB2 compression,
instance memory setting, or deferred
table creation.
DB2 provides an automatic storage
feature, allowing automatic growth in
the size of the database across disk
and file systems. DB2 also offers a high-
availability and disaster-recovery feature
(HADR) together with Tivoli System
Automation for Multiplatforms. Other
settings, such as the DB2 aggregated
registry variable DB2_WORKLOAD, self-
tuning memory management (STMM),
and automatic and real-time statistics
(RTS), are parameterized during SAP
installation to values proven to be optimal
for most of the SAP workload; these
values can be changed later to better
suit specific workload requirements.
Figure 4. Test System Architecture
SAP ETG system SAP ETL system
LAN
SAN
Total 100,000 SAPS
IBM x3690 X5ETL App
IBM x3690 X5ETL App
IBM x3690 X5ETL App
IBM BladeCenter HETG system
Total 30,000 SAPS
Blade 1 CI and DB
Blade 2 App
Blade 3 App
Blade 4 App
IBM
Storwize V7000
168 HDDs
32 SSDs
IBM x3850 X5
ETL DB and CI
50,000 SAPS
SAPS = SAP® Application Performance Standard

SAP and IBM Demonstrate Capability of Handling High Billing Volume in a Telecommunications Scenario
13
This proof-of-concept project worked
mainly with the default values rec-
ommended by SAP, but specific
parameters were modified to improve
performance for the current SAP work-
load and are described in this section.
DB2 Version
The proof of concept used DB2 9.7
Fixpack 3 throughout the project.
Linux ext3 file System
The recommendation was to use a file
system type ext3 under Linux.
IBM DB2 Storage Optimization Feature
(DB2 Compression)
With massive amounts of data from SAP
Convergent Invoicing, the IBM DB2 stor-
age optimization feature contributed
to massive storage savings. The SAP
team calculated database size savings
of approximately 60% with DB2 com-
pression – from about 50 TB down to
20 TB.
The largest tables (/1FE/0LTxxxIT,
/1FE/0LTxxxIT00, BALDAT) comprise
around 97% (19 TB) of the total data-
base size (19.6 TB). It was therefore
important to build an optimal com-
pression dictionary and compress the
tables based on those patterns to
achieve the best compression results.
The team also used row and index
compression, including temporary
table compression. For more informa-
tion about how this was done, see the
following article on the SAP Developer
Network site: Best Practice Using
DB2 Compression Feature in SAP
Environment, available online at
www.sdn.sap.com/irj/scn/index?rid=
/library/uuid/a02d282d-9074-2d10
-5496-ec2c65028a83.
SAPDATA Layout
The database was expected to grow
up to 50 TB. As a result, the data
placement needed to be considered
very carefully in order to provide opti-
mal read-write performance from the
database. Today’s storage systems
are built on multilayer abstraction
levels and the relationship between
file systems and disks – as seen by
the operating system – often does
not reflect the physical conditions.
Therefore, a one-to-one relationship
between SAPDATA file systems and
Linux logical volume was chosen,
without using the Linux logical volume
manager. The team configured a
total of 32 SAPDATA file systems – on
average, one for each available CPU in
the system.
DB2 Parallel I/O
In addition, the team wanted to increase
query performance and optimize the
I/O resource utilization by applying the
DB2_PARALLEL_IO registry variable.
By default, a DB2 database system
places only one prefetch request at a
time to a table space container. This
is done with the understanding that
multiple requests to a single device are
serialized anyway. If a container resides
on an array of disks, there is an oppor-
tunity to start multiple prefetch requests
simultaneously, without serialization.
The parameter DB2_PARALLEL_IO
enables the DB2 system to start prefetch
requests in parallel for a single con-
tainer, which might help to increase I/O
throughput. In this proof-of-concept
project, the parallelism parameter was
set to the value of 2, doubling the num-
ber of I/O servers from 32 to 64. The
DB2_PARALLEL_IO registry variable
also computes the prefetch size for
each table space if the PREFETCHSIZE
option is set to AUTOMATIC, the default
for SAP systems.

SAP and IBM Demonstrate Capability of Handling High Billing Volume in a Telecommunications Scenario
14
Based on the formula shown in Figure 5,
a prefetch size of 128 pages was cal-
culated, based on the settings used
in the proof of concept. In that way, for
example, it was very likely that all 128
physical disks would be used during a
table scan, resulting in an optimized I/O
resource utilization.
Figure 5. DB2 Prefetch Configuration
64 prefetcher
Container 1
Table A
Container 2
Table A
Container 32
Table A
Optimal prefetch size for improved query performance
1 2 3 4 5 6 7 8 125 126 127 128
Disk group SAPDATA (MDG) was built up with 128 HDDs
Extensize * (number of containers) * (physical disks*) = Prefetch size2 * 32 * 2 = 128
-> with these settings a full table scan keeps the 128 disks busy
* Formula – how does DB2 determine the number of physical disks per container?
– DB2_PARALLEL_IO not specified then # of physical disks per container defaults to 1
– DB2_PARALLEL_IO=* # of physical disks per container defaults to 6.
– DB2_PARALLEL_IO=*:2 setting used in this PoC
db2set DB_PARALLEL_IO=’*’:2* = for all tablespaces2 = level of I/O parallelism is two
Old ValueNumber of I/O servers (NUM_IOSERVERS) = AUTOMATIC (32)DB2_PARALLEL_IO - was not set
New ValueNumber of I/O servers (NUM_IOSERVERS) = AUTOMATIC (64)[i] DB2_PARALLEL_IO=*:2
Key SAP Tables and Indexes
The definitions and storage of the key
tables in SAP Convergent Invoicing were
modified to offer optimal insert, update,
and delete performance and better man-
ageability of large tables. The tables were
split and the “append on” mode set. For
more information about the “append on”
table definition, see p. 16.
Table Space Definitions
For maintenance reasons, the team
moved the billing tables and their
indexes to separate table spaces.
Tables: Tablespace name = ETL#XBDIndexes: Tablespace name = ETL#XBI

SAP and IBM Demonstrate Capability of Handling High Billing Volume in a Telecommunications Scenario
15
Creating table spaces The table spaces were created by the following commands:
CREATE LARGE TABLESPACE “ETL#XBD” IN DATABASE PARTITION GROUP SAPNODEGRP_ETL PAGESIZE 16384 MANAGED BY AUTOMATIC STORAGE AUTORESIZE YES
INITIALSIZE 320 M MAXSIZE NONE EXTENTSIZE 64 PREFETCHSIZE AUTOMATIC BUFFERPOOL IBMDEFAULTBP OVERHEAD 7.500000 TRANSFERRATE 0.060000 NO FILE SYSTEM CACHING DROPPED TABLE RECOVERY OFF; CREATE LARGE TABLESPACE “ETL#XBI” IN DATABASE PARTITION GROUP SAPNODEGRP_ETL PAGESIZE 16384 MANAGED BY AUTOMATIC STORAGE AUTORESIZE YES INITIALSIZE 320 M MAXSIZE NONE EXTENTSIZE 64 INCREASESIZE 128 M PREFETCHSIZE AUTOMATIC BUFFERPOOL IBMDEFAULTBP OVERHEAD 7.500000 TRANSFERRATE 0.060000 NO FILE SYSTEM CACHING DROPPED TABLE RECOVERY OFF;
The settings for the following table space parameters were modified against the
SAP default table space definitions:
•INITIALSIZE 320 MB – the initial size of the table space. Since 32 SAPDATA
directories were used, each container had an initial size of 10 MB.
•EXTENTSIZE 64 – every extent contains 64 pages. This avoids the effort of
allocating the pages to tables more often and was useful in this scenario.
•INCREASESIZE 128 MB – decreases the effort of allocating space from the file
system to the table space more often and thus improves performance and avoids
file system fragmentation.

SAP and IBM Demonstrate Capability of Handling High Billing Volume in a Telecommunications Scenario
16
Moving Tables and Indexes to
New Table Spaces
After table space creation, the tables were moved to the new table spaces with the
help of the online table move tool: sysproc.admin_move_table available since
DB2 9.7:
call sysproc.admin_move_table(‘SAPSR3’,’/1FE/0LT023IT’, ‘ETL#XBD’, ‘ETL#XBI’, ‘ETL#XBD’, ‘’, ‘’, ‘’, ‘’, ‘’, ‘MOVE’);
Optimizing Compression Ratio,
Performing Table Maintenance
During the table move above, DB2 triggered the automatic dictionary creation (ADC)
after a certain amount of data (approximately 20 MB) had been inserted into the new
table.
In this project, the compression rate of the dictionary created by ADC was low,
because of the low filling level of the used tables. To gain a much higher compres-
sion rate, the team executed a billing run to fill up the tables, and then reorganized
the tables, including the re-creation of the dictionary, resetdictionary.
Afterward a manual runstats was performed for each of the tables:
reorg table SAPSR3.”/1FE/0LT000IT” resetdictionary;runstats on table SAPSR3.”/1FE/0LT000IT”;
Defining Profile Statistics To keep the performance impact low during the automatic data collection of the
large tables with the runstats utility, a statistics profile was registered for each
of these tables. As result, only 1% of the data was read by the autorunstats
command.
runstats on table sapsr3.”/1FE/0LT000IT” tablesample system(1)set profile only;
Table Definition “append on” To provide better insert performance, the team modified table definitions with the
“append on” option. When this option is used, DB2 simply sticks the new row at
the end of the table, makes no attempt to search for available space, and makes no
effort to preserve any kind of clustering order. Note that reuse of space made avail-
able by delete or update activity, which changes row size, does not occur until the
table is reorganized.
alter table ‘SAPSR3’,’/1FE/0LT000IT’ append on

SAP and IBM Demonstrate Capability of Handling High Billing Volume in a Telecommunications Scenario
17
DB2 Log Files and Log Buffer (DB
Parameters)
The DB2 online log files were placed on a separate fast SSD disk to provide high
write performance. Based on the high insert, update, and delete rates, the number
and the size of the log files were increased to the following values:
Old values:Log file size (4KB) (LOGFILSIZ) = 16380Number of primary log files (LOGPRIMARY) = 20Number of secondary log files (LOGSECOND) = 80Log buffer size (4KB) (LOGBUFSZ) = 1024New values:Log file size (4KB) (LOGFILSIZ) = 128000Number of primary log files (LOGPRIMARY) = 150Number of secondary log files (LOGSECOND) = 50Log buffer size (4KB) (LOGBUFSZ) = 16384
The team increased the log buffer size because they had seen log buffer overflows
within a database uptime of less than 24 hours, resulting from the large amount
of data manipulating language (DML) (insert, update, and delete) statements per
transaction. This implies that DB2 had to do multiple physical write I/Os to facilitate
commit processing of a single transaction, which resulted in a performance degra-
dation of response time and throughput.
Because performance degradation can occur when secondary logs are used,
the recommendation – based on the project results – was to set the number of
secondary log files to 0. There was overhead in allocating and formatting the sec-
ondary log files. For best performance, primary log space had to be allocated in
sufficient quantity, such that the allocation of secondary logs was unnecessary.
Proactive Page Cleaning This alternate method differs from the default behavior in that page cleaners
behave more proactively in choosing which dirty pages get written out at any
given point in time. This method doesn’t respect the database parameter
chngpgs_thresh.

SAP and IBM Demonstrate Capability of Handling High Billing Volume in a Telecommunications Scenario
18
So this technique is more aggressive
and spreads out the page cleaning
work by writing more frequently, but to
fewer pages at a time. It also improves
the way DB2 agents find free pages in
the buffer pool. This allows the page
cleaners to use less disk I/O bandwidth
over a longer time.
Test runs with the billing workload
demonstrated that as well as a run-
time improvement of up to 6%, Disk
Write KB/Sec was reduced by over
60% (see Figure 6), whereas the Disk
Read KB/Sec and the IO/sec slightly
increased. To activate alternate page
cleaning, the DB2 registry variable
DB2_USE_ALTERNATE_PAGE_
CLEANING had to be set to on.
STMM and Instance Memory
In order to set selected memory areas
in DB2 to a specific size, it’s possible to
switch off STMM or to use STMM. This
can be an option in environments where
the memory requirements are known
and the workload rarely changes. For
more information, refer to the following
article on the SAP Developer Network
(SDN) site: The Evolution of the Memory
Model in IBM DB2 for Linux, UNIX, and
Windows. You can find the SDN site and
the article online at:
www.sdn.sap.com/irj/sdn/go/portal /prtroot/docs/library/uuid /b0aabcc9-afc1-2a10-5091-b5cd-a33036b0.
In this proof on concept, the team used
the standard settings for STMM, with
the instance memory set to a fixed
value (default for SAP installations) and
let STMM adapt the remaining memory.
The memory allocated by DB2 is
controlled by a single parameter,
INSTANCE_MEMORY, while two other
important parameters, DATABASE_
MEMORY and APPL_MEMORY, control
the allocation of database-level memory
and application-level memory (within the
limits provided by INSTANCE_MEMORY).
Nearly all other memory configuration
parameters for the different memory
heaps used by DB2 now support an
AUTOMATIC setting.
Without STMM, extensive monitoring
and adjustments would have had to
be performed for the different memory
areas (at each stage during the scal-
ing) to achieve optimal performance for
each of the various workload profiles.
I/O
per
sec
.
Figure 6. Summary Disk Throughput Without and With Alternate Page Cleaning
Disk throughput – averageBilling runs
0
20
40
60
80
100
120
140
0
2,000
4,000
6,000
8,000
10,0000
120,000
140,000
160,000
KB
/sec
T
hous
ands
Disk read KB/s Disk write KB/s I/O per sec
Without alternate page cleaning With alternate page cleaning

SAP and IBM Demonstrate Capability of Handling High Billing Volume in a Telecommunications Scenario
19
DB2 Instance Memory
(DBM Parameter)
The database server had a total of 148 GB of main memory, with the SAP two-tier
architecture database and central instance residing on one server. The DB2 instance
was set to 32 GB of memory, which is approximately 22% of the available memory.
The team performed tests by tripling the memory but did not see any runtime
improvement, and therefore kept the value of 32 GB for all the payload runs.
Size of instance shared memory (4KB) (INSTANCE_MEMORY) -> 8192000
STMM With STMM turned on, the monitoring and adjustment tasks were done by DB2,
which automatically configured most of the memory settings and adjusted them
at runtime to optimize performance. STMM did not require any DBA intervention to
tune the memory parameters based on workload change.
STMM tuned the following memory consumers within the database instance memory:
•Database locking LOCKLIST and MAXLOCKS
•Package cache size PCKCACHESZ
•Sort memory SHEAPTHRES_SHR and SORTHEAP
•Buffer pools

SAP and IBM Demonstrate Capability of Handling High Billing Volume in a Telecommunications Scenario
20
5,000,000
5,500,000
6,000,000
6,500,000
7,000,000
7,500,000
8,000,000
31/1
0
31/1
0
31/1
0
31/1
0
31/1
0
1/11
1/11
1/11
1/11
2/11
2/11
2/11
2/11
3/11
3/11
3/11
3/11
4/11
16/1
1
17/1
1
17/1
1
17/1
1
17/1
1
18/1
1
18/1
1
18/1
1
18/1
1
19/1
1
19/1
1
19/1
1
19/1
1
20/1
1
20/1
1
4 K
B P
ages
Days
DB memory
Buffer pool
STMM settings during the billing payload run (ET4):6
Self tuning memory (SELF_TUNING_MEM) ONSize of database shared memory (4KB) (DATABASE_MEMORY) AUTOMATIC(7044530)Max storage for lock list (4KB) (LOCKLIST) AUTOMATIC(464480)Percent of lock lists per application (MAXLOCKS) AUTOMATIC(97)Package cache size (4KB) (PCKCACHESZ) AUTOMATIC(131566)Sort heap thres for shared sorts (4KB)(SHEAPTHRES_SHR) AUTOMATIC(916456)Sort list heap (4KB) (SORTHEAP) AUTOMATIC(183291)
db2 select BPNAME, NPAGES, PAGESIZE FROM SYSCAT.BUFFERPOOLS
BPNAME NPAGES PAGESIZE IBMDEFAULTBP -2 16384
runstats and Reorganization
Following best practice, the default
value was kept on for AUTO_RUNSTATS
and off for reorganization. With
AUTO_RUNSTATS (a periodic back-
ground process) and real-time statistics
(AUTO_STMT_STATS) set to on, the
catalog statistics were kept current so
that the optimizer determined the best
access path to the data for optimal
performance. The runstats profile
definition for the large tables ensured
that the impact of AUTO_RUNSTATS
on system performance was negligible.
(For more information, see the section
about defining profile statistics on p. 16.)
In the following description of the test
project, the term evaluation refers to
the processing that took place when
automatic statistics collection checked
whether or not specific tables required
statistics to be updated, deleted,
or added, and then scheduled a
runstats activity for the out-of-date
tables.
The first evaluation occurred within
two hours of database activation.
Subsequent evaluations occurred
approximately every two hours after
that, as long as the database remained
active.
Figure 7. STMM Alignment of the Database Memory and Buffer Pool
Period of 20 days
6 For more information about all memory parameter settings for run ET4, see p. 41.
Figure 7 shows an example of how
STMM has aligned the database mem-
ory and the buffer pool over a period of
20 days. The regulation of the memory
within the present time frame was
caused by a test series of billing and
invoicing runs. The graph demonstrates
clearly how STMM can adapt the mem-
ory on the fly, based on the workload.
The graph also shows that for the days
from November 18 to 20, the team exe-
cuted a series of billing runs and that,
for example, the buffer pool memory
grew and shrunk by around 3 GB.
STMM = Self-tuning memory management
SAP and IBM Demonstrate Capability of Handling High Billing Volume in a Telecommunications Scenario
21
After the load phase, the team reorganized DB2 and ran the runstats utility for all
relevant SAP tables to gain a stable state of the database. This state was saved via
FlashCopy as the “golden backup” and was later used to restore the database to
the defined state for the next series of test runs.
db2 reorg table SAPSR3.”/1FE/0LT000IT” resetdictionarydb2 runstats on table sapsr3.”/1FE/0LT000IT” for detailed indexes all
Automatic maintenance (AUTO_MAINT) ONAutomatic runstats (AUTO_RUNSTATS) ONAutomatic statement statistics (AUTO_STMT_STATS) ONAutomatic reorganization (AUTO_REORG) OFF
•Monitoring based on DB2 Workload
Management Service classes
•Easy navigation and guided procedures
•Uniform data collection with the DBA
cockpit and database performance
warehouse (DPW) in SAP enhance-
ment package 2 for SAP NetWeaver
•Monitoring of IBM DB2 pureScale
(SAP transport available)
New DBA Cockpit for DB2 from SAP
The DBA cockpit for DB2 from SAP is
an integral part of all SAP solutions and
covers the complete administration and
monitoring of local and remote data-
bases. The team used the DBA cockpit
during the proof of concept to carry out
monitoring and performance analysis.
(For more information, refer to the IBM
e-book SAP DBA Cockpit – Flight Plans
for DB2 LUW Administrator on the IBM
Web site.) The new DBA cockpit from
SAP is a Web Dynpro–based user inter-
face and has been available since the
release of SAP enhancement package
1 for the SAP NetWeaver® technology
platform.
This proof of concept was able to fully
exploit the new cockpit. The following
list provides an overview of the new
monitoring features of IBM DB2 9.7 that
have been added to the cockpit:
•History-based, back-end data collection
•Time-spent monitoring with drill-down
capabilities
•New event monitors (for example, for
locks)
•New object metrics (for example:
index access statistics, and database
container read and write times)

SAP and IBM Demonstrate Capability of Handling High Billing Volume in a Telecommunications Scenario
22
Figure 8. DBA Cockpit from SAPThe time-spent and historical data were
extremely useful in identifying bottle-
necks and interpreting runtime behavior.
SUSE Linux Enterprise Server V11 Tuning
The team carried out the following:
•Chose the SUSE Linux Enterprise
Server (SLES) V11.1 for this proof of
concept, and applied all available
patches at project start (April 2011).
•Explicitly checked the patch level of
the dm-multipath driver.
•Configured /etc/multipath.conf
as follows:
defaults {polling_interval 30failback immediateno_path_retry 5rr_min_io 100path_checker turuser_friendly_names yes}devices { device { vendor “IBM” product “2145” prio alua path_grouping_policy group_by_prio }
}

SAP and IBM Demonstrate Capability of Handling High Billing Volume in a Telecommunications Scenario
23
•Used two dual-port EMULEX HBA
cards, with the latest device driver
from EMULEX. The EMULEX admin-
istration tool OneCommand Manager
was installed as well; through this tool
the default LUN queue length was
changed from default 30 to 64 per
LUN.
•Installed a dedicated SAN switch
(IBM 48 port model, 4 GB) installed –
noncritical.
•Formatted the file systems as ext3
type; at project start, ext4 was not
certified by SAP, and was in “experi-
mentation” mode.
•Installed the base OS as well as the
swap partition on internal disks –
noncritical.
•Created a physical volume on every
LUN through pvcreate.
•Stored and installed all SAP and DB2
data on the Storwize V7000 system.
The team used a one-to-one relation-
ship between SAPDATA file systems
and LUNs, did not use the Linux
Logical Volume Manager, and chose
the file system layout shown in Figure 9.
During the installation of Linux and DB2,
the team ran several workload tests;
when more files were used, the setup
seemed to perform better. As a result,
the team decided to use 32 file systems,
as many as the number of installed
processors.
File system mount point:
Internal HDD
V7000 MDG1
V7000 MDG2
V7000 MDG3
Directory:
/
/sap/usr
/db2
/db2etl
/sapmnt
/ETL
/ETL/sapdata1
/sapdata2
/sapdata...
/db2dump
/sapdata32
/log_dir
Figure 9. File System Layout of Test System

SAP and IBM Demonstrate Capability of Handling High Billing Volume in a Telecommunications Scenario
24
Storwize V7000 Setup
Figure 10 shows the basic Storwize
V7000 configuration.
The manage disk group (MDG) SAPDATA
was build up with 128 HDD, 2.5 inch,
450 GB capacity at 10,000 RPMs. The
16 arrays were configured as redundant
array of independent disks (RAID) 5,
7+1. Within Storwize V7000, an internal
RAID array was called managed disk
(MDisk). In addition, two SSD-managed
disks were put into this MDG, with a
RAID 5, 5+1 configuration; each single
SSD has a capacity of 300 GB.
The DB2 log files were put into a
dedicated MDG, a RAID 10, 2+2 con-
figuration, providing maximum I/O
performance with minimum response
time. A MDG with just one array was
configured to store the EXE data, and
a RAID 10, 1+1 with two HDDs was
chosen, providing 450 GB of usable
storage.
The MDG was configured with the
default extent size of 256 MB (non-
critical parameter); all SAPDATA VDisks
were configured as space-efficient;
each SAPDATA VDisk had a size of 800
GB. The EXE and LOG VDisks were
configured with thick provisioning. In the
test environment, the LOG VDisk had a
size of 200 GB.
MDG SAPDATA, Easy Tier
16 HDD arrays: RAID 5, 7+1
3 SSD arrays: RAID 5, 5+1
MDG LOG
1 SSD arrayRAID 10, 2+2
MDG EXE
1 HDD arrayRAID 10, 1+1
32 VDisks
HDD MDisk SSD MDisk
1 VDisk
SSD MDisk HDD MDisk
3 VDisks
total HDDs:142, spare:14total SSDs: 24, spare: 2
Figure 10. Storwize V7000 Configuration
Switching Between HDD, SSD, and
Easy Tier
The Storwize V7000 allowed changing
the physical storage setup or physical
storage layout while keeping the VDisk
online. This flexibility was utilized to
physically move the data (extents) of
VDisks between managed disks of type
SSD and HDD.
During the upload test, the team used
the following storage configuration to
measure the performance differences:
•HDD-only
•SSD only – this setup was used during
the first load phases, until the maxi-
mum usable SSD capacity of 4.3 TB
was reached
•HDD and SSD combined with Easy Tier
During the billing and invoice scenarios,
the team tested HDD (only) and Easy
Tier, due to capacity limitation on SSD.
The command lsvdiskextent com-
mand was used to identify the number
of extents to be moved, and then the
migrateexts command to move a
specific number of extends from one
MDisk to another one. These commands
provided the capability to move data from
SSD to HDD and to switch between the
configurations: HDD, SSD, and Easy Tier.
Using Storwize V7000 FlashCopy
as Backup
The team used the Storwize V7000
space-efficient FlashCopy functionally
as data protection. For all VDisks, the
team created thin-provisioned VDisks
with the corresponding sizes, put them
into a single consistency group, and
issued the startfcmap command.

SAP and IBM Demonstrate Capability of Handling High Billing Volume in a Telecommunications Scenario
25
Command sequence for backup: # mkfcconsistgrp -name BACKUP# mkfcmap -source SAPDATAxx -target SAPDATAxx_BACKUP -name SAPDATAxx_BACKUP -consistgrp BACKUP ...# startfcconsistgrp -prep -name BACKUP
Command sequence for restore: # mkfcconsistgrp -name RESTORE# mkfcmap -source SAPDATAxx_BACKUP -target SAPDATAxx -name SAPDATAxx_RESTORE -consistgrp RESTORE ...# startfcconsistgrp -prep -restore -name RESTORE
Only the command sequences for the
SAPDATA VDisks were listed (step 2
in the list); the VDisks LOG and EXE
needed to be put into the consistency
groups as well.
Scenario Description
To review, the proof-of-concept project
took into account the following require-
ments of a large telecommunications
company: 50 million active customers
producing a total of 1.5 billion BITs per
day. Each BIT represents one phone
call or SMS. Since every customer gets
a monthly invoice, the phone company
has to send out bills to 2.5 million cus-
tomers every workday.
These typical requirements resulted in
the main KPIs of this test. In less than
18 hours, the performance test had to
accomplish the following tasks:
•Upload of 1.5 billion BITs, with a minimum
of 100,000 BITs uploaded per second
•Billing of 2.5 million business partners,
which included the aggregation of
2.275 billion BITs
•Invoicing of 2.5 million business partners
The main objective of the test was to
prove 1) that the solution was capable of
handling this volume within the 18-hour
period, and 2) scalability. Even though
the team was able to prove capability and
scalability during this proof-of-concept
project, further performance improve-
ment in other scenarios would depend
on the hardware components used.
For the test, the team used 20 different
BIT classes and tested two different
scenarios. In scenario 1, all the activities
were done sequentially, mainly to cap-
ture data individually for each activity.
In the more realistic scenario 2, billing
and invoicing still ran sequentially, but
there was, at the same time, a constant
stream of upload, running in parallel.
The steps in scenario 1 were executed
in sequence.
Figure 11. Test Scenario 1
Time
Upload Billing Invoicing
Concurrent processes

SAP and IBM Demonstrate Capability of Handling High Billing Volume in a Telecommunications Scenario
26
In scenario 2, billing and invoicing were
run sequentially but in parallel with
upload.
Scenario Execution
The following section describes how
the different runs were started.
Starting the SAP Batch Jobs
The tests were mainly started by
launching the appropriate SAP trans-
actions, FKKBIX_MA for billing and
FKKINV_MA for invoicing. Only for the
creation and transfer of the BITs did the
team need to provide a special report,
which ran in the ETG system.
All three activities were based on the
mass activity framework that permits
an easy way to launch multiple jobs in
parallel and to distribute them over the
available servers. Though possible, no
batch job ran on the central instance;
this had the benefit of clearly separat-
Figure 12. Test Scenario 2
Time
Upload
Billing Invoicing
Concurrent processes
ing database load and SAP application
server load. The load that the enqueue
server puts onto the central instance is,
in this case, negligible.
The upload activity was started on
the ETG system. The launched batch
jobs created BITs using a report, which
was generated together with the cor-
responding BIT class to permit easy
testing for customers. The BITs thus
created were then sent via remote func-
tion call (RFC) to the corresponding
interface of the BIT class in the ETL
system, where they were written to the
database. Because synchronous BAPI®
programming interface calls were used,
the number of open RFC connections
could not exceed the number of batch
jobs in ETG, which was 150 for all tests.
Billing as well as invoicing was started
directly in the ETL system. The job dis-
tribution of scenario 1 was as follows:
Server Number of jobs during billing Number of jobs
ETL App 1 25 42
ETL App 2 25 41
ETL App 3 25 42

SAP and IBM Demonstrate Capability of Handling High Billing Volume in a Telecommunications Scenario
27
The upload used 150 parallel threads
on ETG; the called ETL system used a
load balancing mechanism to distribute
the RFC calls equally over its applica-
tion servers.
Server Number of jobs during billing Number of jobs
ETL App 1 17 14
ETL App 2 17 13
ETL App 3 17 14
ETL_CI 0 10
For scenario 2, the number of jobs was reduced because here the upload of BITs
continued during billing and invoicing:
In this scenario, the upload on ETG
used only 34 concurrent threads. The
distribution of the RFC calls on the
receiving ETL system was done in the
same way as in scenario 1.
The mass activity framework permits
“through events” to perform special
actions when jobs are launched or
finished, and this was used to automati-
cally start and stop some monitors:
•STAD records written at the end of the
run (SAP)
•SM37 information written at the end of
the run (SAP)
•/SDF/MON capturing information dur-
ing the run (SAP)
•nmon (OS, all servers)
•db2stat (DB2 LUW, DB server only)
•vmstat -xyz during the run (OS, all
servers)
•iostat -xyz during the run (OS, all
servers)
Clearly, some of these monitors provide
redundant information, but as each tool
provides the information in a certain
context, it makes the evaluation easier.
DB2 Monitoring
For DB2 monitoring, the team used
the db2top utility in batch mode, the
database snapshot monitor, and the
DBA cockpit. Furthermore, the team
collected the database and database
manager configuration.
db2top
DB2 Snapshot (Before and After Each Run)db2 get snapshot for database on <SID>
Configuration Informationdb2 get dbm cfgdb2 get db cfg for <SID>db2set -all
During the proof of concept, SAP
released a new ad hoc data collection
tool for DB2 to collect a history of DB
KPIs over a certain period. For perfor-
mance monitoring, the team used this
tool, which is provided as an attach-
ment to SAP Note 1603507 in the SAP
Notes tool. The data collection tool has
a smaller footprint than the db2top
utility and therefore generates less per-
formance overhead.
db2top -d <sid> -i <interval> -m <duration> -b <suboption> -o <output file>
b: batch mode
suboption: t = tablespaces d = database m = memory b = bufferpool

SAP and IBM Demonstrate Capability of Handling High Billing Volume in a Telecommunications Scenario
28
OS Monitoring
For OS monitoring (processor, disk,
network, and so on), the team used the
IBM tool nmon, which was started with
the SAP batch jobs. See the following
section for detailed results. (For more
information about nmon, see
www.ibm.com/developerworks/aix
/library/au-analyze_aix/.)
Storwize V7000 Monitoring
IBM provides the PERL-based moni-
toring tool svcmon, providing very
detailed performance analyses about
the Storwize V7000 system. This tool
runs continuously and creates reports
for a specified duration. Results for the
performance test are detailed in the
section that follows. (For more informa-
tion about svcmon, see
www-03.ibm.com/support/techdocs
/atsmastr.nsf/WebIndex/PRS3177.)
Results and Achievements
This section provides details of the run-
times of the three different SAP batch
jobs that were needed to process all
billable items. The first part describes
the results of scenario 1, where upload,
billing, and invoicing run in sequence.
The second part presents the results of
scenario 2.
Upload
The upload was tested in three different
configurations of the storage system:
•HDD
All data files have been placed on
HDD, and log files on SSD.
•SSD
All data and log files have been placed
on SSD.
•Easy Tier
Easy tiering was switched on for data
files, HDD, and SSD within one MDG,
log files on SSD within different MDGs.
Each of the tests was run twice, and
the following table gives the best results
achieved for each test.
Test Total runtime Throughput (BITs per second)
HDD 4:37:00 90,253
SSD 4:02:59 102,888
Easy Tier 4:02:59 96,587
Figure 13 illustrates that the number of
BITs loaded per time interval did not
deteriorate over time.
Figure 13. Scalability of Upload Run
0
200,000,000
400,000,000
600,000,000
800,000,000
1,000,000,000
1,200,000,000
1,400,000,000
1,600,000,000
00:00:00 00:28:48 00:57:36 01:26:24 01:55:12 02:24:00 02:52:48 03:21:36 03:50:24 04:19:12
Runtime [hh:mm:ss]
Scalability BITs uploaded (SSD)
BIT
s up
load
ed

SAP and IBM Demonstrate Capability of Handling High Billing Volume in a Telecommunications Scenario
29
Billing
After the upload was run, the database
size was 20 TB – too large to be stored
on SSD only. Therefore the data file
(SAPDATA) was stored either on HDD-
only (and test runs are called HDD) or
with Easy Tier enabled (hot data stored
on SSD, and these runs are called ET).
During these runs, the log data was
stored on a separate SSD-managed
disk group. The runtimes were:
Test Total Throughput Throughput runtime (Bills per second) (BITs per second)
HDD 17:49:25 39 38,572
ET 11:27:20 61 60,015
Figure 14. Scalability of Billing Run
0
500,000
1,000,000
1,500,000
2,000,000
2,500,000
3,000,000
00:00:00 02:24:00 04:48:00 07:12:00 09:36:00 12:00:00
Con
trac
t acc
ount
s bi
lled
Runtime [hh:mm:ss]
Scalability objects processed ET
It is worth noting that there was a much
higher throughput when the ET configu-
ration was used, compared to HDD. The
number of objects processed scaled in
a linear way with the runtime of the job,
and there was no measurable degrada-
tion in throughput.
Another important aspect was the lin-
ear scalability according to the number
of concurrent jobs. This was required
to increase the throughput whenever
needed. Figure 15 shows that this
requirement was fulfilled in this case.
Bills
per
sec
ond
Figure 15. Scalability with Respect to Concurrent Jobs
0.00
10.00
20.00
30.00
40.00
50.00
60.00
70.00
0 10 20 30 40
Scaling behavior invoicing
50
80.00
Linear (Scaling behavior invoicing)
Concurrent jobs
Scaling behavior billing

SAP and IBM Demonstrate Capability of Handling High Billing Volume in a Telecommunications Scenario
30
Invoicing
Invoicing was tested with HDD and Easy
Tier for the same reasons as stated in
the billing section. The resulting run-
times for each scheme were as follows:
Test Total runtime Throughput (invoices per second)
HDD 0:35:49 1,163
ET 0:35:27 1,175
As expected, the runtimes with Easy
Tier were slightly better than those with
HDD only. The small difference here –
compared to the two other steps – can
be explained by the fact that the billing
documents and the resulting invoic-
ing documents – compared to the size
of all the BITs together – were rather
small. Therefore, a lot of the informa-
tion required for invoicing was very
likely still in the cache of the database
system; as a result, the different access
times between HDDs and SSDs are not
important here.
As Figure 16 shows, the application scaled with the number of objects processed.
Figure 16. Scalability of Invoicing Run
0
500,000
1,000,000
1,500,000
2,000,000
2,500,000
3,000,000
00:00:00 00:07:12 00:14:24 00:21:36 00:28:48 00:36:00
Con
trac
t Acc
ount
s In
voic
ed
Runtime [hh:mm:ss]
Scalability objects processed ET
To reach still higher throughput figures, it was important that the number of
invoices created per second scaled with the number of concurrent jobs. Figure 17
shows how this was the case.
Figure 17. Scalability of Invoicing with Respect to Concurrent Jobs
0.00
100.00
200.00
300.00
400.00
500.00
600.00
700.00
0 10 20 30 40
Scaling behavior invoicing
Linear (Scaling behavior invoicing)
Invo
ices
per
sec
ond
Concurrent jobs
Scalability behavior invoicing

SAP and IBM Demonstrate Capability of Handling High Billing Volume in a Telecommunications Scenario
31
Total Runtime
The three runtime results totaled
16:21:37 hours. IBM Easy Tier reduced
the total runtime by 6:40:37 hours or
29%.
Test Runtime (ET) Runtime Runtime (HDD) factors
Upload 04:18:50 7 04:37:00
Billing 11:27:20 19 17:49:25
Invoicing 00:35:27 1 00:35:49
∑ 16:21:37 27 23:02:14
Scenario 2
Upload was run during billing and
invoicing to prove this was a possible
option. This scenario was measured
only with the IBM Easy Tier option, and
the results were as follows:
Test Runtime (ET)
Billing 13:23:47
Invoicing 01:53:09
∑ 15:16:58
Upload is not included in this table as
it ran concurrently with the two other
activities. It required less time to fin-
ish and didn’t influence the total time
required for the processing.
Compared with scenario 1, scenario 2
needed one hour less – due to reduced
concurrency of parallel jobs of the same
activity. Usually one activity writes to
a certain set of tables, while the other
activity reads from them. For example,
assuming activity A wants to write to a
table, it has to set locks on certain enti-
ties like data pages. If another job of the
same activity wants to access the same
data page, it has to wait. But if there
are fewer jobs, the likelihood of a wait
goes down and wait time is reduced.
As activity B only wants to read from
the data blocks, it is not affected by the
write lock. So the overall throughput is
higher.
Best Practices and Conclusions
System X5 and SLES 11
During the proof of concept, the IBM
System X5 servers that were used
turned out not to be the limiting fac-
tor. In fact, the processor and memory
utilization was typically in the area of
between 60% and 70% for the ETG
database server. Most likely, an increase
in processor capacity or memory would
not have led to an additional, significant
reduction in runtime.
According to the nmon data, the 1 GB
Ethernet link of the database server
was almost at the limit of its bandwidth.
By bonding two Ethernet cards, the IP
response time could not be reduced
– this is a limitation of the 1 GB architec-
ture. Instead, a 10 GB Ethernet network
is recommended.
Storwize V7000
The proof of concept demonstrated
that the IBM Storwize V7000 is capable
of both handling the given workload
and achieving all KPIs. The detailed
illustrations of performance data in this
section show that when the Storwize
V7000 system was under load, not
all hot data could be placed on SSDs
with the configuration used (24 SSDs).
For the given KPIs, the team recom-
mended a total of three SSD MDGs for
SAPDATA, in a RAID 5, 7+1 configura-
tion, leading to 26 SSDs, including two
spares.

SAP and IBM Demonstrate Capability of Handling High Billing Volume in a Telecommunications Scenario
32
If the team had required further runtime
reduction, they would have had to install
more SSDs – for example: four MDisk
arrays with a RAID 5, 7+1 configura-
tion, plus two spare drives, leading to
34 SSDs in total. It is not necessary to
place LOG files on SSDs. HDDs would
do the work just as well if the team
were to recommend an HDD RAID 10,
8+8 configuration on a separate MDG.
However, during the performance test,
the team was not able to use this con-
figuration, because all available HDDs
were needed to build the required
capacity of 50 TB (online DB and
backup).
The team used the I/O simulation tool
ndisk before the proof of concept was
started – to verify this performance
assumption about the Storwize V7000
system. (For more information about the
nstress tool kit and ndisk, see
www.ibm.com/developerworks/wikis
/display/WikiPtype/nstress.)
Value of Storwize V7000 Virtualization
and Easy Tier
The combination of virtualization and
Easy Tier functionality of Storwize
V7000 eased storage administration
significantly. After setting up the storage
pools, the team needed to tune nothing
else. Also, the combination of these two
functionalities eliminated, by design,
the possibility of storage performance
bottlenecks.
In addition, Storwize V7000 storage
virtualization functionally allowed
changing the physical data placement
of a VDisk (LUN), while keeping the
VDisk (LUN) online. This was done with
just a single command.
Detailed Performance Results
The following section shows the detailed
performance data for the billing run. In
order to display more detailed perfor-
mance data, the information is drawn
from only a 20-minute time span –
selected from a total of more than
10 hours.
HDD-Only Run “Billing”
The following figures show the per-
formance data for the HDD-only run
(SAPDATA placed on HDD).

SAP and IBM Demonstrate Capability of Handling High Billing Volume in a Telecommunications Scenario
33
Figure 18. DB Server File Systems I/O Performance
0
20
40
60
80
100
120
140
160
180
00:0
0:24
00:0
1:24
00:0
2:24
00:0
3:24
00:0
4:24
00:0
5:24
00:0
6:24
00:0
7:24
00:0
8:24
00:0
9:24
00:1
0:24
00:1
1:24
00:1
2:24
00:1
3:24
00:1
4:24
00:1
5:24
00:1
6:24
00:1
7:24
00:1
8:24
00:1
9:24
MB/s
SAPDATA read
SAPDATA write
SAPDATA total
LOG write
File system I/O
Figure 19. DB Server CPU Utilization
0
10
20
30
40
50
60
70
80
90
100
Idle%
Wait%
Sys%
User%
CPU workload
% u
tiliz
atio
n
Figure 20. DB Server Ethernet Performance
0
10
20
30
40
50
60
70
80
MB/s
IP write
IP read
Ethernet I/O

SAP and IBM Demonstrate Capability of Handling High Billing Volume in a Telecommunications Scenario
34
Figure 22. V7000 Log VDisk Performance
0.0
10.0
20.0
30.0
40.0
50.0
60.0
MB/s
LOG write
LOG VDISK throughput
Figure 23. V7000 MDisk I/O Performance
0,0
10,0
20,0
30,0
40,0
50,0
60,0
MB/s
SSD MD LOG write
HDD MD1 read
HDD MD1 write
HDD MD2 read
HDD MD2 write
HDD MD3 read
HDD MD3 write
MDISK throughput
Figure 21. V7000 SAPDATA VDisk Performance
0.0
1.0
2.0
3.0
4.0
5.0
6.0
MB/s
SAPDATA10 readSAPDATA10 writeSAPDATA11 readSAPDATA11 writeSAPDATA12 readSAPDATA12 write
SAPData VDISK throughput

SAP and IBM Demonstrate Capability of Handling High Billing Volume in a Telecommunications Scenario
35
Figure 24. V7000 VDisk I/O Response Times
0
5
10
15
20
25
30
35
msec
LOG write
SAPDATA10 read
SAPDATA10 write
SAPDATA11 read
SAPDATA11 write
SAPDATA12 read
SAPDATA12 write
VDISK I/O response times
Figure 25. V7000 MDisk I/O Response Times
0102030405060708090
100
msec
SDD MD LOG write
HDD MD1 read
HDD MD1 write
HDD MD2 read
HDD MD2 write
HDD MD3 read
HDD MD3 write
MDISK I/O response times
The write and read processes compete
against the HDD resource. If the non-
volatile RAM (NV RAM) gets filled up, the
write gains a higher priority, resulting in
a lower read performance. It is no sur-
prise that all performance figures show
the same utilization characteristics,
either measured through nmon on the
OS or measured through svcmon on
the storage system.
So as not to overload the number of
graphics, the figures above included
just three printouts for SAPDATA
VDisks; likewise, only 3 SAPDATA
MDisks out of 11 are included.

SAP and IBM Demonstrate Capability of Handling High Billing Volume in a Telecommunications Scenario
36
Figure 27. DB Server CPU Workload
0
10
20
30
40
50
60
70
80
90
100
% u
�liza
�on
Idle%
Wait%
Sys%
User%
CPU workload
Figure 28. DB Server Ethernet I/O Performance
0
10
20
30
40
50
60
70
80
90
100
MB/s
IP write
IP read
Ethernet I/O
Figure 26. DB Server File Systems I/O Performance
0
50
100
150
200
250
300
21:0
0:52
21:0
1:52
21:0
2:52
21:0
3:52
21:0
4:52
21:0
5:52
21:0
6:52
21:0
7:52
21:0
8:52
21:0
9:52
21:1
0:52
21:1
1:52
21:1
2:52
21:1
3:52
21:1
4:52
21:1
5:52
21:1
6:52
21:1
7:52
21:1
8:53
21:1
9:53
MB/s
SAPDATA read
SAPDATA write
SAPDATA total
LOG write
File systems I/O
Easy Tier Run “Billing”
The following figures show the perfor-
mance data for the Easy Tier-only run
(SAPDATA placed on HDD and SSD).

SAP and IBM Demonstrate Capability of Handling High Billing Volume in a Telecommunications Scenario
37
Figure 29. V7000 SAPDATA VDisk Performance
0
1
2
3
4
5
6MB/s
SAPDATA 10 read
SAPDATA10 write
SAPDATA 11 read
SAPDATA11 write
SAPDATA 12 read
SAPDATA12 write
SAPDATA VDisk throughput
Figure 30. V7000 Log VDisk Performance
0
10
20
30
40
50
60
70
80
MB/s
LOG write
LOG Disk throughput
Figure 31. V7000 MDisk Performance
0
10
20
30
40
50
60
70
80
MB/s
SSD LOG write
SSD MD1 read
SSD MD1 write
SSD MD2 read
SSD MD2 write
SSD MD3 read
SSD MD3 write
HDD MD4 read
HDD MD4 write
HDD MD5 read
HDD MD5 write
HDD MD6 read
HDD MD6 write
MDisk throughput

SAP and IBM Demonstrate Capability of Handling High Billing Volume in a Telecommunications Scenario
38
Figure 33. V7000 MDisk I/O response times
0
10
20
30
40
50
60
msec
SSD LOG write
SSD MD1 read
SSD MD1 write
SSD MD2 read
SSD MD2 write
SSD MD3 read
SSD MD3 write
HDD MD4 read
HDD MD4 write
HDD MD5 read
HDD MD5 write
HDD MD6 read
HDD MD6 write
MDisk I/O response times
In contrast to the HDD billing run, the
resource utilization of Easy Tier was
almost constant and did not waver.
The read and write processes were
not competing against the storage
resource. Compared to HDD, SSD
technology had no need to spend time
positioning the head over the requested
track. Regardless of what data block
needed to be accessed, the data
access time was always constant with
SSD – less than a millisecond for both
reads and writes.
If data was stored on SSD, then no stor-
age cache was involved, including NV
RAM. Data was read and written to SSD
directly, leading to more available cache
capacity for the remaining data on HDD.
As a result, the resource utilization over
time was constant, and I/O throughput
increased from approximately 140 MB
for HDD-only to 250 MB for the Easy
Tier configuration. There was also a sig-
nificant reduction in I/O response time
for VDisks and MDisks.
From a DB2 perspective, the buffer
pool performance of the average total
physical read time improved impres-
sively by over 60%, due to the better I/O
throughput and response time of the
Easy Tier implementation, compared to
HDD.
Figure 32. V7000 VDisk I/O response times
0
1
2
3
4
5
6
7
msec
LOG write
SAPDATA10 read
SAPDATA10 write
SAPDATA11 read
SAPDATA11 write
SAPDATA12 read
SAPDATA12 write
VDisk response times

SAP and IBM Demonstrate Capability of Handling High Billing Volume in a Telecommunications Scenario
39
This report focuses on the buffer pool
read times because they resulted in
read requests directly to disk, whereas
the write requests were handled by the
cache of the storage subsystem, which
stayed the same for the HDD and Easy
Tier runs. Thus, the write time did not
vary among the tests, whereas the read
times did so heavily, as shown in Figure 34.
MDisk Heat Distribution
The following table shows the heat dis-
tribution of the SAPDATA MDisks, and
the amount of data that was “hot” and
“cool.” This data was collected during
the ET billing run with the IBM Storage
Tier Advisor Tool. (For more information,
see www-304.ibm.com/support
/docview.wss?uid=ssg1S4000935.)
Figure 34. DB2 Buffer Pool Physical Reads
(in Milliseconds) During Billing Runs on HDD and Easy Tier
DB2 buffer pool physical reads (msec) – billing runs
avg_total_reads avg_async_reads avg_sync_reads
0
5.00
10.00
15.00
20.00
25.00
30.00
mse
c
Billing – HDD Billing – ET
24.96
21.41
25.04
9.97
1.19
12.53
Volume ID Configured size Capacity on SSD Heat distribution
0x0027 665.8 G 168.3 G 481.8 G 184.0 G
0x0026 649.5 G 165.8 G 469.0 G 180.5 G
0x0025 647.5 G 161.5 G 470.0 G 177.5 G
0x0024 648.3 G 171.0 G 461.8 G 186.5 G
0x0023 649.8 G 163.3 G 471.0 G 178.8 G
0x0022 651.3 G 170.0 G 465.5 G 185.8 G
0x0021 647.5 G 156.5 G 475.8 G 171.8 G
0x0020 652.0 G 181.8 G 455.3 G 196.8 G
0x001f 653.5 G 162.5 G 475.5 G 178.0 G
0x001e 647.5 G 168.8 G 463.5 G 184.0 G
0x001d 647.5 G 163.3 G 469.3 G 178.3 G
0x001c 650.8 G 171.3 G 463.5 G 187.3 G
0x001b 647.5 G 161.8 G 469.0 G 178.5 G
0x001a 650.3 G 163.8 G 472.0 G 178.3 G
0x0019 649.5 G 148.8 G 485.0 G 164.5 G
0x0018 647.5 G 171.8 G 459.3 G 188.3 G
0x0017 647.5 G 162.0 G 469.5 G 178.0 G
0x0016 650.3 G 166.8 G 467.8 G 182.5 G

SAP and IBM Demonstrate Capability of Handling High Billing Volume in a Telecommunications Scenario
40
0x0015 648.3 G 162.0 G 470.3 G 178.0 G
0x0014 649.3 G 169.8 G 465.3 G 184.0 G
0x0013 649.0 G 153.3 G 480.8 G 168.3 G
0x0012 649.0 G 174.5 G 459.3 G 189.8 G
0x0011 649.0 G 173.5 G 460.5 G 188.5 G
0x0010 647.5 G 180.3 G 450.3 G 197.3 G
0x000f 647.5 G 174.0 G 459.3 G 188.3 G
0x000e 647.5 G 175.3 G 457.5 G 190.0 G
0x000d 649.8 G 171.3 G 463.0 G 186.8 G
0x000c 647.5 G 110.5 G 522.0 G 125.5 G
0x000b 647.5 G 165.0 G 466.3 G 181.3 G
0x000a 647.5 G 165.8 G 465.8 G 181.8 G
0x0009 647.5 G 164.8 G 467.5 G 180.0 G
0x0008 651.0 G 63.8 G 570.5 G 80.5 G
DB2 Configuration Parameters
for Run ET4
DB2 Registry (db2set -all)
[e] DB2DBDFT=ETL
[i] DB2_RESTORE_GRANT_ADMIN_AUTHORITIES=YES [DB2_WORKLOAD]
[i] DB2_BLOCKING_WITHHOLD_LOBLOCATOR=NO [DB2_WORKLOAD]
[i] DB2_AGENT_CACHING_FMP=OFF [DB2_WORKLOAD]
[i] DB2_TRUST_MDC_BLOCK_FULL_HINT=YES [DB2_WORKLOAD]
[i] DB2_CREATE_INDEX_COLLECT_STATS=YES [DB2_WORKLOAD]
[i] DB2_ATS_ENABLE=YES [DB2_WORKLOAD]
[i] DB2_RESTRICT_DDF=YES [DB2_WORKLOAD]
[i] DB2_DUMP_SECTION_ENV=YES [DB2_WORKLOAD]
[i] DB2_OPT_MAX_TEMP_SIZE=10240 [DB2_WORKLOAD]
[i] DB2_USE_FAST_PREALLOCATION=OFF
[i] DB2_WORKLOAD=SAP
[i] DB2_TRUNCATE_REUSESTORAGE=IMPORT [DB2_WORKLOAD]
[i] DB2_MDC_ROLLOUT=DEFER [DB2_WORKLOAD]
[i] DB2_ATM_CMD_LINE_ARGS=-include-manual-tables [DB2_WORKLOAD]
[i] DB2_SKIPINSERTED=YES [DB2_WORKLOAD]
[i] DB2_VIEW_REOPT_VALUES=YES [DB2_WORKLOAD]
[i] DB2_OBJECT_TABLE_ENTRIES=65532 [DB2_WORKLOAD]
[i] DB2_OPTPROFILE=YES [DB2_WORKLOAD]
[i] DB2_USE_ALTERNATE_PAGE_CLEANING=ON
[i] DB2_IMPLICIT_UNICODE=YES [DB2_WORKLOAD]
[i] DB2STMM=APPLY_HEURISTICS:YES [DB2_WORKLOAD]
[i] DB2_INLIST_TO_NLJN=YES [DB2_WORKLOAD]

SAP and IBM Demonstrate Capability of Handling High Billing Volume in a Telecommunications Scenario
41
[i] DB2_MINIMIZE_LISTPREFETCH=YES [DB2_WORKLOAD]
[i] DB2_REDUCED_OPTIMIZATION=4,INDEX,JOIN,NO_TQ_FACT,NO_HSJN_BUILD_FACT,
STARJN_CARD_SKEW,NO_SORT_MGJOIN,CART OFF,CAP OFF [DB2_WORKLOAD]
[i] DB2NOTIFYVERBOSE=YES [DB2_WORKLOAD]
[i] DB2TERRITORY=1
[i] DB2_INTERESTING_KEYS=YES [DB2_WORKLOAD]
[i] DB2_EVALUNCOMMITTED=YES [DB2_WORKLOAD]
[i] DB2_LOGGER_NON_BUFFERED_IO=ON
[i] DB2_EXTENDED_OPTIMIZATION=NLJOIN_KEYCARD,IXOR [DB2_WORKLOAD]
[i] DB2_ANTIJOIN=EXTEND [DB2_WORKLOAD]
[i] DB2COMPOPT=327685,131776 [DB2_WORKLOAD]
[i] DB2ATLD_PORTS=60000:65000
[i] DB2ENVLIST=INSTHOME SAPSYSTEMNAME dbs_db6_schema DIR_LIBRARY LD_LIBRARY_PATH
[i] DB2COMM=TCPIP [DB2_WORKLOAD]
[i] DB2_PARALLEL_IO=*:2
[g] DB2FCMCOMM=TCPIP4
[g] DB2SYSTEM=coe-he-16
[g] DB2INSTDEF=db2etl
Database Manager Configuration (db2 get dbm cfg)
Database Manager Configuration
Node type Enterprise Server Edition
Database manager configuration release level 0x0d00
CPU speed (millisec/instruction) (CPUSPEED) 2,68E-01
Communications bandwidth (MB/sec) (COMM_BANDWIDTH) 1,00E+08
Max number of concurrently active databases (NUMDB) 8
Federated Database System Support (FEDERATED) NO
Transaction processor monitor name (TP_MON_NAME)
Default charge-back account (DFT_ACCOUNT_STR)
Java Development Kit installation path (JDK_PATH) /db2/db2etl/sqllib/
Diagnostic error capture level (DIAGLEVEL) 3
Notify Level (NOTIFYLEVEL) 3
Diagnostic data directory path (DIAGPATH) /db2/ETL/db2dump
Size of rotating db2diag & notify logs (MB) DIAGSIZE) 1000
Default database monitor switches
Buffer pool (DFT_MON_BUFPOOL) ON
Lock (DFT_MON_LOCK) ON
Sort (DFT_MON_SORT) ON
Statement (DFT_MON_STMT) ON
Table (DFT_MON_TABLE) ON
Timestamp (DFT_MON_TIMESTAMP) ON
Unit of work (DFT_MON_UOW) ON
Monitor health of instance and databases (HEALTH_MON) OFF
SYSADM group name (SYSADM_GROUP) DBETLADM
SYSCTRL group name (SYSCTRL_GROUP) DBETLCTL

SAP and IBM Demonstrate Capability of Handling High Billing Volume in a Telecommunications Scenario
42
SYSMAINT group name (SYSMAINT_GROUP) DBETLMNT
SYSMON group name (SYSMON_GROUP) DBETLMON
Client Userid-Password Plugin (CLNT_PW_PLUGIN)
Client Kerberos Plugin (CLNT_KRB_PLUGIN)
Group Plugin (GROUP_PLUGIN)
GSS Plugin for Local Authorization (LOCAL_GSSPLUGIN)
Server Plugin Mode (SRV_PLUGIN_MODE) UNFENCED
Server List of GSS Plugins (SRVCON_GSSPLUGIN_LIST)
Server Userid-Password Plugin (SRVCON_PW_PLUGIN)
Server Connection Authentication (SRVCON_AUTH) NOT_SPECIFIED
Cluster manager (CLUSTER_MGR)
Database manager authentication (AUTHENTICATION) SERVER_ENCRYPT
Alternate authentication (ALTERNATE_AUTH_ENC) NOT_SPECIFIED
Cataloging allowed without authority (CATALOG_NOAUTH) NO
Trust all clients (TRUST_ALLCLNTS) YES
Trusted client authentication (TRUST_CLNTAUTH) CLIENT
Bypass federated authentication (FED_NOAUTH) NO
Default database path (DFTDBPATH) /db2/ETL
Database monitor heap size (4KB) (MON_HEAP_SZ) AUTOMATIC(90)
Java Virtual Machine heap size (4KB) (JAVA_HEAP_SZ) 2048
Audit buffer size (4KB) (AUDIT_BUF_SZ) 0
Size of instance shared memory (4KB) (INSTANCE_MEMORY) 8192000
Backup buffer default size (4KB) (BACKBUFSZ) 1024
Restore buffer default size (4KB) (RESTBUFSZ) 1024
Agent stack size (AGENT_STACK_SZ) 1024
Sort heap threshold (4KB) (SHEAPTHRES) 0
Directory cache support (DIR_CACHE) NO
Application support layer heap size (4KB) (ASLHEAPSZ) 16
Max requester I/O block size (bytes) (RQRIOBLK) 65000
Query heap size (4KB) (QUERY_HEAP_SZ) 1000
Workload impact by throttled utilities(UTIL_IMPACT_LIM) 10
Priority of agents (AGENTPRI) SYSTEM
Agent pool size (NUM_POOLAGENTS) AUTOMATIC(100)
Initial number of agents in pool (NUM_INITAGENTS) 5
Max number of coordinating agents (MAX_COORDAGENTS) AUTOMATIC(200)
Max number of client connections (MAX_CONNECTIONS) AUTOMATIC(MAX_COORDAGENTS)
Keep fenced process (KEEPFENCED) NO
Number of pooled fenced processes (FENCED_POOL) AUTOMATIC(MAX_COORDAGENTS)
Initial number of fenced processes (NUM_INITFENCED) 0
Index re-creation time and redo index build (INDEXREC) RESTART
Transaction manager database name (TM_DATABASE) 1ST_CONN
Transaction resync interval (sec) (RESYNC_INTERVAL) 180
SPM name (SPM_NAME)
SPM log size (SPM_LOG_FILE_SZ) 256
SPM resync agent limit (SPM_MAX_RESYNC) 20
SPM log path (SPM_LOG_PATH)

SAP and IBM Demonstrate Capability of Handling High Billing Volume in a Telecommunications Scenario
43
TCP/IP Service name (SVCENAME) sapdb2ETL
Discovery mode (DISCOVER) SEARCH
Discover server instance (DISCOVER_INST) ENABLE
SSL server keydb file (SSL_SVR_KEYDB)
SSL server stash file (SSL_SVR_STASH)
SSL server certificate label (SSL_SVR_LABEL)
SSL service name (SSL_SVCENAME)
SSL cipher specs (SSL_CIPHERSPECS)
SSL versions (SSL_VERSIONS)
SSL client keydb file (SSL_CLNT_KEYDB)
SSL client stash file (SSL_CLNT_STASH)
Maximum query degree of parallelism (MAX_QUERYDEGREE) ANY
Enable intra-partition parallelism (INTRA_PARALLEL) NO
Maximum Asynchronous TQs per query (FEDERATED_ASYNC) 0
No. of int. communication buffers(4KB)(FCM_NUM_BUFFERS) AUTOMATIC(4096)
No. of int. communication channels (FCM_NUM_CHANNELS) AUTOMATIC(2048)
Node connection elapse time (sec) (CONN_ELAPSE) 10
Max number of node connection retries (MAX_CONNRETRIES) 5
Max time difference between nodes (min) (MAX_TIME_DIFF) 60
db2start/db2stop timeout (min) (START_STOP_TIME) 10
Database Configuration (db2 get db cfg for etl)Database Configuration for Database ETL
Database configuration release level 0x0d00
Database release level 0x0d00
Database territory en_US
Database code page 1208
Database code set UTF-8
Database country/region code 1
Database collating sequence IDENTITY_16BIT
Number compatibility OFF
Varchar2 compatibility OFF
Date compatibility OFF
Database page size 16384
Dynamic SQL Query management (DYN_QUERY_MGMT) DISABLE
Statement concentrator (STMT_CONC) OFF
Discovery support for this database (DISCOVER_DB) ENABLE
Restrict access NO
Default query optimization class (DFT_QUERYOPT) 5
Degree of parallelism (DFT_DEGREE) ANY
Continue upon arithmetic exceptions (DFT_SQLMATHWARN) NO
Default refresh age (DFT_REFRESH_AGE) 0
Default maintained table types for opt (DFT_MTTB_TYPES) SYSTEM
Number of frequent values retained (NUM_FREQVALUES) 10
Number of quantiles retained (NUM_QUANTILES) 20
Decimal floating point rounding mode (DECFLT_ROUNDING) ROUND_HALF_EVEN
Backup pending NO

SAP and IBM Demonstrate Capability of Handling High Billing Volume in a Telecommunications Scenario
44
All committed transactions have been written to disk NO
Rollforward pending NO
Restore pending NO
Multi-page file allocation enabled YES
Log retain for recovery status NO
User exit for logging status NO
Self tuning memory (SELF_TUNING_MEM) ON
Size of database shared memory (4KB) (DATABASE_MEMORY) AUTOMATIC(6993738)
Database memory threshold (DB_MEM_THRESH) 10
Max storage for lock list (4KB) (LOCKLIST) AUTOMATIC(422112)
Percent. of lock lists per application (MAXLOCKS) AUTOMATIC(97)
Package cache size (4KB) (PCKCACHESZ) AUTOMATIC(128005)
Sort heap thres for shared sorts (4KB) (SHEAPTHRES_SHR) AUTOMATIC(113636)
Sort list heap (4KB) (SORTHEAP) AUTOMATIC(22727)
Database heap (4KB) (DBHEAP) AUTOMATIC(3745)
Catalog cache size (4KB) (CATALOGCACHE_SZ) 2560
Log buffer size (4KB) (LOGBUFSZ) 16384
Utilities heap size (4KB) (UTIL_HEAP_SZ) 10000
Buffer pool size (pages) (BUFFPAGE) 10000
SQL statement heap (4KB) (STMTHEAP) AUTOMATIC(8192)
Default application heap (4KB) (APPLHEAPSZ) AUTOMATIC(256)
Application Memory Size (4KB) (APPL_MEMORY) AUTOMATIC(40000)
Statistics heap size (4KB) (STAT_HEAP_SZ) AUTOMATIC(4384)
Interval for checking deadlock (ms) (DLCHKTIME) 10000
Lock timeout (sec) (LOCKTIMEOUT) 3600
Changed pages threshold (CHNGPGS_THRESH) 40
Number of asynchronous page cleaners (NUM_IOCLEANERS) AUTOMATIC(31)
Number of I/O servers (NUM_IOSERVERS) 64
Index sort flag (INDEXSORT) YES
Sequential detect flag (SEQDETECT) YES
Default prefetch size (pages) (DFT_PREFETCH_SZ) AUTOMATIC
Track modified pages (TRACKMOD) ON
Default number of containers 1
Default tablespace extentsize (pages) (DFT_EXTENT_SZ) 2
Max number of active applications (MAXAPPLS) AUTOMATIC(408)
Average number of active applications (AVG_APPLS) AUTOMATIC(3)
Max DB files open per application (MAXFILOP) 61440
Log file size (4KB) (LOGFILSIZ) 128000
Number of primary log files (LOGPRIMARY) 150
Number of secondary log files (LOGSECOND) 50
Path to log files /db2/ETL/log_dir /NODE0000/
Overflow log path (OVERFLOWLOGPATH)
Mirror log path (MIRRORLOGPATH)
First active log file
Block log on disk full (BLK_LOG_DSK_FUL) YES
Block non logged operations (BLOCKNONLOGGED) NO
Percent max primary log space by transaction (MAX_LOG) 0

SAP and IBM Demonstrate Capability of Handling High Billing Volume in a Telecommunications Scenario
45
Num. of active log files for 1 active UOW(NUM_LOG_SPAN) 50
Group commit count (MINCOMMIT) 1
Percent log file reclaimed before soft chckpt (SOFTMAX) 300
Log retain for recovery enabled (LOGRETAIN) OFF
User exit for logging enabled (USEREXIT) OFF
HADR database role STANDARD
HADR local host name (HADR_LOCAL_HOST)
HADR local service name (HADR_LOCAL_SVC)
HADR remote host name (HADR_REMOTE_HOST)
HADR remote service name (HADR_REMOTE_SVC)
HADR instance name of remote server (HADR_REMOTE_INST)
HADR timeout value (HADR_TIMEOUT) 120
HADR log write synchronization mode (HADR_SYNCMODE) NEARSYNC
HADR peer window duration (seconds) (HADR_PEER_WINDOW) 0
First log archive method (LOGARCHMETH1) OFF
Options for logarchmeth1 (LOGARCHOPT1)
Second log archive method (LOGARCHMETH2) OFF
Options for logarchmeth2 (LOGARCHOPT2)
Failover log archive path (FAILARCHPATH)
Number of log archive retries on error (NUMARCHRETRY) 5
Log archive retry Delay (secs) (ARCHRETRYDELAY) 20
Vendor options (VENDOROPT)
Auto restart enabled (AUTORESTART) ON
Index re-creation time and redo index build (INDEXREC) SYSTEM (RESTART)
Log pages during index build (LOGINDEXBUILD) OFF
Default number of loadrec sessions (DFT_LOADREC_SES) 1
Number of database backups to retain (NUM_DB_BACKUPS) 12
Recovery history retention (days) (REC_HIS_RETENTN) 60
Auto deletion of recovery objects (AUTO_DEL_REC_OBJ) OFF
TSM management class (TSM_MGMTCLASS)
TSM node name (TSM_NODENAME)
TSM owner (TSM_OWNER)
TSM password (TSM_PASSWORD)
Automatic maintenance (AUTO_MAINT) ON
Automatic database backup (AUTO_DB_BACKUP) OFF
Automatic table maintenance (AUTO_TBL_MAINT) ON
Automatic runstats (AUTO_RUNSTATS) ON
Automatic statement statistics (AUTO_STMT_STATS)
ON
Automatic statistics profiling (AUTO_STATS_PROF) OFF
Automatic profile updates (AUTO_PROF_UPD) OFF
Automatic reorganization (AUTO_REORG) OFF
Auto-Revalidation (AUTO_REVAL) DEFERRED
Currently Committed (CUR_COMMIT) ON
CHAR output with DECIMAL input (DEC_TO_CHAR_FMT) NEW
Enable XML Character operations (ENABLE_XMLCHAR) YES
WLM Collection Interval (minutes) (WLM_COLLECT_INT) 0

SAP and IBM Demonstrate Capability of Handling High Billing Volume in a Telecommunications Scenario
46
Monitor Collect Settings
Request metrics (MON_REQ_METRICS) BASE
Activity metrics (MON_ACT_METRICS) NONE
Object metrics (MON_OBJ_METRICS) BASE
Unit of work events (MON_UOW_DATA) NONE
Lock timeout events (MON_LOCKTIMEOUT) WITHOUT_HIST
Deadlock events (MON_DEADLOCK) WITHOUT_HIST
Lock wait events (MON_LOCKWAIT) NONE
Lock wait event threshold (MON_LW_THRESH) 5000000
Number of package list entries (MON_PKGLIST_SZ) 32
Lock event notification level (MON_LCK_MSG_LVL) 1
SMTP Server (SMTP_SERVER)
SQL conditional compilation flags (SQL_CCFLAGS)
Section actuals setting (SECTION_ACTUALS) NONE
Connect procedure (CONNECT_PROC)
SAP Convergent Invoicing Key Tables
Load tables: /1FE/0LT0xxIT
Billing tables: /1FE/0LT0xxIT00
Other large tables DFKKCOH, DFKKCOHI DFKKINVDOC_H, DFKKINVDOC_I, DFKKINVDOC_P, DFKKINVDOC_S DFKKKO, DFKKOP, DFKKOPK DFKKSUMC DFKKINVBILL_H, DFKKINVBILL_I, DFKKINVBILL_S

SAP and IBM Demonstrate Capability of Handling High Billing Volume in a Telecommunications Scenario
47
Row Compression Results for the Largest SAP Convergent Invoicing Tables
Table + index
– uncompressed
Table + index – compressed Table compressed Index compressed
Table name
Total
size
(KB)
Total
savings
(GB)
Total
savings
(%)
Data
size
(GB)
Data
saved
(GB)
Data
saved
(%)
Index
size
(GB)
Index
saved
(GB)
Index
saved
(%)
/1FE/0LT022IT 1.421 829 592 42 582 313 35 247 279 53
/1FE/0LT084IT00 612 252 361 59 213 319 60 39 42 52
/1FE/0LT094IT00 607 249 357 59 211 316 60 39 42 52
/1FE/0LT134IT00 605 249 357 59 210 315 60 39 41 52
/1FE/0LT104IT00 605 249 356 59 210 315 60 39 42 52
/1FE/0LT154IT00 602 247 354 59 209 314 60 38 41 52
/1FE/0LT004IT00 614 247 367 60 208 325 61 39 42 52
/1FE/0LT144IT00 612 246 366 60 208 325 61 38 41 52
/1FE/0LT184IT00 610 245 365 60 206 323 61 39 42 52
/1FE/0LT114IT00 609 245 364 60 206 323 61 39 41 52
/1FE/0LT194IT00 607 244 363 60 206 321 61 39 42 52
/1FE/0LT124IT00 605 243 361 60 205 320 61 39 41 52
/1FE/0LT012IT 903 241 662 73 137 391 74 104 271 72
/1FE/0LT164IT00 611 240 371 61 202 329 62 38 42 52
/1FE/0LT174IT00 614 236 378 62 198 336 63 39 42 52
/1FE/0LT024IT00 614 236 378 62 197 336 63 39 42 52
/1FE/0LT014IT00 612 225 387 63 186 346 65 39 42 52
Sum 11,463 4,724 59

SAP and IBM Demonstrate Capability of Handling High Billing Volume in a Telecommunications Scenario
48
Resources
SAP for Telecommunications and SAP Convergent Invoicing:
www.sap.com/industries/telecom/businessprocesses/invoicing/index.epx
nmon Linux OS performance monitoring tool:
www.ibm.com/developerworks/aix/library/au-analyze_aix
svcmon performance monitoring tool for Storwize V7000 / SVC:
www-03.ibm.com/support/techdocs/atsmastr.nsf/WebIndex/PRS3177
ndisk (nstress) I/O simulation tool:
www.ibm.com/developerworks/wikis/display/WikiPtype/nstress
www.ibm.com/developerworks/mydeveloperworks/blogs/svcmon/?lang=ja
IBM Storage Advisor Tool:
www-304.ibm.com/support/docview.wss?uid=ssg1S4000935
DB2 9.7 Information Center:
http://publib.boulder.ibm.com/infocenter/db2luw/v9r7/index.jsp
DB2 9.7 Information Center (db2top):
http://publib.boulder.ibm.com/infocenter/db2luw/v9r5/index.jsp?topic=%2Fcom.
ibm.db2.luw.admin.cmd.doc%2Fdoc%2Fr0025222.html
DB2 for Linux, UNIX, and Microsoft Windows on SAP Developer Network (SDN):
www.sdn.sap.com/irj/sdn/db6
IBM APAR IC76792:
ibm.com/support/docview.wss?uid=swg21502430
IBM Developer Works - Distributed DBA: Storage, I/O, and DB2
(DB2_PARALLEL_IO):
ibm.com/developerworks/data/library/dmmag/DBMag_2009_Issue1/DBMag_
Issue109_DistributedDBA/index.html

SAP and IBM Demonstrate Capability of Handling High Billing Volume in a Telecommunications Scenario
49
IBM Developer Works – DB2 tuning tips for OLTP applications:
ibm.com/developerworks/data/library/techarticle/anshum/0107anshum.
html#logbuffersize
IBM E-Book SAP DBA Cockpit – Flight Plans for DB2 LUW Administrator:
http://public.dhe.ibm.com/common/ssi/ecm/en/imm14052usen/IMM14052USEN.PDF
Article on SAP SDN: The Evolution of the Memory Model in IBM DB2 LUW by
Johannes Heinrich:
sdn.sap.com/irj/scn/index?rid=/library/uuid/b0aabcc9-afc1-2a10-5091-b5cda33036b0
SAP Notes:
Note 1351160 – DB6: Using DB2 9.7 with SAP Software
Note 1329179 – DB6: DB2 V9.7 Standard Parameter Settings
Note 1603507 – DB6: AdHoc Analysis Tool for DB6

50

51

© Copyright IBM Corporation 2012 . All rights Reserved.
References in this document to IBM products or services do not imply that IBM intends to make them available in every country.
IBM, the IBM logo, and ibm.com are trademarks or registered trademarks of International Business Machines Corporation in the United States, other countries, or both. If these and other IBM trademarked terms are marked on their first occurrence in this information with a trademark symbol (® or ™), these symbols indicate U.S. registered or common law trademarks owned by IBM at the time this information was published. Such trademarks may also be registered or common law trademarks in other countries. A current list of IBM trademarks is available on the Web at “Copyright and trademark information” at www.ibm.com/legal/copytrade.shtml.
SAP, SAP NetWeaver , and SAP logos are trademarks or registered trademarks of SAP and/or its affiliates.
Java and all Java-based trademarks and logos are trademarks or registered trademarks of Oracle and/or its affiliates.
Microsoft, Windows, Windows NT, and the Windows logo are trademarks of Microsoft Corporation in the United States, other countries, or both.
Intel, Intel Inside (logos), MMX, and Pentium are trademarks of Intel Corporation in the United States, other countries, or both.
UNIX is a registered trademark of The Open Group in the United States and other countries.
Linux is a trademark of Linus Torvalds in the United States, other countries, or both.
SET and the SET Logo are trademarks owned by SET Secure Electronic Transaction LLC.
Other company, product, or service names may be trademarks or service marks of others.
Information is provided “AS IS” without warranty of any kind.
All customer examples described are presented as illustrations of how those customers have used IBM products and the results they may have achieved. Actual environmental costs and performance characteristics may vary by customer.
Information concerning non-IBM products was obtained from a supplier of these products, published announcement material, or other publicly available sources and does not constitute an endorsement of such products by IBM. Sources for non-IBM list prices and performance numbers are taken from publicly available information, including vendor announcements and vendor worldwide homepages. IBM has not tested these products and cannot confirm the accuracy of performance, capability, or any other claims related to non-IBM products. Questions on the capability of non-IBM products should be addressed to the supplier of those products.
All statements regarding IBM future direction and intent are subject to change or withdrawal without notice, and represent goals and objectives only. Contact your local IBM office or IBM authorized reseller for the full text of the specific Statement of Direction.
© 2012 by SAP. All rights reserved.
SAP, R/3, SAP NetWeaver, Duet, PartnerEdge, ByDesign, SAP BusinessObjects Explorer, StreamWork, SAP HANA, and other SAP products and services mentioned herein as well as their respective logos are trademarks or registered trademarks of SAP AG in Germany and other countries.
Business Objects and the Business Objects logo, BusinessObjects, Crystal Reports, Crystal Decisions, Web Intelligence, Xcelsius, and other Business Objects products and services mentioned herein as well as their respective logos are trademarks or registered trademarks of Business Objects Software Ltd. Business Objects is an SAP company.
Sybase and Adaptive Server, iAnywhere, Sybase 365, SQL Anywhere, and other Sybase products and services mentioned herein as well as their respective logos are trademarks or registered trademarks of Sybase Inc. Sybase is an SAP company.
Crossgate, m@gic EDDY, B2B 360°, and B2B 360° Services are registered trademarks of Crossgate AG in Germany and other countries. Crossgate is an SAP company.
All other product and service names mentioned are the trademarks of their respective companies. Data contained in this document serves informational purposes only. National product specifications may vary.
These materials are subject to change without notice. These materials are provided by SAP AG and its affiliated companies (“SAP Group”) for informational purposes only, without representation or warranty of any kind, and SAP Group shall not be liable for errors or omissions with respect to the materials. The only warranties for SAP Group products and services are those that are set forth in the express warranty statements accompanying such products and services, if any. Nothing herein should be construed as constituting an additional warranty.
Some information addresses anticipated future capabilities. Such information is not intended as a definitive statement of a commitment to specific levels of performance, function or delivery schedules with respect to any future products. Such commitments are only made in IBM product announcements. The information is presented here to communicate IBM’s current investment and development activities as a good faith effort to help with our customers’ future planning.
Performance is based on measurements and projections using standard IBM benchmarks in a controlled environment. The actual throughput or performance that any user will experience will vary depending upon considerations such as the amount of multiprogramming in the user’s job stream, the I/O configuration, the storage configuration, and the workload processed. Therefore, no assurance can be given that an individual user will achieve throughput or performance improvements equivalent to the ratios stated here.
Photographs shown are of engineering prototypes. Changes may be incorporated in production models.
Any references in this information to non-IBM Web sites are provided for convenience only and do not in any manner serve as an endorsement of those Web sites. The materials at those Web sites are not part of the materials for this IBM product and use of those Web sites is at your own risk.
[The following specific IBM trademarks appeared in the text of the original draft]
IBM System i®
IBM System x® X5 server
IBM System z®
IBM Storwize® V7000
IBM DB2®
SUSE® Linux® Enterprise Server
IBM Easy Tier®
Enterprise X-Architecture®
IBM System Storage® SAN Volume Controller
IBM DB2 pureScale®
FlashCopy®
IBM BladeCenter®
Tivoli®