Embed Size (px)
Citation preview
Fakulta informa.ky Paneurópskej vysokej školy
Študentská vedecká a odborná činnosť
Názov: NÁVRH WEBOVEJ STRÁNKY PRE INTERAKTÍVNE ZOBRAZOVANIE ŠTATISTICKÝCH KRIMINOLOGICKÝCH DÁT
Meno: MarOn Puškáč
máj 2013
IntroductionCriminal statistical data are crucial for police forces around the world as these are used
to predict growth of crime over the time, organize limited police resources for covering risky
areas, compare criminality against other factors such as unemployment, population growth or
location. Statistical data with support of behavioral model psychology may also serve as a
background for predicting future crimes committed by searched offenders or to uncover their
location.
Success and requirements of police forces may be also measured by these information
and better be fulfilled and rewarded.
These data must be available at any time and on a lot of devices to all members of
police forces and their respective directors so they can operate fast and precisely. The massive
amount of data that are stored with each case have to be digitized. securely stored and
analyzed. Analysis could be done by advanced applications using modern technologies and
support from computing power of latest servers and cloud services.
Having analyzed criminal statistical data on its own is not enough, we need to have
access to them in a way that every member of police forces could understand and provides
information that the person actually needs. With many different devices these days, using
modern web technologies seems like a good way to showcase the data and support a lot of
these devices with minimal support for many different platforms.
Such applications are already implemented in various stages around the world, but
mostly in the Great Britain that was one of the first, if not the first, to start using such
applications and even allowed them for public use. Another adopter of web application for
showcasing criminal statistical data are United States that are actually running a few separate
portals and some are even operated by private companies.
In my bachelor thesis I would like to discuss the exploitation of criminal statistical data
and the options for deployment of application functionality in real life. The theory discussed

in my thesis should be supported by me having coded the web application which integrates
some basic functionality.
The web application is coded using open source technologies and programming
languages to minimize the cost and maximize the security, support and maintainability.
I believe that my bachelor thesis and web application could help our criminal forces as
it is or that it can be used as a guideline for building their own solution to further improve
their work and help to protect our society.
1 The current state of the fieldAs I already mentioned in my introduction there already are a few web portals operated
either by police departments or private companies that provide functionality I would like to
discuss in my bachelor thesis.
During my research for this thesis I also found mentions of a few privately developed
applications for police departments around the world but mostly in United States with specific
functionality required by the clients. I was not able to further examine these applications as
they are not available to the public.
By exploring publicly available applications and provided information about privately
developed applications I was able to find out that none of these applications are build by a
standard or at least a set of rules for building such applications. There is not even standardized
format for exchanging criminal statistical data.
Our police departments does not have any applications that support mentioned statistical
and analytical functionalities. Most of the data such as testimonies and findings are stored as
plain text documents and as printed documents in file cabinets. Lot of police officers keeps
their private table sheets with statistics about their own cases, but all of them use their own
rules and set of data for creating these sheets and do not share them with other colleagues.
This makes the data mostly uncategorized, there are no easily visible connections and
relations between different cases and offenders, searching is practically missing and so is
sharing between different departments around the country. Availability of the data to police
officers in field is non-existent.
As we can easily suggest, paper documents and private table sheets does not provide a
good base for any analysis or statistics and they slow down work progress and success rate.
All publicly available web applications for interactive display of criminal statistical data
follow the same pattern in organizing and representing these data. All researched web
applications provide the user with map of the requested state or city with options to render
criminality heat maps, which is a graphical representation of data where the individual values
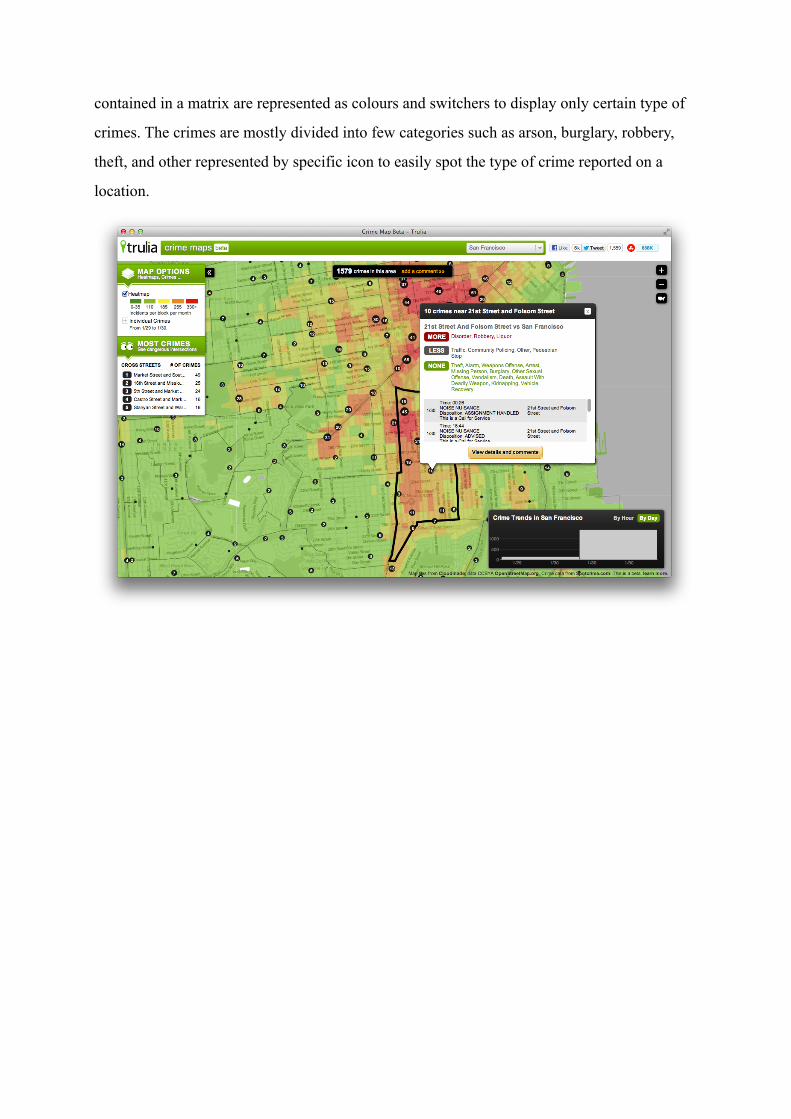
contained in a matrix are represented as colours and switchers to display only certain type of
crimes. The crimes are mostly divided into few categories such as arson, burglary, robbery,
theft, and other represented by specific icon to easily spot the type of crime reported on a
location.
2 Design and architecture of solutionIn this part of my bachelor thesis I would like to discuss design and architecture of the
whole solution beginning with describing functionality requirements from the point of process
architecture view and continuing with server and client side technology where I would like to
discuss hardware and software required for our application and at last but not least describe a
few interesting parts of the application with source code so the reader can better understand
the inner workings.
2.1 IntroductionWeb application for displaying interactive criminal statistical data consists of a server
side and a client side application. There is definitely a need for this structure as does not only
need to display statistical data, but also parse them from many different sources such as XML,
spreadsheets or direct input through administration interface. These data need to be
categorized and stored in a way that analysis are possible to make and client side application
will be able to display them in a proper way. Server side part of the application should be also
responsible for automatic computational based analytics that should support future crime
predictions.
The division into server a side application and a client side application is needed for
more a responsive communication and faster access to the data stored. Server side application
might also be more performance insufficient as analysis might become very complex. This
division allows us to provide fast and responsive applications, as the clients side will not be
directly dependent on the performance of the server side.
Client side application should be responsible for displaying processed data in a very
clean and self explanatory way, availability to search through data sets and display these
results in various ways from table listings of cases through graphs displaying various
variables to detailed overview of a specific case. Users of the application should also be able
to add new data through easy to use forms with support to attach multimedia files and connect
individual cases to larger sets for example for tracking organized crime.
Additional functionality that needs to be covered is user management with role based
access control.
2.2 Process architectureResearching targets of our application we have identified following processes:
- storing case data - such as case number, case description containing information about
suspects, locations of events and timeframes
- searching database - for case files, events and people involved in cases
- filtering and comparing - of case files, events and people involved in cases
- providing statistics reports from filtered results in various ways such as heat maps based on
country map, statistical tables and graphs to easily display compared data
- exports based on filtered data
- user management defining user access rights
Not all of these featured were implemented in initial application solution although they
are described in this thesis how they should be implemented and work.
2.2.3 Storing case data
For our application to work we need to fill it with data about cases and events that are
connected to these cases. This process consists of a few required subprocess such as inserting
data, editing data, deleting and sorting data.
2.2.4 Searching database
As users of our application might need to search for a specific case or set of data we
need to provide a keyword or keywords based search. As an output of such a search user gets
a list of results that match the selected criteria and are displayed in various possible ways such
as points on interactive map or data tables that can be transformed into dynamic charts. In our
application users can search in titles of cases and case numbers.
2.2.5 Filtering and comparing
For statistical analysis search is not always sufficient in cases we need to compare sets
of results that are output of different search criteria. Users of our application get the option to
filter the data by different variables such as timeframes, location, type of criminality or people
involved in cases. Filter results can be displayed in similar ways as search results but they
include comparison data and not just plain search results without any connection between
each other.
2.2.6 Exports
Providing our users with search and filtering tools is great for displaying quick
overviews but is unable to provide sustainable outputs that can be shared with public or as
reports. Export functionality that will allow our users to save their search and filter results as
pdf or excel files to store locally or share with people that do not have direct access to the
application such as news agents.
2.2.7 User management
User management is very important for right functionality of the application as we need
to know who has the right to view, add, edit or delete records. Administrators of the
application need to be able to create, edit and delete user accounts and define accessing rights
for groups of users or specific user only. We also need to support processes like login and
logout of allowed users.
2.2 Server side technologyServer side application consists of several software technologies and systems to cover
all of the functionality described earlier. These technologies must provide good performance,
stability, security and scalability in case of extending the system and increasing the overall
performance by supporting concurrent data manipulation across multiple servers or cloud
services. In the next few pages I would like to discuss available solutions that are mostly open
source that can be used in various parts of our application.
Web server is a combination of hardware and software that helps to deliver Web content
that can be accessed through the Internet. For this bachelor thesis we will focus only on the
software part of the solution.
2.2.1 Operating system
As our operating system to run on servers I have chosen Linux which is a Unix-like
computer operating system assembled under the model of free and open source software
development and distribution. This operating system usually offers very good overall stability
and is widely supported by many hosting providers. It’s security is one of the best and there
are many professional administrators available on the market. Other great advantage is it’s
easy scalability and price as most of the distributions are available as open source and are
therefor free. Linux distributions in general provide good software coverage, support of many
programming languages and database engines.
As of disadvantages of linux based server the required knowledge for administrating
such server is much higher than in using Windows or OSX server and there is no official
support for many distributions, but commercial distributions or distributions with available
commercial support.
2.2.2 Database
As our system needs to work with data, we need to store them somehow. The best way
is to store these data in some kind of database. I will be working with large amount of
information with special subset of geographic data. This reflects in a need of robust database
engine with support for such specific data. Spatial database is specific by exposing some
advanced spatial operations such as calculating distance between geographical points, allows
for saving vertices and querying database in specific ways like asking for occurrence of an
object in specified area.
I was choosing between NoSQL database and standard MySQL database.
“A NoSQL database provides a mechanism for storage and retrieval of data that use
looser consistency models than traditional relational databases in order to achieve horizontal
scaling and higher availability. Some authors refer to them as "Not only SQL" to emphasize
that some NoSQL systems do allow SQL-like query language to be used.
NoSQL database systems are often highly optimized for retrieval and appending
operations and often offer little functionality beyond record storage (e.g. key–value stores).
The reduced run-time flexibility compared to full SQL systems is compensated by marked
gains in scalability and performance for certain data models.”1
NoSQL databases that support geospatial data include MongoDB2 (open source),
Cassandra3 (open source maintained by Apache) and CouchDB4 (open source, Apache).
In the early stages of programming my bachelor thesis I used MongoDB as my database
of choice. MongoDB is a noSQL database as I mentioned earlier with good documentation, it
was easy to install and run and had to have great support for geospatial data. I was able to
connect to the database from my application successfully and I even created a few testing
data. Everything went just fine until I populated the database with around two thousand
records which made it stop communicating with my application and I was not able to figure
out why I always got empty results. These problems with larger scale of records and finding
out that there is no easy way to use joins or indexes in the database made me look for another
solution.
As my next database of choice I tried CouchDB - a noSQL database with not such a
great documentation and support for geospatial data and operations. I was not exactly able to
put this database online on my development server so I had to leave this option out too.
As much as I wanted to try using noSQL databases I was not successful. After a while I
decided to use standard MySQL5 database that was already running on my development
server and is commonly used.
I reproduced the database schema from my MongoDB documents and extended it into a
few more tables what gave me more flexibility and distribution of data.
2.2.3 Programming languages, frameworks and libraries
1 https://en.wikipedia.org/wiki/NoSQL
2 http://www.mongodb.org
3 http://cassandra.apache.org
4 http://couchdb.apache.org
5 http://www.mysql.com

My web application is mostly running on PHP programming language that is widely
used in world of web applications and offers a lot of functionality and documentation. I
program in PHP for quite a few years so this is the biggest reason for choosing this particular
programming language.
To make the development as fast, error free and secure as possible, I have chosen to use
a PHP framework called Laravel in its third version. Laravel is a framework built on top of
PHP 5.3 with modern and object oriented approach. It provides me with routing, templating,
database layer called Eloquent and a lot of bundles, packages that enhance the functionality of
the framework.
2.3 Client side technologyFor displaying data to the users I have chosen to use HTML with CSS and JavaScript to
make this application running on as many platforms and devices as possible. HTML5 with
CSS3 allows me to provide data in very beautifully and yet usable way with great
performance.
Displaying maps with all the data that is needed was a bit tricky so I have chosen to use
Leaflet JavaScript library that offers great API for generating maps with different layers and
data. As all maps are based on open source project Open Street Maps, there are no restrictions
for displaying map tiles as there is in using Google Maps.
Leaflet comes with many advance functionality such as limiting map area that the the
user can operate in or great support and performance for mobile browsers.
A lot of work is made easier by using one of the most popular and widespread
JavaScript library - jQuery. Not only there is a lot of documentation and tutorials available,
but a lot of plugins are based on using jQuery which can enhance my application very easily
with great results.
In my application I am also using Python for a few tasks running on background such as
importing and exporting large amount of data and doing some basic statistics calculations.
3 DevelopmentIn this part of my bachelor thesis I would like to introduce some techniques and
schematics from programming the actual application. At first I will explain the setup of
database tables and connections, later on I will describe programming of the backend of the
application that provides all the operations and calculations with data gathered from database
and at last but not least I will discuss a few techniques from coding the front end, the visible
part for the users.
3.1 DatabaseAt first we needed a database model to categorize the data. I created a basic diagram
consisting of six main tables displayed in the graph below and a few supporting tables that join data together.
First table is labeled casefiles and it stores necessary data about individual cases
such as case number, title and description. This table also holds information about main
investigator as a foreign key and whether it is a sub-case which is stored as a foreign key that
is an id of the parent case. We are also storing date of creation and date of last update.
Another very important table labeled “points” holds data about specific points of events.
These events are categorized by the types of crime, region, district and the time. Points also
contain exact location stored as geographical coordinates (latitude and longitude).
Another two tables store data about people, one is for employees and the other for all
people connected to some of the cases, whether as offenders or victims. These are connected
to another tables through joining tables that are not show in the diagram.

3.2 Programming application backendI was programming most of the application in PHP 5.3 and was using framework
Laravel I mentioned before.
Application is logically divided into the routes that can be accessed from the browser.
Defining routes in Laravel is pretty simple and straightforward. Main routes in my application
are the homepage, graphs page and a few post routes for retrieving data from models and
serving them our ajax controllers.
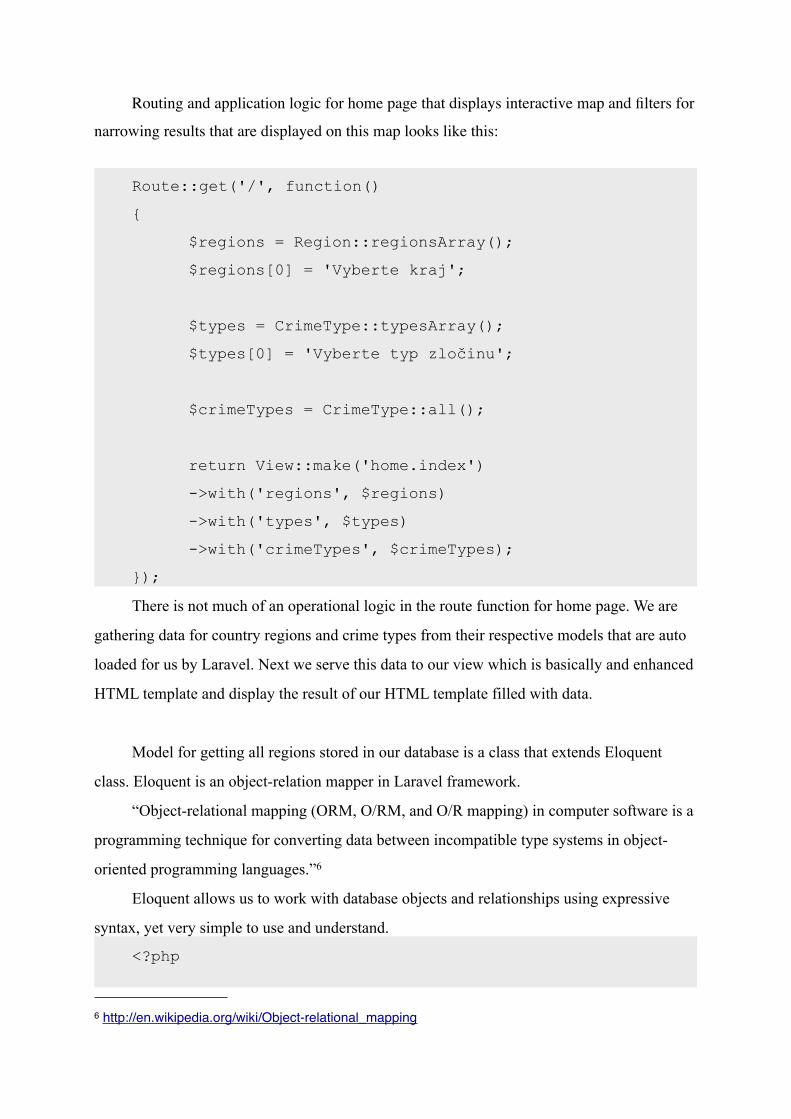
Routing and application logic for home page that displays interactive map and filters for
narrowing results that are displayed on this map looks like this:
Route::get('/', function()
{
$regions = Region::regionsArray();
$regions[0] = 'Vyberte kraj';
$types = CrimeType::typesArray();
$types[0] = 'Vyberte typ zločinu';
$crimeTypes = CrimeType::all();
return View::make('home.index')
->with('regions', $regions)
->with('types', $types)
->with('crimeTypes', $crimeTypes);
});
There is not much of an operational logic in the route function for home page. We are
gathering data for country regions and crime types from their respective models that are auto
loaded for us by Laravel. Next we serve this data to our view which is basically and enhanced
HTML template and display the result of our HTML template filled with data.
Model for getting all regions stored in our database is a class that extends Eloquent
class. Eloquent is an object-relation mapper in Laravel framework.
“Object-relational mapping (ORM, O/RM, and O/R mapping) in computer software is a
programming technique for converting data between incompatible type systems in object-
oriented programming languages.”6
Eloquent allows us to work with database objects and relationships using expressive
syntax, yet very simple to use and understand.
<?php
6 http://en.wikipedia.org/wiki/Object-relational_mapping
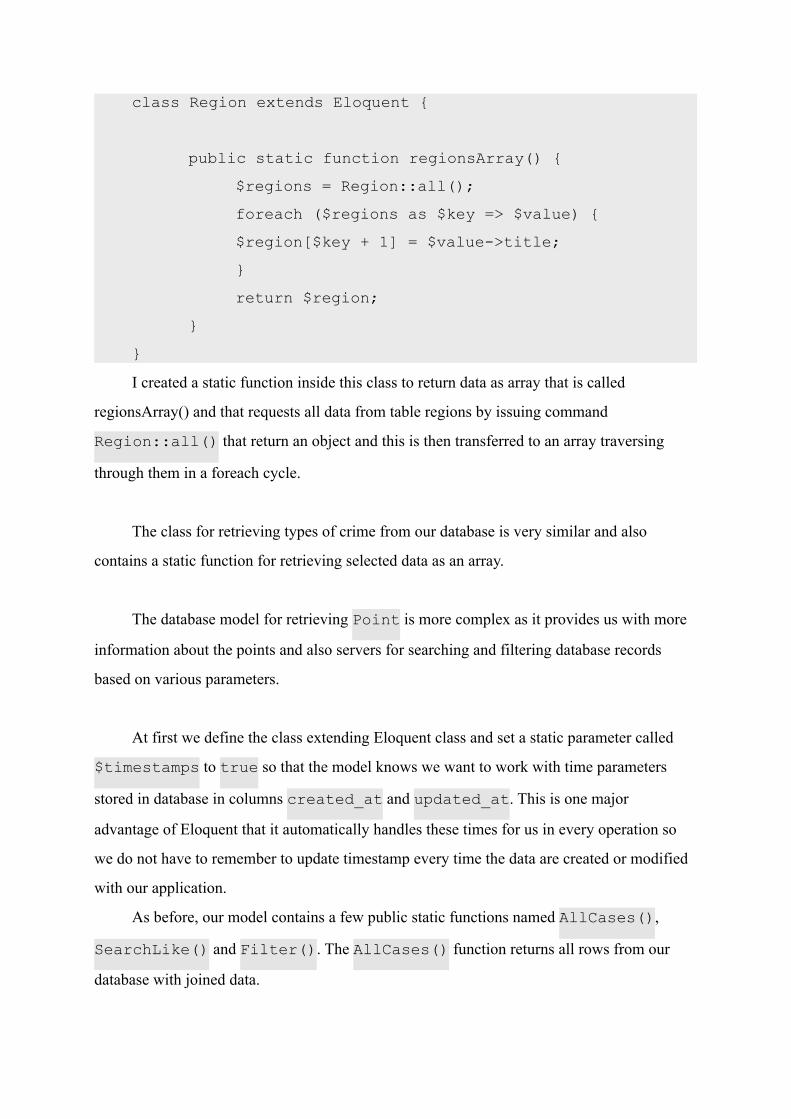
class Region extends Eloquent {
public static function regionsArray() {
$regions = Region::all();
foreach ($regions as $key => $value) {
$region[$key + 1] = $value->title;
}
return $region;
}
}
I created a static function inside this class to return data as array that is called
regionsArray() and that requests all data from table regions by issuing command
Region::all() that return an object and this is then transferred to an array traversing
through them in a foreach cycle.
The class for retrieving types of crime from our database is very similar and also
contains a static function for retrieving selected data as an array.
The database model for retrieving Point is more complex as it provides us with more
information about the points and also servers for searching and filtering database records
based on various parameters.
At first we define the class extending Eloquent class and set a static parameter called
$timestamps to true so that the model knows we want to work with time parameters
stored in database in columns created_at and updated_at. This is one major
advantage of Eloquent that it automatically handles these times for us in every operation so
we do not have to remember to update timestamp every time the data are created or modified
with our application.
As before, our model contains a few public static functions named AllCases(),
SearchLike() and Filter(). The AllCases() function returns all rows from our
database with joined data.
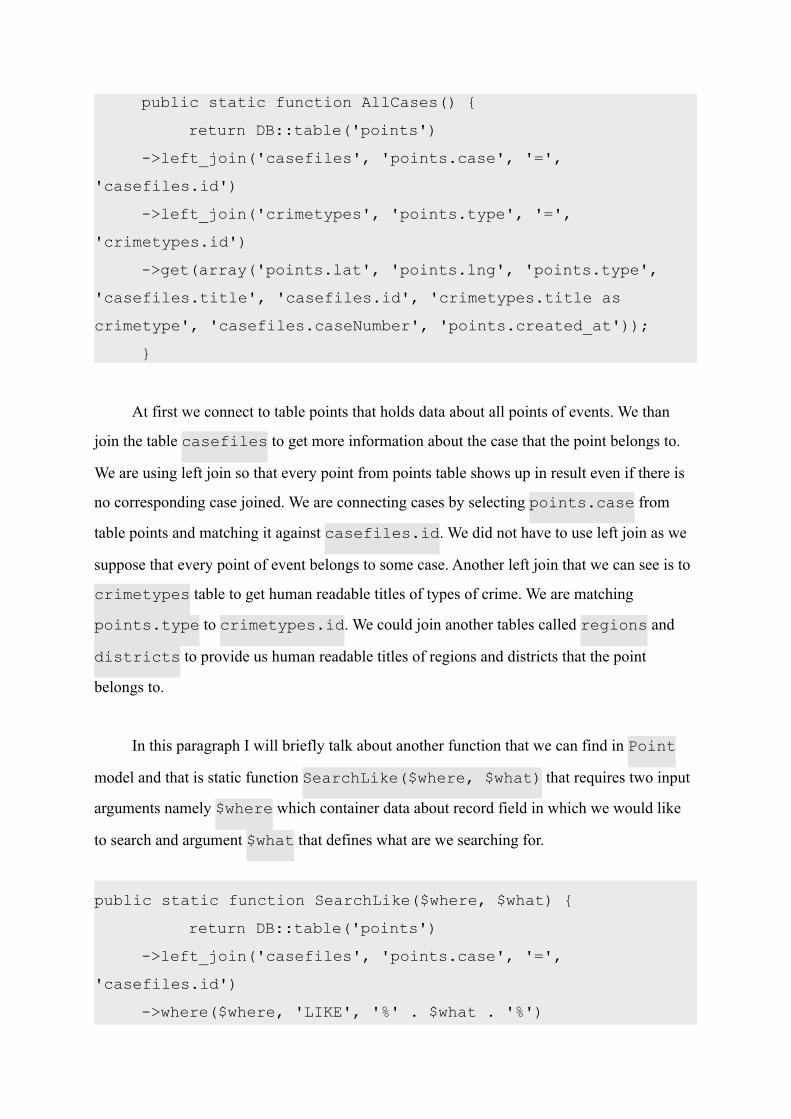
public static function AllCases() {
return DB::table('points')
->left_join('casefiles', 'points.case', '=',
'casefiles.id')
->left_join('crimetypes', 'points.type', '=',
'crimetypes.id')
->get(array('points.lat', 'points.lng', 'points.type',
'casefiles.title', 'casefiles.id', 'crimetypes.title as
crimetype', 'casefiles.caseNumber', 'points.created_at'));
}
At first we connect to table points that holds data about all points of events. We than
join the table casefiles to get more information about the case that the point belongs to.
We are using left join so that every point from points table shows up in result even if there is
no corresponding case joined. We are connecting cases by selecting points.case from
table points and matching it against casefiles.id. We did not have to use left join as we
suppose that every point of event belongs to some case. Another left join that we can see is to
crimetypes table to get human readable titles of types of crime. We are matching
points.type to crimetypes.id. We could join another tables called regions and
districts to provide us human readable titles of regions and districts that the point
belongs to.
In this paragraph I will briefly talk about another function that we can find in Point
model and that is static function SearchLike($where, $what) that requires two input
arguments namely $where which container data about record field in which we would like
to search and argument $what that defines what are we searching for.
public static function SearchLike($where, $what) {
return DB::table('points')
->left_join('casefiles', 'points.case', '=',
'casefiles.id')
->where($where, 'LIKE', '%' . $what . '%')
->left_join('crimetypes', 'points.type', '=',
'crimetypes.id')
->get(array('points.lat', 'points.lng', 'points.type',
'casefiles.title', 'casefiles.id', 'crimetypes.title as
crimetype', 'casefiles.caseNumber', 'points.created_at'));
}
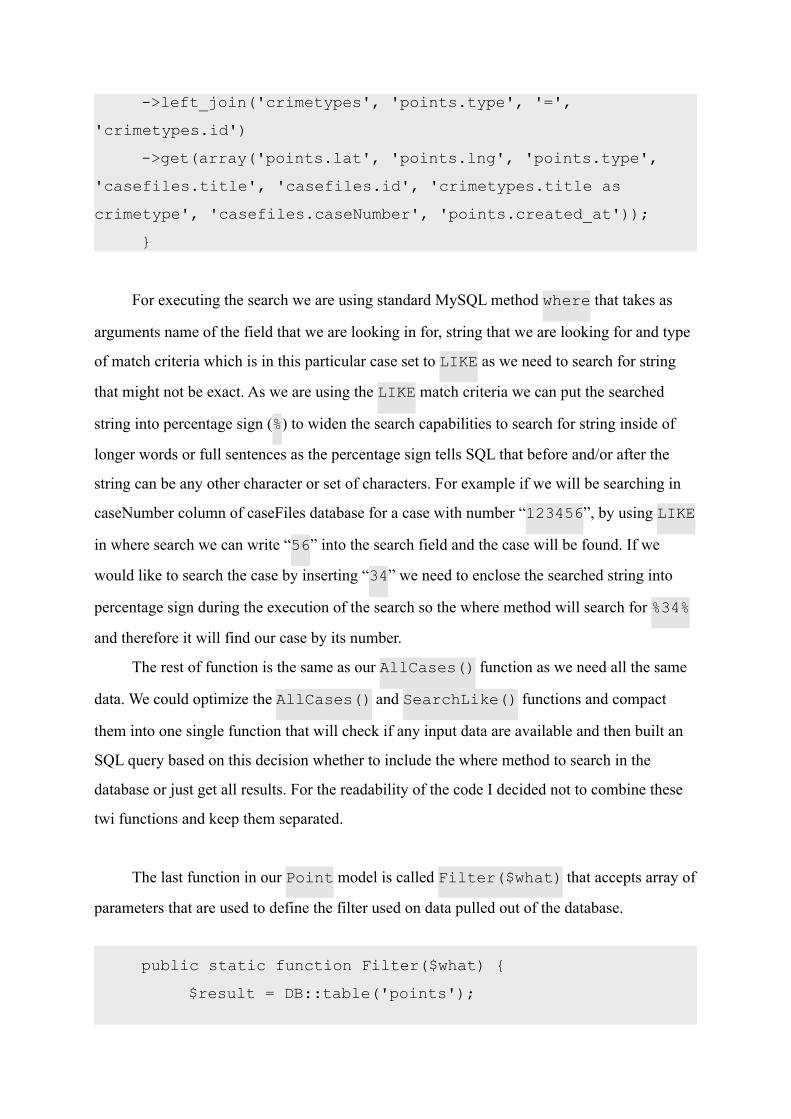
For executing the search we are using standard MySQL method where that takes as
arguments name of the field that we are looking in for, string that we are looking for and type
of match criteria which is in this particular case set to LIKE as we need to search for string
that might not be exact. As we are using the LIKE match criteria we can put the searched
string into percentage sign (%) to widen the search capabilities to search for string inside of
longer words or full sentences as the percentage sign tells SQL that before and/or after the
string can be any other character or set of characters. For example if we will be searching in
caseNumber column of caseFiles database for a case with number “123456”, by using LIKE
in where search we can write “56” into the search field and the case will be found. If we
would like to search the case by inserting “34” we need to enclose the searched string into
percentage sign during the execution of the search so the where method will search for %34%
and therefore it will find our case by its number.
The rest of function is the same as our AllCases() function as we need all the same
data. We could optimize the AllCases() and SearchLike() functions and compact
them into one single function that will check if any input data are available and then built an
SQL query based on this decision whether to include the where method to search in the
database or just get all results. For the readability of the code I decided not to combine these
twi functions and keep them separated.
The last function in our Point model is called Filter($what) that accepts array of
parameters that are used to define the filter used on data pulled out of the database.
public static function Filter($what) {
$result = DB::table('points');
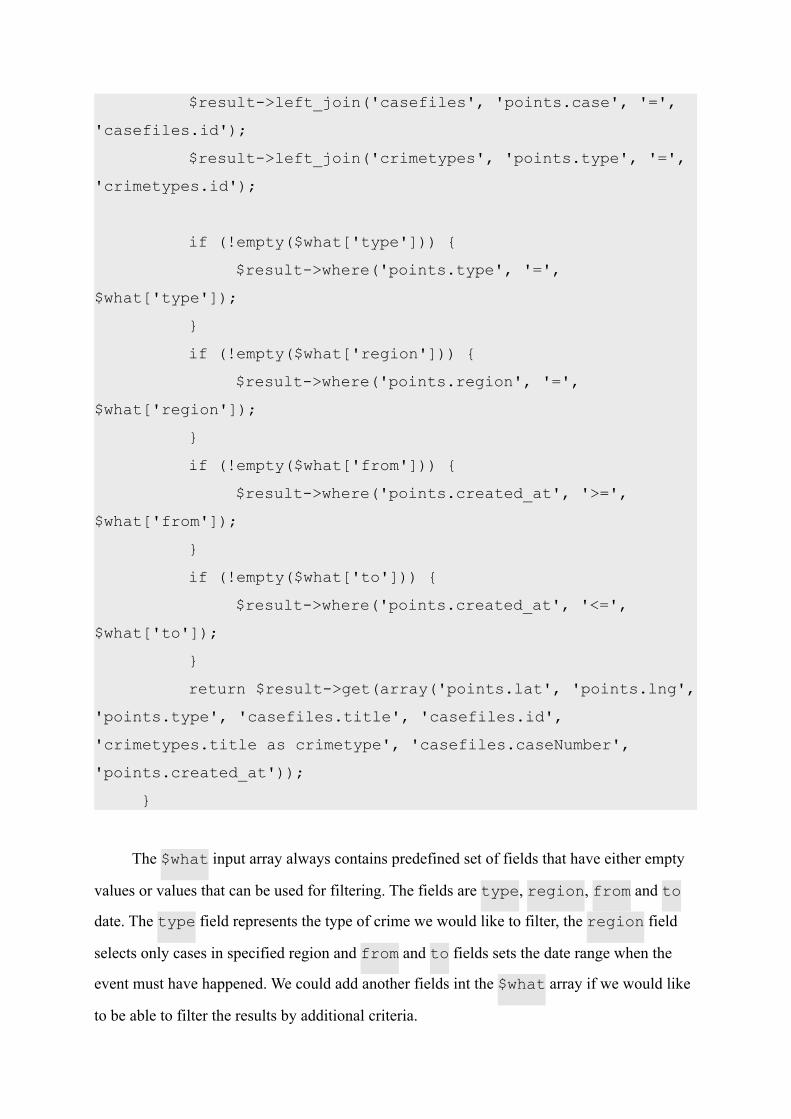
$result->left_join('casefiles', 'points.case', '=',
'casefiles.id');
$result->left_join('crimetypes', 'points.type', '=',
'crimetypes.id');
if (!empty($what['type'])) {
$result->where('points.type', '=',
$what['type']);
}
if (!empty($what['region'])) {
$result->where('points.region', '=',
$what['region']);
}
if (!empty($what['from'])) {
$result->where('points.created_at', '>=',
$what['from']);
}
if (!empty($what['to'])) {
$result->where('points.created_at', '<=',
$what['to']);
}
return $result->get(array('points.lat', 'points.lng',
'points.type', 'casefiles.title', 'casefiles.id',
'crimetypes.title as crimetype', 'casefiles.caseNumber',
'points.created_at'));
}
The $what input array always contains predefined set of fields that have either empty
values or values that can be used for filtering. The fields are type, region, from and to
date. The type field represents the type of crime we would like to filter, the region field
selects only cases in specified region and from and to fields sets the date range when the
event must have happened. We could add another fields int the $what array if we would like
to be able to filter the results by additional criteria.
ConclusionIn this paper I tried to discuss importance of applications for generating criminal
statistical data for our society and law enforcers. I have also built and described basics of an
application that can serve as a base for advanced analytical application for application to real
life to be able to provide statistical and analytical data for better organizing police forces,
predicting growth of criminality and comparing statistics based on many criteria.