Embed Size (px)
Citation preview
Crunching Numbers for Low Carbon Transport in Asia!
Transforming Transportation 2014!
! Presented at Transforming Transportation 2014!
! Sudhir Gota!! Lee Schipper Scholar (2013)!
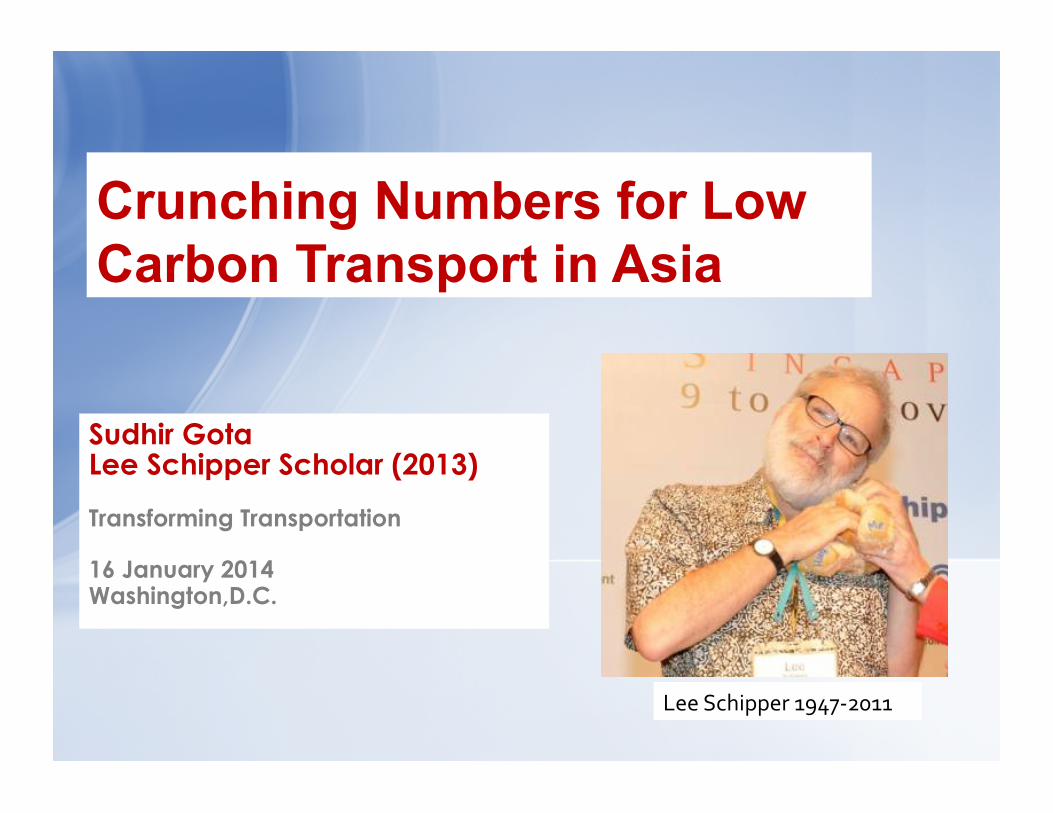
Crunching Numbers for Low Carbon Transport in Asia
Sudhir Gota Lee Schipper Scholar (2013) Transforming Transportation 16 January 2014 Washington,D.C.
Lee Schipper 1947-‐2011
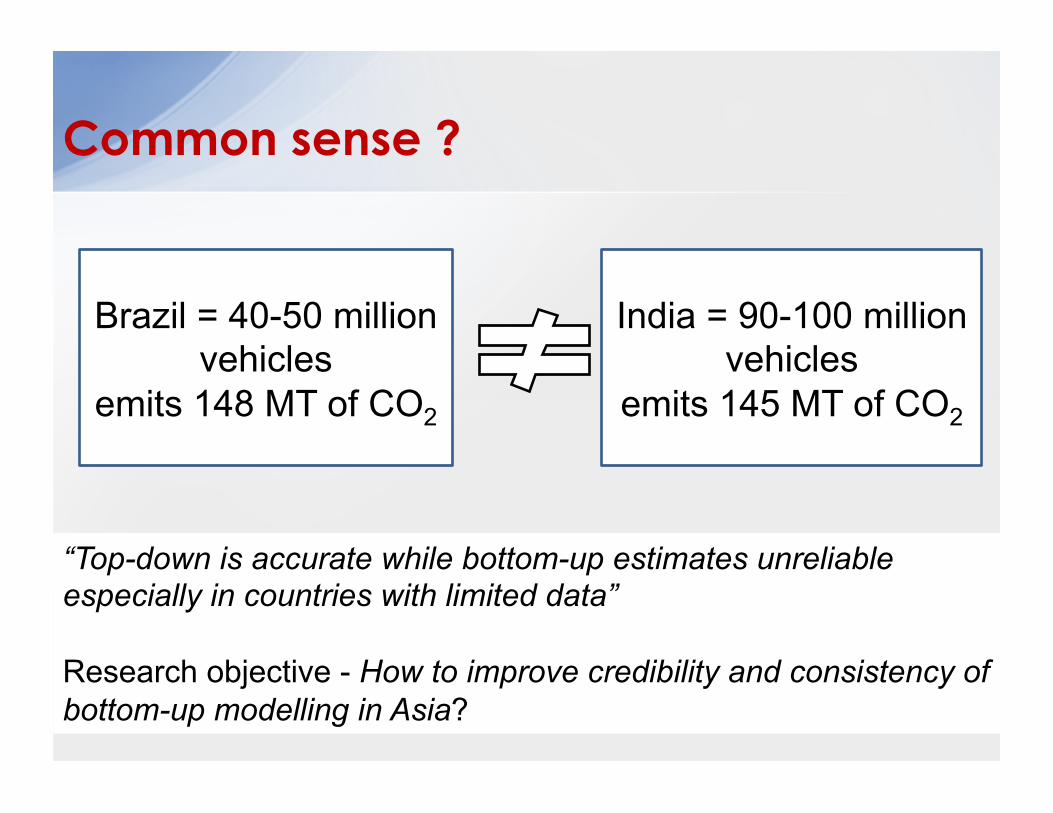
Brazil = 40-50 million vehicles
emits 148 MT of CO2
India = 90-100 million vehicles
emits 145 MT of CO2
Common sense ?
“Top-down is accurate while bottom-up estimates unreliable especially in countries with limited data” Research objective - How to improve credibility and consistency of bottom-up modelling in Asia?
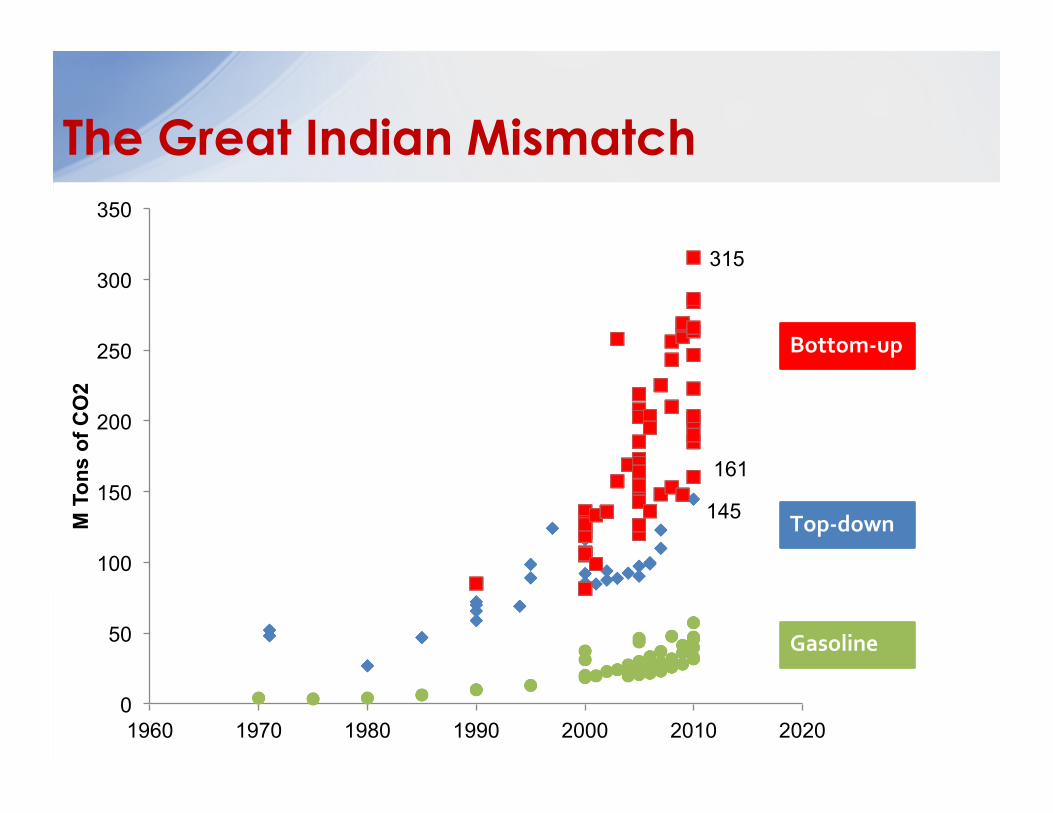
The Great Indian Mismatch
145
315
161
0
50
100
150
200
250
300
350
1960 1970 1980 1990 2000 2010 2020
M T
ons
of C
O2
Bottom-‐up
Top-‐down
Gasoline
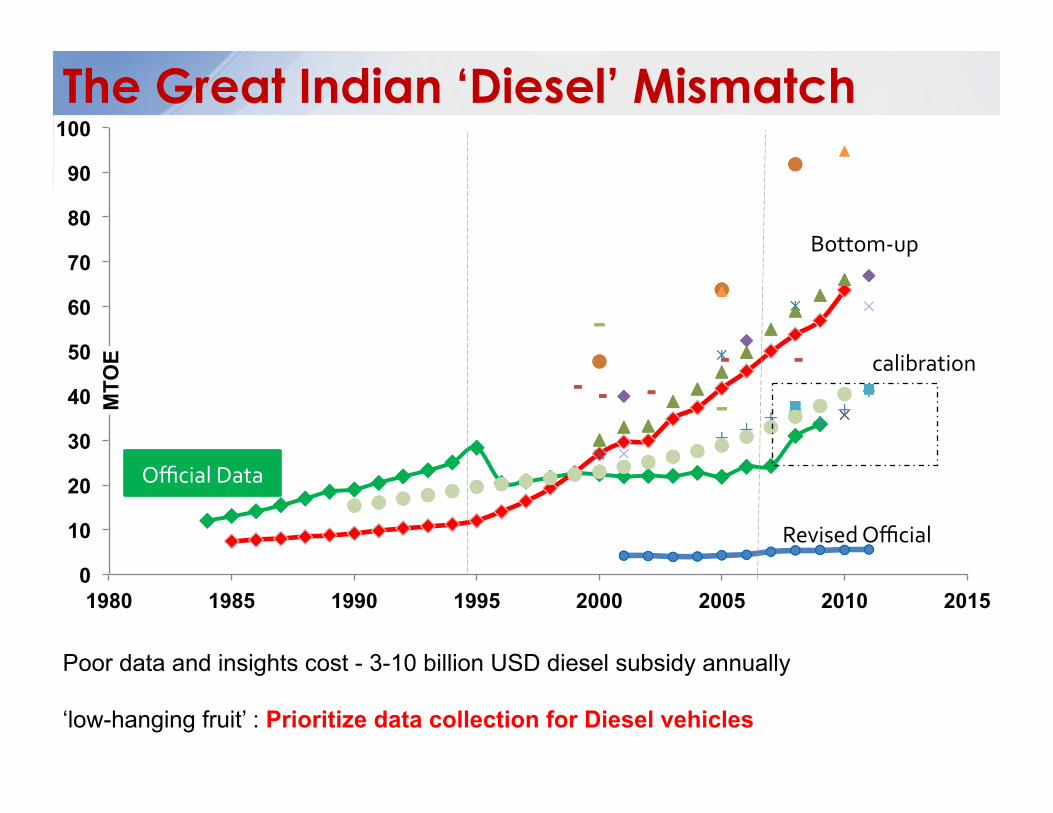
The Great Indian ‘Diesel’ Mismatch
0
10
20
30
40
50
60
70
80
90
100
1980 1985 1990 1995 2000 2005 2010 2015
MTO
E
Poor data and insights cost - 3-10 billion USD diesel subsidy annually ‘low-hanging fruit’ : Prioritize data collection for Diesel vehicles
Official Data
Revised Official
calibration
Bottom-‐up
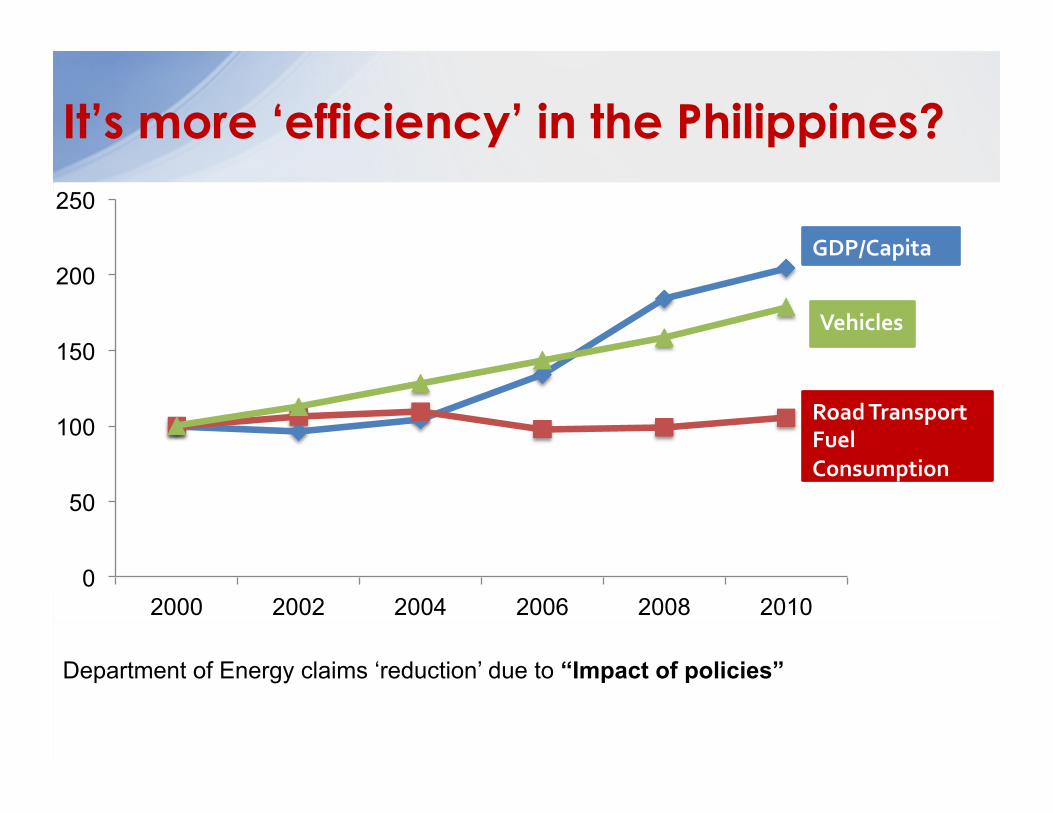
It’s more ‘efficiency’ in the Philippines?
Department of Energy claims ‘reduction’ due to “Impact of policies”
0
50
100
150
200
250
2000 2002 2004 2006 2008 2010
Road Transport Fuel Consumption
Vehicles
GDP/Capita
0
20
40
60
80
100
120
140
1980 1990 2000 2010 2020 2030 2040
CO2
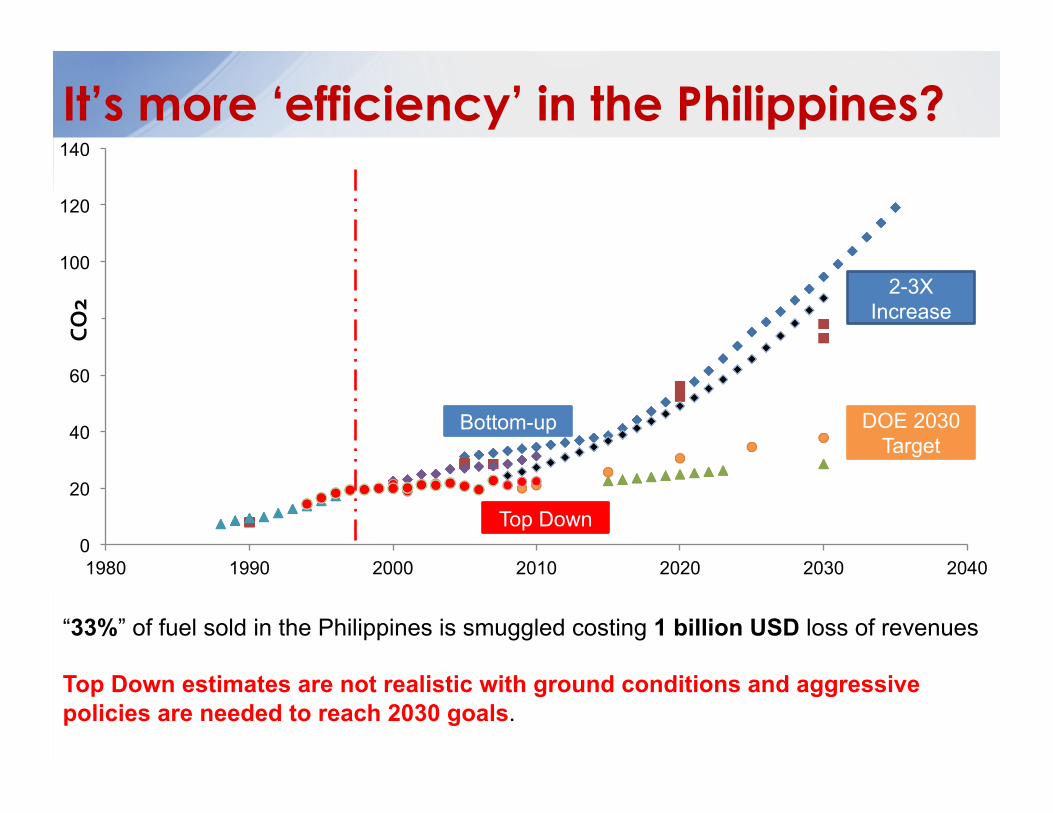
It’s more ‘efficiency’ in the Philippines?
“33%” of fuel sold in the Philippines is smuggled costing 1 billion USD loss of revenues Top Down estimates are not realistic with ground conditions and aggressive policies are needed to reach 2030 goals.
DOE 2030 Target
2-3X Increase
Top Down
Bottom-up
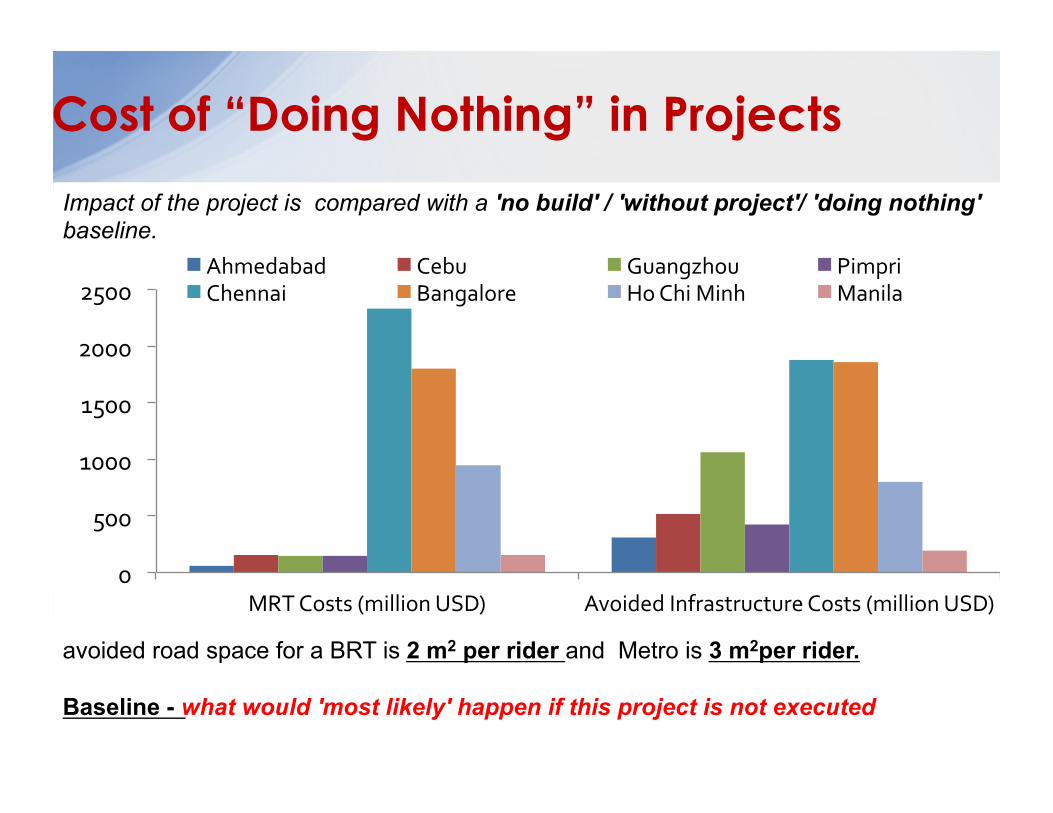
Cost of “Doing Nothing” in Projects
avoided road space for a BRT is 2 m2 per rider and Metro is 3 m2per rider. Baseline - what would 'most likely' happen if this project is not executed
Impact of the project is compared with a 'no build' / 'without project'/ 'doing nothing' baseline.
0
500
1000
1500
2000
2500
MRT Costs (million USD) Avoided Infrastructure Costs (million USD)
Ahmedabad Cebu Guangzhou Pimpri Chennai Bangalore Ho Chi Minh Manila
Thanks to Lee Schipper, Lee Schipper Memorial Scholarship for Sustainable
Transport and Energy,Embarq and Clean Air Asia
Car that absorbs its own carbon does not need oil or cause congestion?