Embed Size (px)
DESCRIPTION
Brand USA 2014 Marketing Plan Andrew Williams Jr Email: [email protected] Mobile: +1-424-222-1997 Skype: andrew.williams.jr http://twitter.com/AWilliamsJr http://slideshare.net/andrewwilliamsjr http://xeeme.com/AmbassadorAWJ https://www.facebook.com/FAUBermuda http://www.yatedo.com/andrewwilliamsjr http://www.slideshare.net/andrewwilliamsjr http://www.linkedin.com/in/andrewwilliamsjr http://www.facebook.com/ajactionteam http://www.facebook.com/ambassadorawj http://www.facebook.com/andrewwilliamsjr http://www.facebook.com/AJGombeyBermuda
Citation preview
FY14 Business PlanPublished November 18, 2013

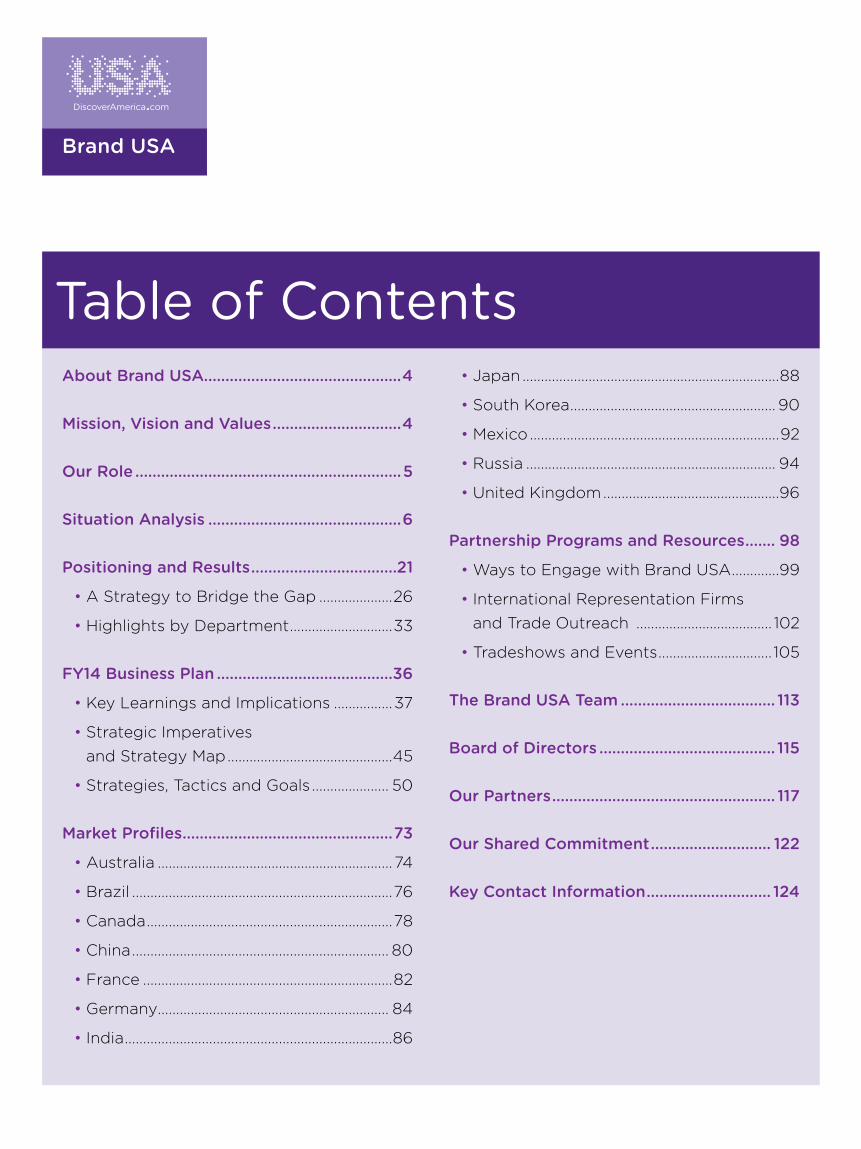
About Brand USA����������������������������������������������4
Mission, Vision and Values ������������������������������4
Our Role ��������������������������������������������������������������5
Situation Analysis ���������������������������������������������6
Positioning and Results ����������������������������������21
• A Strategy to Bridge the Gap ��������������������26
• Highlights by Department ����������������������������33
FY14 Business Plan �����������������������������������������36
• Key Learnings and Implications ����������������37
• Strategic Imperatives and Strategy Map ���������������������������������������������45
• Strategies, Tactics and Goals ��������������������� 50
Market Profiles �������������������������������������������������73
• Australia ����������������������������������������������������������������74
• Brazil �����������������������������������������������������������������������76
• Canada �������������������������������������������������������������������78
• China ���������������������������������������������������������������������� 80
• France ��������������������������������������������������������������������82
• Germany ��������������������������������������������������������������� 84
• India �������������������������������������������������������������������������86
• Japan ����������������������������������������������������������������������88
• South Korea �������������������������������������������������������� 90
• Mexico ��������������������������������������������������������������������92
• Russia �������������������������������������������������������������������� 94
• United Kingdom ������������������������������������������������96
Partnership Programs and Resources ������� 98
• Ways to Engage with Brand USA �������������99
• International Representation Firms and Trade Outreach ������������������������������������� 102
• Tradeshows and Events ������������������������������� 105
The Brand USA Team ������������������������������������ 113
Board of Directors ����������������������������������������� 115
Our Partners ���������������������������������������������������� 117
Our Shared Commitment ���������������������������� 122
Key Contact Information ����������������������������� 124
Table of Contents
Bra
nd
US
A F
Y14
Bu
sin
ess
Pla
n •
2
Dear Partners in Travel,We are pleased to present Brand USA’s business plan for FY2014. Within these pages, we’ve outlined our role in the industry, our key learnings and successes from the prior year, and our plans for the coming year to inspire hundreds of thousands of new travelers to come to the United States.
You’ll also find ways you can engage with Brand USA and be part of this industry-defining opportunity.
We realize that the work we do is more than just about promoting and mar-keting the world’s premier travel destination. As we welcome more and more of the world’s travelers to visit our diverse destinations, unique experiences, and national treasures, we are helping to create jobs, build our economy, and strengthen the foundation of communities across the country.
Over the past year, we made significant progress as we transitioned from a start-up to a cooperative destination marketing organization.
Since launching the first wave of our consumer marketing campaign in Canada, Japan, and the United Kingdom in 2012 to outstanding results that increased intent to visit the United States from 12 to 22 percent, we went on to expand the campaign to 11 markets in 2013: Australia, Brazil, Canada, China, Germany, Hong Kong, Japan, Mexico, South Korea, Taiwan, and the United Kingdom—representing 75% of inbound travel.
We also greatly increased our international representation network and our direct outreach and promotion with the travel trade. We currently have offices representing the United States’ travel and tourism interests in Australia, Austria, China, Germany, Hong Kong, India, Ireland, Japan, New Zealand, South Korea, Switzerland, Taiwan, and the United Kingdom. Over the next few months, we will open additional offices to work with the travel trade and promote the United States in the Benelux (Belgium, the Netherlands, ad Luxembourg), France, Latin America (Andean Region, Brazil, Mexico, Southern Cone), Russia, and Scandinavia (Denmark, Norway, and Sweden). Travel from these markets make up more than 95 percent of visitation and spend to the United States.
In addition, we have established a unified presence for the country at trade shows around the world. We sup-ported the administration’s National Travel and Tourism Strategy by conducting joint promotional campaigns, providing collateral for Federal efforts, and coordinating a variety of in-market activities.
All of this was possible because of the commitment of our nearly 300 partners. As a result, we have been able to maximize the support of Federal matching funds provided by the Travel Promotion Act and re-invest those funds in programs, platforms, and marketing strategies that enable us to continue to roll out the welcome mat to the world.
Our focus is now on greatly expanding and developing new cooperative marketing platforms and programs that add and create value while generating a strong return on investment for everyone with a vested interest in increasing international visitation to the United States.
As we continue to work together to promote the United States as the world’s premier travel destination, we thank you for your ongoing support.
Together we are Brand USA!
Christopher L. Thompson President & CEO Brand USA
About Brand USA

Bra
nd
US
A F
Y14
Bu
sin
ess
Pla
n •
4
AB
OU
T B
RA
ND
US
A
About Brand USABrand USA was established by the Travel Promotion Act
to spearhead the nation’s first international marketing
effort to promote the United States as a premier travel
destination and communicate U.S. entry/exit policies
and procedures. Formed as the Corporation for Travel
Promotion, the public-private entity began operations in
May 2011 and does business as Brand USA.
Through its consumer facing brand and call-to-action—
Discover America—Brand USA inspires travelers to explore
the United States of America’s boundless possibilities.
This first-ever effort is expected to put the United States
on equal footing with other countries’ tourism efforts and
bring millions of new international visitors to the United
States who spend billions of dollars during their travels—
thus creating thousands of new American jobs each year.
Brand USA works in close partnership with the travel
industry to maximize the economic and social benefits of
travel—all at no cost to U.S. taxpayers.
The organization is supported by contributions from
the private-sector that are matched by fees paid by
international travelers to the Electronic System for Travel
Authorization (ESTA) program. ESTA is an automated
system implemented by the Department of Homeland
Security in 2008 that determines the eligibility of visitors
from 37 international markets to travel to the United
States under the Visa Waiver Program (VWP). ESTA
authorizations are generally valid for multiple trips over a
period of two years or until the traveler’s passport expires,
whichever comes first.
For industry or partner information about Brand USA, visit
www.TheBrandUSA.com. For information about excep-
tional and unexpected travel experiences in the United
States, please visit Brand USA’s consumer website at
www.DiscoverAmerica.com.
MissionThe mission of Brand USA is to encourage increased
international visitation to the United States and to grow
America’s share of the global travel market. In doing
so, we aim to bring millions of new international visitors
who spend billions of dollars to the United States,
creating tens of thousands of new American jobs.
VisionBrand USA will be responsible for positioning and
promoting the United States as a compelling destina-
tion for international travelers, inspiring visitors with a
refreshed understanding that there is no place in the
world like the United States of America with its limitless
destinations and attractions. We will build a world-class
team and organization that will execute an integrated
marketing and communications strategy designed
to deliver the highest possible return for the United
States—in the form of job creation, GDP and export
growth, and increased federal tax revenues.
ValuesPerformance Excellence:A corporate culture of visionary
and performance-driven
leadership, strategic planning
and a management that deploys
resources to their highest and
most productive uses
Integrity:A corporate culture with assured
reliance on ability, actions, char-
acter, diversity, honesty, respect,
transparency, and trust
Fun:A corporate culture with a
memorable and unique personality
that fosters creativity, innovation,
and high achievement for itself and
its partner organizations

AB
OU
T B
RA
ND
US
A
Bran
d U
SA
FY
14 B
usin
ess P
lan • 5
TRAVEL & TOURISM INDUSTRY
ADVISE
• Lead the nation’s global marketing effort to increase inbound travel to the United States
• Enhance awareness and the image of the USA as a diverse, exciting, and premier travel destination
• Create programs and platforms that add and create value for partners and support the National Travel and Tourism Strategy
• Work with the Federal agencies to develop programs to communicate U.S. entry and security processes and create a welcoming experience for international tourists
PROMOTE• As the leading voice of
the U.S. travel industry, increase travel to and within the United States
• Advocate for and advance pro-travel policies and remove travel barriers
• Provide authoritative research and networking opportunities
• Communicate the positive widespread impact of travel to policy makers and the media
• Leverage the collective strength of everyone who benefits from travel to grow their business beyond what they can do individually
ADVOCATE
LEADERSHIP ROLES IN THE TRAVEL INDUSTRY TO INCREASE INBOUND TRAVEL TO THE UNITED STATES
Brand USA
Our Role in the Travel IndustryBrand USA plays a unique role as the nation’s first
cooperative destination marketing organization.
We focus our efforts on delivering programs and platforms
that increase awareness and enhance the image of the
United States among worldwide travelers in order to
increase intent to travel to the United States and, most
importantly, visitation and spend. In addition to promoting
the United States as a premier travel destination through
consumer and travel-trade marketing, advertising, events
and promotions, we work with the Federal government to
communicate U.S. entry and security processes that will
help make the journey to and into the United States easier
and more welcoming.
The collective and successful efforts of Brand USA,
the U.S. Department of Commerce Travel and Tourism
Advisory Board, and the U.S. Travel Association will
increase the desire and ability for international travelers to
come to the United States. And as we welcome millions of
new international visitors, we make our country stron-
ger—creating jobs essential to the economy and providing
opportunities for millions of Americans.
Travel and Tourism Advisory Board Advise and provide policy recommendations
to the Secretary of Commerce on issues
affecting the U.S. travel industry

Situation Analysis
SIT
UA
TIO
N A
NA
LYS
IS
Bran
d U
SA
FY
14 B
usin
ess P
lan • 7
Where We AreA strengthening but still struggling economyInternational travel is growing more than three times as
fast as U.S. GDP, helping to pull the economy toward
economic and job recovery. According to the Bureau of
Economic Analysis, inbound travel and tourism grew at
an annualized rate of 6.8 percent in the first three months
of 2013 while the U.S. economy grew at an annualized
pace of 2.4 percent over the same period. And travel is
leading the economic recovery despite slowed growth
in prices, which increased only 0.3 percent in the first
quarter of 2013 compared with 2.4 percent in the fourth
quarter of 2012. The biggest contributors to the growth
were passenger flights and other transportation-related
industries like rental cars.
The travel and tourism industry is also hiring people at a
much faster rate than other sectors of the U.S. economy.
Employment in the industry grew 2.3 percent in the first
quarter of 2013 while employment in the overall U.S.
economy increased by 1.9 percent.
While the U.S. trade deficit in 2012 was $540.4 billion
(actually down 3.5 percent from 2011) the travel and
tourism industry boasted a trade surplus of $47.5 billion
in 2012. Stable exports and the consistent trade surplus
generated in the international travel industry are critical
to the vitality of the U.S. economy and the creation of
high-quality jobs.
The OpportunityTravel: The fastest path to a strong economy, jobs, and opportunities for AmericansIt is a truth that travel is a powerful economic engine—with
international inbound travel one of the largest exports for
the United States. Ranking ahead of agricultural goods
and motor vehicles, it is the single-largest services-sector
export, accounting for 25 percent of all services exports in
2012 and a 6.5 percent share of world travelers.
International travel represents a quick path toward
economic prosperity, providing skilled and high-paying
jobs that can’t be outsourced.
According to the Department of Commerce, in 2012, 67
million international visitors came to the United States, an
increase of 7 percent over the prior year--with 11 of the top
15 markets posting year-over-year increases. These visitors
spent a record $165.6 billion on goods and services, which
are counted as U.S. exports. In total, spending by interna-
tional travelers while traveling the United States supported
1.2 million American jobs.
According to studies by the U.S. Travel Association, travel
supports 14.4 million workers in America—with travel
supporting one in eight American jobs in the private sector
and ranking as a top 10 employer in 47 states and the
District of Columbia.
THE OPPORTUNITY
33Overseas Travelers
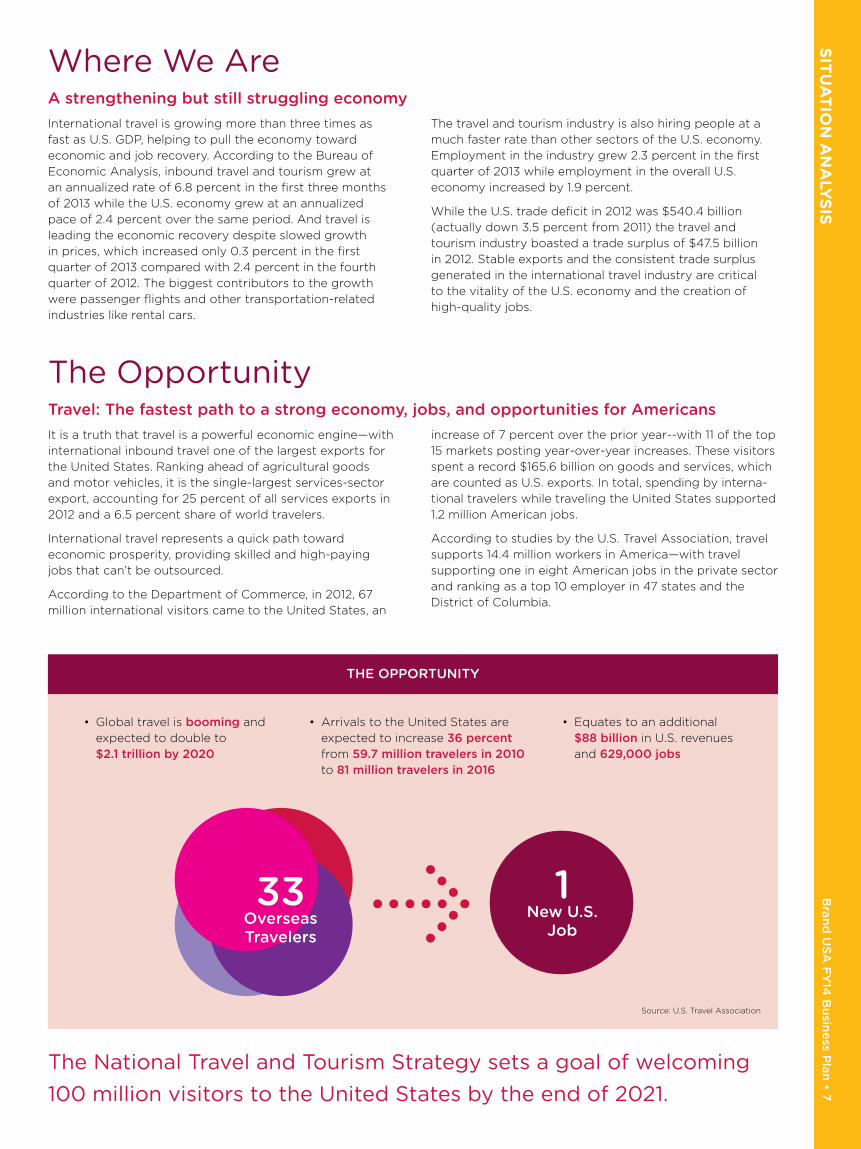
• Global travel is booming and
expected to double to
$2.1 trillion by 2020
• Arrivals to the United States are
expected to increase 36 percent from 59.7 million travelers in 2010
to 81 million travelers in 2016
• Equates to an additional
$88 billion in U.S. revenues
and 629,000 jobs
Source: U.S. Travel Association
The National Travel and Tourism Strategy sets a goal of welcoming 100 million visitors to the United States by the end of 2021.
1New U�S�
Job
Bra
nd
US
A F
Y14
Bu
sin
ess
Pla
n •
8
SIT
UA
TIO
N A
NA
LYS
IS According to the Department of Commerce, in 2012
visitation (67 million) was up 7 percent compared to
the same period in 2011 with 11 of the top 15 markets
posting increases.
According to the United Nations World Tourism
Organization (UNWTO), global international tourist
arrivals grew 4 percent from 2011 to 2012, surpassing the
1 billion mark for the first time. Emerging markets are
fueling a substantial portion of this growth, and China is
now the world’s largest in terms of international tourism
expenditure. In 2012, Chinese travelers spent $102 billion in
international markets, reflecting an increase of 37 percent
from the prior year. By 2030, the UNWTO forecasts
tourist arrivals to reach 1.8 billion. Emerging markets are
expected to grow their share of visitors substantially, from
47 percent in 2012 to 57 percent in 2030.
U�S� VisitationThe United States welcomed a record-breaking number
of visitors from most regions around the world in 2012.
Visitor spending climbed to new heights, with the UNWTO
reporting a 9 percent increase, to $166 billion and the U.S.
Department of Commerce reporting a 10 percent increase
to $168 billion.
The year-over-year increase in one year is a remarkable
result, but this growth is particularly strong in light of
the economic challenges that hampered visitation from
historically key markets in Europe. Growing visitor volume
and expenditure is Brand USA’s ultimate objective, and
lessening visitor declines during economically weak time
periods is a key part of that objective. Despite limitations
in growth due to these economic headwinds, robust
marketing efforts in Europe remain critical to keep U.S.
destinations top of mind.
The mature-market level of travel demand in top European
markets inherently sets their growth at a moderate pace
even when their economic footing is solid, while emerging
markets like China and Brazil are growing at a dramatic
pace (+35 percent and +19 percent, respectively in 2012).
As new travelers from emerging markets around the world
leave their borders for the first time, the cooperative
efforts of agencies that support the Travel Promotion Act
have been invaluable in paving the way for this growth
to occur. The demand generated and enhanced by Brand
USA’s promotional activities has been met with effective
efforts to reduce visa wait times in key growth markets
such as India and China.
-5%
0%
5%
10%
15%
20%
J A J O J A J O J A J O J A J O
2010 2011 2012 2013
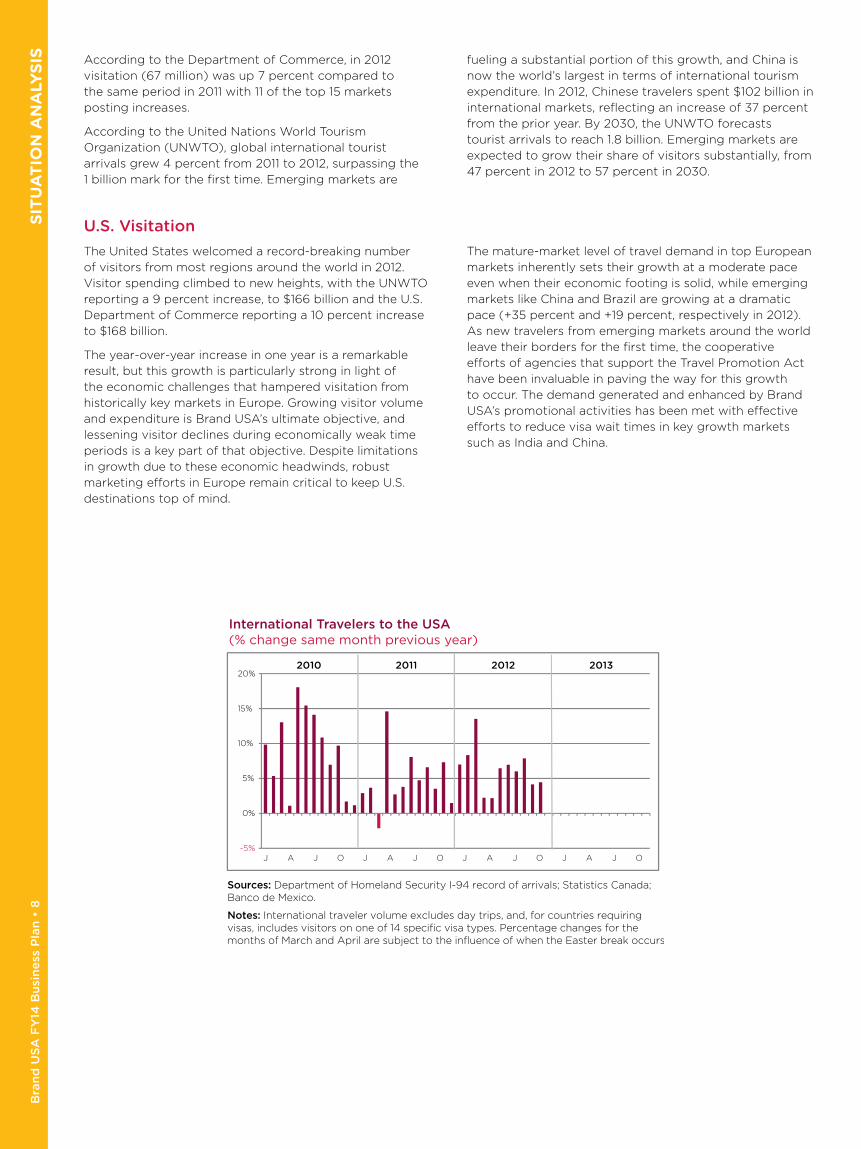
International Travelers to the USA(% change same month previous year)
Sources: Department of Homeland Security I-94 record of arrivals; Statistics Canada; Banco de Mexico.
Notes: International traveler volume excludes day trips, and, for countries requiring visas, includes visitors on one of 14 specific visa types. Percentage changes for the months of March and April are subject to the influence of when the Easter break occurs.

SIT
UA
TIO
N A
NA
LYS
IS
Bran
d U
SA
FY
14 B
usin
ess P
lan • 9
0%
5%
10%
15%
20%
25%
J A J O J A J O J A J O J A J O
2010 2011 2012 2013
International Traveler Spending in the USA (exports)(% change same month previous year)
Sources: U.S. Department of Commerce; Bureau of Economic Analysis.
Notes: Spending includes both spending within the USA and passenger fares to travel to the USA on U.S. carriers (both exports).
0%
10%
20%
30%
40%
50%
60%
70%
80%
J A J O J A J O J A J O J A J O
2010 2011 2012 2013
Travel Trade Balance(% change same month previous year)
Sources: U.S. Department of Commerce; Bureau of Economic Analysis.
Notes: Spending includes spending within the USA and passenger fares to travel to the USA. Changes reflect the interplay between export travel spending and passenger fares and import travel spending and passenger fares (4 items).
-25%
-20%
-15%
-10%
-5%
0%
5%
10%
15%
Q1 Q1 Q1 Q1 Q1
Real Tourism Output
Real GDP
2009 2010 2011 2012 2013
OUTPUT: Travel Industry vs. All Industries(quarterly change rate of annualized data)
Sources: U.S. Department of Commerce; Bureau of Economic Analysis.
Notes: Both output measures are subject to revision. Real tourism output includes direct plus indirect tourism output.
Bra
nd
US
A F
Y14
Bu
sin
ess
Pla
n •
10
S
ITU
AT
ION
AN
ALY
SIS
0
20
40
60
80
100
120
140
160
May
Au
g
No
v
Feb
May
Au
g
No
v
Feb
May
Au
g
No
v
Brasilia Recife Rio De Janeiro Sao Paulo
2011 2012 2013
Visa Interview Wait Time: BRAZIL(days)
Source: U.S. Department of State; Bureau of Consular Affairs.
Notes: Visa interview wait time refers to the typical wait time to receive an interview appointment to apply for a visa at a U.S. Embassy or Consulate.
-20 %
-10 %
0 %
10 %
20 %
30 %
40 %
50 %
60 %
70 %
80 %
90 %
100 %
$0
$2
$4
$6
$8
$10
$12
$14
$16
$18
$20
Jan Apr Jul Oct Jan Apr Jul Oct Jan Apr Jul Oct Jan Apr Jul Oct
2010 2011 2012 2013
change %snoillim$
TravelPromotionFees (lhs)
%change(rhs)
12-mo. moving total = $122 m through Dec.
ESTA Travel Promotion Fees Collected(lhs: $millions; rhs: % change same month previous year)
Sources: U.S. Department of Homeland Security; Customs and Border Protection.
Notes: Fees reflect the $10 portion of the $14 ESTA application fee per traveler for approved applications ("Adjusted Travel Promotion Classification"). Fee began in September 2010.
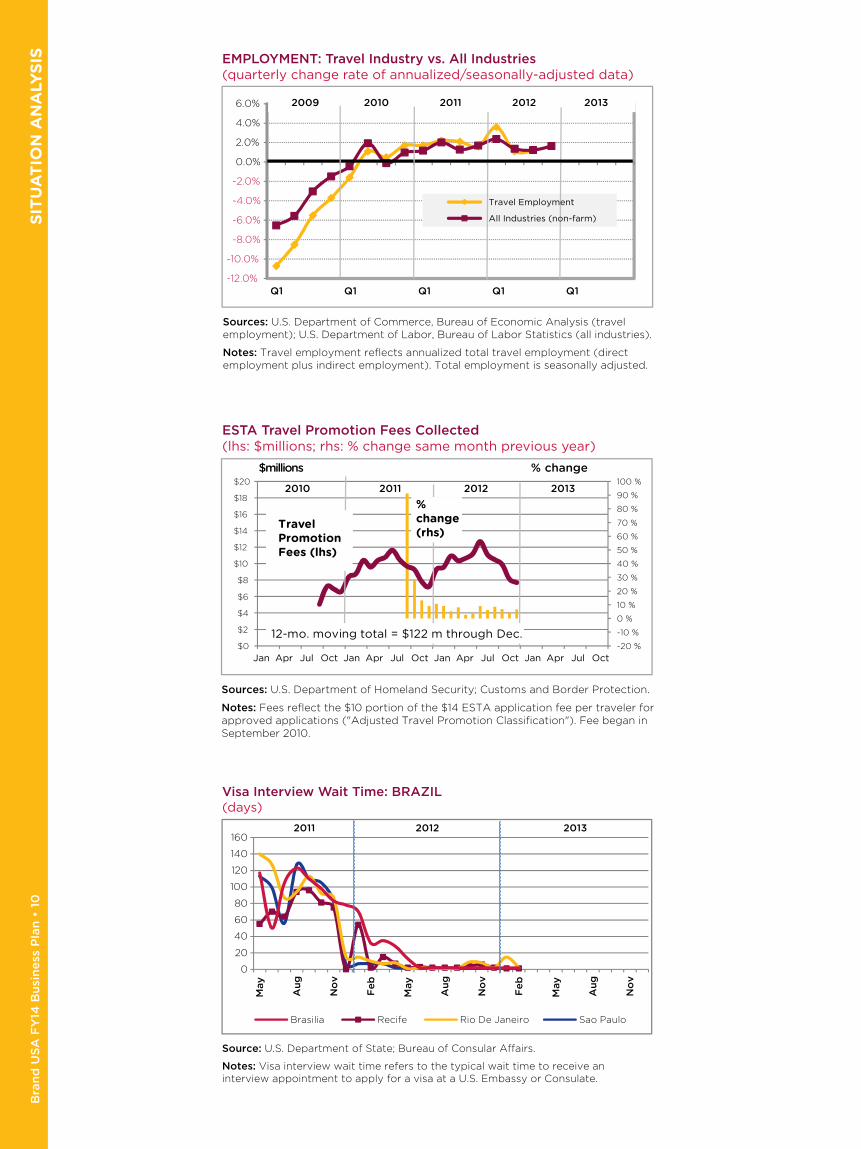
-12.0%
-10.0%
-8.0%
-6.0%
-4.0%
-2.0%
0.0%
2.0%
4.0%
6.0%
Q1 Q1 Q1 Q1 Q1
2009 2010 2011 2012 2013
Travel Employment
All Industries (non-farm)
EMPLOYMENT: Travel Industry vs. All Industries(quarterly change rate of annualized/seasonally-adjusted data)
Sources: U.S. Department of Commerce, Bureau of Economic Analysis (travel employment); U.S. Department of Labor, Bureau of Labor Statistics (all industries).
Notes: Travel employment reflects annualized total travel employment (direct employment plus indirect employment). Total employment is seasonally adjusted.

SIT
UA
TIO
N A
NA
LYS
IS
Bran
d U
SA
FY
14 B
usin
ess P
lan • 11
0
10
20
30
40
50
60
70
80
May
Au
g
No
v
Feb
May
Au
g
No
v
Feb
May
Au
g
No
v
Beijing Chengdu Guangzhou Shanghai Shenyang
2011 2012 2013
Visa Interview Wait Time: CHINA(days)
Source: U.S. Department of State; Bureau of Consular Affairs.
Notes: Visa interview wait time refers to the typical wait time to receive an interview appointment to apply for a visa at a U.S. Embassy or Consulate.
0
5
10
15
20
25
May
Au
g
No
v
Feb
May
Au
g
No
v
Feb
May
Au
g
No
v
Chennai Hyderabad Kolkata Mumbai New Delhi
2011 2012 2013
Visa Interview Wait Time: INDIA(days)
Source: U.S. Department of State; Bureau of Consular Affairs.
Notes: Visa interview wait time refers to the typical wait time to receive an interview appointment to apply for a visa at a U.S. Embassy or Consulate.
0
1,000,000
2,000,000
3,000,000
4,000,000
5,000,000
6,000,000
FY2009 FY2010 FY2012FY2011
Brazil
China
India
Rest of World
B1/B2 Short-Term Tourist and Business Travel Visas Issued(number of B1/B2 travel visas issued in fiscal year in China, Brazil, India, and the remainder of visa-issuing posts worldwide)
Source: U.S. Department of State; Bureau of Consular Affairs.
Notes: The graph above represents the number of B1/B2 visas issued in fiscal years 2009–2011 in China, Brazil, India, and worldwide.

Bra
nd
US
A F
Y14
Bu
sin
ess
Pla
n •
12
S
ITU
AT
ION
AN
ALY
SIS
0
5,000
10,000
15,000
20,000
25,000
30,00035,000
40,000
45,000
50,000
J A J O J A J O J A J O J A J O
GLOBAL ENTRY NEXUS SENTRI
FAST-North FAST-South
2010 2011 2012 2013
Combined 12-mo avg. = 64K / mo.
Trusted Traveler Programs Enrollment Applications(number applications by month)
Source: U.S. Department of Homeland Security; Customs and Border Protection.
30
5,030
10,030
15,030
20,030
25,030
30,030
J A J O J A J O J A J O J A J O
ATL IAD IAH JFK
LAX Miami EWR
2010 2011 2012 2013
Total 12-mo avg. at 172K / mo. ↑
Trusted Traveler Program Airport Kiosk(number of travelers using kiosk by airport)
Source: U.S. Department of Homeland Security; Customs and Border Protection.
0
5
10
15
20
25
30
35
40
J A J O J A J O J A J O J A J O J A J O
JFK EWR LAX HNL
ORD ATL MIA
2009 2010 2011 2012 2013
International Arrivals Processing Times by Port of Entry(minutes)
Source: U.S. Department of Homeland Security; Customs and Border Protection.
Notes: CBP recommends travelers consult the CBP website http://www.cbp.gov/xp/cgov/travel/wait_times/ for relevant information about wait times.

SIT
UA
TIO
N A
NA
LYS
IS
Bran
d U
SA
FY
14 B
usin
ess P
lan • 13
Total U.S. Brazil China India2010 Actual 8.7% 34% 53% 18%2011 Actual 4.2% 26% 36% 2%2012 Forecast 6.7% 18% 41% 12%2013 Forecast 4.1% 14% 26% 5%2014 Forecast 4.3% 9% 21% 5%2015 Forecast 3.7% 9% 20% 6%2016 Forecast 3.6% 7% 18% 6%2017 Forecast 3.7% 7% 18% 6%
Travel Forecast(% change previous year)
Source: U.S. Department of Commerce, Office of Travel and Tourism Industries. (OTTI) Fall 2012 forecast.
Notes: The travel forecast is prepared semi-annually in May and October.
Brazil China India2012-09 7%
11%22%22%23%18%20%14%13%14%13%15%
3%5%8%12%9%6%7%6%14%11%19%13%
-18%-16%-15%-15%-15%-18%-3% 4% 1% na na na
2012-102012-112012-122013-012013-022013-032013-042013-042013-062013-072013-08
Airline Capacity (available seats)(% change previous year)
Source: U.S. Department of Transportation; FAA / INNOVATA, Inc. (2013-03-08)
Notes: Airline capacity reflects the planned total seat capacity airlines expect to offer in the upcoming months. Change in seat capacity is subject to normal changes in supply and demand and country-to-country air agreements.
According to UNWTO, the U.S. remains the global leader
in tourism receipts. In 2012, the U.S. widened its lead over
Spain (+1 percent) and France (+2 percent) by achieving
a +9 percent growth in receipts. The UNWTO described
the U.S. as “the star performer” of North America, driving
the majority of growth for the region. Despite the strength
of U.S. tourism demand trends, Brand USA’s efforts to
regain lost global market share remains a critical need.
Competition from both emerging and mature markets will
intensify in upcoming years as new travelers create new
regional demand in Asia and Latin America in particular,
and European economic recovery refuels demand for
short-haul international trips that had been depressed by
economic volatility in recent years.
The CompetitionRegaining our share of the world travel marketDespite the recent gains of the United States, our share of
the world travel market remains well below pre-September
11, 2001, figures. The United States ranks second to France
in terms of total international arrivals. And the United
States faces new competition from emerging economies
like China, Hong Kong, Malaysia, and Thailand. Competitor
destination countries are spending upwards of $150 million
a year to attract more travelers and, in many cases, their
budgets to promote their respective countries to interna-
tional travelers have increased by as much as two-fold.
The United States has largely missed out on the global
travel boom of the past few years. According to the U.S.
Travel Association, the nation’s share of long-haul arrivals
is still well below historic levels, having declined from 17
percent in 2000 to 12.4 percent in 2011. According to the
U.S. Travel Association, other countries are seeing double
and even triple the level of growth rates from Brazilian,
Chinese, and Indian travelers, all of whom have spend
more than most other travelers who visit the United States.
In this increasingly competitive environment, the work of
Brand USA is more critical than ever for the USA to regain
its share of the world travel market and accomplish the
goal set by the National Travel and Tourism Strategy of
welcoming 100 million visitors to the United States by the
end of 2021.

Bra
nd
US
A F
Y14
Bu
sin
ess
Pla
n •
14
S
ITU
AT
ION
AN
ALY
SIS Top 10 Markets
Brand USA is focused on markets that supply international travelers to the United States. Throughout
2014, a strong combination of consumer marketing and trade outreach will be active in each of the
top 10 markets that have the potential to generate the majority of international inbound travel and
spend to the United States.
2012 International Visitation to the USA
RANK COUNTRY 2012 ARRIVALS
1
Canada (+6%) 22.70 MillionCanada improved its position as the leader in arrivals to the United States, setting a volume record for the third consecutive year. One-half of the 6 percent increase over 2011 was from the small one-night auto segment, which was up 35 percent for the year. Monthly jumps in this segment began in June, coinciding with an increase in the exemption limit on duty-free goods. Canada accounted for a 33.9 percent share of 2012 visitor volume.
2
Mexico (+8%) 14.51 MillionMexico visitor volume expanded in 2012 for the third consecutive year and surpassed the 2000 record of 14.3 million. As usual from this market, monthly performance throughout the year produced no discernible patterns. Mexico accounted for a 21.5 percent share of 2012 visitor volume.
3
United Kingdom (-2%) 3.76 MillionUnited Kingdom visitor volume was down in 2012 for the fourth consecutive year. Visitor volume is now down nearly one million visitors from the 2000 peak of 4.7 million. Monthly moving averages all remain in negative territory, providing a bearish outlook for 2013. The U.K. accounted for a 6.1% share of 2012 visitor volume.
4
Japan (+14%) 3.70 MillionPost-tsunami optimism for a recovery in visitor volume was finally rewarded in 2012. There was a sharp increase in visitation, with the U.S. volume reaching five percentage points above the solid total outbound performance to the world (+9 percent). The 2012 visitor volume remains well below the 1997 record of 5.4 million visitors. Japan accounted for a 5.2 percent share of 2012 visitor volume.
5
Germany (+3%) 1.88 MillionHeading into the last quarter of 2012, Germany’s YTD performance trend set hopes that the year might break the 2.0 million volume record set in 1996. Unfortunately, year-end negative monthly performances dashed those hopes as volume fell just short of the record. Germany accounted for a 2.9 percent share of 2012 volume.
6
Brazil (+19%) 1.79 MillionBrazil posted another double-digit growth rate in 2012. This performance extends the growth streak to nine years and resulted in a third consecutive record for arrivals. Brazil has now posted double-digit growth in 8 of the past 9 years. Brazil and Germany appear positioned to compete for the #5 spot in 2013. Brazil accounted for a 2.4 percent share of 2012 visitor volume.
7
China (+35%) 1.47 MillionChina’s 35 percent increase in 2012 visitor volume catapulted the country up two spots, surpassing both South Korea and France to reach 7th place in arrivals. This performance was the best in terms of percentage change among the top 30 origin markets. China accounted for a 1.7 percent share of 2012 visitor volume.
8
France (-3%) 1.46 MillionFrance slipped to the #8 spot as a result of a 3% decline in arrivals, coupled with China’s 35 percent growth. France’s 2012 performance continues the up-and-down trend seen over the past 12 years, with visitation having increased six times and decreased six times in that period. France accounted for a 2.4 percent share of 2012 visitor volume.
9
South Korea (+9%) 1.25 MillionSouth Korea posted a solid increase in 2012 to set a third consecutive arrivals record. Since inclusion in the Visa Waiver Program in late 2008, South Korea’s annual performance has been uneven at -2 percent, +49 percent, +3 percent, and now +8 percent. South Korea accounted for a 1.8 percent share of 2012 visitor volume.
10
Australia (+8%) 1.12 MillionAustralia built on steady performance and posted its eighth straight record year with 8 percent growth in 2012. The year included two months of performance declines, the first declines since June 2009. The 33 consecutive months of volume growth prior to these months is one of the longest growth strings of any origin country over the past few years. Australia accounted for a 1.7 percent share of 2012 visitor volume.
Source: OTTI 2012 Overseas Visitor Profile
SIT
UA
TIO
N A
NA
LYS
IS
Bran
d U
SA
FY
14 B
usin
ess P
lan • 15
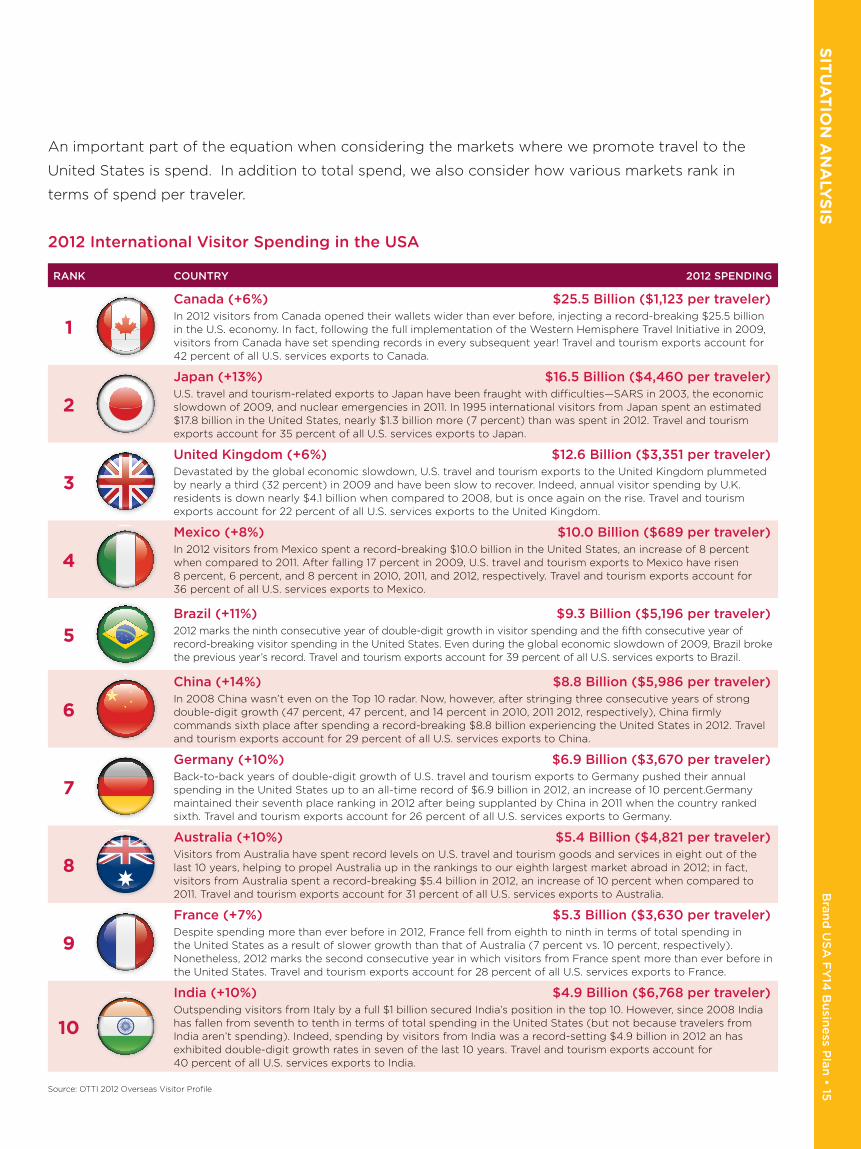
2012 International Visitor Spending in the USA
RANK COUNTRY 2012 SPENDING
1
Canada (+6%) $25.5 Billion ($1,123 per traveler)In 2012 visitors from Canada opened their wallets wider than ever before, injecting a record-breaking $25.5 billion in the U.S. economy. In fact, following the full implementation of the Western Hemisphere Travel Initiative in 2009, visitors from Canada have set spending records in every subsequent year! Travel and tourism exports account for 42 percent of all U.S. services exports to Canada.
2
Japan (+13%) $16.5 Billion ($4,460 per traveler)U.S. travel and tourism-related exports to Japan have been fraught with difficulties—SARS in 2003, the economic slowdown of 2009, and nuclear emergencies in 2011. In 1995 international visitors from Japan spent an estimated $17.8 billion in the United States, nearly $1.3 billion more (7 percent) than was spent in 2012. Travel and tourism exports account for 35 percent of all U.S. services exports to Japan.
3
United Kingdom (+6%) $12.6 Billion ($3,351 per traveler)Devastated by the global economic slowdown, U.S. travel and tourism exports to the United Kingdom plummeted by nearly a third (32 percent) in 2009 and have been slow to recover. Indeed, annual visitor spending by U.K. residents is down nearly $4.1 billion when compared to 2008, but is once again on the rise. Travel and tourism exports account for 22 percent of all U.S. services exports to the United Kingdom.
4
Mexico (+8%) $10.0 Billion ($689 per traveler)In 2012 visitors from Mexico spent a record-breaking $10.0 billion in the United States, an increase of 8 percent when compared to 2011. After falling 17 percent in 2009, U.S. travel and tourism exports to Mexico have risen 8 percent, 6 percent, and 8 percent in 2010, 2011, and 2012, respectively. Travel and tourism exports account for 36 percent of all U.S. services exports to Mexico.
5Brazil (+11%) $9.3 Billion ($5,196 per traveler)2012 marks the ninth consecutive year of double-digit growth in visitor spending and the fifth consecutive year of record-breaking visitor spending in the United States. Even during the global economic slowdown of 2009, Brazil broke the previous year’s record. Travel and tourism exports account for 39 percent of all U.S. services exports to Brazil.
6
China (+14%) $8.8 Billion ($5,986 per traveler)In 2008 China wasn’t even on the Top 10 radar. Now, however, after stringing three consecutive years of strong double-digit growth (47 percent, 47 percent, and 14 percent in 2010, 2011 2012, respectively), China firmly commands sixth place after spending a record-breaking $8.8 billion experiencing the United States in 2012. Travel and tourism exports account for 29 percent of all U.S. services exports to China.
7
Germany (+10%) $6.9 Billion ($3,670 per traveler)Back-to-back years of double-digit growth of U.S. travel and tourism exports to Germany pushed their annual spending in the United States up to an all-time record of $6.9 billion in 2012, an increase of 10 percent.Germany maintained their seventh place ranking in 2012 after being supplanted by China in 2011 when the country ranked sixth. Travel and tourism exports account for 26 percent of all U.S. services exports to Germany.
8
Australia (+10%) $5.4 Billion ($4,821 per traveler)Visitors from Australia have spent record levels on U.S. travel and tourism goods and services in eight out of the last 10 years, helping to propel Australia up in the rankings to our eighth largest market abroad in 2012; in fact, visitors from Australia spent a record-breaking $5.4 billion in 2012, an increase of 10 percent when compared to 2011. Travel and tourism exports account for 31 percent of all U.S. services exports to Australia.
9
France (+7%) $5.3 Billion ($3,630 per traveler)Despite spending more than ever before in 2012, France fell from eighth to ninth in terms of total spending in the United States as a result of slower growth than that of Australia (7 percent vs. 10 percent, respectively). Nonetheless, 2012 marks the second consecutive year in which visitors from France spent more than ever before in the United States. Travel and tourism exports account for 28 percent of all U.S. services exports to France.
10
India (+10%) $4.9 Billion ($6,768 per traveler)Outspending visitors from Italy by a full $1 billion secured India’s position in the top 10. However, since 2008 India has fallen from seventh to tenth in terms of total spending in the United States (but not because travelers from India aren’t spending). Indeed, spending by visitors from India was a record-setting $4.9 billion in 2012 an has exhibited double-digit growth rates in seven of the last 10 years. Travel and tourism exports account for 40 percent of all U.S. services exports to India.
Source: OTTI 2012 Overseas Visitor Profile
An important part of the equation when considering the markets where we promote travel to the
United States is spend. In addition to total spend, we also consider how various markets rank in
terms of spend per traveler.
Bra
nd
US
A F
Y14
Bu
sin
ess
Pla
n •
16
S
ITU
AT
ION
AN
ALY
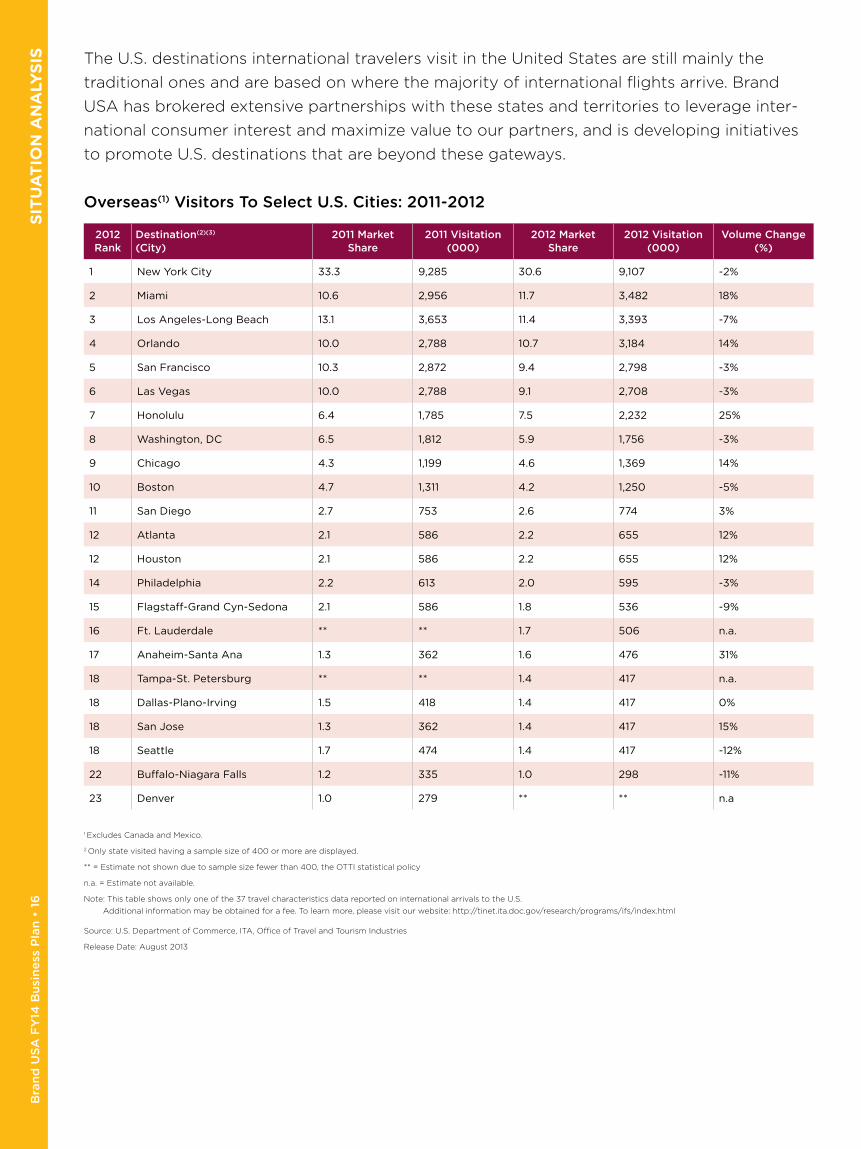
SIS The U.S. destinations international travelers visit in the United States are still mainly the
traditional ones and are based on where the majority of international flights arrive. Brand
USA has brokered extensive partnerships with these states and territories to leverage inter-
national consumer interest and maximize value to our partners, and is developing initiatives
to promote U.S. destinations that are beyond these gateways.
Overseas(1) Visitors To Select U�S� Cities: 2011-2012
2012 Rank
Destination(2)(3) (City)
2011 Market Share
2011 Visitation (000)
2012 Market Share
2012 Visitation (000)
Volume Change (%)
1 New York City 33.3 9,285 30.6 9,107 -2%
2 Miami 10.6 2,956 11.7 3,482 18%
3 Los Angeles-Long Beach 13.1 3,653 11.4 3,393 -7%
4 Orlando 10.0 2,788 10.7 3,184 14%
5 San Francisco 10.3 2,872 9.4 2,798 -3%
6 Las Vegas 10.0 2,788 9.1 2,708 -3%
7 Honolulu 6.4 1,785 7.5 2,232 25%
8 Washington, DC 6.5 1,812 5.9 1,756 -3%
9 Chicago 4.3 1,199 4.6 1,369 14%
10 Boston 4.7 1,311 4.2 1,250 -5%
11 San Diego 2.7 753 2.6 774 3%
12 Atlanta 2.1 586 2.2 655 12%
12 Houston 2.1 586 2.2 655 12%
14 Philadelphia 2.2 613 2.0 595 -3%
15 Flagstaff-Grand Cyn-Sedona 2.1 586 1.8 536 -9%
16 Ft. Lauderdale ** ** 1.7 506 n.a.
17 Anaheim-Santa Ana 1.3 362 1.6 476 31%
18 Tampa-St. Petersburg ** ** 1.4 417 n.a.
18 Dallas-Plano-Irving 1.5 418 1.4 417 0%
18 San Jose 1.3 362 1.4 417 15%
18 Seattle 1.7 474 1.4 417 -12%
22 Buffalo-Niagara Falls 1.2 335 1.0 298 -11%
23 Denver 1.0 279 ** ** n.a
1 Excludes Canada and Mexico.
2 Only state visited having a sample size of 400 or more are displayed.
** = Estimate not shown due to sample size fewer than 400, the OTTI statistical policy
n.a. = Estimate not available.
Note : This table shows only one of the 37 travel characteristics data reported on international arrivals to the U.S.
Additional information may be obtained for a fee. To learn more, please visit our website: http://tinet.ita.doc.gov/research/programs/ifs/index.html
Source: U.S. Department of Commerce, ITA, Office of Travel and Tourism Industries
Release Date: August 2013

SIT
UA
TIO
N A
NA
LYS
IS
Bran
d U
SA
FY
14 B
usin
ess P
lan • 17
Overseas(1) Visitors To Select U�S� States and Territories: 2010-2011
2012 Rank
Destination(2) (State/Territory)
2010 Market Share
2010 Visitation (000)
2011 Market Share
2011 Visitation (000)
Volume Change (%)
1 New York 34.1 9,508 31.3 9,315 -2%
2 Florida 20.4 5,688 22.1 6,577 16%
3 California 22.0 6,134 20.2 6,012 -2%
4 Hawaiian Islands 8.2 2,286 9.5 2,827 24%
5 Nevada 10.3 2,872 9.3 2,768 -4%
6 Illinois 4.5 1,255 4.7 1,399 11%
6 Guam 4.4 1,227 4.7 1,399 14%
8 Massachusetts 5.1 1,422 4.5 1,339 -6%
8 Texas 4.6 1,283 4.5 1,339 4%
10 Pennsylvania 3.3 920 3.2 952 4%
11 New Jersey 3.5 976 2.9 863 -12%
12 Arizona 3.1 864 2.7 804 -7%
13 Georgia 2.4 669 2.5 744 11%
14 Utah 1.8 502 1.6 476 -5%
15 Colorado 1.6 446 1.5 446 0%
15 Washington 1.8 502 1.5 446 -11%
17 North Carolina 1.2 335 1.3 387 16%
17 Virginia 1.3 362 1.3 387 7%
19 Ohio 1.0 279 1.2 357 28%
20 Maryland 1.2 335 1.0 298 -11%
20 Louisiana ** ** 1.0 298 n.a.
22 Connecticut 1.1 307 0.9 268 -13%
1 Excludes Canada and Mexico.
2 Only state visited having a sample size of 400 or more are displayed.
** = Estimate not shown due to sample size fewer than 400, the OTTI statistical policy
n.a. = Estimate not available.
Note : This table shows only one of the 37 travel characteristics data reported on international arrivals to the U.S.
Additional information may be obtained for a fee. To learn more, please visit our website: http://tinet.ita.doc.gov/research/programs/ifs/index.html
Source: U.S. Department of Commerce, ITA, Office of Travel and Tourism Industries
Release Date: August 2013
Bra
nd
US
A F
Y14
Bu
sin
ess
Pla
n •
18
S
ITU
AT
ION
AN
ALY
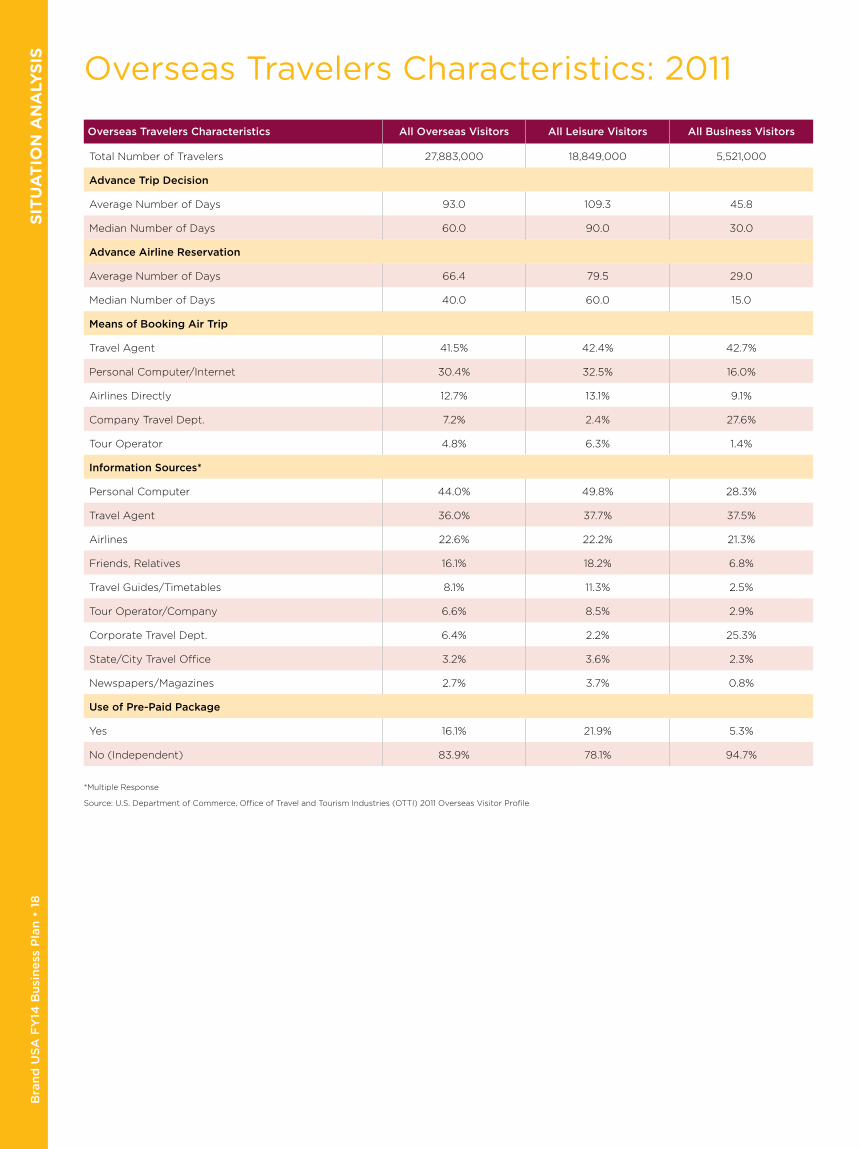
SIS Overseas Travelers Characteristics: 2011
Overseas Travelers Characteristics All Overseas Visitors All Leisure Visitors All Business Visitors
Total Number of Travelers 27,883,000 18,849,000 5,521,000
Advance Trip Decision
Average Number of Days 93.0 109.3 45.8
Median Number of Days 60.0 90.0 30.0
Advance Airline Reservation
Average Number of Days 66.4 79.5 29.0
Median Number of Days 40.0 60.0 15.0
Means of Booking Air Trip
Travel Agent 41.5% 42.4% 42.7%
Personal Computer/Internet 30.4% 32.5% 16.0%
Airlines Directly 12.7% 13.1% 9.1%
Company Travel Dept. 7.2% 2.4% 27.6%
Tour Operator 4.8% 6.3% 1.4%
Information Sources*
Personal Computer 44.0% 49.8% 28.3%
Travel Agent 36.0% 37.7% 37.5%
Airlines 22.6% 22.2% 21.3%
Friends, Relatives 16.1% 18.2% 6.8%
Travel Guides/Timetables 8.1% 11.3% 2.5%
Tour Operator/Company 6.6% 8.5% 2.9%
Corporate Travel Dept. 6.4% 2.2% 25.3%
State/City Travel Office 3.2% 3.6% 2.3%
Newspapers/Magazines 2.7% 3.7% 0.8%
Use of Pre-Paid Package
Yes 16.1% 21.9% 5.3%
No (Independent) 83.9% 78.1% 94.7%
*Multiple Response
Source: U.S. Department of Commerce, Office of Travel and Tourism Industries (OTTI) 2011 Overseas Visitor Profile
SIT
UA
TIO
N A
NA
LYS
IS
Bran
d U
SA
FY
14 B
usin
ess P
lan • 19
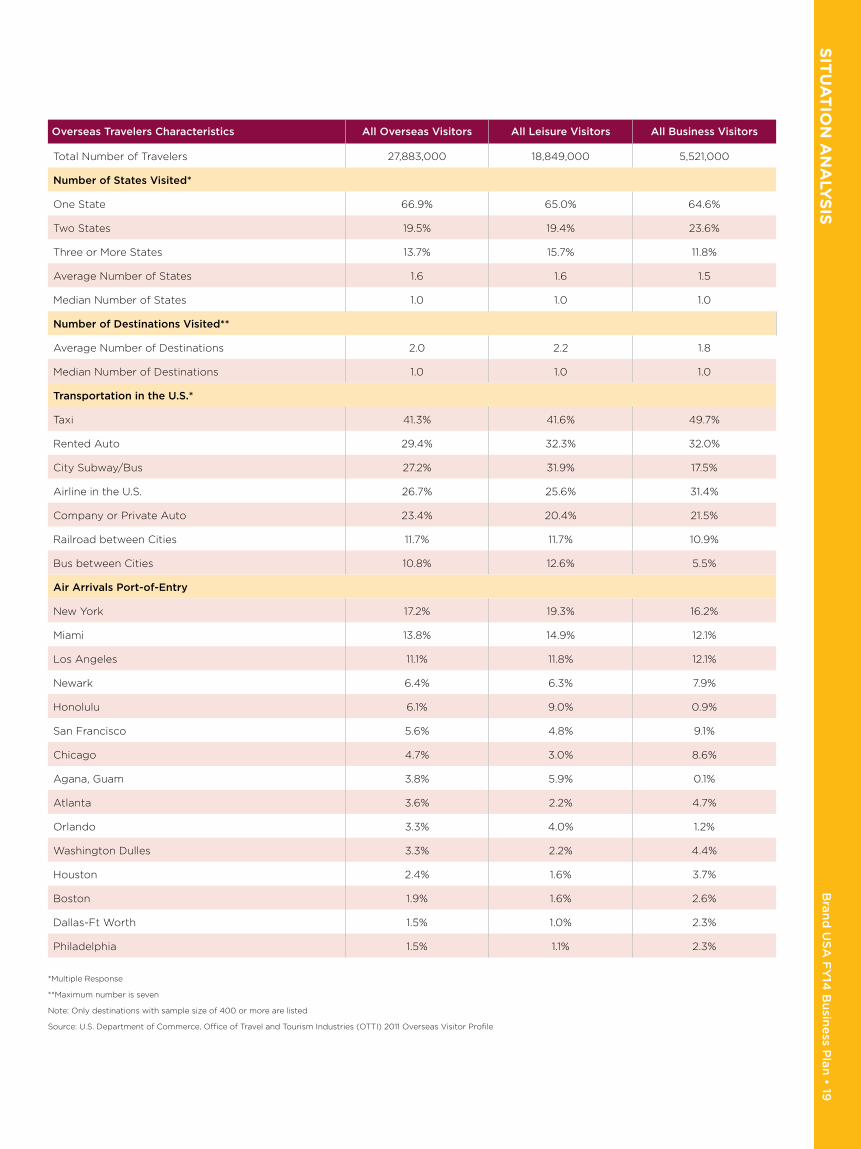
Overseas Travelers Characteristics All Overseas Visitors All Leisure Visitors All Business Visitors
Total Number of Travelers 27,883,000 18,849,000 5,521,000
Number of States Visited*
One State 66.9% 65.0% 64.6%
Two States 19.5% 19.4% 23.6%
Three or More States 13.7% 15.7% 11.8%
Average Number of States 1.6 1.6 1.5
Median Number of States 1.0 1.0 1.0
Number of Destinations Visited**
Average Number of Destinations 2.0 2.2 1.8
Median Number of Destinations 1.0 1.0 1.0
Transportation in the U.S.*
Taxi 41.3% 41.6% 49.7%
Rented Auto 29.4% 32.3% 32.0%
City Subway/Bus 27.2% 31.9% 17.5%
Airline in the U.S. 26.7% 25.6% 31.4%
Company or Private Auto 23.4% 20.4% 21.5%
Railroad between Cities 11.7% 11.7% 10.9%
Bus between Cities 10.8% 12.6% 5.5%
Air Arrivals Port-of-Entry
New York 17.2% 19.3% 16.2%
Miami 13.8% 14.9% 12.1%
Los Angeles 11.1% 11.8% 12.1%
Newark 6.4% 6.3% 7.9%
Honolulu 6.1% 9.0% 0.9%
San Francisco 5.6% 4.8% 9.1%
Chicago 4.7% 3.0% 8.6%
Agana, Guam 3.8% 5.9% 0.1%
Atlanta 3.6% 2.2% 4.7%
Orlando 3.3% 4.0% 1.2%
Washington Dulles 3.3% 2.2% 4.4%
Houston 2.4% 1.6% 3.7%
Boston 1.9% 1.6% 2.6%
Dallas-Ft Worth 1.5% 1.0% 2.3%
Philadelphia 1.5% 1.1% 2.3%
*Multiple Response
**Maximum number is seven
Note: Only destinations with sample size of 400 or more are listed
Source: U.S. Department of Commerce, Office of Travel and Tourism Industries (OTTI) 2011 Overseas Visitor Profile

Bra
nd
US
A F
Y14
Bu
sin
ess
Pla
n •
20
S
ITU
AT
ION
AN
ALY
SIS
Overseas Travelers Characteristics All Overseas Visitors All Leisure Visitors All Business Visitors
Total Number of Travelers 27,883,000 18,849,000 5,521,000
Leisure/Recreational Activities*
Shopping 88.1% 91.5% 80.8%
Dining in Restaurants 83.5% 84.6% 84.5%
Sightseeing in Cities 44.4% 52.1% 28.9%
Visiting Historical Places 41.3% 47.9% 26.7%
Amusement/Theme Parks 29.6% 35.6% 13.9%
Visiting Small Towns/Villages 27.1% 30.8% 15.7%
Cultural/Heritage Sights 24.1% 28.6% 13.4%
Art Galleries, Museums 23.5% 26.5% 14.8%
Water Sports/Sunbathing 20.8% 26.3% 6.8%
Visiting National Parks 20.3% 24.3% 11.9%
Touring the Countryside 19.2% 22.1% 11.1%
Guided Tours 17.8% 23.0% 7.3%
Concerts, Plays, Musicals 16.6% 19.4% 10.4%
Nightclub/ Dancing 12.8% 13.2% 12.4%
Casinos/Gambling 10.5% 12.3% 7.1%
Cruises 7.5% 9.6% 3.5%
Attending Sports Events 7.1% 7.3% 5.3%
Ethnic Heritage Sights 4.4% 5.1% 2.6%
Golf/Tennis 4.4% 4.4% 3.7%
Camping, Hiking 4.2% 4.8% 2.9%
Visiting American Indian Communities 3.5% 4.2% 1.9%
Environmental/Ecological Excur. 3.4% 3.9% 2.7%
Snow Skiing 1.8% 1.9% 1.6%
Hunting/Fishing 1.6% 1.7% 1.1%
Ranch Vacations 1.4% 1.5% 0.8%
*Multiple Response
**Maximum number is seven
Source: U.S. Department of Commerce, Office of Travel and Tourism Industries (OTTI) 2011 Overseas Visitor Profile
Positioning and Results
Bra
nd
US
A F
Y14
Bu
sin
ess
Pla
n •
22
P
OS
ITIO
NIN
G A
ND
RE
SU
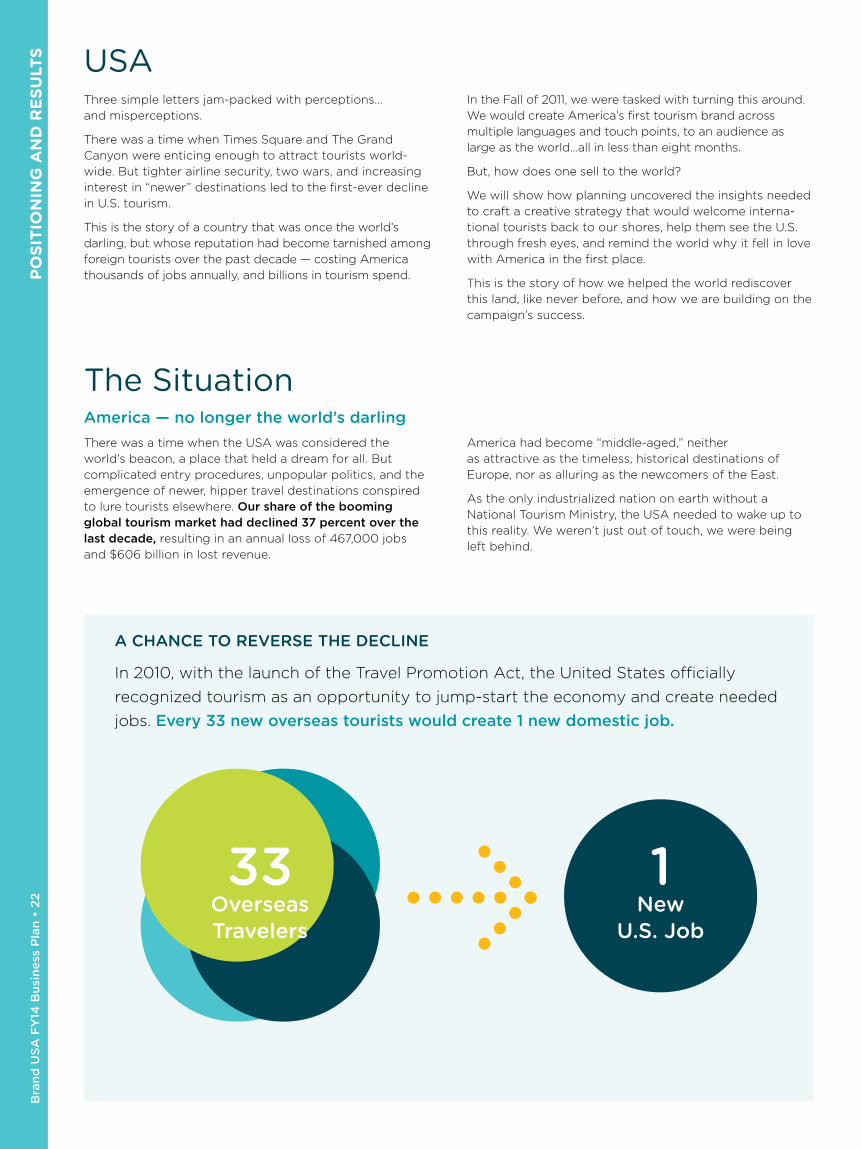
LTS USA
Three simple letters jam-packed with perceptions…
and misperceptions.
There was a time when Times Square and The Grand
Canyon were enticing enough to attract tourists world-
wide. But tighter airline security, two wars, and increasing
interest in “newer” destinations led to the first-ever decline
in U.S. tourism.
This is the story of a country that was once the world’s
darling, but whose reputation had become tarnished among
foreign tourists over the past decade — costing America
thousands of jobs annually, and billions in tourism spend.
In the Fall of 2011, we were tasked with turning this around.
We would create America’s first tourism brand across
multiple languages and touch points, to an audience as
large as the world…all in less than eight months.
But, how does one sell to the world?
We will show how planning uncovered the insights needed
to craft a creative strategy that would welcome interna-
tional tourists back to our shores, help them see the U.S.
through fresh eyes, and remind the world why it fell in love
with America in the first place.
This is the story of how we helped the world rediscover
this land, like never before, and how we are building on the
campaign’s success.
The SituationAmerica — no longer the world’s darlingThere was a time when the USA was considered the
world’s beacon, a place that held a dream for all. But
complicated entry procedures, unpopular politics, and the
emergence of newer, hipper travel destinations conspired
to lure tourists elsewhere. Our share of the booming global tourism market had declined 37 percent over the last decade, resulting in an annual loss of 467,000 jobs
and $606 billion in lost revenue.
America had become “middle-aged,” neither
as attractive as the timeless, historical destinations of
Europe, nor as alluring as the newcomers of the East.
As the only industrialized nation on earth without a
National Tourism Ministry, the USA needed to wake up to
this reality. We weren’t just out of touch, we were being
left behind.
1New
U�S� Job
33Overseas Travelers
A CHANCE TO REVERSE THE DECLINE
In 2010, with the launch of the Travel Promotion Act, the United States officially
recognized tourism as an opportunity to jump-start the economy and create needed
jobs. Every 33 new overseas tourists would create 1 new domestic job.
PO
SIT
ION
ING
AN
D R
ES
ULT
S
Bran
d U
SA
FY
14 B
usin
ess P
lan • 2
3
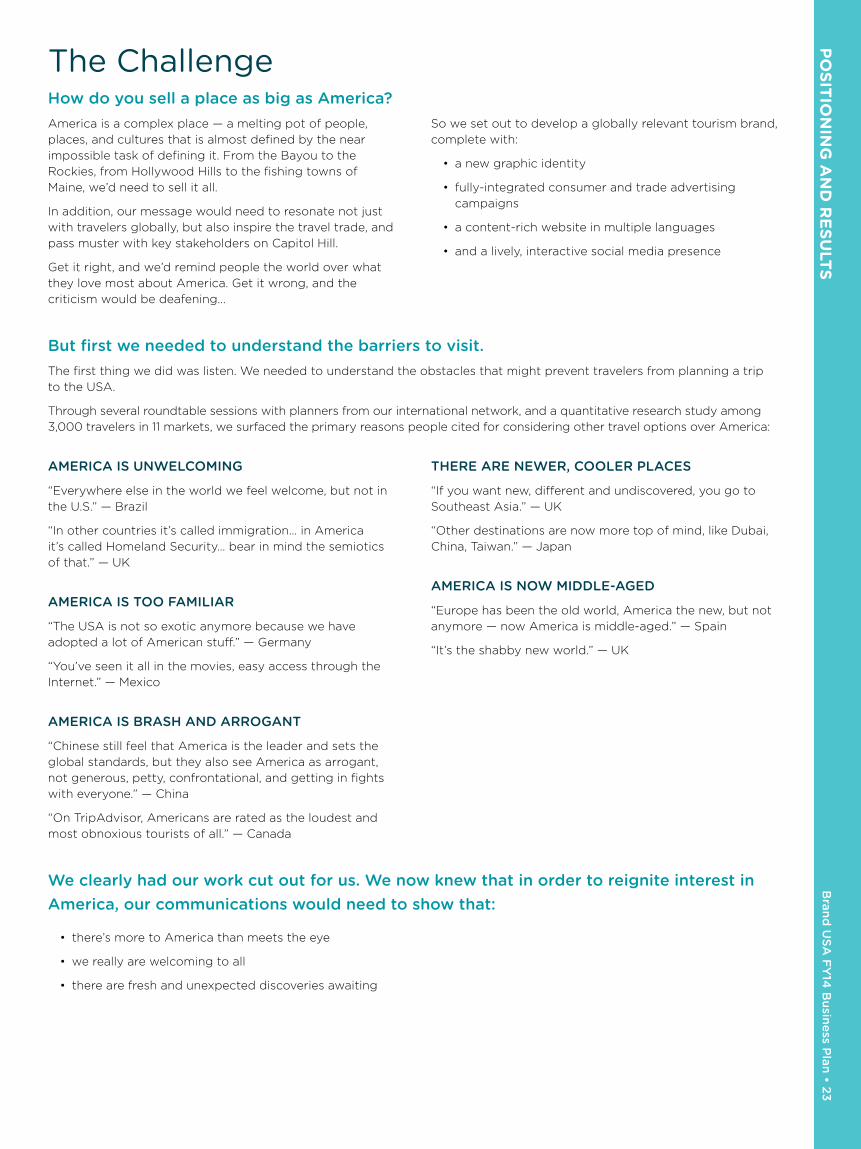
The ChallengeHow do you sell a place as big as America?America is a complex place — a melting pot of people,
places, and cultures that is almost defined by the near
impossible task of defining it. From the Bayou to the
Rockies, from Hollywood Hills to the fishing towns of
Maine, we’d need to sell it all.
In addition, our message would need to resonate not just
with travelers globally, but also inspire the travel trade, and
pass muster with key stakeholders on Capitol Hill.
Get it right, and we’d remind people the world over what
they love most about America. Get it wrong, and the
criticism would be deafening...
So we set out to develop a globally relevant tourism brand,
complete with:
• a new graphic identity
• fully-integrated consumer and trade advertising
campaigns
• a content-rich website in multiple languages
• and a lively, interactive social media presence
But first we needed to understand the barriers to visit�The first thing we did was listen. We needed to understand the obstacles that might prevent travelers from planning a trip
to the USA.
Through several roundtable sessions with planners from our international network, and a quantitative research study among
3,000 travelers in 11 markets, we surfaced the primary reasons people cited for considering other travel options over America:
AMERICA IS UNWELCOMING
“Everywhere else in the world we feel welcome, but not in
the U.S.” — Brazil
“In other countries it’s called immigration… in America
it’s called Homeland Security… bear in mind the semiotics
of that.” — UK
AMERICA IS TOO FAMILIAR
“The USA is not so exotic anymore because we have
adopted a lot of American stuff.” — Germany
“You’ve seen it all in the movies, easy access through the
Internet.” — Mexico
AMERICA IS BRASH AND ARROGANT
“Chinese still feel that America is the leader and sets the
global standards, but they also see America as arrogant,
not generous, petty, confrontational, and getting in fights
with everyone.” — China
“On TripAdvisor, Americans are rated as the loudest and
most obnoxious tourists of all.” — Canada
THERE ARE NEWER, COOLER PLACES
“If you want new, different and undiscovered, you go to
Southeast Asia.” — UK
“Other destinations are now more top of mind, like Dubai,
China, Taiwan.” — Japan
AMERICA IS NOW MIDDLE-AGED
“Europe has been the old world, America the new, but not
anymore — now America is middle-aged.” — Spain
“It’s the shabby new world.” — UK
We clearly had our work cut out for us� We now knew that in order to reignite interest in America, our communications would need to show that:
• there’s more to America than meets the eye
• we really are welcoming to all
• there are fresh and unexpected discoveries awaiting
Bra
nd
US
A F
Y14
Bu
sin
ess
Pla
n •
24
P
OS
ITIO
NIN
G A
ND
RE
SU
LTS
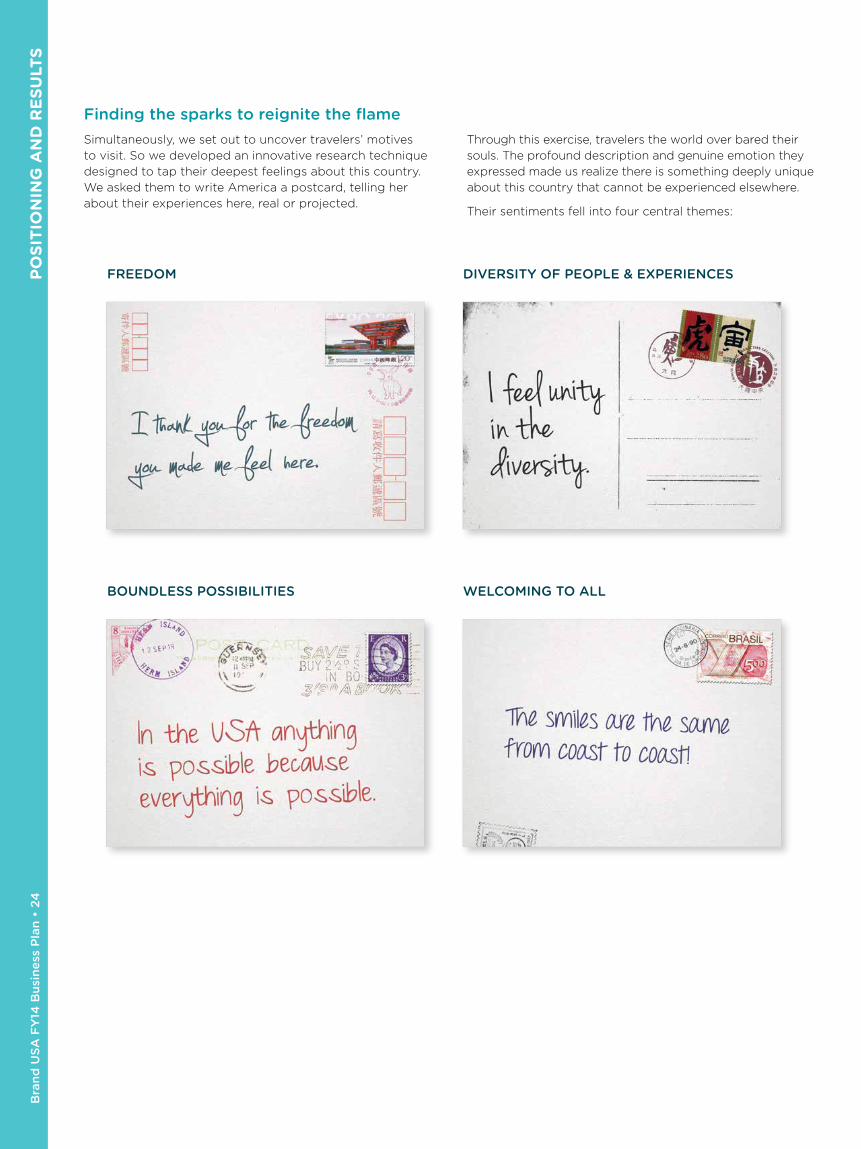
Finding the sparks to reignite the flameSimultaneously, we set out to uncover travelers’ motives
to visit. So we developed an innovative research technique
designed to tap their deepest feelings about this country.
We asked them to write America a postcard, telling her
about their experiences here, real or projected.
Through this exercise, travelers the world over bared their
souls. The profound description and genuine emotion they
expressed made us realize there is something deeply unique
about this country that cannot be experienced elsewhere.
Their sentiments fell into four central themes:
STEP TWO Freedom
Finding the sparks to reignite the flame
Simultaneously, we set out to uncover
travelers’ motives to visit. So we
developed an innovative research
technique designed to tap their deepest
feelings about this country. We asked
tourists to write America a postcard,
telling her about their experiences here,
real or projected.
Through this exercise, travelers the world
over bared their souls. The profound
description and genuine emotion they
expressed made us realize there is
something deeply unique about this
country that cannot be experienced
elsewhere.
Their sentiments fell into four central
themes:
Diversity of People & Experiences
Boundless Possibilities Welcoming to All
FREEDOM
BOUNDLESS POSSIBILITIES
DIVERSITY OF PEOPLE & EXPERIENCES
WELCOMING TO ALL
PO
SIT
ION
ING
AN
D R
ES
ULT
S
Bran
d U
SA
FY
14 B
usin
ess P
lan • 2
5
The “Aha” MomentAmerica is more than a destination, it’s an IDEA
We had uncovered an embarrassment of riches — and landed right on top of our insight. We
learned that what people love best about America, even more than the destination itself, are
the very ideals the country was founded on: freedom, diversity and unbounded possibilities.
In order to get it right, we’d need to sell the destination AND the idea
The destination aspect alone doesn’t tell the full story of America. But selling the idea on its
own could come across as more civics lesson than invitation.
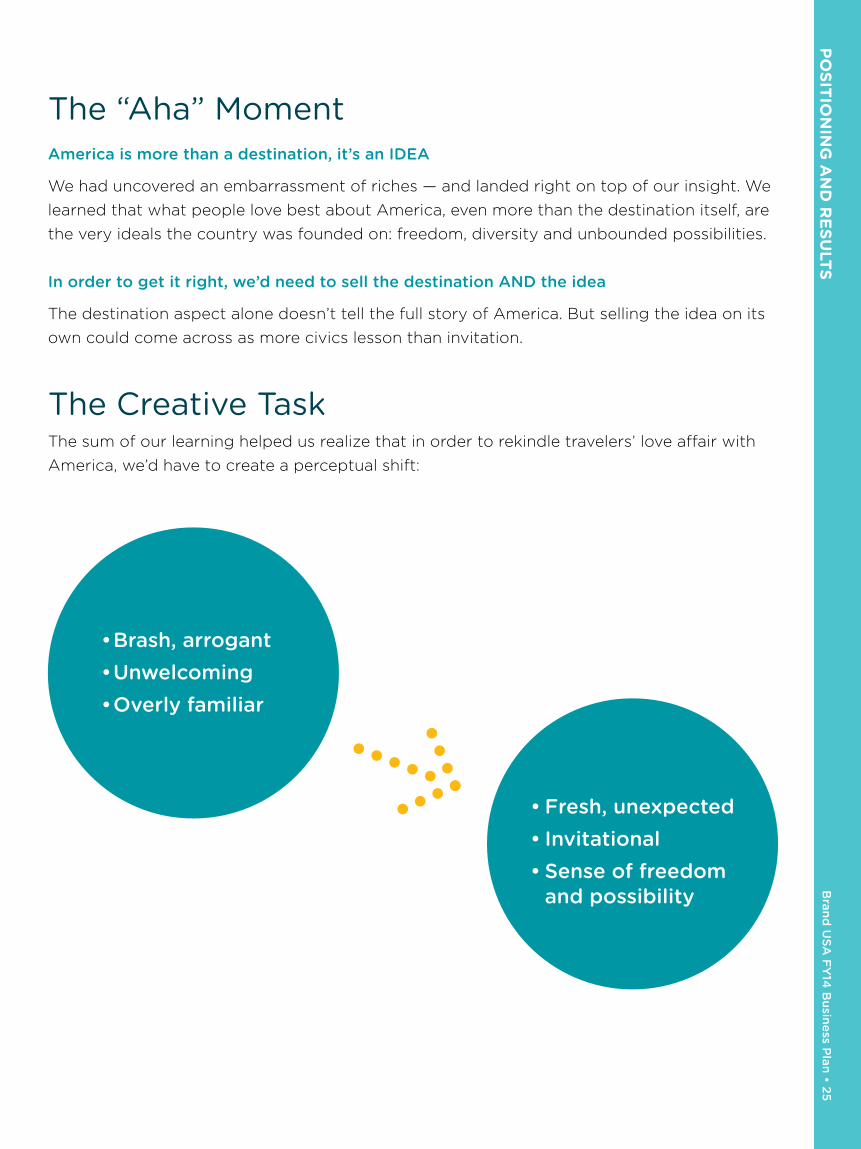
The Creative TaskThe sum of our learning helped us realize that in order to rekindle travelers’ love affair with America, we’d have to create a perceptual shift:
• Brash, arrogant
• Unwelcoming
• Overly familiar
• Fresh, unexpected
• Invitational
• Sense of freedom and possibility
Bra
nd
US
A F
Y14
Bu
sin
ess
Pla
n •
26
P
OS
ITIO
NIN
G A
ND
RE
SU
LTS A STRATEGY TO BRIDGE THE GAP
Our brand theme became the catalyst for creating the necessary shift from being seen
as an arrogant, unwelcoming and predictable nation, to that of a beckoning land of
boundless possibilities.
Brand Strategy“The United States of Awesome Possibilities Welcomes Everyone”
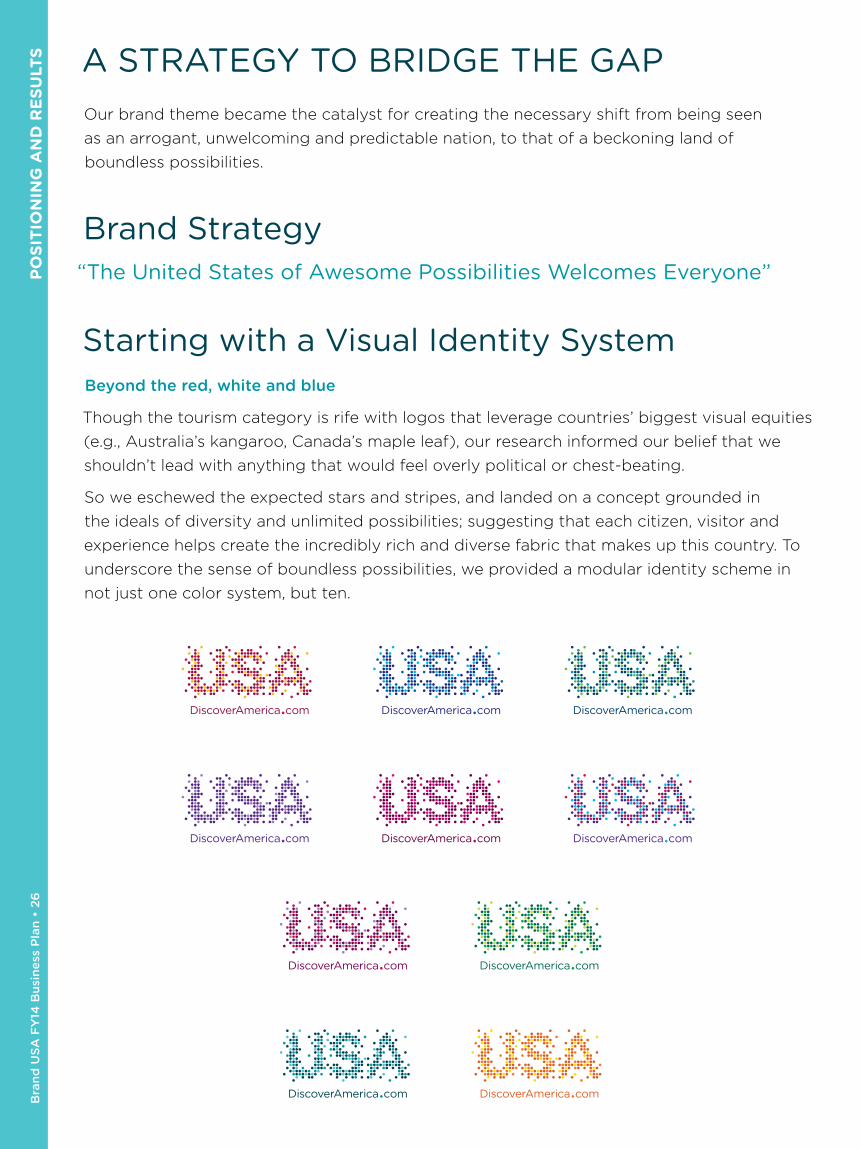
Starting with a Visual Identity SystemBeyond the red, white and blue
Though the tourism category is rife with logos that leverage countries’ biggest visual equities
(e.g., Australia’s kangaroo, Canada’s maple leaf), our research informed our belief that we
shouldn’t lead with anything that would feel overly political or chest-beating.
So we eschewed the expected stars and stripes, and landed on a concept grounded in
the ideals of diversity and unlimited possibilities; suggesting that each citizen, visitor and
experience helps create the incredibly rich and diverse fabric that makes up this country. To
underscore the sense of boundless possibilities, we provided a modular identity scheme in
not just one color system, but ten.
Beyond the red, white and blue
Though the tourism category is rife with logos that leverage countries’ biggest visual equities (e.g., Australia’s kangaroo, Canada’s maple
leaf), our research informed our belief that we shouldn’t lead with anything that would feel overly political or chest-beating.
So we eschewed the expected stars and stripes, and landed on a concept grounded in the ideals of diversity and unlimited possibilities;
suggesting that each citizen, visitor and experience helps create the incredibly rich and diverse fabric that makes up this country.
To underscore the sense of boundless possibilities, we provided a modular identity scheme in not just one color system, but ten.
STARTING WITH A VISUAL IDENTITY SYSTEM
PO
SIT
ION
ING
AN
D R
ES
ULT
S
Bran
d U
SA
FY
14 B
usin
ess P
lan • 2
7
The CampaignCommunicating to an audience as big as the worldFrom those who were familiar with the United States
(such as Canadians and the Brits), to newer travelers
from further afield — our communications would need to
speak to them all. We’d have to demonstrate a breadth of
possibilities, beyond what they thought they knew, and
welcome them, as though for the first time.
After four rounds of creative-testing in 13 international
markets, we landed on the idea of using the universal
language of music as a cornerstone of the campaign.
We felt that music would have the power to accomplish
emotionally what words alone couldn’t.
We reached out to Grammy Award winner, Rosanne
Cash, daughter of American music icon Johnny Cash, to
turn our insights into an original song that would invite
the world to come experience America. While the song
is distinctly “Americana” in tone, the welcome becomes
universal as musicians from around the world unite with
Rosanne in song.
The song was married to visuals that show our greatest-hit
landmarks (for new travelers), with off-the-beaten-path
locales and experiences (for those who were overly familiar).
The result is an anthem that shows America the destina-
tion, while simultaneously emanating a feeling of freedom
and limitless possibilities.
www.youtube.com/YourDiscoverAmerica
Communicating to an audience as big as the world
From those who were familiar with the US (such as Canadians and the
Brits), to newer travelers from further afield — our communications
would need to speak to them all. We’d have to demonstrate a breadth of
possibilities, beyond what they thought they knew, and welcome them,
as though for the first time.
After four rounds of creative-testing in 13 international markets, we
landed on the idea of using the universal language of music as a
cornerstone of our campaign. We felt that music would have the power
to accomplish emotionally what words alone couldn’t.
We reached out to Grammy Award winner, Rosanne Cash, daughter of
American music icon Johnny Cash, to turn our insights into an original
song that would invite the world to come experience America. While the
song is distinctly “Americana” in tone, the welcome becomes universal
as musicians from around the world unite with Rosanne in song.
The song was married to visuals that show our greatest-hit landmarks
(for new travelers), with off-the-beaten-path locales and experiences
(for those who were overly famliar).
The result is an anthem that shows America the destination, while
simultaneously emanating a feeling of freedom and limitless
possibilities, open to all.
THE CAMPAIGN
www.youtube.com/user/YourDiscoverAmerica
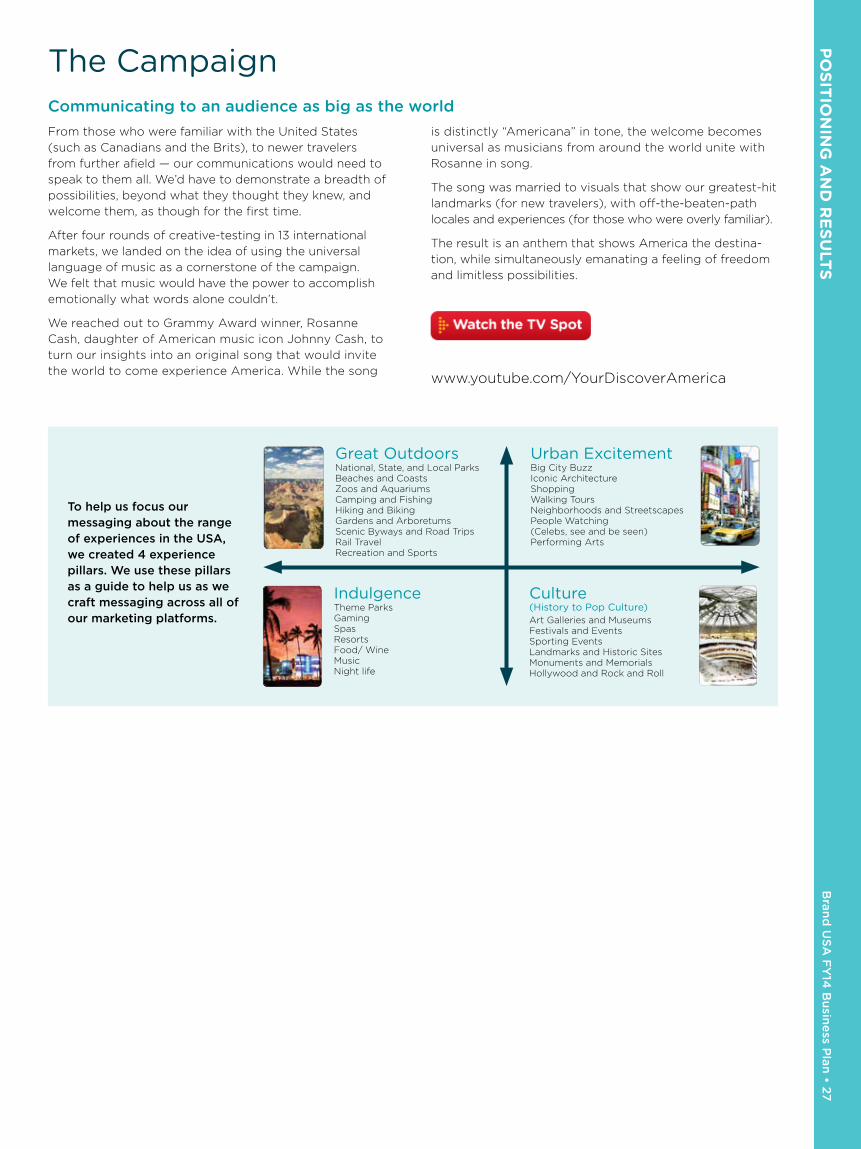
Great OutdoorsNational, State, and Local ParksBeaches and CoastsZoos and AquariumsCamping and FishingHiking and BikingGardens and ArboretumsScenic Byways and Road TripsRail TravelRecreation and Sports
IndulgenceTheme ParksGaming SpasResortsFood/ WineMusic Night life
Urban ExcitementBig City BuzzIconic ArchitectureShoppingWalking ToursNeighborhoods and StreetscapesPeople Watching (Celebs, see and be seen) Performing Arts
Culture (History to Pop Culture)Art Galleries and MuseumsFestivals and EventsSporting EventsLandmarks and Historic SitesMonuments and MemorialsHollywood and Rock and Roll
To help us focus our messaging about the range of experiences in the USA, we created 4 experience pillars. We use these pillars as a guide to help us as we craft messaging across all of our marketing platforms.
Bra
nd
US
A F
Y14
Bu
sin
ess
Pla
n •
28
P
OS
ITIO
NIN
G A
ND
RE
SU
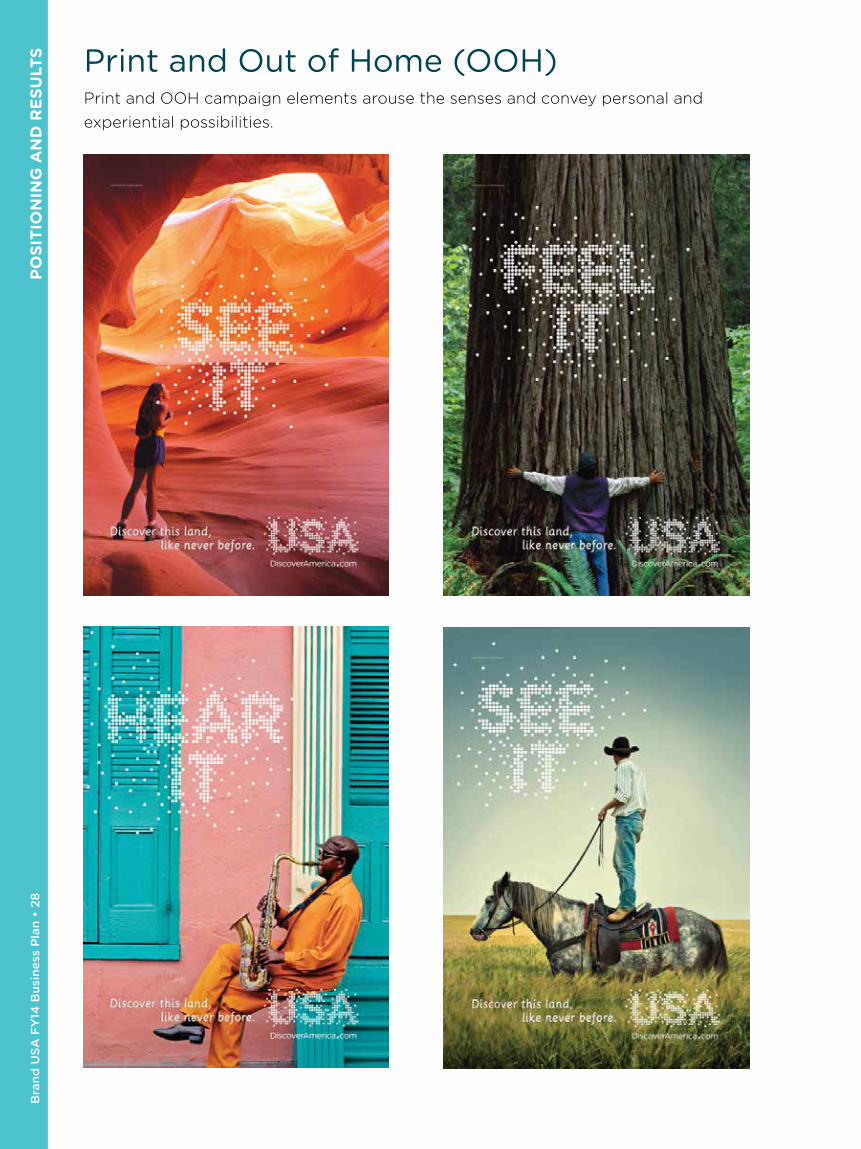
LTS Print and Out of Home (OOH)
Print and OOH campaign elements arouse the senses and convey personal and
experiential possibilities.The print and OOH arouses the senses and conveys the feeling of personal and experiential possibilities.
THE CAMPAIGN ( continued )
The print and OOH arouses the senses and conveys the feeling of personal and experiential possibilities.
THE CAMPAIGN ( continued )

PO
SIT
ION
ING
AN
D R
ES
ULT
S
Bran
d U
SA
FY
14 B
usin
ess P
lan • 2
9
The website invites unlimited exploration of American experiences like never before,
from the Austin music scene to Oklahoma cowboy culture and destinations large and
small and in between.
Social media incites a global conversation and a contagious desire to share the possibilities.
The website invites unlimited exploration of American experiences like never before, from the Austin music scene to Oklahoma cowboy culture.
THE CAMPAIGN ( continued )
Social media incites a global conversation and a contagious desire to share the possibilities.
THE CAMPAIGN ( continued )
The website invites unlimited exploration of American experiences like never before, from the Austin music scene to Oklahoma cowboy culture.
THE CAMPAIGN ( continued )
Bra
nd
US
A F
Y14
Bu
sin
ess
Pla
n •
30
P
OS
ITIO
NIN
G A
ND
RE
SU
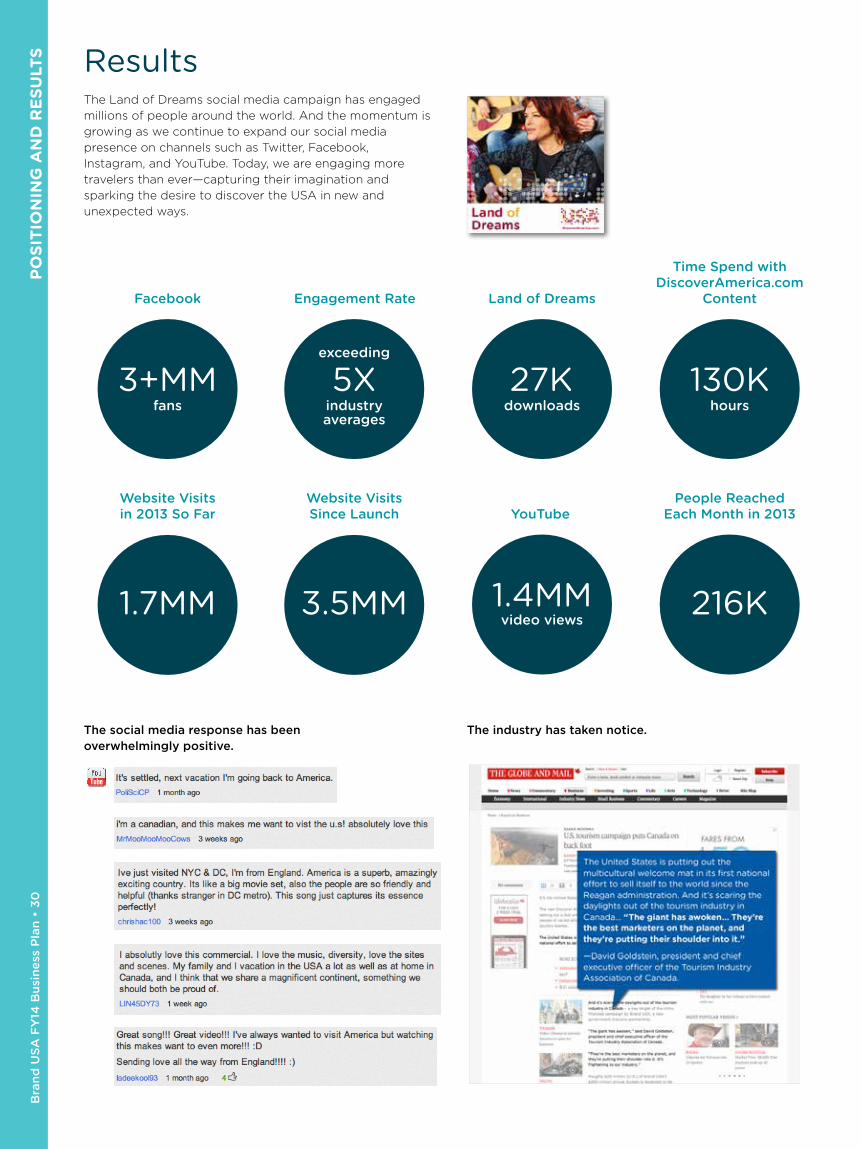
LTS Results
The Land of Dreams social media campaign has engaged
millions of people around the world. And the momentum is
growing as we continue to expand our social media
presence on channels such as Twitter, Facebook,
Instagram, and YouTube. Today, we are engaging more
travelers than ever—capturing their imagination and
sparking the desire to discover the USA in new and
unexpected ways.
RESULTS
99%positive
sentiments
Social Media Sentiments
2MMin 3 months
DiscoverAmerica.comPage Views
20Ksong
downloads
Land of Dreams
In the first eight weeks of the campaign in our three launch
markets, we’ve succeeded in capturing the world’s attention, and
sparking the desire to discover the USA in new, unexpected ways.
500Kviews
YouTube Channel
YouTube
Time Spend with DiscoverAmerica�com
ContentEngagement Rate
People Reached Each Month in 2013
Website Visits in 2013 So Far
Land of Dreams
Website VisitsSince Launch
3+MMfans
1.4MMvideo views
130Khours
216K1.7MM
27Kdownloads
3.5MM
5Xindustryaverages
exceeding
The social media response has been overwhelmingly positive.
RESULTS ( continued )
The industry has taken notice.The social media response has been overwhelmingly positive.
The industry has taken notice.

PO
SIT
ION
ING
AN
D R
ES
ULT
S
Bran
d U
SA
FY
14 B
usin
ess P
lan • 3
1
Inaugural Campaign Results
Brand USA Image Attributes Brand USA Image Attributes Post- vs� Pre- Launch Post- vs� Pre- Launch
+5 pts“A place where you
always feel welcome” Japan
+10 pts“A place with limitless
possibilities”UK
+8 pts“Has something
for everyone”UK
+11 pts“Adventurous” Japan +16 pts“A place to
indulge myself”Canada
+8 pts“Energetic” UK
+11 pts“Optimistic” UK
+11 pts“Friendly” Canada
Japan
UK
Canada
Relative Increase
+12%
+22%
+14%
Post-Campaign
67%
57%
71%
Pre-Campaign
59%
51%
58%
Intent to visit the USA is up since campaign launch in core markets:Tracking proves the perceptual shift is underway!*
The Land of Dreams campaign kicked off
strong from the beginning with results that
continue to grow.
+21 pts
vs. Pre-LaunchBRAND USA IMAGE
ATTRIBUTES (UK)
Destination on its way up
* Initial six-week tracking study
Bra
nd
US
A F
Y14
Bu
sin
ess
Pla
n •
32
P
OS
ITIO
NIN
G A
ND
RE
SU
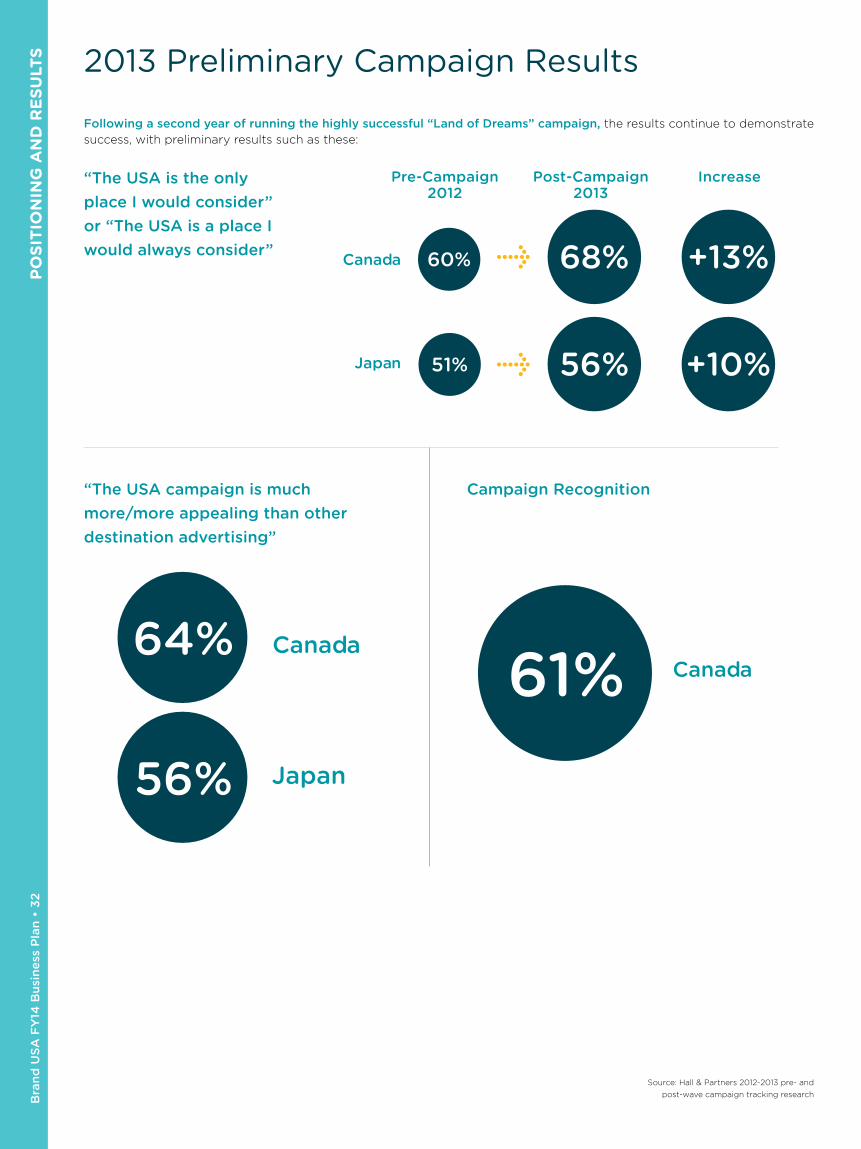
LTS 2013 Preliminary Campaign Results
Following a second year of running the highly successful “Land of Dreams” campaign, the results continue to demonstrate
success, with preliminary results such as these:
“The USA is the only place I would consider” or “The USA is a place I would always consider”
“The USA campaign is much more/more appealing than other destination advertising”
Campaign Recognition
Japan
Canada +13%
+10%56%
68%
51%
60%
Pre-Campaign 2012
Post-Campaign 2013
Increase
Canada61%
Japan
Canada64%
56%
Source: Hall & Partners 2012-2013 pre- and
post-wave campaign tracking research
PO
SIT
ION
ING
AN
D R
ES
ULT
S
Bran
d U
SA
FY
14 B
usin
ess P
lan • 3
3
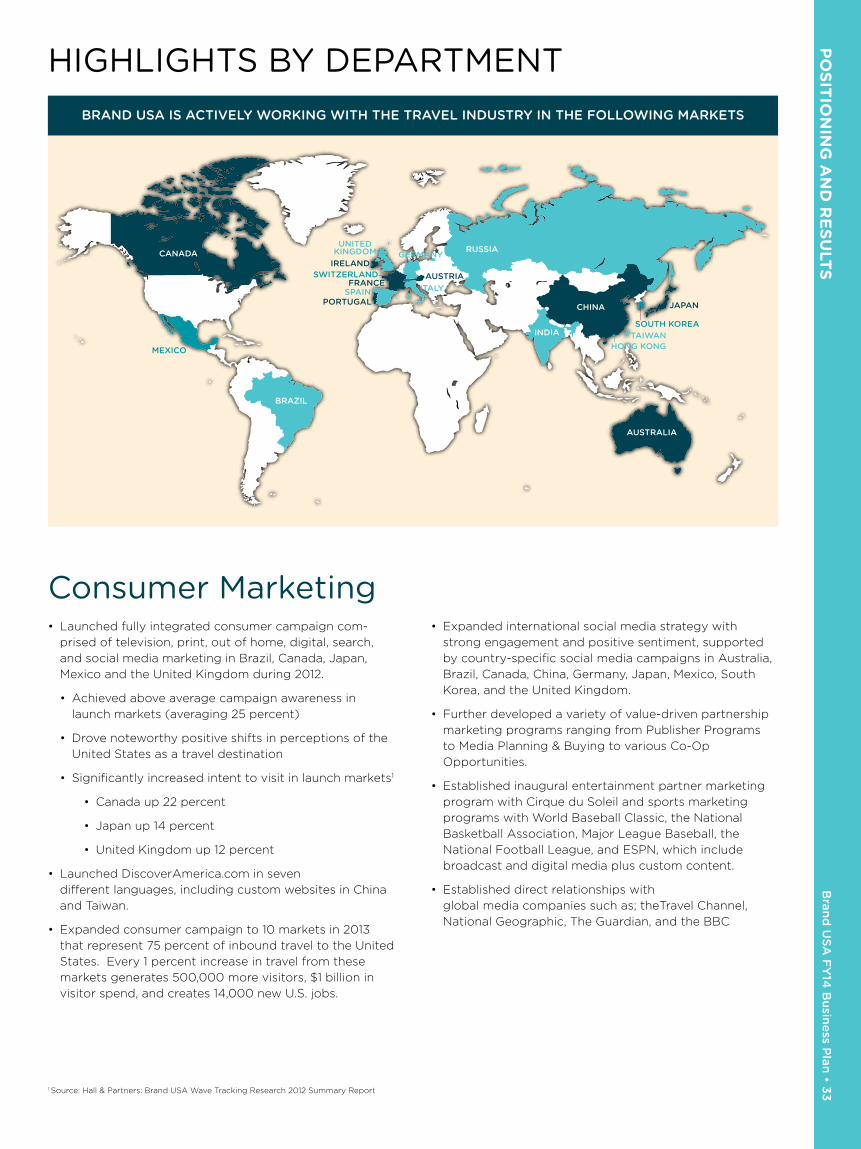
HIGHLIGHTS BY DEPARTMENT
BRAZIL
AUSTRALIA
AUSTRIA
GERMANY
FRANCE
CANADA
INDIA
CHINA
IRELAND
ITALYPORTUGAL
SPAINJAPAN
MEXICO
RUSSIAUNITEDKINGDOM
SOUTH KOREATAIWAN
HONG KONG
SWITZERLAND
BRAND USA IS ACTIVELY WORKING WITH THE TRAVEL INDUSTRY IN THE FOLLOWING MARKETS
Consumer Marketing• Launched fully integrated consumer campaign com-
prised of television, print, out of home, digital, search,
and social media marketing in Brazil, Canada, Japan,
Mexico and the United Kingdom during 2012.
• Achieved above average campaign awareness in
launch markets (averaging 25 percent)
• Drove noteworthy positive shifts in perceptions of the
United States as a travel destination
• Significantly increased intent to visit in launch markets1
• Canada up 22 percent
• Japan up 14 percent
• United Kingdom up 12 percent
• Launched DiscoverAmerica.com in seven
different languages, including custom websites in China
and Taiwan.
• Expanded consumer campaign to 10 markets in 2013
that represent 75 percent of inbound travel to the United
States. Every 1 percent increase in travel from these
markets generates 500,000 more visitors, $1 billion in
visitor spend, and creates 14,000 new U.S. jobs.
• Expanded international social media strategy with
strong engagement and positive sentiment, supported
by country-specific social media campaigns in Australia,
Brazil, Canada, China, Germany, Japan, Mexico, South
Korea, and the United Kingdom.
• Further developed a variety of value-driven partnership
marketing programs ranging from Publisher Programs
to Media Planning & Buying to various Co-Op
Opportunities.
• Established inaugural entertainment partner marketing
program with Cirque du Soleil and sports marketing
programs with World Baseball Classic, the National
Basketball Association, Major League Baseball, the
National Football League, and ESPN, which include
broadcast and digital media plus custom content.
• Established direct relationships with
global media companies such as; theTravel Channel,
National Geographic, The Guardian, and the BBC
1 Source: Hall & Partners: Brand USA Wave Tracking Research 2012 Summary Report
Bra
nd
US
A F
Y14
Bu
sin
ess
Pla
n •
34
P
OS
ITIO
NIN
G A
ND
RE
SU
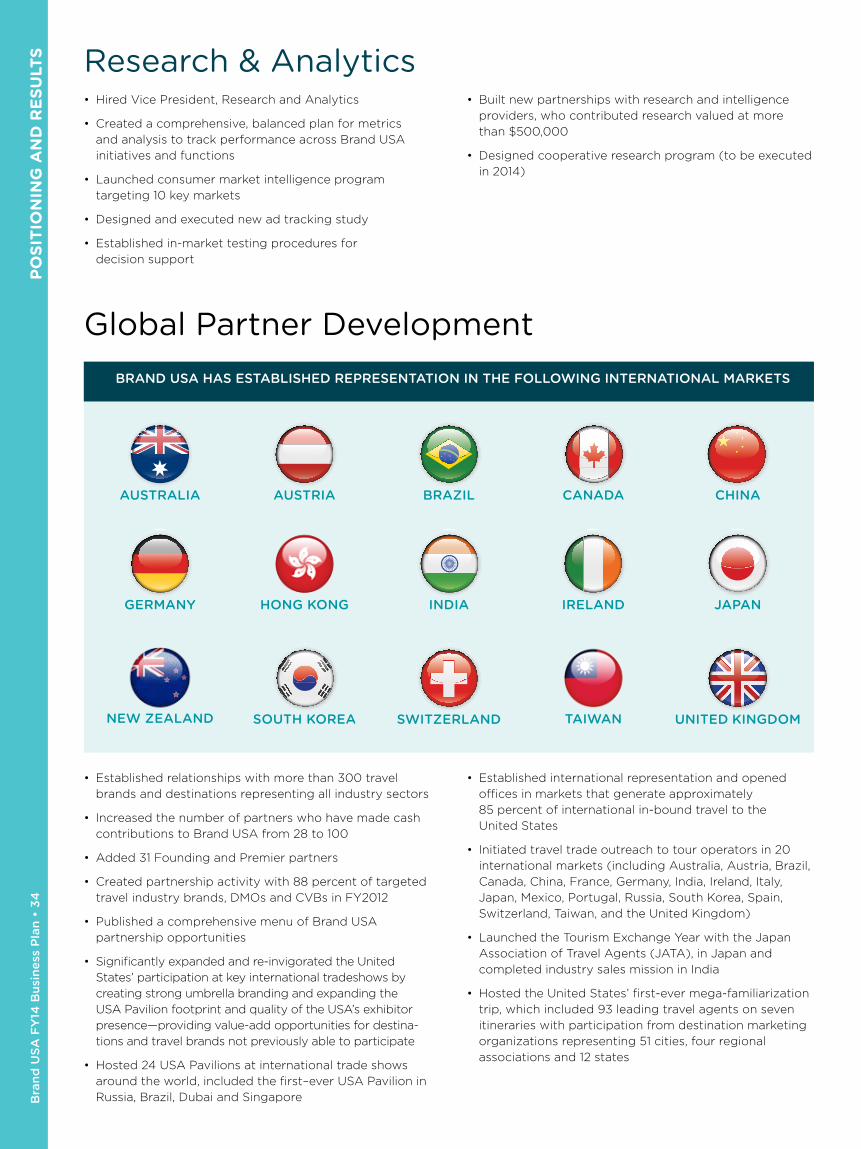
LTS Research & Analytics
• Hired Vice President, Research and Analytics
• Created a comprehensive, balanced plan for metrics
and analysis to track performance across Brand USA
initiatives and functions
• Launched consumer market intelligence program
targeting 10 key markets
• Designed and executed new ad tracking study
• Established in-market testing procedures for
decision support
• Built new partnerships with research and intelligence
providers, who contributed research valued at more
than $500,000
• Designed cooperative research program (to be executed
in 2014)
Global Partner DevelopmentBRAND USA HAS ESTABLISHED REPRESENTATION IN THE FOLLOWING INTERNATIONAL MARKETS
AUSTRIA BRAZIL CANADA
GERMANY HONG KONG INDIA IRELAND JAPAN
SOUTH KOREA SWITZERLAND UNITED KINGDOM
AUSTRALIA CHINA
NEW ZEALAND TAIWAN
• Established relationships with more than 300 travel
brands and destinations representing all industry sectors
• Increased the number of partners who have made cash
contributions to Brand USA from 28 to 100
• Added 31 Founding and Premier partners
• Created partnership activity with 88 percent of targeted
travel industry brands, DMOs and CVBs in FY2012
• Published a comprehensive menu of Brand USA
partnership opportunities
• Significantly expanded and re-invigorated the United
States’ participation at key international tradeshows by
creating strong umbrella branding and expanding the
USA Pavilion footprint and quality of the USA’s exhibitor
presence—providing value-add opportunities for destina-
tions and travel brands not previously able to participate
• Hosted 24 USA Pavilions at international trade shows
around the world, included the first–ever USA Pavilion in
Russia, Brazil, Dubai and Singapore
• Established international representation and opened
offices in markets that generate approximately
85 percent of international in-bound travel to the
United States
• Initiated travel trade outreach to tour operators in 20
international markets (including Australia, Austria, Brazil,
Canada, China, France, Germany, India, Ireland, Italy,
Japan, Mexico, Portugal, Russia, South Korea, Spain,
Switzerland, Taiwan, and the United Kingdom)
• Launched the Tourism Exchange Year with the Japan
Association of Travel Agents (JATA), in Japan and
completed industry sales mission in India
• Hosted the United States’ first-ever mega-familiarization
trip, which included 93 leading travel agents on seven
itineraries with participation from destination marketing
organizations representing 51 cities, four regional
associations and 12 states

PO
SIT
ION
ING
AN
D R
ES
ULT
S
Bran
d U
SA
FY
14 B
usin
ess P
lan • 3
5
Communications and Public Policy• Established a coordinated framework through the
Tourism Policy Council to collaborate with the National
Travel and Tourism Strategy.
• Leveraged State Department and United States, Foreign
Commercial Service (USFCS) channels to display Brand
USA video and collateral at embassies, consulates, public
events, and high-level meetings
• Increased the frequency and quality of content for
stakeholder communications. Made several appearances
and presentations at high profile industry conferences
and forums, including more than 30 state and national
tourism conferences
• Held regular meetings of the Public Affairs Working
Group comprised of key industry and association
stakeholders in order to remain up to date on public
policy issues
• Held dozens of informational update meetings with key
legislative stakeholders
• Established scorecard to better evaluate Brand USA’s
participation at industry events
• Developed innovative travel trade and international
media networks powered by TravTrade and TravMedia
to support partner engagement with influential travel
agents, tour operators, and international journalists
• Garnered expansive and positive media coverage across
all markets (trade, consumer, and business press) in key
international, national, regional, and local news outlets
--with coverage of all 50 states, the District of Columbia,
and the five U.S. territories
• Maintained up to date information on DiscoverAmerica.
com (now in seven languages and over three million
visitors)
• Distributed inspirational visitor guide in print and digital
to international trade and consumers
• Trade show exhibitor brochures (pre-show
educational brochure)
• Promoted and increased Global Entry enrollments and
communicated U.S. entry policy during World Baseball
Classic events
• Provided platform for U.S. government officials to
address international and domestic industry at IPW
• Worked with the Tourism Policy Council (TPC) Ease of
Travel Working Group to communicate visa and entry
policy promoting Trusted Traveler Programs.
• Developed communications toolkit for the United States
Foreign Commercial Service (USFCS) for USFCS and
Public Affairs-led travel and tourism teams
• Worked with USFCS in-market to distribute RFIs for
Brand USA international representation
• Supported embassy events such as July 4 celebrations
in the following markets:
• Germany
• United Kingdom
• Ireland
• China
• Australia
• Japan
• South Korea
• Collaborated with USFCS at several key travel trade
shows around the world (certified trade shows with
USFCS booth in USA Pavilion, Ambassador Murphy
keynoting ITB agenda, etc.)
• Worked with Federal/land water agencies
to integrate all equities into Brand USA
social media editorial/content calendar
• Developed great outdoors strategy
with recreation.gov
• Collaborated with recreation.gov to highlight Federal
content that fits with Brand USA thematic calendar
and to identify in advance items for cross-promotion
• Held mutual briefings on activities: Brand USA approach
to metrics and TPC Research Working Group inventory
and gap analysis
And This Is Just the Beginning…As we continue to welcome new and returning visitors to “Discover this land, like never before,” we’re on track to not only reignite people’s love affair with America, but also demonstrate the power of strategically informed creativity to restore America’s place on the world’s must-see list.
FY14 Business Plan
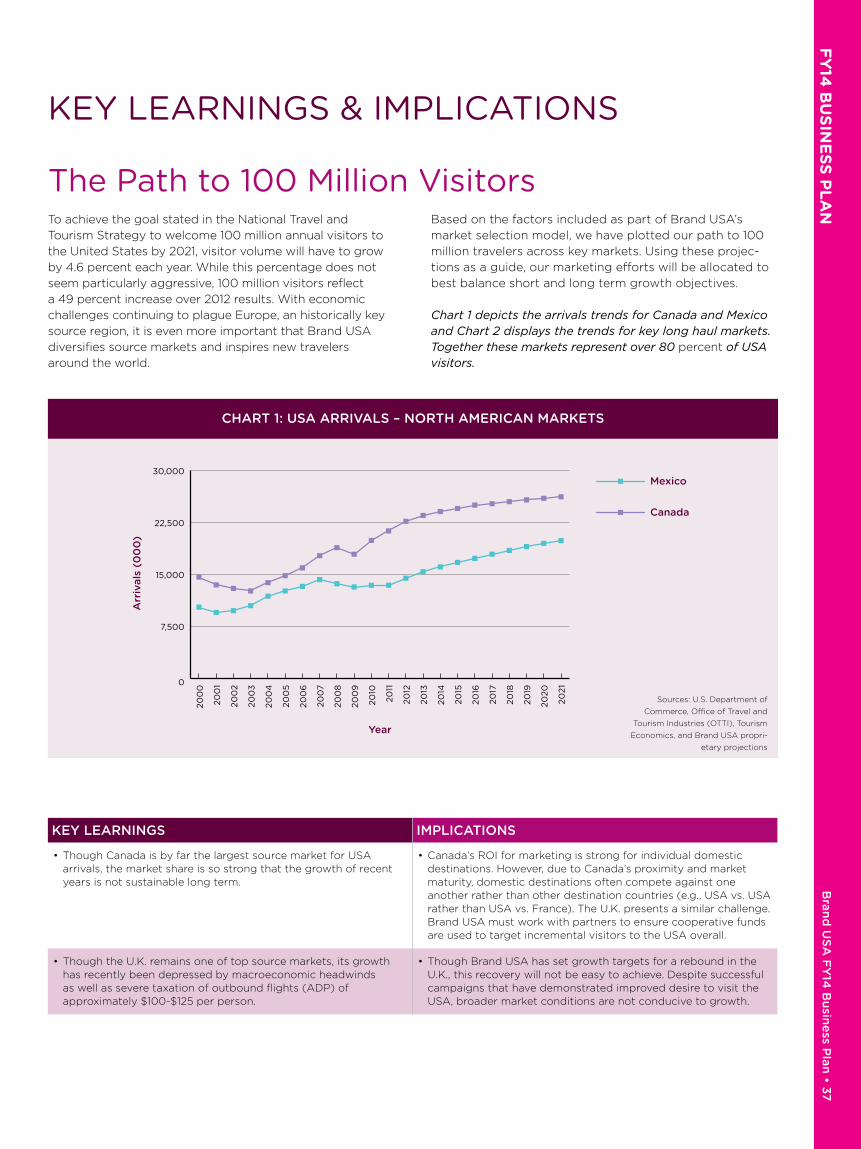
FY
14 B
US
INE
SS
PL
AN
B
rand
US
A F
Y14
Bu
sine
ss Plan
• 37
KEY LEARNINGS & IMPLICATIONS
The Path to 100 Million VisitorsTo achieve the goal stated in the National Travel and
Tourism Strategy to welcome 100 million annual visitors to
the United States by 2021, visitor volume will have to grow
by 4.6 percent each year. While this percentage does not
seem particularly aggressive, 100 million visitors reflect
a 49 percent increase over 2012 results. With economic
challenges continuing to plague Europe, an historically key
source region, it is even more important that Brand USA
diversifies source markets and inspires new travelers
around the world.
Based on the factors included as part of Brand USA’s
market selection model, we have plotted our path to 100
million travelers across key markets. Using these projec-
tions as a guide, our marketing efforts will be allocated to
best balance short and long term growth objectives.
Chart 1 depicts the arrivals trends for Canada and Mexico and Chart 2 displays the trends for key long haul markets. Together these markets represent over 80 percent of USA visitors.
0
7,500
15,000
22,500
30,000Mexico
Canada
20
00
20
01
20
02
20
03
20
04
20
05
20
06
20
07
20
08
20
09
20
10
20
11
20
12
20
13
20
14
20
15
20
16
20
17
20
18
20
19
20
20
20
21
Arr
ival
s (0
00
)
Year
CHART 1: USA ARRIVALS – NORTH AMERICAN MARKETS
KEY LEARNINGS IMPLICATIONS
• Though Canada is by far the largest source market for USA arrivals, the market share is so strong that the growth of recent years is not sustainable long term.
• Canada’s ROI for marketing is strong for individual domestic destinations. However, due to Canada’s proximity and market maturity, domestic destinations often compete against one another rather than other destination countries (e.g., USA vs. USA rather than USA vs. France). The U.K. presents a similar challenge. Brand USA must work with partners to ensure cooperative funds are used to target incremental visitors to the USA overall.
• Though the U.K. remains one of top source markets, its growth has recently been depressed by macroeconomic headwinds as well as severe taxation of outbound flights (ADP) of approximately $100-$125 per person.
• Though Brand USA has set growth targets for a rebound in the U.K., this recovery will not be easy to achieve. Despite successful campaigns that have demonstrated improved desire to visit the USA, broader market conditions are not conducive to growth.
Sources: U.S. Department of
Commerce, Office of Travel and
Tourism Industries (OTTI), Tourism
Economics, and Brand USA propri-
etary projections

Bra
nd
US
A F
Y14
Bu
sin
ess
Pla
n •
38
F
Y14
BU
SIN
ES
S P
LA
N
20
00
20
01
20
02
20
03
20
04
20
05
20
06
20
07
20
08
20
09
20
10
20
11
20
12
20
13
20
14
20
15
20
16
20
17
20
18
20
19
20
20
20
21
Arr
ival
s (0
00
)
0
1200
2400
3600
4800
6000
CO+VZ+AR
Argentina
Venezuela
Colombia
India
Korea
U.K.
Russia
Japan
Italy
Germany
France
China
Brazil
Australia
Year
CHART 2: USA ARRIVALS – KEY LONG HAUL MARKETS
KEY LEARNING IMPLICATION
• By 2021, China is on track to become the 3rd largest source of international arrivals and Brazil will not be very far behind. While the influx of visitors from China and Brazil is rather expected at this point, the influx of travelers from other parts of Latin America is significant as well. When Argentina, Colombia and Venezuela are depicted individually it is not immediately obvious how large the opportunity is. When combined, however, the countries contributed more arrivals than China in 2012.
• The mix of visitors will be significantly different in 2021. In addition to the well-publicized growth of BRIC markets, Latin America outside of Brazil will also represent an extremely important source of growth.
Sources: U.S. Department of
Commerce, Office of Travel
and Tourism Industries (OTTI),
Tourism Economics, and Brand
USA proprietary projections
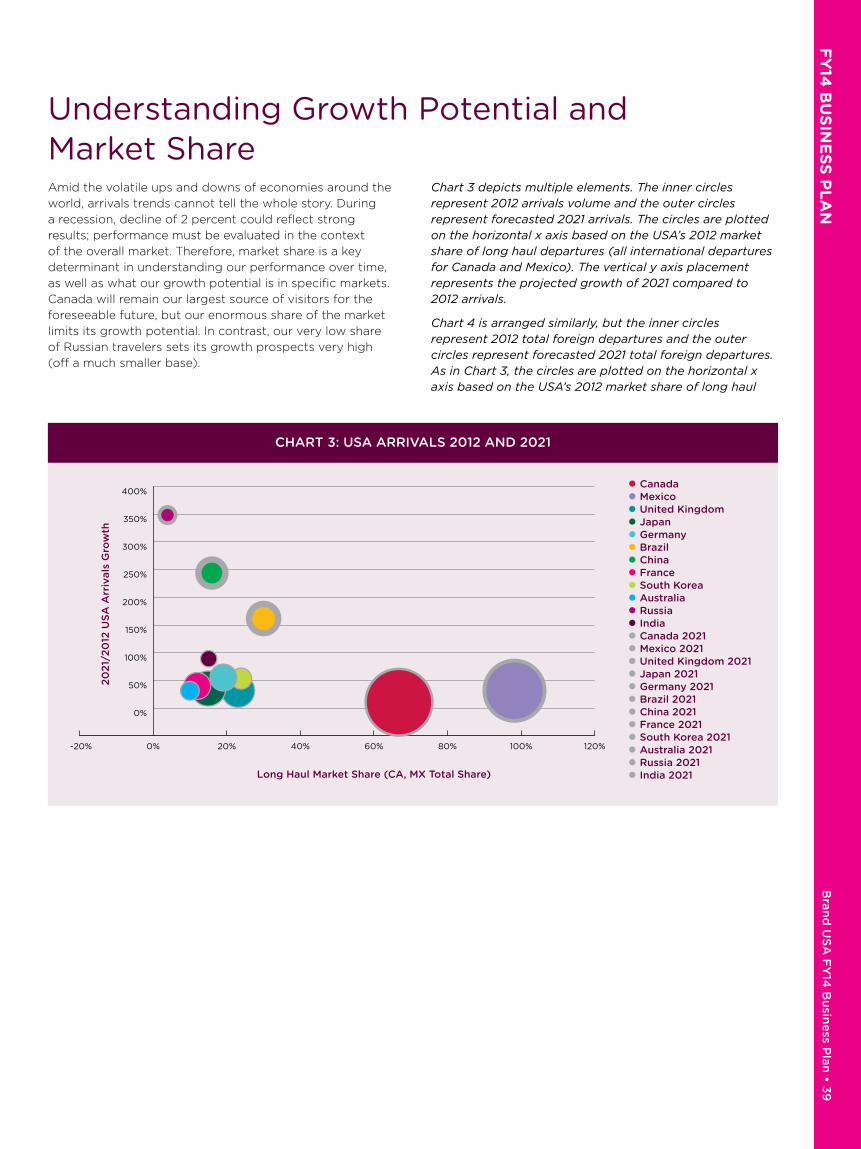
FY
14 B
US
INE
SS
PL
AN
B
rand
US
A F
Y14
Bu
sine
ss Plan
• 39
20
21/
20
12 U
SA
Arr
ival
s G
row
th
Long Haul Market Share (CA, MX Total Share)
South KoreaFranceChina
RussiaIndia
Australia
0% 20%-20% 40% 60% 80% 100% 120%
0%
50%
100%
150%
200%
250%
300%
350%
400%
United KingdomMexicoCanada
BrazilGermanyJapan
United Kingdom 2021Mexico 2021Canada 2021
Germany 2021Japan 2021
South Korea 2021France 2021China 2021
Russia 2021India 2021
Australia 2021
Brazil 2021
CHART 3: USA ARRIVALS 2012 AND 2021
Understanding Growth Potential and Market ShareAmid the volatile ups and downs of economies around the
world, arrivals trends cannot tell the whole story. During
a recession, decline of 2 percent could reflect strong
results; performance must be evaluated in the context
of the overall market. Therefore, market share is a key
determinant in understanding our performance over time,
as well as what our growth potential is in specific markets.
Canada will remain our largest source of visitors for the
foreseeable future, but our enormous share of the market
limits its growth potential. In contrast, our very low share
of Russian travelers sets its growth prospects very high
(off a much smaller base).
Chart 3 depicts multiple elements. The inner circles represent 2012 arrivals volume and the outer circles represent forecasted 2021 arrivals. The circles are plotted on the horizontal x axis based on the USA’s 2012 market share of long haul departures (all international departures for Canada and Mexico). The vertical y axis placement represents the projected growth of 2021 compared to 2012 arrivals.
Chart 4 is arranged similarly, but the inner circles represent 2012 total foreign departures and the outer circles represent forecasted 2021 total foreign departures. As in Chart 3, the circles are plotted on the horizontal x axis based on the USA’s 2012 market share of long haul

Bra
nd
US
A F
Y14
Bu
sin
ess
Pla
n •
40
F
Y14
BU
SIN
ES
S P
LA
N
20
21/
20
12 U
SA
Arr
ival
s G
row
th
Long Haul Market Share (CA, MX Total Share)
South KoreaFranceChina
RussiaIndia
Australia
0% 20%-20% 40% 60% 80% 100% 120%
United KingdomMexicoCanada
BrazilGermanyJapan
United Kingdom 2021Mexico 2021Canada 2021
Germany 2021Japan 2021
South Korea 2021France 2021China 2021
Russia 2021India 2021
Australia 2021
Brazil 20210%
50%
100%
150%
200%
250%
300%
350%
400%
CHART 4: TOTAL FOREIGN DEPARTURES 2012 AND 2021
KEY LEARNING IMPLICATION
• One of the factors considered in projecting the long-term growth targets for source markets is the USA’s current market share of all foreign departures. The USA has relatively low share in Russia, Australia and France. However, each market has a different set of drivers for this share. Barriers to Australian visitors are fundamental; we can’t make it any closer. Therefore the growth targets are modest. In contrast, Russia’s is driven by both relatively weak demand as well as product accessibility in the local marketplace (both of which Brand USA can actively improve.)
• Brand USA must invest in markets that have strong growth potential, not just the markets that are already large. The strategies deployed for each market must address demand generation as well as barrier removal for each of these markets.
Target Travel Cycle Phase
ATTAINMENT
ASPIRATION DREAM
CONSIDERACTIVATE

FY
14 B
US
INE
SS
PL
AN
B
rand
US
A F
Y14
Bu
sine
ss Plan
• 41
USA Wish List SharePercentage of intercontinental travelers* who list the United States on their destination wish list
1000
10
2030
40
50
60
70 80
90
CH
INA
60
%
SO
UT
H K
OR
EA
52%
BR
AZ
IL 5
0%
UN
ITE
D K
ING
DO
M 4
5%
AU
ST
RA
LIA
42%
GE
RM
AN
Y 4
1%
IND
IA 3
7%
FR
AN
CE
34
%
CA
NA
DA
31%
JAPA
N 3
0%
RU
SS
IA 2
1%M
EX
ICO
21%
*Includes international travelers in Canada and Mexico

Bra
nd
US
A F
Y14
Bu
sin
ess
Pla
n •
42
F
Y14
BU
SIN
ES
S P
LA
N
1000
1000
10
2030
40
50
60
70 80
90
ME
XIC
O 7
3%
CA
NA
DA
66
%
CH
INA
59
%
BR
AZ
IL 5
7%
IND
IA 4
5%
JAPA
N 3
6%
UN
ITE
D K
ING
DO
M 2
7%
SO
UT
H K
OR
EA
26
%
GE
RM
AN
Y 1
9%
AU
ST
RA
LIA
18
%
FR
AN
CE
17%
RU
SS
IA 1
5%
Intent to Visit the USAPercentage of intercontinental travelers* who are likely to visit the United States in next 12 months
*Includes international travelers in Canada and Mexico
KEY LEARNINGS IMPLICATIONS
• There is an inherent negative relationship between consumer aspiration and attainment. The more accessible and everyday a destination becomes, the less people dream about it. The USA is easily attainable for Canada and Mexico and therefore the USA ranks relatively low in their aspirations.
• The aspiration/attainment scale reflects two corresponding functions of Brand USA: demand generation (consumer marketing) and in-market retail development (global partnerships). Brand USA will allocate a mix of efforts based on where markets are in this continuum.
• Though China and Brazil are already high for both aspiration and attainment, long distance travel remains isolated to the upper levels of income earners in these markets. This inflates the attainability results for these emerging markets as this analysis is based on results among only long-distance leisure travelers. If based on a broader section of the population, the results for China and Brazil would be closer to Korea’s.
• Brand USA must focus on building and enhancing product development among in-market retailers as well as educating domestic partners on how best to leverage the resulting opportunities. Consumer marketing will approach each market differently based on local media landscape and cultural nuance.
• Russia presents a unique opportunity in that it ranks relatively low in both aspiration and attainment, yet already is a large source of international travelers. Even reaching “fair share” of the market will boost current visitation multiple times over.

FY
14 B
US
INE
SS
PL
AN
B
rand
US
A F
Y14
Bu
sine
ss Plan
• 43
Target Travel Cycle Phase
China
Russia
India
France
Germany
Australia
Japan
Brazil
South Korea
United Kingdom
Mexico
Canada
DREAM CONSIDER ACTIVATE TRAVEL SHARE
KEY LEARNING IMPLICATION
• The target markets that will drive the most visitation in coming years are at different levels of consumer demand and commercial development, requiring strategic focus on certain areas rather than a blanket approach.
• Based on varying phases of familiarity and affinity for travel to the USA, marketing activity will be focused around one particular stage of the travel life cycle. Efforts in mature markets such as Canada and the U.K. will focus on facilitating and creating strong booking calls to action, while the approach in emerging markets will focus on inspiration.

Bra
nd
US
A F
Y14
Bu
sin
ess
Pla
n •
44
F
Y14
BU
SIN
ES
S P
LA
N
2012 Arrivals Share2021 Arrivals Share
Budget (Base)
0
5%
10%
15%
20%
25%
30%
35%
40%
Unite
d Kin
gdom
Hong K
ong/T
aiwan
South
Korea
CO+A
R+VZ
Russia
Nord
ic/B
enel
ux
Mex
ico
Japan
India
Ger
man
y
Franc
e
China
Chile
Canad
a
Brazil
Aus
tralia
ConsumerCo-opGlobal
0
5%
10%
15%
20%
25%
Special O
pps M
arke
t
Unite
d Kin
gdom
Hong K
ong/T
aiwan
South
Korea
South
Am
erica
Russia
Mex
ico
Japan
India
Ger
man
y
Franc
e
China
Canad
a
Brazil
Aus
tralia
SHARE OF ARRIVALS VS� SHARE OF FY14 MARKETING BUDGET
COMPONENTS OF FY14 MARKETING BUDGET
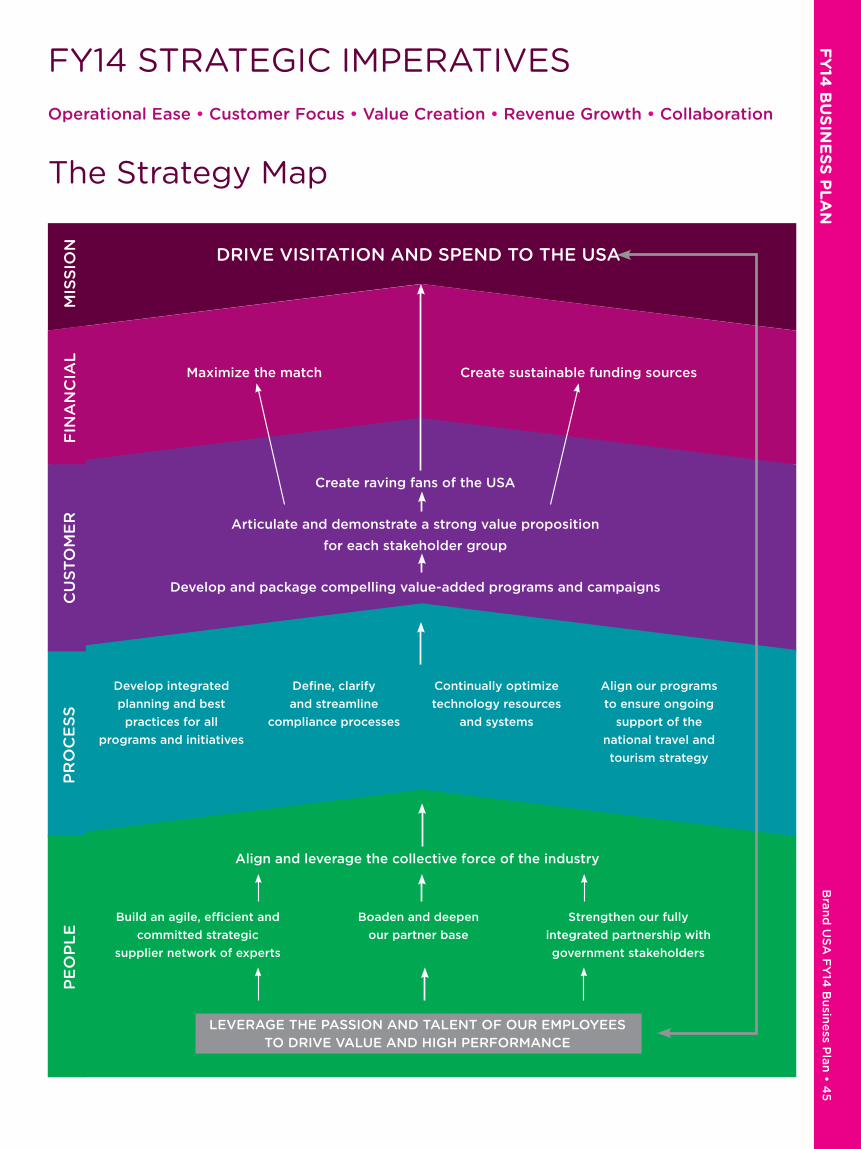
FY
14 B
US
INE
SS
PL
AN
B
rand
US
A F
Y14
Bu
sine
ss Plan
• 45
FY14 STRATEGIC IMPERATIVESOperational Ease • Customer Focus • Value Creation • Revenue Growth • Collaboration
The Strategy Map
FIN
AN
CIA
LM
ISS
ION
CU
ST
OM
ER
PR
OC
ES
SP
EO
PL
E
Maximize the match Create sustainable funding sources
Create raving fans of the USA
Articulate and demonstrate a strong value proposition
for each stakeholder group
Develop and package compelling value-added programs and campaigns
Develop integrated
planning and best
practices for all
programs and initiatives
Define, clarify
and streamline
compliance processes
Continually optimize
technology resources
and systems
Align our programs
to ensure ongoing
support of the
national travel and
tourism strategy
Align and leverage the collective force of the industry
Build an agile, efficient and
committed strategic
supplier network of experts
Boaden and deepen
our partner base
Strengthen our fully
integrated partnership with
government stakeholders
LEVERAGE THE PASSION AND TALENT OF OUR EMPLOYEES TO DRIVE VALUE AND HIGH PERFORMANCE
DRIVE VISITATION AND SPEND TO THE USA
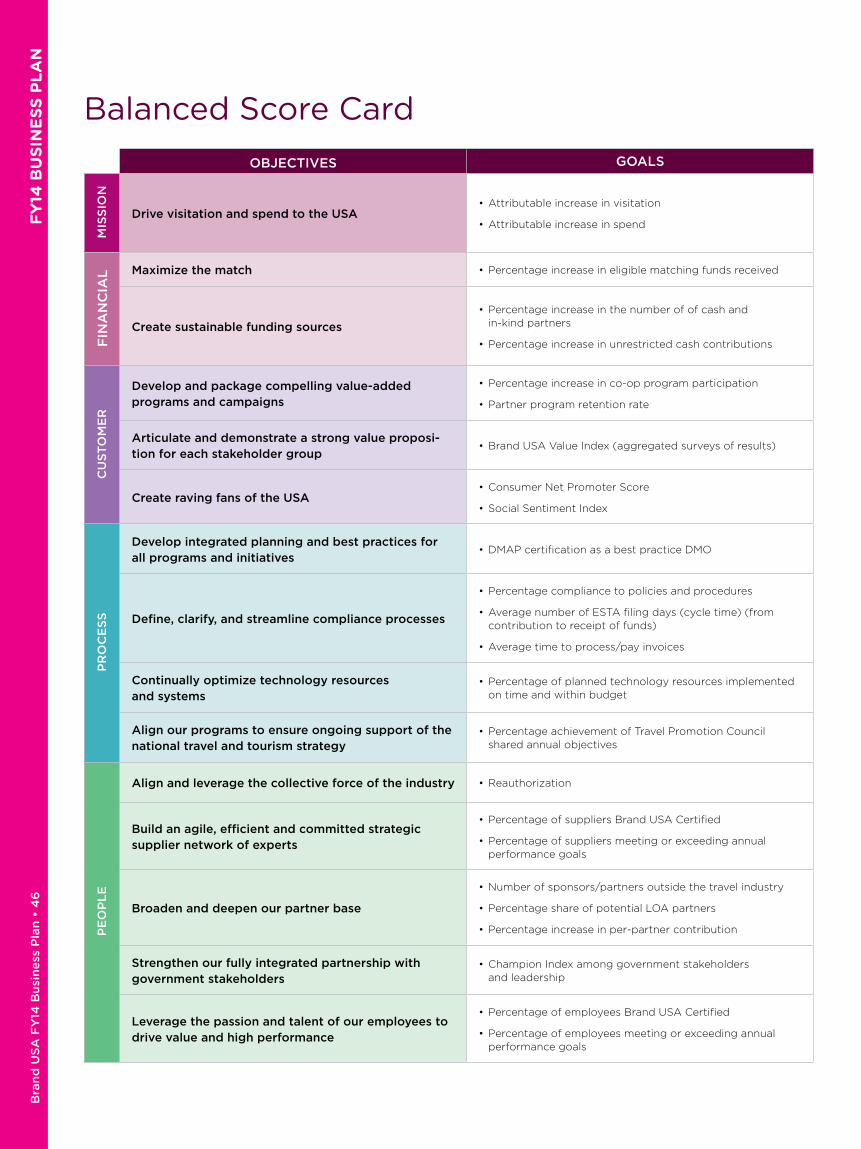
Bra
nd
US
A F
Y14
Bu
sin
ess
Pla
n •
46
F
Y14
BU
SIN
ES
S P
LA
N
Balanced Score Card
OBJECTIVES GOALS
MIS
SIO
N
Drive visitation and spend to the USA• Attributable increase in visitation
• Attributable increase in spend
FIN
AN
CIA
L Maximize the match • Percentage increase in eligible matching funds received
Create sustainable funding sources
• Percentage increase in the number of of cash and in-kind partners
• Percentage increase in unrestricted cash contributions
CU
ST
OM
ER
Develop and package compelling value-added programs and campaigns
• Percentage increase in co-op program participation
• Partner program retention rate
Articulate and demonstrate a strong value proposi-tion for each stakeholder group
• Brand USA Value Index (aggregated surveys of results)
Create raving fans of the USA• Consumer Net Promoter Score
• Social Sentiment Index
PR
OC
ES
S
Develop integrated planning and best practices for all programs and initiatives
• DMAP certification as a best practice DMO
Define, clarify, and streamline compliance processes
• Percentage compliance to policies and procedures
• Average number of ESTA filing days (cycle time) (from contribution to receipt of funds)
• Average time to process/pay invoices
Continually optimize technology resources and systems
• Percentage of planned technology resources implemented on time and within budget
Align our programs to ensure ongoing support of the national travel and tourism strategy
• Percentage achievement of Travel Promotion Council shared annual objectives
PE
OP
LE
Align and leverage the collective force of the industry • Reauthorization
Build an agile, efficient and committed strategic supplier network of experts
• Percentage of suppliers Brand USA Certified
• Percentage of suppliers meeting or exceeding annual performance goals
Broaden and deepen our partner base
• Number of sponsors/partners outside the travel industry
• Percentage share of potential LOA partners
• Percentage increase in per-partner contribution
Strengthen our fully integrated partnership with government stakeholders
• Champion Index among government stakeholders and leadership
Leverage the passion and talent of our employees to drive value and high performance
• Percentage of employees Brand USA Certified
• Percentage of employees meeting or exceeding annual performance goals

FY
14 B
US
INE
SS
PL
AN
B
rand
US
A F
Y14
Bu
sine
ss Plan
• 47
Strategy Map DefinitionsStrategy Map Methodology created by Kaplan & Norton that graphically tells the story of how value is created
within a business. Like a story, a cause and effect relationship shows how components of a strategy
interrelate.
The map depicts the strategy through four perspectives:
• People: What skills, knowledge, capabilities and organizational capital must our organization have
to be successful?
• Process: At what business processes must we excel?
• Customers: What do our customers want from us?
• Financial: What results do our stakeholders expect from us?
Balanced Score Card A document comprised of the goals that are used to track and report success.
The Score Card is “balanced” because the measures work together and are interdependent. In other
words, success never depends on just one or two objectives—but rather the accomplishment of all
of the objectives and goals in unison.
Objectives Words describing what we want to accomplish and represent a key driver necessary to achieve
overall success. The objectives are laid out on the “map” to represent the cause and effect
relationship between each other.
Goals Numerical targets of what we ultimately want to accomplish established for each objective.
Strategies/Tactics For each objective and goal we have established strategies and tactics to support
their achievement.
Markets International targets to generate visitation and spend to the USA (can be countries, territories or
other geographic areas).
Stakeholders Any group that has or should have a vested interest in the work and success of Brand USA.
Brand USA has identified eight stakeholder groups:
• Employees
• Partners & Sponsors
• Travel Trade
• Industry Stakeholders
• Government Stakeholders
• Suppliers/Vendors
• Consumers
• The American Public
Employees The Brand USA team of committed individuals who work together to support, develop and execute
programs and initiatives that promote the United States as the premier travel destination in order to
increase international visitation and spend to the USA.
Partners & Sponsors Groups or individuals (domestic or international) who have contributed or have the potential to
contribute to Brand USA.
Travel Trade Buyers, promoters, and influencers of travel comprised of the full range of individuals or organiza-
tions that organize and sell travel and tours to consumers or influence travel decisions such as travel
agents, tour operators, receptive operators, and the media.
Industry Stakeholders Non-government groups that represent the travel industry (includes associations and other groups
such as Brand USA board members, the U.S. Travel Association, Destination Marketing Association
International, Visit USA committees, Receptive Services Association, etc.). While media (particularly
trade media) is often considered an “industry stakeholder,” we view the media as a channel to reach
our stakeholders rather than a stakeholder group unto itself.
Government Stakeholders
Groups with whom Brand USA works in compliance with the Travel Promotion Act and to support
the achievement of the National Travel and Tourism Strategy.

Bra
nd
US
A F
Y14
Bu
sin
ess
Pla
n •
48
F
Y14
BU
SIN
ES
S P
LA
N Suppliers / Vendors Vendors procured by Brand USA whom we pay to perform specific duties on our behalf. Vendors in
our Supplier Network may additionally act as official representatives or agents of Brand USA
Consumers People and groups from all over the world who have the means and a range of travel options for
leisure or business purposes.
The American Public U.S. citizens worldwide
Programs Programs are external to Brand USA and include marketing campaigns, public relations efforts,
and any category of giving opportunity for partners such as partnership co-op opportunities.
Initiatives Process, projects or programs internal to Brand USA such as internal policies and procedures,
a new technology platform, or a group formed to review a current process in order to find ways
to make it more efficient and/or effective.
PEOPLE A corporate culture
that attracts and retains high-caliber people is
the foundation of our success
Leverage the passion and talent of our employees to drive value and high performance
Smart, talented people are the foundation of Brand USA. They can make amazing things happen. As a result, we focus on fostering a corporate culture that attracts high-caliber people, where integrity is paramount, individuals and teams are empowered and accountable, and relationships are based on mutual trust and respect. Inherent in this high-performance, value-driven environment is a sense of urgency and a commitment to continuous improvement. As a result, while decisions are driven by those with the expertise and the leadership responsibility to do so, we value and foster an inclusive environment where people work collaboratively, are open to new ideas, and are honest and straight forward with each other.
Build an agile, efficient and committed strategic supplier network of experts
Our supplier network is comprised of vendors and other individuals and organizations procured by Brand USA to perform specific duties on our behalf. Each member of our supplier network operates seamlessly and fully integrated as a part of Brand USA and is expected to utilize Brand USA resources efficiently and only in the pursuit of achieving organizational objectives and strategies. Vendors in our network may additionally act as official representatives or agents of Brand USA and, as such, are a critical extension of our employee base. Therefore, they are also held to the same values and performance principles as the core Brand USA team.
Broaden and deepen our partner base
This objective speaks to the need to diversify our funding and ensure repeat funding from existing partners. In order to do so, we will look to significantly fully engage and expand the number and types of groups or individuals (domestic or international) who have contributed to or have the potential to contribute to Brand USA. Categories of partners are virtually endless and can include the range from destinations, transportation providers, and travel brands to government stakeholders, to associations, to non-travel brands, etc.
Strengthen our fully integrated partnership with government stakeholders
Groups with whom Brand USA works in compliance with the Travel Promotion Act and to support the achievement of the National Travel and Tourism Strategy are critical to our success. As a result, we will work to continually engage and seek input from our various government stakeholders. These stakeholders include the federal agencies, with which we collaborate on various programs, and elected officials whom we are obligated to keep informed of our activities.
Align & leverage the collective force of the industry
This objective speaks to our building close, mutually productive relationships with all stakeholders (internal and external) who contribute to our fulfilling our reason for being (our purpose). We will do this by continually seeking input and feedback.
By working together, we can combine forces to support common objectives and develop agreed upon methods for leveraging our resources to accomplish more than we can through individual efforts. As referenced here the “industry” includes government and non-government groups, current and prospective partners, travel-related business associations, buyers and suppliers.
PROCESS With the right people
and culture, we can establish and
continually improve our processes
Develop integrated planning and best practices for all programs and initiatives
This objective speaks to our process-driven culture—which is internally and externally integrated and commits us to learning from both our successes and failures, as well as benchmarking our performance against the very best in the industry, in business and ourselves. We know that to achieve success, we must plan, connect and integrate consumer and partner needs with the work of all Brand USA departments—each of which provides a unique and important perspective on driving value and delivering results. In this objective, programs are defined as external to Brand USA (such as marketing campaigns, public relations efforts, any category of giving opportunity for partners, etc.) and initiatives are internal (including processes, projects or programs specific to Brand USA such as internal policies and procedures, new technology platforms, groups formed to review a current process to find ways to make it more efficient, etc.).
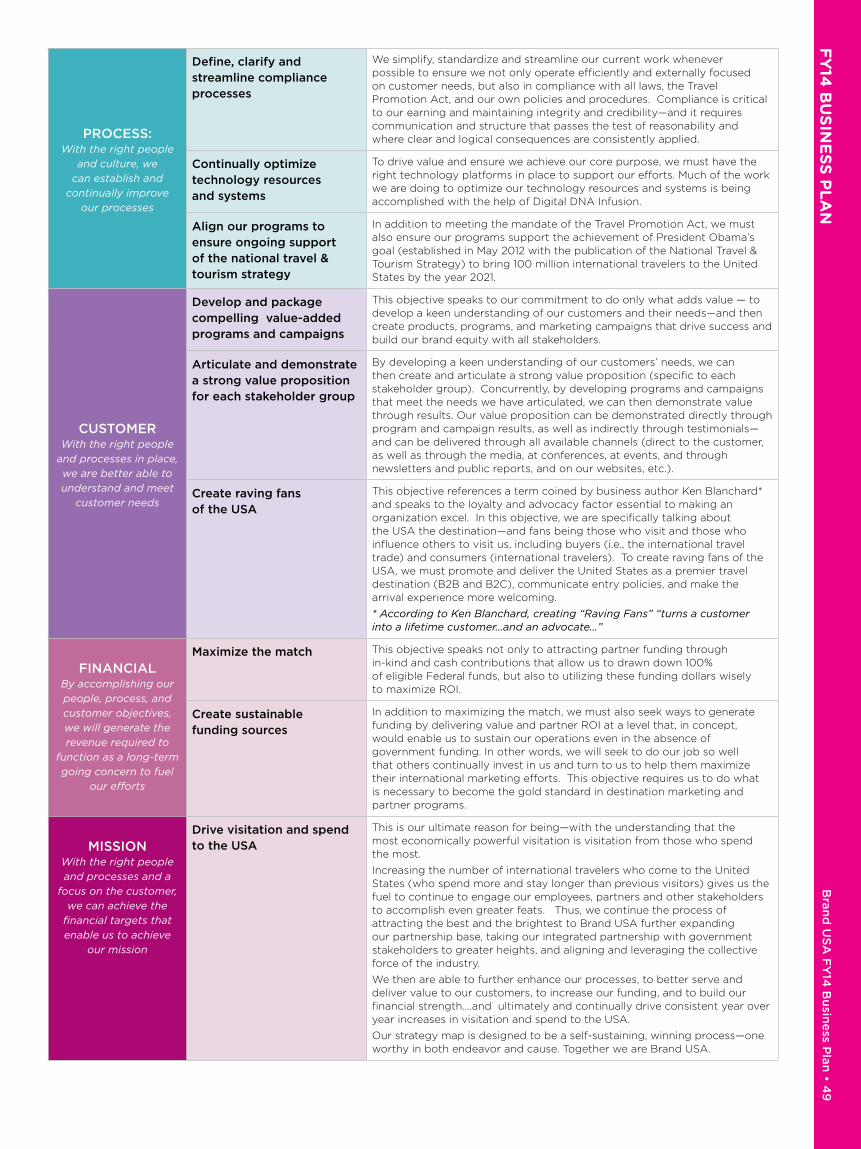
FY
14 B
US
INE
SS
PL
AN
B
rand
US
A F
Y14
Bu
sine
ss Plan
• 49
PROCESS: With the right people
and culture, we can establish and
continually improve our processes
Define, clarify and streamline compliance processes
We simplify, standardize and streamline our current work whenever possible to ensure we not only operate efficiently and externally focused on customer needs, but also in compliance with all laws, the Travel Promotion Act, and our own policies and procedures. Compliance is critical to our earning and maintaining integrity and credibility—and it requires communication and structure that passes the test of reasonability and where clear and logical consequences are consistently applied.
Continually optimize technology resources and systems
To drive value and ensure we achieve our core purpose, we must have the right technology platforms in place to support our efforts. Much of the work we are doing to optimize our technology resources and systems is being accomplished with the help of Digital DNA Infusion.
Align our programs to ensure ongoing support of the national travel & tourism strategy
In addition to meeting the mandate of the Travel Promotion Act, we must also ensure our programs support the achievement of President Obama’s goal (established in May 2012 with the publication of the National Travel & Tourism Strategy) to bring 100 million international travelers to the United States by the year 2021.
CUSTOMER With the right people
and processes in place, we are better able to understand and meet
customer needs
Develop and package compelling value-added programs and campaigns
This objective speaks to our commitment to do only what adds value — to develop a keen understanding of our customers and their needs—and then create products, programs, and marketing campaigns that drive success and build our brand equity with all stakeholders.
Articulate and demonstrate a strong value proposition for each stakeholder group
By developing a keen understanding of our customers’ needs, we can then create and articulate a strong value proposition (specific to each stakeholder group). Concurrently, by developing programs and campaigns that meet the needs we have articulated, we can then demonstrate value through results. Our value proposition can be demonstrated directly through program and campaign results, as well as indirectly through testimonials—and can be delivered through all available channels (direct to the customer, as well as through the media, at conferences, at events, and through newsletters and public reports, and on our websites, etc.).
Create raving fans of the USA
This objective references a term coined by business author Ken Blanchard* and speaks to the loyalty and advocacy factor essential to making an organization excel. In this objective, we are specifically talking about the USA the destination—and fans being those who visit and those who influence others to visit us, including buyers (i.e., the international travel trade) and consumers (international travelers). To create raving fans of the USA, we must promote and deliver the United States as a premier travel destination (B2B and B2C), communicate entry policies, and make the arrival experience more welcoming.
* According to Ken Blanchard, creating “Raving Fans” “turns a customer into a lifetime customer…and an advocate…”
FINANCIAL By accomplishing our people, process, and customer objectives, we will generate the revenue required to
function as a long-term going concern to fuel
our efforts
Maximize the match This objective speaks not only to attracting partner funding through in-kind and cash contributions that allow us to drawn down 100% of eligible Federal funds, but also to utilizing these funding dollars wisely to maximize ROI.
Create sustainable funding sources
In addition to maximizing the match, we must also seek ways to generate funding by delivering value and partner ROI at a level that, in concept, would enable us to sustain our operations even in the absence of government funding. In other words, we will seek to do our job so well that others continually invest in us and turn to us to help them maximize their international marketing efforts. This objective requires us to do what is necessary to become the gold standard in destination marketing and partner programs.
MISSIONWith the right people and processes and a
focus on the customer, we can achieve the
financial targets that enable us to achieve
our mission
Drive visitation and spend to the USA
This is our ultimate reason for being—with the understanding that the most economically powerful visitation is visitation from those who spend the most.
Increasing the number of international travelers who come to the United States (who spend more and stay longer than previous visitors) gives us the fuel to continue to engage our employees, partners and other stakeholders to accomplish even greater feats. Thus, we continue the process of attracting the best and the brightest to Brand USA further expanding our partnership base, taking our integrated partnership with government stakeholders to greater heights, and aligning and leveraging the collective force of the industry.
We then are able to further enhance our processes, to better serve and deliver value to our customers, to increase our funding, and to build our financial strength….and ultimately and continually drive consistent year over year increases in visitation and spend to the USA.
Our strategy map is designed to be a self-sustaining, winning process—one worthy in both endeavor and cause. Together we are Brand USA.
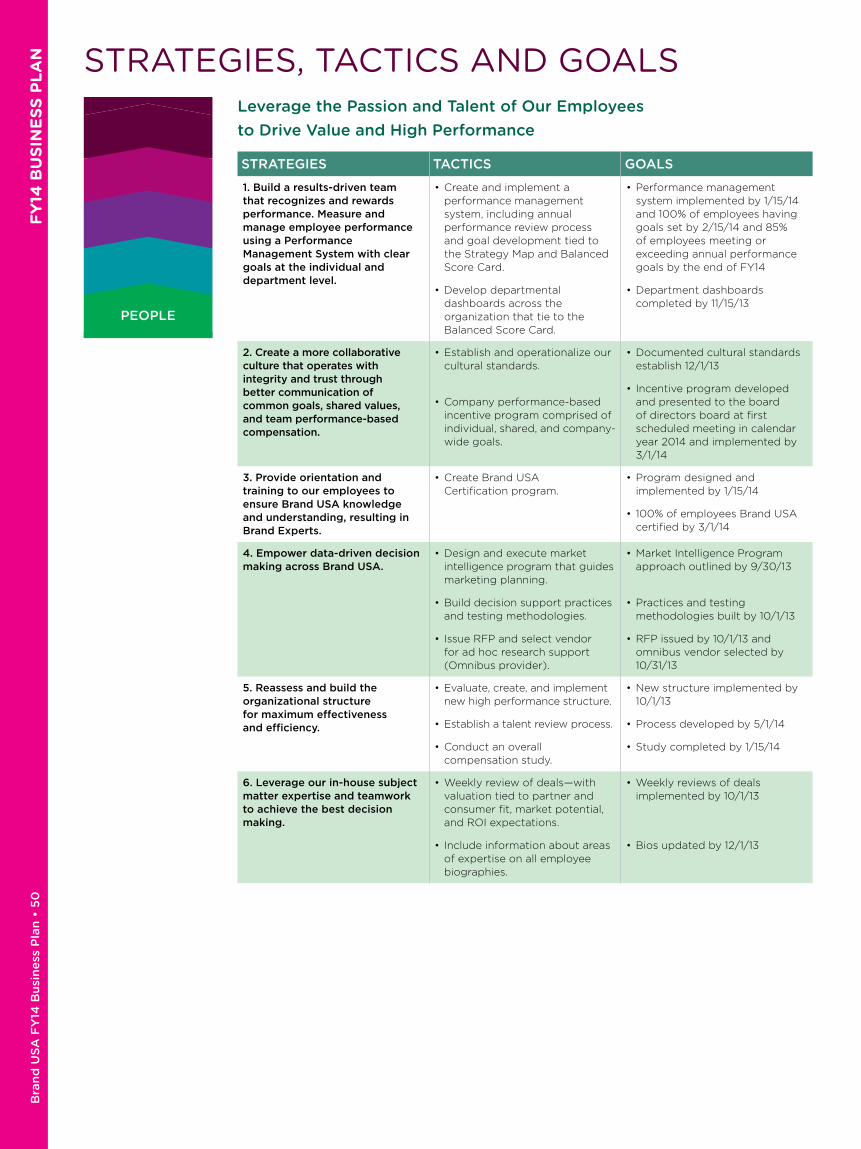
Bra
nd
US
A F
Y14
Bu
sin
ess
Pla
n •
50
F
Y14
BU
SIN
ES
S P
LA
N STRATEGIES, TACTICS AND GOALSLeverage the Passion and Talent of Our Employees to Drive Value and High Performance
STRATEGIES TACTICS GOALS
1. Build a results-driven team that recognizes and rewards performance. Measure and manage employee performance using a Performance Management System with clear goals at the individual and department level.
• Create and implement a performance management system, including annual performance review process and goal development tied to the Strategy Map and Balanced Score Card.
• Develop departmental dashboards across the organization that tie to the Balanced Score Card.
• Performance management system implemented by 1/15/14 and 100% of employees having goals set by 2/15/14 and 85% of employees meeting or exceeding annual performance goals by the end of FY14
• Department dashboards completed by 11/15/13
2. Create a more collaborative culture that operates with integrity and trust through better communication of common goals, shared values, and team performance-based compensation.
• Establish and operationalize our cultural standards.
• Company performance-based incentive program comprised of individual, shared, and company-wide goals.
• Documented cultural standards establish 12/1/13
• Incentive program developed and presented to the board of directors board at first scheduled meeting in calendar year 2014 and implemented by 3/1/14
3. Provide orientation and training to our employees to ensure Brand USA knowledge and understanding, resulting in Brand Experts.
• Create Brand USA Certification program.
• Program designed and implemented by 1/15/14
• 100% of employees Brand USA certified by 3/1/14
4. Empower data-driven decision making across Brand USA.
• Design and execute market intelligence program that guides marketing planning.
• Build decision support practices and testing methodologies.
• Issue RFP and select vendor for ad hoc research support (Omnibus provider).
• Market Intelligence Program approach outlined by 9/30/13
• Practices and testing methodologies built by 10/1/13
• RFP issued by 10/1/13 and omnibus vendor selected by 10/31/13
5. Reassess and build the organizational structure for maximum effectiveness and efficiency.
• Evaluate, create, and implement new high performance structure.
• Establish a talent review process.
• Conduct an overall compensation study.
• New structure implemented by 10/1/13
• Process developed by 5/1/14
• Study completed by 1/15/14
6. Leverage our in-house subject matter expertise and teamwork to achieve the best decision making.
• Weekly review of deals—with valuation tied to partner and consumer fit, market potential, and ROI expectations.
• Include information about areas of expertise on all employee biographies.
• Weekly reviews of deals implemented by 10/1/13
• Bios updated by 12/1/13
PEOPLE

FY
14 B
US
INE
SS
PL
AN
B
rand
US
A F
Y14
Bu
sine
ss Plan
• 51
PEOPLE
STRATEGIES TACTICS GOALS
7. Motivate employees through information sharing and recognition.
• Develop a brown bag lunches program for Brand USA employees to educate each other and share ideas about Brand USA programs and initiatives.
• Hold all-staff meetings once per month.
• Create employee rewards/recognition program that is fun and performance based.
• Create dedicated internal newsletter that is dynamic and user generated.
• Integrate communications staff in regular departmental and international representation firm meetings/calls to ensure consistent flow of information.
• Brown bag lunch calendar established by 12/1/13
• First all-staff meeting held and future meetings scheduled by 10/15/13
• Employee rewards/recognition program implemented by 1/15/14
• Employee online newsletter implement by 4/1/14
• Designated communications staff member(s) scheduled to attend cross-department and international representation firm meetings/calls by 12/1/13
8. Create better definition of team roles, responsibilities, and decision ownership.
• Ensure all job descriptions are up to date and accurate.
• Create department statements of purpose.
• Process mapping of all core processes.
• Job descriptions completed by 12/15/13
• Department statements of purpose completed by 3/1/14
• Process mapping completed by 12/31/13
9. Develop an effective inclusion and diversity strategy to build a world class team and culture.
• Ensure diversity is emphasized in our values statement.
• Develop training program for diversity and inclusion.
• Values statement drafted by 12/1/13 and formalized by 1/15/14
• Training program implemented by 6/1/14
Leverage the Passion and Talent of Our Employees to Drive Value and High Performance
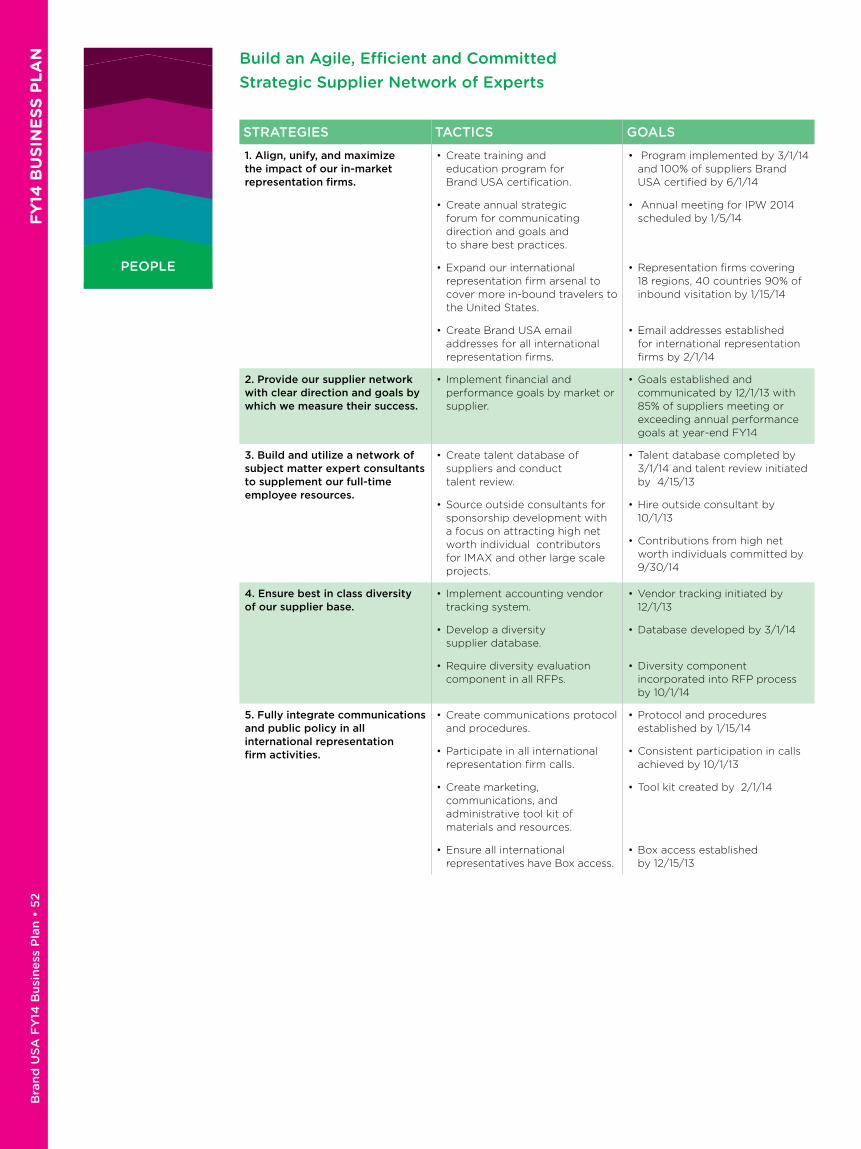
Bra
nd
US
A F
Y14
Bu
sin
ess
Pla
n •
52
F
Y14
BU
SIN
ES
S P
LA
N
PEOPLE
STRATEGIES TACTICS GOALS
1. Align, unify, and maximize the impact of our in-market representation firms.
• Create training and education program for Brand USA certification.
• Create annual strategic forum for communicating direction and goals and to share best practices.
• Expand our international representation firm arsenal to cover more in-bound travelers to the United States.
• Create Brand USA email addresses for all international representation firms.
• Program implemented by 3/1/14 and 100% of suppliers Brand USA certified by 6/1/14
• Annual meeting for IPW 2014 scheduled by 1/5/14
• Representation firms covering 18 regions, 40 countries 90% of inbound visitation by 1/15/14
• Email addresses established for international representation firms by 2/1/14
2. Provide our supplier network with clear direction and goals by which we measure their success.
• Implement financial and performance goals by market or supplier.
• Goals established and communicated by 12/1/13 with 85% of suppliers meeting or exceeding annual performance goals at year-end FY14
3. Build and utilize a network of subject matter expert consultants to supplement our full-time employee resources.
• Create talent database of suppliers and conduct talent review.
• Source outside consultants for sponsorship development with a focus on attracting high net worth individual contributors for IMAX and other large scale projects.
• Talent database completed by 3/1/14 and talent review initiated by 4/15/13
• Hire outside consultant by 10/1/13
• Contributions from high net worth individuals committed by 9/30/14
4. Ensure best in class diversity of our supplier base.
• Implement accounting vendor tracking system.
• Develop a diversity supplier database.
• Require diversity evaluation component in all RFPs.
• Vendor tracking initiated by 12/1/13
• Database developed by 3/1/14
• Diversity component incorporated into RFP process by 10/1/14
5. Fully integrate communications and public policy in all international representation firm activities.
• Create communications protocol and procedures.
• Participate in all international representation firm calls.
• Create marketing, communications, and administrative tool kit of materials and resources.
• Ensure all international representatives have Box access.
• Protocol and procedures established by 1/15/14
• Consistent participation in calls achieved by 10/1/13
• Tool kit created by 2/1/14
• Box access established by 12/15/13
Build an Agile, Efficient and Committed Strategic Supplier Network of Experts
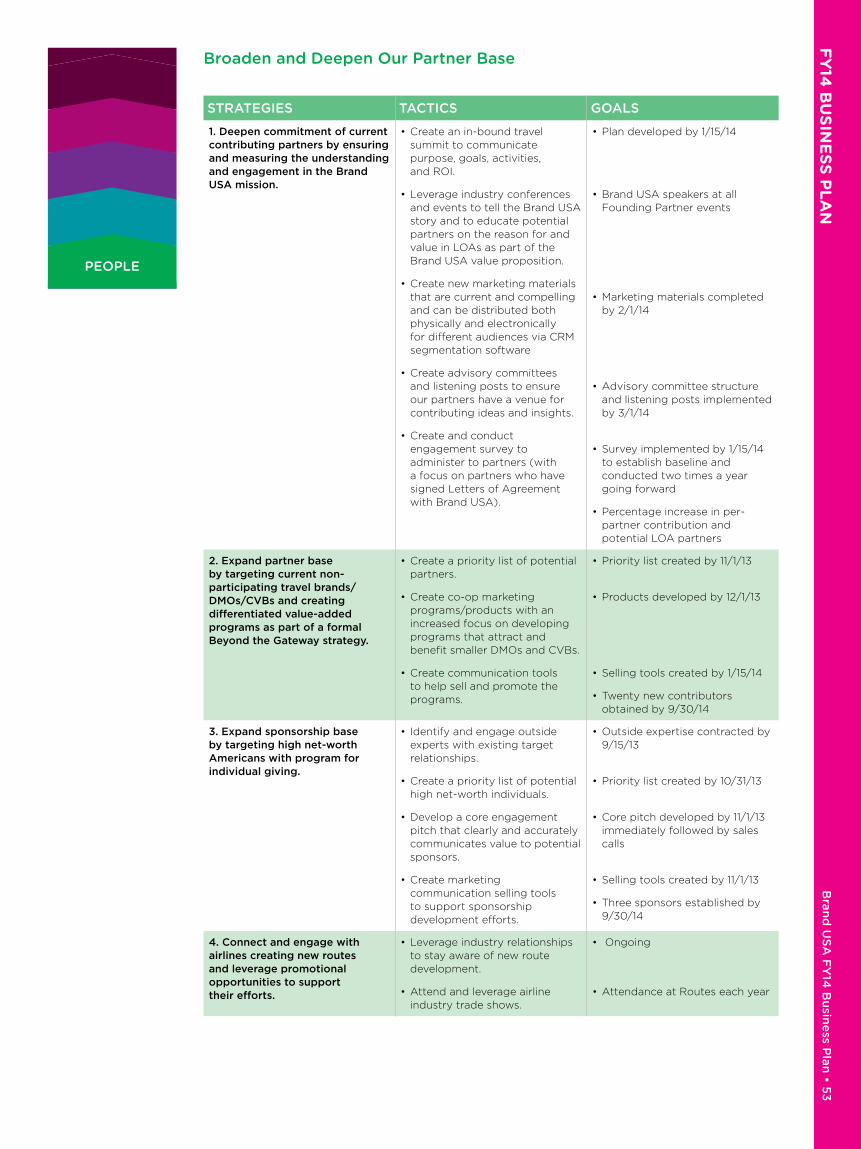
FY
14 B
US
INE
SS
PL
AN
B
rand
US
A F
Y14
Bu
sine
ss Plan
• 53
PEOPLE
STRATEGIES TACTICS GOALS
1. Deepen commitment of current contributing partners by ensuring and measuring the understanding and engagement in the Brand USA mission.
• Create an in-bound travel summit to communicate purpose, goals, activities, and ROI.
• Leverage industry conferences and events to tell the Brand USA story and to educate potential partners on the reason for and value in LOAs as part of the Brand USA value proposition.
• Create new marketing materials that are current and compelling and can be distributed both physically and electronically for different audiences via CRM segmentation software
• Create advisory committees and listening posts to ensure our partners have a venue for contributing ideas and insights.
• Create and conduct engagement survey to administer to partners (with a focus on partners who have signed Letters of Agreement with Brand USA).
• Plan developed by 1/15/14
• Brand USA speakers at all Founding Partner events
• Marketing materials completed by 2/1/14
• Advisory committee structure and listening posts implemented by 3/1/14
• Survey implemented by 1/15/14 to establish baseline and conducted two times a year going forward
• Percentage increase in per-partner contribution and potential LOA partners
2. Expand partner base by targeting current non-participating travel brands/DMOs/CVBs and creating differentiated value-added programs as part of a formal Beyond the Gateway strategy.
• Create a priority list of potential partners.
• Create co-op marketing programs/products with an increased focus on developing programs that attract and benefit smaller DMOs and CVBs.
• Create communication tools to help sell and promote the programs.
• Priority list created by 11/1/13
• Products developed by 12/1/13
• Selling tools created by 1/15/14
• Twenty new contributors obtained by 9/30/14
3. Expand sponsorship base by targeting high net-worth Americans with program for individual giving.
• Identify and engage outside experts with existing target relationships.
• Create a priority list of potential high net-worth individuals.
• Develop a core engagement pitch that clearly and accurately communicates value to potential sponsors.
• Create marketing communication selling tools to support sponsorship development efforts.
• Outside expertise contracted by 9/15/13
• Priority list created by 10/31/13
• Core pitch developed by 11/1/13 immediately followed by sales calls
• Selling tools created by 11/1/13
• Three sponsors established by 9/30/14
4. Connect and engage with airlines creating new routes and leverage promotional opportunities to support their efforts.
• Leverage industry relationships to stay aware of new route development.
• Attend and leverage airline industry trade shows.
• Ongoing
• Attendance at Routes each year
Broaden and Deepen Our Partner Base
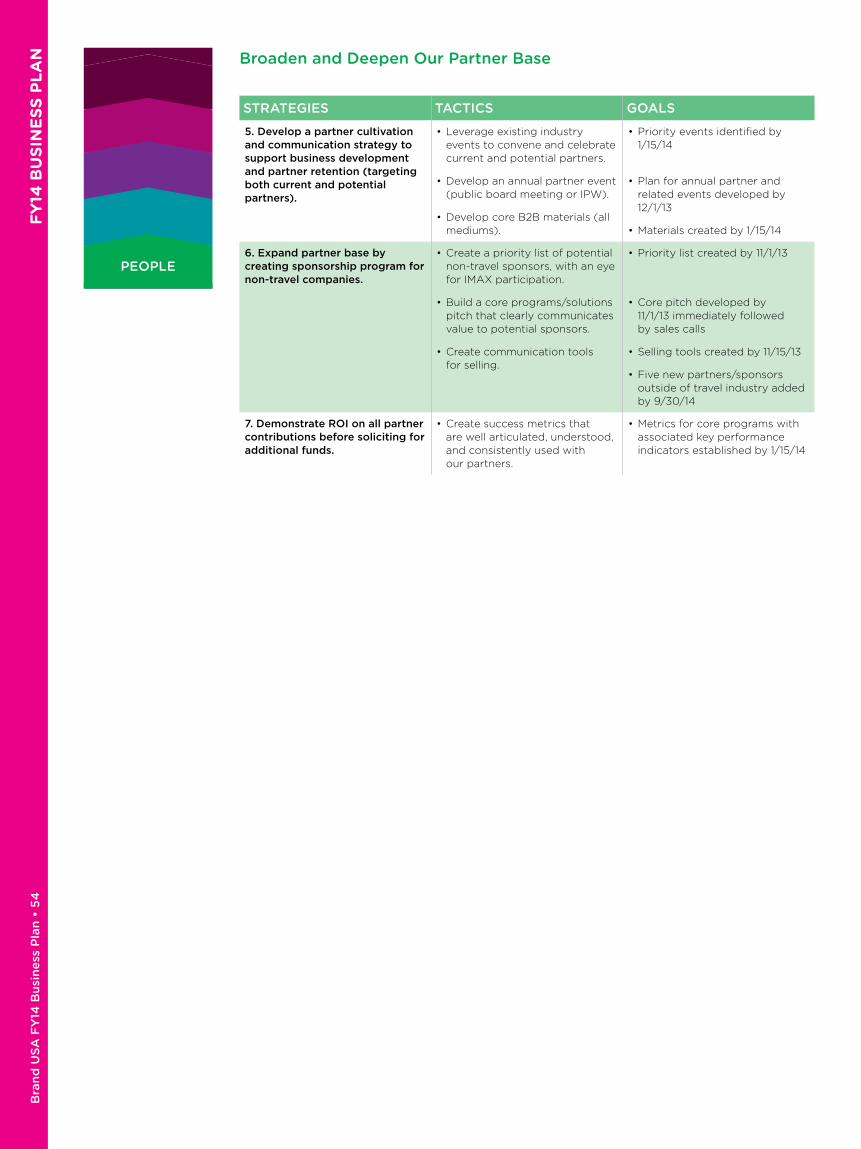
Bra
nd
US
A F
Y14
Bu
sin
ess
Pla
n •
54
F
Y14
BU
SIN
ES
S P
LA
N
PEOPLE
Broaden and Deepen Our Partner Base
STRATEGIES TACTICS GOALS
5. Develop a partner cultivation and communication strategy to support business development and partner retention (targeting both current and potential partners).
• Leverage existing industry events to convene and celebrate current and potential partners.
• Develop an annual partner event (public board meeting or IPW).
• Develop core B2B materials (all mediums).
• Priority events identified by 1/15/14
• Plan for annual partner and related events developed by 12/1/13
• Materials created by 1/15/14
6. Expand partner base by creating sponsorship program for non-travel companies.
• Create a priority list of potential non-travel sponsors, with an eye for IMAX participation.
• Build a core programs/solutions pitch that clearly communicates value to potential sponsors.
• Create communication tools for selling.
• Priority list created by 11/1/13
• Core pitch developed by 11/1/13 immediately followed by sales calls
• Selling tools created by 11/15/13
• Five new partners/sponsors outside of travel industry added by 9/30/14
7. Demonstrate ROI on all partner contributions before soliciting for additional funds.
• Create success metrics that are well articulated, understood, and consistently used with our partners.
• Metrics for core programs with associated key performance indicators established by 1/15/14

FY
14 B
US
INE
SS
PL
AN
B
rand
US
A F
Y14
Bu
sine
ss Plan
• 55
PEOPLE
Strengthen Our Fully Integrated Partnership with Government Stakeholders
STRATEGIES TACTICS GOALS
1. Develop trusted working relationships with government stakeholders through information sharing.
• Continue to execute against cultivation strategy with members of the Commerce Department, the State Department, the Homeland Security Department, and congressional committee members and staff (updating the plan as needed for 2014).
• Conduct in-state or district roundtables with local industry, chamber, and other travel related entities, members and/or their staff.
• Establish a regular schedule of in-person meetings with Congressional Committee members and Brand USA’s CEO.
• Whenever possible, hold board meetings, advisory committee meetings and other Brand USA events in key travel districts.
• Develop methodology and deploy champion index.
• Update by 12/1/13
• Two to three roundtables conducted per month beginning 3/1/14
• At least two meetings per month held with members and Brand USA’s CEO beginning 3/1/14
• Advisory committee meeting in relevant district/state held by 3/1/14
• Champion index developed by 1/15/14
2. Create a shared understanding of the importance of international inbound travel and the best way to improve communication of U.S. travel policies.
• Create a travel summit with Federal agencies.
• Create a federal agency cultivation strategy to leverage engagement opportunities with government stakeholders to solicit feedback, report on results, and build relationships.
• Conduct roundtables educating TSA screeners at various airports on the importance of international travel.
• Plan for travel summit developed by 2/1/14
• Cultivation strategy developed by 12/1/13
• Roundtables in three cities by 2/1/14
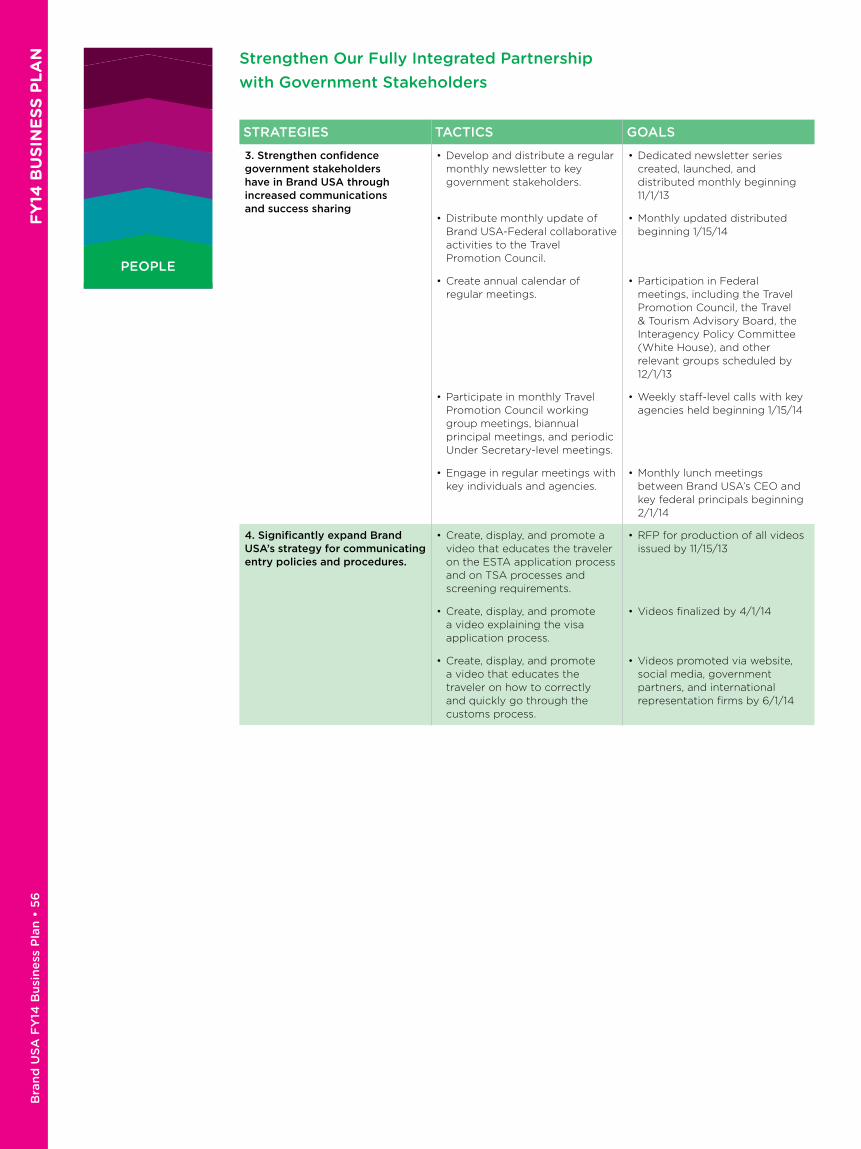
Bra
nd
US
A F
Y14
Bu
sin
ess
Pla
n •
56
F
Y14
BU
SIN
ES
S P
LA
N
PEOPLE
Strengthen Our Fully Integrated Partnership with Government Stakeholders
STRATEGIES TACTICS GOALS
3. Strengthen confidence government stakeholders have in Brand USA through increased communications and success sharing
• Develop and distribute a regular monthly newsletter to key government stakeholders.
• Distribute monthly update of Brand USA-Federal collaborative activities to the Travel Promotion Council.
• Create annual calendar of regular meetings.
• Participate in monthly Travel Promotion Council working group meetings, biannual principal meetings, and periodic Under Secretary-level meetings.
• Engage in regular meetings with key individuals and agencies.
• Dedicated newsletter series created, launched, and distributed monthly beginning 11/1/13
• Monthly updated distributed beginning 1/15/14
• Participation in Federal meetings, including the Travel Promotion Council, the Travel & Tourism Advisory Board, the Interagency Policy Committee (White House), and other relevant groups scheduled by 12/1/13
• Weekly staff-level calls with key agencies held beginning 1/15/14
• Monthly lunch meetings between Brand USA’s CEO and key federal principals beginning 2/1/14
4. Significantly expand Brand USA’s strategy for communicating entry policies and procedures.
• Create, display, and promote a video that educates the traveler on the ESTA application process and on TSA processes and screening requirements.
• Create, display, and promote a video explaining the visa application process.
• Create, display, and promote a video that educates the traveler on how to correctly and quickly go through the customs process.
• RFP for production of all videos issued by 11/15/13
• Videos finalized by 4/1/14
• Videos promoted via website, social media, government partners, and international representation firms by 6/1/14

FY
14 B
US
INE
SS
PL
AN
B
rand
US
A F
Y14
Bu
sine
ss Plan
• 57
Align and Leverage the Collective Force of the Industry
STRATEGIES TACTICS GOALS
1. Create and execute a strategy that communicates and demonstrates the overwhelming value that Brand USA brings to powering the U.S. economy.
• Develop a guide book for senior management to make sure key geographic markets in the U.S. are included in various programs and initiatives.
• Develop U.S. based initiatives (viral/social) which advance the cause of international tourism to the U.S. within the parameters of the Travel Promotion Act.
• Create an “Across the USA” value of tourism testimonial video, that can be cut in a number of ways for different purposes (i.e., geographical, programmatic, and travel segment).
• Apprise staff on an educational basis what others are doing to promote reauthorization of Brand USA.
• Book created by 2/1/14
• Plan established by 3/1/14
• Video created by 4/1/14
• Reauthorization achieved by 9/30/14
2. Ensure the industry has easy access to information on Brand USA’s impact on the U.S. economy.
• Create a quarterly industry report card to send to influential industry leadership to be used in their communications.
• Provide online access to top influencers.
• Quarterly industry report card developed and implemented by 7/1/14
• Online access established by 8/1/14
PEOPLE

Bra
nd
US
A F
Y14
Bu
sin
ess
Pla
n •
58
F
Y14
BU
SIN
ES
S P
LA
N
PEOPLE
Align and Leverage the Collective Force of the Industry
STRATEGIES TACTICS GOALS
3. Build engagement, trust, and advocacy for Brand USA through stakeholder communications and value-added research.
• Enhance eNewsletter series to include an umbrella newsletter augmented with communications customized for partners/sponsors, the travel trade, government stakeholders, and the media.
• Develop an editorial calendar of communications opportunities.
• Generate case studies for partner programs to support business development.
• Execute co-operative Market Intelligence Program.
• Establish a plan to work with academic institutions to support the next generation of marketing professionals.
• Targeted newsletter series launched by 2/1/14
• Delivery of editorial calendar to partners initiated by 12/1/13
• At least three case studies generated by 1/15/14
• Plan established by 2/1/14
• Relationships with at least three university hospitality programs established by the end of FY14
4. Measure industry stakeholder engagement and satisfaction.
• Develop and launch a stakeholder engagement survey.
• Survey implemented by 1/15/14 to establish baseline and then conducted two times per year on an ongoing basis
5. Establish a communications advisory group to engage the industry and partners and maximize our collective efforts to increase awareness of the USA as a premier travel destination.
• Define mission and strategy of advisory group.
• Identify and invite key industry influencers to participate on communications advisory committee.
• Hold quarterly meetings/calls.
• Definition work completed by 12/15/13
• Invitations extended by 1/15/14
• Initial communications advisory group meeting/call held by 4/1/14
6. Establish a community relations/corporate social responsibility (CSR) strategy that enables and engages strong industry participation.
• Develop CSR strategy.
• Communicate and roll out CSR program at IPW.
• CSR strategy developed by 2/1/14
• CSR program introduced at IPW in Chicago in April 2014
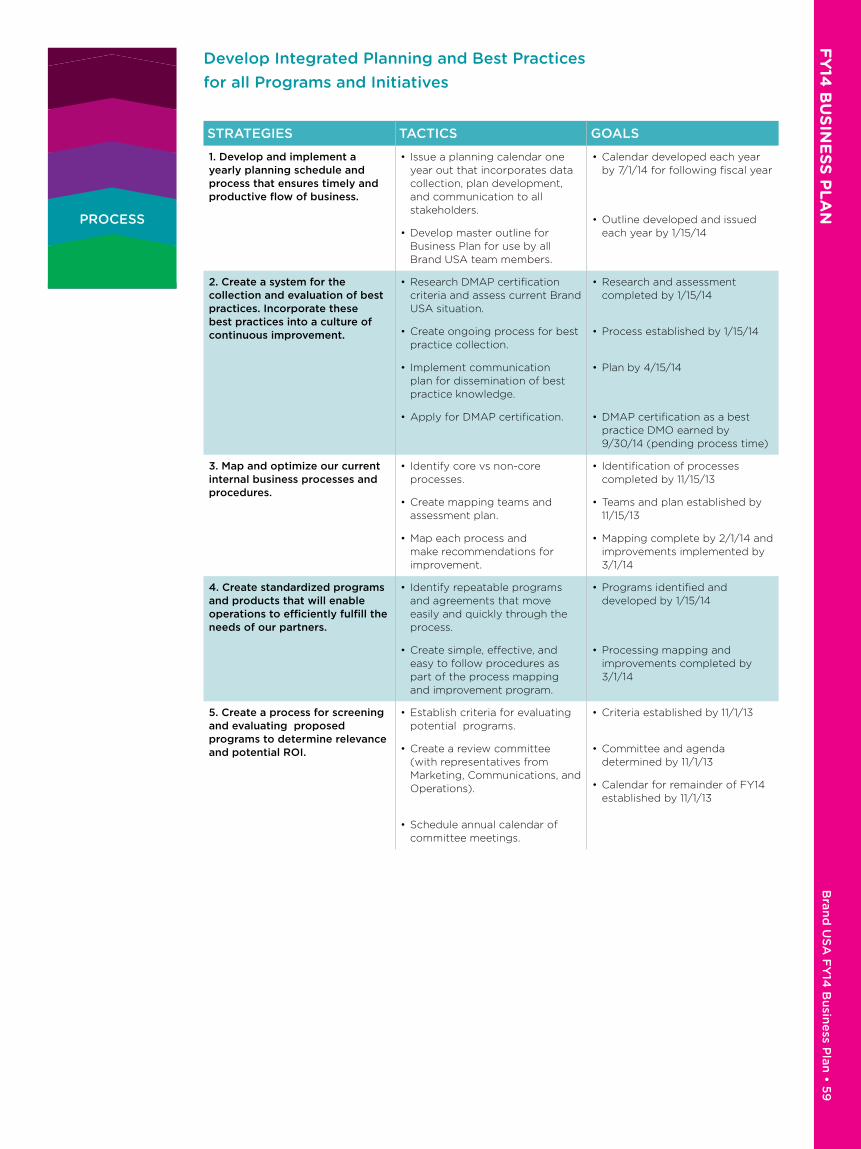
FY
14 B
US
INE
SS
PL
AN
B
rand
US
A F
Y14
Bu
sine
ss Plan
• 59
PROCESS
Develop Integrated Planning and Best Practices for all Programs and Initiatives
STRATEGIES TACTICS GOALS
1. Develop and implement a yearly planning schedule and process that ensures timely and productive flow of business.
• Issue a planning calendar one year out that incorporates data collection, plan development, and communication to all stakeholders.
• Develop master outline for Business Plan for use by all Brand USA team members.
• Calendar developed each year by 7/1/14 for following fiscal year
• Outline developed and issued each year by 1/15/14
2. Create a system for the collection and evaluation of best practices. Incorporate these best practices into a culture of continuous improvement.
• Research DMAP certification criteria and assess current Brand USA situation.
• Create ongoing process for best practice collection.
• Implement communication plan for dissemination of best practice knowledge.
• Apply for DMAP certification.
• Research and assessment completed by 1/15/14
• Process established by 1/15/14
• Plan by 4/15/14
• DMAP certification as a best practice DMO earned by 9/30/14 (pending process time)
3. Map and optimize our current internal business processes and procedures.
• Identify core vs non-core processes.
• Create mapping teams and assessment plan.
• Map each process and make recommendations for improvement.
• Identification of processes completed by 11/15/13
• Teams and plan established by 11/15/13
• Mapping complete by 2/1/14 and improvements implemented by 3/1/14
4. Create standardized programs and products that will enable operations to efficiently fulfill the needs of our partners.
• Identify repeatable programs and agreements that move easily and quickly through the process.
• Create simple, effective, and easy to follow procedures as part of the process mapping and improvement program.
• Programs identified and developed by 1/15/14
• Processing mapping and improvements completed by 3/1/14
5. Create a process for screening and evaluating proposed programs to determine relevance and potential ROI.
• Establish criteria for evaluating potential programs.
• Create a review committee (with representatives from Marketing, Communications, and Operations).
• Schedule annual calendar of committee meetings.
• Criteria established by 11/1/13
• Committee and agenda determined by 11/1/13
• Calendar for remainder of FY14 established by 11/1/13

Bra
nd
US
A F
Y14
Bu
sin
ess
Pla
n •
60
F
Y14
BU
SIN
ES
S P
LA
N
PROCESS
Define, Clarify and Streamline Compliance Processes
STRATEGIES TACTICS GOALS
1. Establish compliance across all business practices.
• Finalize policies (Travel and Procurement) and associated procedures – incorporating staff feedback where possible.
• Train employee base. Provide user friendly resources to support staff understanding and sign-off.
• Create and implement Contract Management System.
• Policies finalized by 3/1/14
• Compliance training program and schedule established by 12/1/13
• Program implemented for current employees by 11/1/13
• Program incorporated into new employee orientation by 11/1/13
• 100% compliance to policies and procedures achieved for the year
• Contract Management System implemented by 12/15/13
2. Build operational ease and efficiency.
• Streamline and shorten processing time for all procedures (accounts payable, accounts receivable, and ESTA submissions).
• Create improvement plan to reduce average number of ESTA filing days (cycle time from receipt of contribution to ESTA filing to receipt of funds) including adding provisions in contractual service level agreements (processing time) for all vendors.
• Create plan to reduce average time to process/pay invoices and expense claims.
• Develop action plan for overdue ESTA payments (30+ days with the Department of Commerce).
• Milestones for ESTA filings established and tracking against process time between each milestone initiated by 12/1/13
• Plan created by 2/1/14 with marked percentage decrease in cycle time achieved by the end of FY14
• Reduction in average time to process/pay invoices to 30 days or less and to process/pay employee expenses to 15 days or less
• Action plan developed and implemented by 2/1/14
3. Formalize process for updating in-kind policies and procedures.
• Draft recommended process for updates and review with the Department of Commerce.
• Implement final process.
• Recommendations drafted by 11/1/13 and reviewed with the Department of Commerce by 11/15/13
• Final process implemented by 1/15/14

FY
14 B
US
INE
SS
PL
AN
B
rand
US
A F
Y14
Bu
sine
ss Plan
• 61
PROCESS
Continually Optimize Technology Resources and Systems
STRATEGIES TACTICS GOALS
1. Develop technology systems that streamline and deliver information in a timely, accurate manner.
• Upgrade data communications bandwidth and implement monitoring tools.
• Upgrade accounting software based on needs analysis (performed under BDO contract).
• Implement Anybill accounts payable software for increased transparency and efficiency and to ensure adherence to all contract and procurement compliance requirements.
• 95% of planned technology resources implemented on time and within budget by the end of FY14
• Accounting software implemented by 9/30/14
• Accounts payable software implemented by 3/30/14
2. Develop Customer Relationship Management system (CRM) to enable us to document, track, and manage communication and program execution with our partners.
• Conduct analysis of suitable systems (performed under Digital DNA contract).
• Select best identified CRM package for trial (performed under Digital DNA contract) for trial.
• Conduct RFP with criteria determined in suitability analysis.
• Implement selected solution with initial capabilities.
• Summary of findings produced by 8/31/14
• Plan created and 14-day trial using small group and test data conducted by 12/1/13
• RFP issued and selection of vendor presented for budget consideration by 9/30/14
• CRM software implemented by 12/31/13
3. Improve help desk support. • Analyze user needs to identify gaps in capabilities and response time.
• Implement software to catalog solutions and create knowledge base.
• Identify regularly needed small equipment and keep inventory.
• Conduct RFP for hardware procurement.
• Implement regular training seminars.
• Gaps identified by 11/15/13
• Help desk software tool implemented by 12/31/13
• Needs identified and inventory created by 12/31/13
• Hardware procurement RFP completed by 12/15/13
• Seminar program initiated by 2/1/14
4. Implement IT Planning for future.
• Create long-term hardware budget with replacement cycle.
• Create Disaster Recovery and Continuity of Operations plans.
• Budget and plan presented by 7/1/14 (one month prior to development of FY15 budget)
• Plans developed by 6/1/14
5. Reduce costs and increase efficiencies and brand consistency by developing and expanding online resources for employees and suppliers to access brand assets, stationary and promotional products.
• Enhance selection of existing stationary templates and promotional products programs.
• Create a comprehensive set of brand standards by developing corporate brand standards and refining consumer brand standards for online and print application.
• Expand our online fulfillment capability with inventoried items expensed only at time of fulfillment.
• Selection upgraded by 1/15/14
• Comprehensive set of standards introduced by 2/1/14
• Online fulfillment capability expanded and launched by 3/1/14

Bra
nd
US
A F
Y14
Bu
sin
ess
Pla
n •
62
F
Y14
BU
SIN
ES
S P
LA
N
PROCESS
Align our Programs to Ensure Ongoing Support of the National Travel and Tourism Strategy
STRATEGIES TACTICS GOALS
1. Expand collaboration and leadership of all initiatives related to National Travel & Tourism Strategy.
• Equip representation firms with budget and guidance to develop yearly work plans with embassies/consulates.
• Develop tools kits to include Brand USA collateral, logos, and briefing materials that can be distributed through the Main Street resource management system for Federal partners.
• Develop coordinated approach to promoting Federal lands and waters through Brand USA channels; support National Park Service centennial activities with the Department of the Interior.
• Develop editorial calendar that integrates key recreation.gov experiences each month.
• Provide updates to the Travel Promotion Council to be included in quarterly report to principals and the White House.
• Coordinate global collaborative projects (digital and/or thematic programs) through Brand USA’s corporate office.
• Work plans with the embassies that includes three to four key activities by established by 2/1/14
• Tool kits distributed to all 75 members of the Commercial Service Global Travel and Tourism Team and to principals of the State Department by 2/1/14
• Plans established with respective Federal agencies by 2/1/14
• Editorial calendar delivered by 1/15/14
• Report format and score card developed by 1/15/14 and report delivered by the 15th of each month thereafter
• Plan and KPIs for global collaborative efforts developed by 1/15/14
2. Assess and report the impact of Brand USA on a national scale.
• Issue RFP and select vendor to calculate attributable growth in international arrivals and expenditure, as well as the resulting economic impact and the creation of jobs.
• Research and related communications for release completed by 1/15/14
• Percentage of achievement of Travel Promotion Council shared annual objectives (submitted to the Department of Commerce on 8/1/14)

FY
14 B
US
INE
SS
PL
AN
B
rand
US
A F
Y14
Bu
sine
ss Plan
• 63
CUSTOMER
Develop and Package Compelling Value-Added Programs and Campaigns
STRATEGIES TACTICS GOALS
1. Participate in a high-value, cost effective series of trade shows in highly productive feeder markets.
• Develop consistent innovative design for events.
• Develop activities that will create meaningful engagement with in-market buyers.
• Develop high value sponsorship opportunities for exhibitors.
• One common design established by 1/15/14
• Trade show engagement plan developed by 12/1/13
• Enhanced sponsorship opportunities developed by 3/1/14
2. Offer value-added missions and familiarization (FAM) trips to our partners for their participation.
• Develop sales mission for each market where Brand USA has international representation firms.
• Create FAM trips for markets where Brand USA has international representation firms.
• One mission, per year, per market conducted in FY14
• Two FAM trips per year from highest priority international markets conducted in FY14
3. Create opportunities for full industry participation, including large and small organizations, as part of a formal Beyond the Gateway strategy.
• Interview smaller CVBs/DMOs to gather information regarding needs.
• Develop programs that best meet their needs.
• Ongoing beginning 10/1/13
• Full package for smaller partners developed by 1/15/14
4. Develop success metrics for all programs and communicate the results to stakeholders
• Engage OTA/tour operator partners to develop value-add propositions to be included as a call to action in the majority of advertising.
• Create a database of success stories as communicated directly by our partners as to how Brand USA adds value and makes a difference.
• Spending metrics for at least 50% of our spend established by 2/1/14
• Database of success stories to use as examples established by 12/1/13
5. Create sponsorship opportunities for non-travel companies.
• Use our IMAX partnership to solicit non-travel sponsors who want to support the Brand USA effort.
• Develop a retail strategy that enhances our value with DMO and CVB partners and provides new participation opportunities.
• Expand our strategy for entertainment and sports branded content and events.
• $10 million in sponsorships committed by 9/1/14
• Strategy in place by 10/1/13 and first retail partner obtained by 1/31/14
• Recommended next steps established by 11/1/13
6. Leverage new airline route development by airlines for promotional opportunities into gateway and secondary markets.
• Effectively engage in airline conferences like Routes Development Congress.
• Create relationships with foreign carriers.
• Develop promotional opportunities between airline, airports, and destinations.
• Routes Congress attendance in October 2013 and February 2014 (in San Salvador)
• Priorities and plan for efficient allocation of time established by 12/1/13
• Three promotional opportunities deployed by 9/30/14
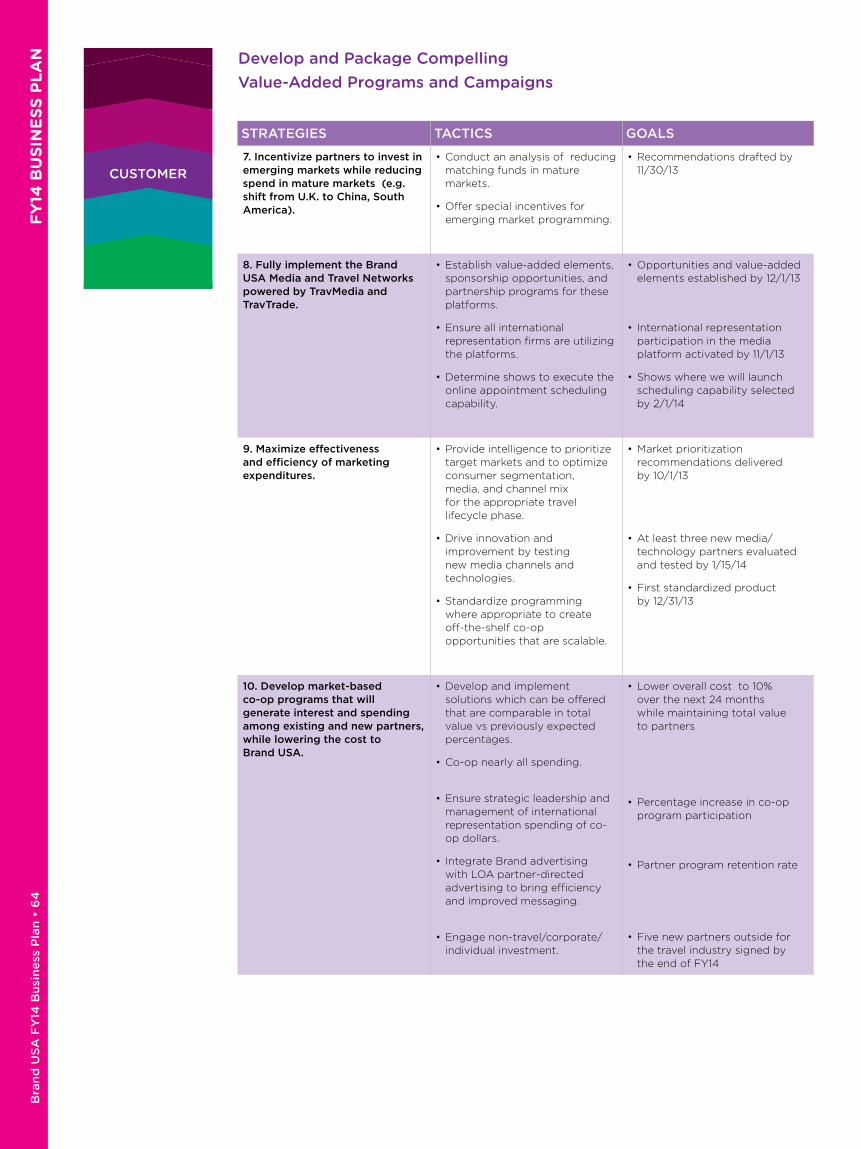
Bra
nd
US
A F
Y14
Bu
sin
ess
Pla
n •
64
F
Y14
BU
SIN
ES
S P
LA
N
CUSTOMER
Develop and Package Compelling Value-Added Programs and Campaigns
STRATEGIES TACTICS GOALS
7. Incentivize partners to invest in emerging markets while reducing spend in mature markets (e.g. shift from U.K. to China, South America).
• Conduct an analysis of reducing matching funds in mature markets.
• Offer special incentives for emerging market programming.
• Recommendations drafted by 11/30/13
8. Fully implement the Brand USA Media and Travel Networks powered by TravMedia and TravTrade.
• Establish value-added elements, sponsorship opportunities, and partnership programs for these platforms.
• Ensure all international representation firms are utilizing the platforms.
• Determine shows to execute the online appointment scheduling capability.
• Opportunities and value-added elements established by 12/1/13
• International representation participation in the media platform activated by 11/1/13
• Shows where we will launch scheduling capability selected by 2/1/14
9. Maximize effectiveness and efficiency of marketing expenditures.
• Provide intelligence to prioritize target markets and to optimize consumer segmentation, media, and channel mix for the appropriate travel lifecycle phase.
• Drive innovation and improvement by testing new media channels and technologies.
• Standardize programming where appropriate to create off-the-shelf co-op opportunities that are scalable.
• Market prioritization recommendations delivered by 10/1/13
• At least three new media/technology partners evaluated and tested by 1/15/14
• First standardized product by 12/31/13
10. Develop market-based co-op programs that will generate interest and spending among existing and new partners, while lowering the cost to Brand USA.
• Develop and implement solutions which can be offered that are comparable in total value vs previously expected percentages.
• Co-op nearly all spending.
• Ensure strategic leadership and management of international representation spending of co-op dollars.
• Integrate Brand advertising with LOA partner-directed advertising to bring efficiency and improved messaging.
• Engage non-travel/corporate/individual investment.
• Lower overall cost to 10% over the next 24 months while maintaining total value to partners
• Percentage increase in co-op program participation
• Partner program retention rate
• Five new partners outside for the travel industry signed by the end of FY14
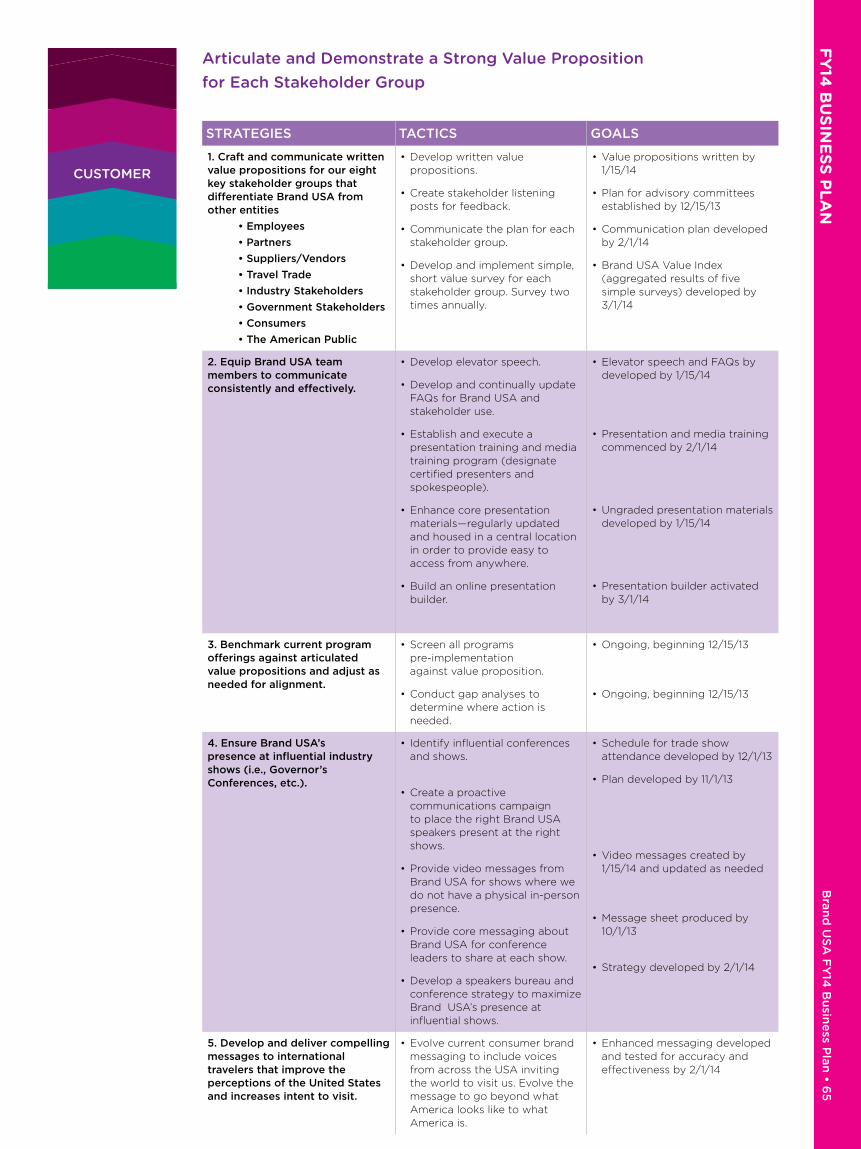
FY
14 B
US
INE
SS
PL
AN
B
rand
US
A F
Y14
Bu
sine
ss Plan
• 65
CUSTOMER
Articulate and Demonstrate a Strong Value Proposition for Each Stakeholder Group
STRATEGIES TACTICS GOALS
1. Craft and communicate written value propositions for our eight key stakeholder groups that differentiate Brand USA from other entities
• Employees
• Partners
• Suppliers/Vendors
• Travel Trade
• Industry Stakeholders
• Government Stakeholders
• Consumers
• The American Public
• Develop written value propositions.
• Create stakeholder listening posts for feedback.
• Communicate the plan for each stakeholder group.
• Develop and implement simple, short value survey for each stakeholder group. Survey two times annually.
• Value propositions written by 1/15/14
• Plan for advisory committees established by 12/15/13
• Communication plan developed by 2/1/14
• Brand USA Value Index (aggregated results of five simple surveys) developed by 3/1/14
2. Equip Brand USA team members to communicate consistently and effectively.
• Develop elevator speech.
• Develop and continually update FAQs for Brand USA and stakeholder use.
• Establish and execute a presentation training and media training program (designate certified presenters and spokespeople).
• Enhance core presentation materials—regularly updated and housed in a central location in order to provide easy to access from anywhere.
• Build an online presentation builder.
• Elevator speech and FAQs by developed by 1/15/14
• Presentation and media training commenced by 2/1/14
• Ungraded presentation materials developed by 1/15/14
• Presentation builder activated by 3/1/14
3. Benchmark current program offerings against articulated value propositions and adjust as needed for alignment.
• Screen all programs pre-implementation against value proposition.
• Conduct gap analyses to determine where action is needed.
• Ongoing, beginning 12/15/13
• Ongoing, beginning 12/15/13
4. Ensure Brand USA’s presence at influential industry shows (i.e., Governor’s Conferences, etc.).
• Identify influential conferences and shows.
• Create a proactive communications campaign to place the right Brand USA speakers present at the right shows.
• Provide video messages from Brand USA for shows where we do not have a physical in-person presence.
• Provide core messaging about Brand USA for conference leaders to share at each show.
• Develop a speakers bureau and conference strategy to maximize Brand USA’s presence at influential shows.
• Schedule for trade show attendance developed by 12/1/13
• Plan developed by 11/1/13
• Video messages created by 1/15/14 and updated as needed
• Message sheet produced by 10/1/13
• Strategy developed by 2/1/14
5. Develop and deliver compelling messages to international travelers that improve the perceptions of the United States and increases intent to visit.
• Evolve current consumer brand messaging to include voices from across the USA inviting the world to visit us. Evolve the message to go beyond what America looks like to what America is.
• Enhanced messaging developed and tested for accuracy and effectiveness by 2/1/14
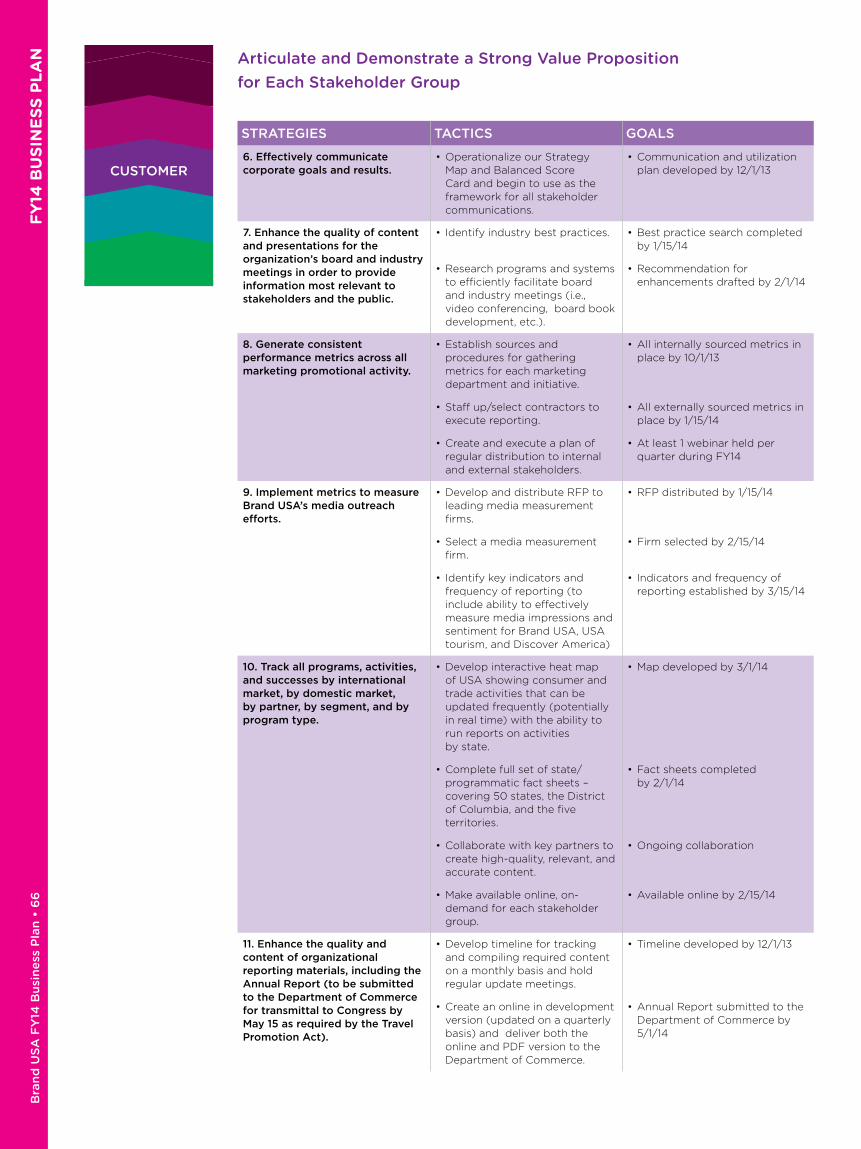
Bra
nd
US
A F
Y14
Bu
sin
ess
Pla
n •
66
F
Y14
BU
SIN
ES
S P
LA
N
CUSTOMER
STRATEGIES TACTICS GOALS
6. Effectively communicate corporate goals and results.
• Operationalize our Strategy Map and Balanced Score Card and begin to use as the framework for all stakeholder communications.
• Communication and utilization plan developed by 12/1/13
7. Enhance the quality of content and presentations for the organization’s board and industry meetings in order to provide information most relevant to stakeholders and the public.
• Identify industry best practices.
• Research programs and systems to efficiently facilitate board and industry meetings (i.e., video conferencing, board book development, etc.).
• Best practice search completed by 1/15/14
• Recommendation for enhancements drafted by 2/1/14
8. Generate consistent performance metrics across all marketing promotional activity.
• Establish sources and procedures for gathering metrics for each marketing department and initiative.
• Staff up/select contractors to execute reporting.
• Create and execute a plan of regular distribution to internal and external stakeholders.
• All internally sourced metrics in place by 10/1/13
• All externally sourced metrics in place by 1/15/14
• At least 1 webinar held per quarter during FY14
9. Implement metrics to measure Brand USA’s media outreach efforts.
• Develop and distribute RFP to leading media measurement firms.
• Select a media measurement firm.
• Identify key indicators and frequency of reporting (to include ability to effectively measure media impressions and sentiment for Brand USA, USA tourism, and Discover America)
• RFP distributed by 1/15/14
• Firm selected by 2/15/14
• Indicators and frequency of reporting established by 3/15/14
10. Track all programs, activities, and successes by international market, by domestic market, by partner, by segment, and by program type.
• Develop interactive heat map of USA showing consumer and trade activities that can be updated frequently (potentially in real time) with the ability to run reports on activities by state.
• Complete full set of state/programmatic fact sheets – covering 50 states, the District of Columbia, and the five territories.
• Collaborate with key partners to create high-quality, relevant, and accurate content.
• Make available online, on-demand for each stakeholder group.
• Map developed by 3/1/14
• Fact sheets completed by 2/1/14
• Ongoing collaboration
• Available online by 2/15/14
11. Enhance the quality and content of organizational reporting materials, including the Annual Report (to be submitted to the Department of Commerce for transmittal to Congress by May 15 as required by the Travel Promotion Act).
• Develop timeline for tracking and compiling required content on a monthly basis and hold regular update meetings.
• Create an online in development version (updated on a quarterly basis) and deliver both the online and PDF version to the Department of Commerce.
• Timeline developed by 12/1/13
• Annual Report submitted to the Department of Commerce by 5/1/14
Articulate and Demonstrate a Strong Value Proposition for Each Stakeholder Group

FY
14 B
US
INE
SS
PL
AN
B
rand
US
A F
Y14
Bu
sine
ss Plan
• 67
CUSTOMER
Create Raving Fans of the USA
STRATEGIES TACTICS GOALS
1. Create a domestic engagement initiative to evolve brand message from showing the product of America to giving a voice to the welcoming spirit of America.
• Conduct research in local markets to gauge the relevance and importance of American testimonials and invitations to visit the United States.
• Create the business case for the initiative.
• Create social programs to gather appropriate content.
• Testing of domestic ambassador program variations completed by 1/15/14
• Deadline for business case for the initiative to be determined based on research results (target: 2/1/14)
2. Launch an updated campaign with fully integrated global messaging with a central campaign idea for FY14.
• Provide channel specific guidelines for brand and call to action messaging.
• Develop a value system to clearly communicate the objective and next step call to action required by tactic/market.
• Align tactics to support the central idea from each market and develop market-specific tool kits.
• Campaign that guides audiences through a measurable and actionable set of touchpoints developed (and executions without call to action eliminated) by 3/1/14
• ROI/response measures for all touchpoints developed (with each consumer media touchpoint actionable) by 12/1/13
3. Utilize new market prioritization model to develop country/market-specific media plans that align with market potential.
• Determine & build communications plan & optimal budget per market.
• Marketing prioritization and budget allocation for FY14 completed by 10/1/13
• Creative refresh to include market-specific nuances to existing brand campaign; completed by 3/1/14
4. Develop a system to measure value and performance improvements.
• Develop ROI and corresponding KPIs for each market (launch vs maintenance).
• Track visitation to the United States from each market in which we have a brand presence.
• Pre- and post-wave results that show campaign awareness at 15% or higher
• Improvement in image and perceptions of the United States as a destination of +3 points or more
5. Develop creative messaging and tools that guide target audiences through a measurable and actionable set of touchpoints by market.
• Define each customer touchpoint and stage of the travel lifecycle.
• Ensure each customer touchpoint has a clear Call To Action (CTA).
• For each CTA, build appropriate tracking methods to measure engagement.
• CTAs (and corresponding content) for each marketing channel developed by 1/15/14

Bra
nd
US
A F
Y14
Bu
sin
ess
Pla
n •
68
F
Y14
BU
SIN
ES
S P
LA
N
CUSTOMER
STRATEGIES TACTICS GOALS
6. Redevelop/update all digital tools into a single integrated user experience within each market.
• Determine digital touchpoint value by market.
• Integrate website tools and social media channels into a single experience.
• Evaluate performance of existing tools in market by potential value and measurability.
• Eliminate the use of underperforming channels and acquire new channels determined to be critical in key international markets.
• Social media activity to all in-country websites integrated by 3/15/14 in top-tier markets and by 6/15/14 in second-tier markets
• 20% annual increase in combined global site views, 25% annual increase in time on site, and 10% annual increase in social media engagement by the end of FY14
• Percentage increase in positive social sentiment while maintaining 90% or better positive social sentiment related to campaign by the end of FY14
• Top-tier countries to focus customization of web and social channels by country identified by 4/15/14 and customization completed by 6/15/14
• Underperforming channels identified and eliminated by 1/15/14
• Integrated dashboard of metrics mapping user experience through channels delivered by 12/15/13
7. Become a content channel that fosters and delivers highly engaging content (owned, shared, and syndicated) to partners and Brand USA owned channels.
• Develop content incentive program for influencers centered on ongoing promotions.
• Launch consumer user generated content campaign each quarter that focuses on content creation consolidation.
• Source and establish a partner for third party content that can be syndicated and localized to various U.S. markets.
• In-market influencer and user-generated content initiative launched by 11/1/13 and conducted three times per year thereafter
• Partner programs for country specific content development beyond current single offering launched by 12/15/13 with additional programs launched by 3/15/14
• Content value reporting dashboard built and launched by 12/15/13
• Education initiative to provide internal and partner understanding of content value launched by 10/15/13
• Media executions with content at the center launched by 4/15/14
• 25% increase in time on site and 10% increase in engagement with social content achieved by the end of FY14
• 20% reduction in bounce rate on website achieved by the end of FY14
Create Raving Fans of the USA
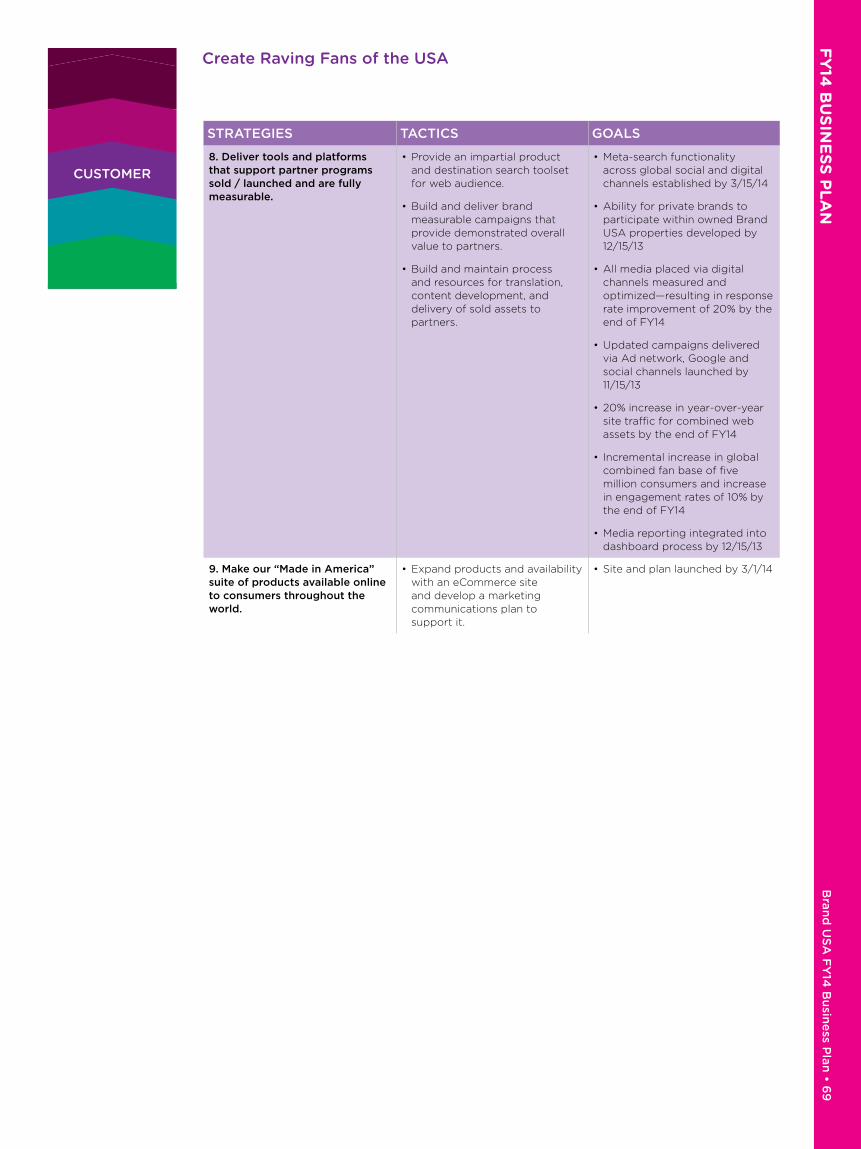
FY
14 B
US
INE
SS
PL
AN
B
rand
US
A F
Y14
Bu
sine
ss Plan
• 69
CUSTOMER
STRATEGIES TACTICS GOALS
8. Deliver tools and platforms that support partner programs sold / launched and are fully measurable.
• Provide an impartial product and destination search toolset for web audience.
• Build and deliver brand measurable campaigns that provide demonstrated overall value to partners.
• Build and maintain process and resources for translation, content development, and delivery of sold assets to partners.
• Meta-search functionality across global social and digital channels established by 3/15/14
• Ability for private brands to participate within owned Brand USA properties developed by 12/15/13
• All media placed via digital channels measured and optimized—resulting in response rate improvement of 20% by the end of FY14
• Updated campaigns delivered via Ad network, Google and social channels launched by 11/15/13
• 20% increase in year-over-year site traffic for combined web assets by the end of FY14
• Incremental increase in global combined fan base of five million consumers and increase in engagement rates of 10% by the end of FY14
• Media reporting integrated into dashboard process by 12/15/13
9. Make our “Made in America” suite of products available online to consumers throughout the world.
• Expand products and availability with an eCommerce site and develop a marketing communications plan to support it.
• Site and plan launched by 3/1/14
Create Raving Fans of the USA
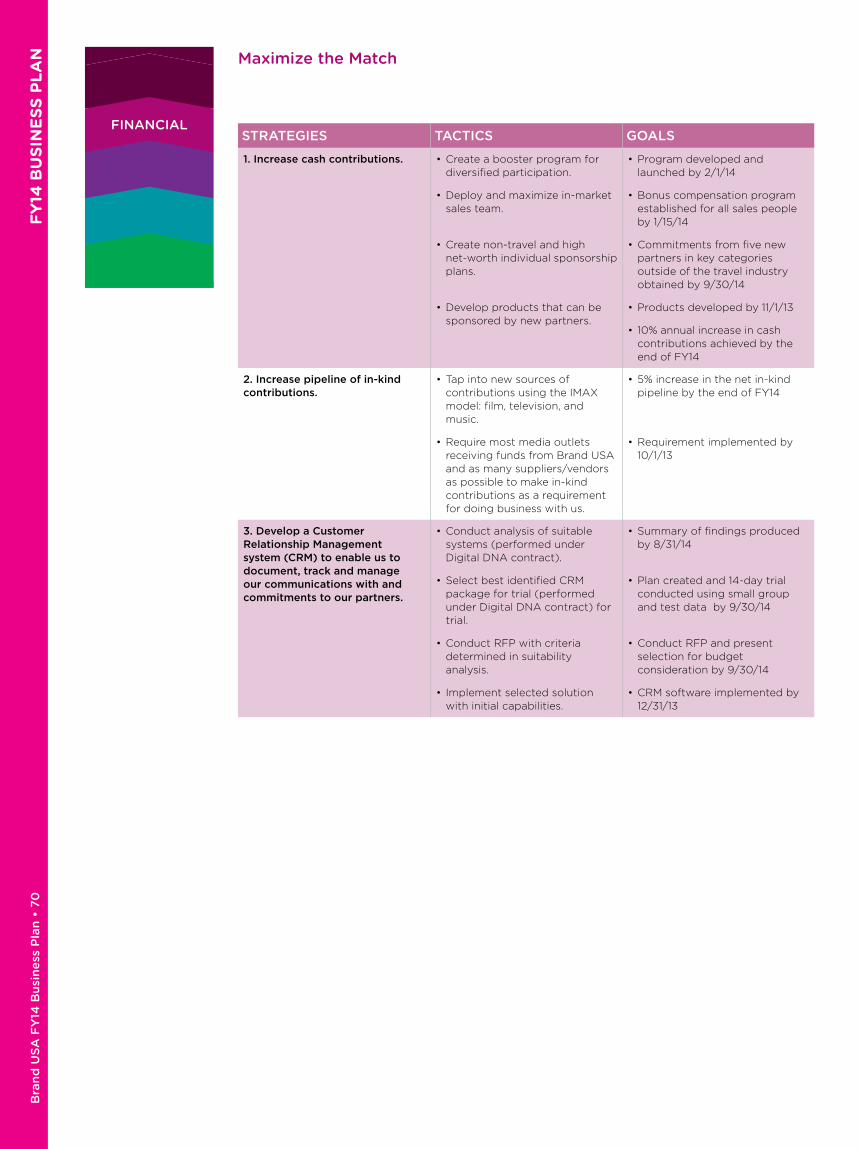
Bra
nd
US
A F
Y14
Bu
sin
ess
Pla
n •
70
F
Y14
BU
SIN
ES
S P
LA
N
FINANCIALSTRATEGIES TACTICS GOALS
1. Increase cash contributions. • Create a booster program for diversified participation.
• Deploy and maximize in-market sales team.
• Create non-travel and high net-worth individual sponsorship plans.
• Develop products that can be sponsored by new partners.
• Program developed and launched by 2/1/14
• Bonus compensation program established for all sales people by 1/15/14
• Commitments from five new partners in key categories outside of the travel industry obtained by 9/30/14
• Products developed by 11/1/13
• 10% annual increase in cash contributions achieved by the end of FY14
2. Increase pipeline of in-kind contributions.
• Tap into new sources of contributions using the IMAX model: film, television, and music.
• Require most media outlets receiving funds from Brand USA and as many suppliers/vendors as possible to make in-kind contributions as a requirement for doing business with us.
• 5% increase in the net in-kind pipeline by the end of FY14
• Requirement implemented by 10/1/13
3. Develop a Customer Relationship Management system (CRM) to enable us to document, track and manage our communications with and commitments to our partners.
• Conduct analysis of suitable systems (performed under Digital DNA contract).
• Select best identified CRM package for trial (performed under Digital DNA contract) for trial.
• Conduct RFP with criteria determined in suitability analysis.
• Implement selected solution with initial capabilities.
• Summary of findings produced by 8/31/14
• Plan created and 14-day trial conducted using small group and test data by 9/30/14
• Conduct RFP and present selection for budget consideration by 9/30/14
• CRM software implemented by 12/31/13
Maximize the Match
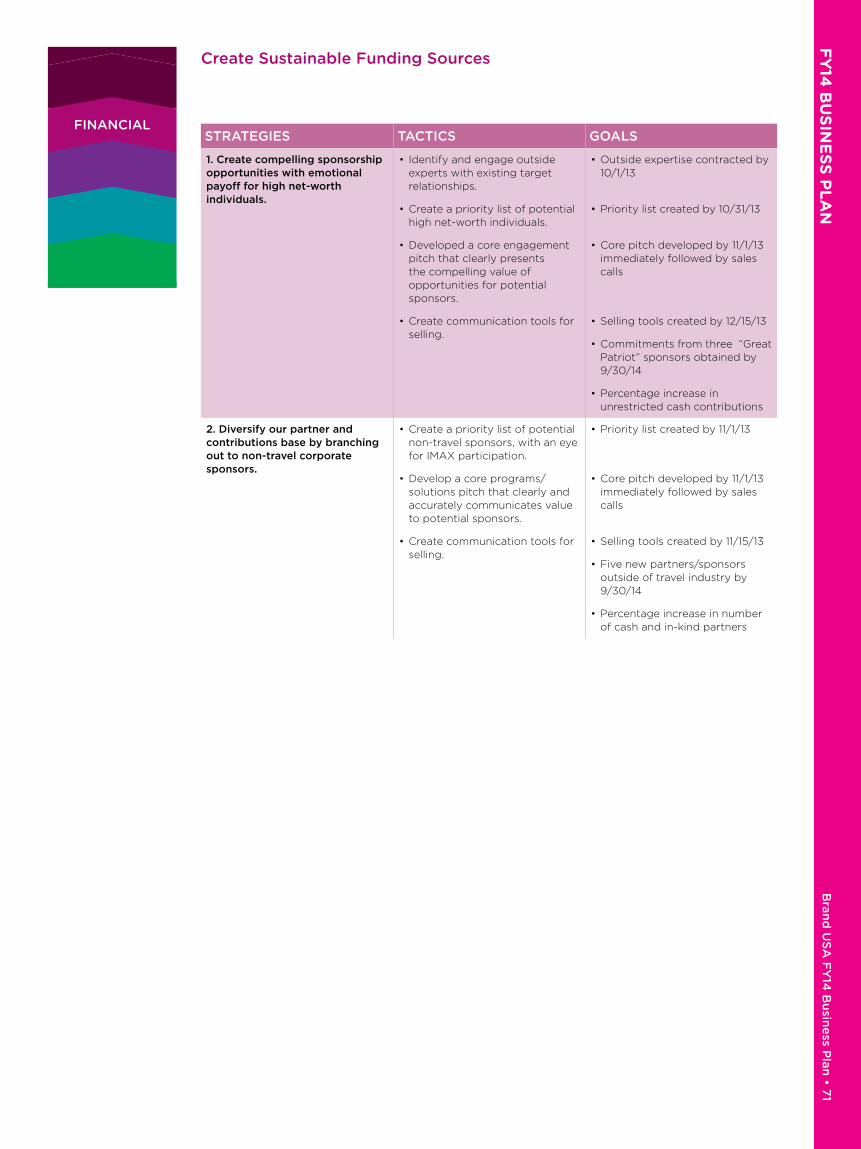
FY
14 B
US
INE
SS
PL
AN
B
rand
US
A F
Y14
Bu
sine
ss Plan
• 71
FINANCIALSTRATEGIES TACTICS GOALS
1. Create compelling sponsorship opportunities with emotional payoff for high net-worth individuals.
• Identify and engage outside experts with existing target relationships.
• Create a priority list of potential high net-worth individuals.
• Developed a core engagement pitch that clearly presents the compelling value of opportunities for potential sponsors.
• Create communication tools for selling.
• Outside expertise contracted by 10/1/13
• Priority list created by 10/31/13
• Core pitch developed by 11/1/13 immediately followed by sales calls
• Selling tools created by 12/15/13
• Commitments from three “Great Patriot” sponsors obtained by 9/30/14
• Percentage increase in unrestricted cash contributions
2. Diversify our partner and contributions base by branching out to non-travel corporate sponsors.
• Create a priority list of potential non-travel sponsors, with an eye for IMAX participation.
• Develop a core programs/solutions pitch that clearly and accurately communicates value to potential sponsors.
• Create communication tools for selling.
• Priority list created by 11/1/13
• Core pitch developed by 11/1/13 immediately followed by sales calls
• Selling tools created by 11/15/13
• Five new partners/sponsors outside of travel industry by 9/30/14
• Percentage increase in number of cash and in-kind partners
Create Sustainable Funding Sources
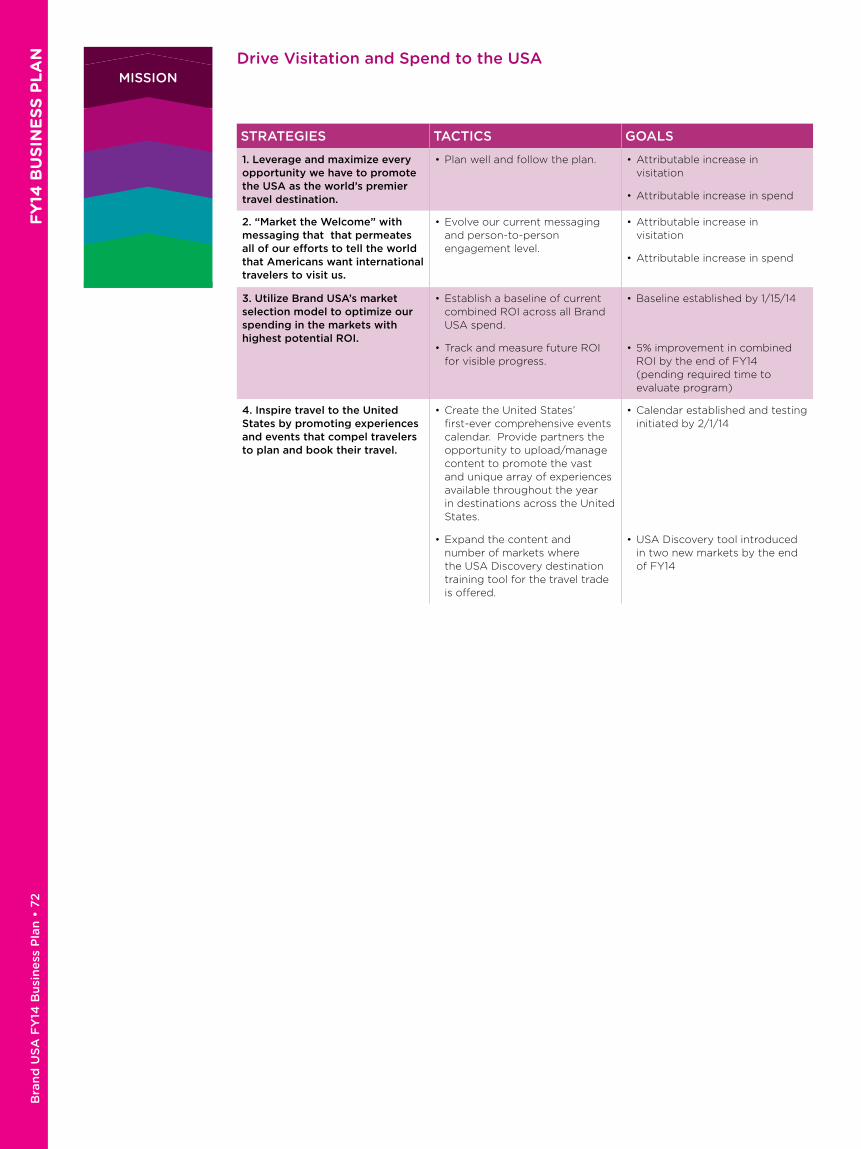
Bra
nd
US
A F
Y14
Bu
sin
ess
Pla
n •
72
F
Y14
BU
SIN
ES
S P
LA
N
MISSION
STRATEGIES TACTICS GOALS
1. Leverage and maximize every opportunity we have to promote the USA as the world’s premier travel destination.
• Plan well and follow the plan. • Attributable increase in visitation
• Attributable increase in spend
2. “Market the Welcome” with messaging that that permeates all of our efforts to tell the world that Americans want international travelers to visit us.
• Evolve our current messaging and person-to-person engagement level.
• Attributable increase in visitation
• Attributable increase in spend
3. Utilize Brand USA’s market selection model to optimize our spending in the markets with highest potential ROI.
• Establish a baseline of current combined ROI across all Brand USA spend.
• Track and measure future ROI for visible progress.
• Baseline established by 1/15/14
• 5% improvement in combined ROI by the end of FY14 (pending required time to evaluate program)
4. Inspire travel to the United States by promoting experiences and events that compel travelers to plan and book their travel.
• Create the United States’ first-ever comprehensive events calendar. Provide partners the opportunity to upload/manage content to promote the vast and unique array of experiences available throughout the year in destinations across the United States.
• Expand the content and number of markets where the USA Discovery destination training tool for the travel trade is offered.
• Calendar established and testing initiated by 2/1/14
• USA Discovery tool introduced in two new markets by the end of FY14
Drive Visitation and Spend to the USA

Market Profiles

Bra
nd
US
A F
Y14
Bu
sin
ess
Pla
n •
74
M
AR
KE
T P
RO
FIL
ES
Source: Brand USA Proprietary Research unless otherwise noted.
Market Profile: AustraliaTop 5 Motivations for Selecting Last Intercontinental Destination
Motivation % Selected
Cultural Historical Attractions 62%
Local Lifestyle 58%
Shopping 47%
Visiting Friends and Relatives 40%
Dining/Gastronomy 39%
Top 5 Strongest Impressions of the USA
Impression % Selected
Diverse 62%
Friendly 58%
Adventurous 47%
Energetic 40%
Trendy 39%
Question: What motivates your desire to visit that destination? Select all that apply. For each of the following countries, select which characteristics, if any, describe it as a holiday destina-
tion. Select all that apply.
Destination Decision and Air Booking Windows for Next Intercontinental Trip
DESTINATION DECISION AIR BOOKING
Question: How far in advance of your departure date did/will you decide on the destination? Please select one answer for each of the following questions. How far in advance of your
departure date did/will you book the travel products for this holiday? Select one option from the drop-down box
More than one year
6 to 12 months
3 to 5 months
1 to 2 months
3 to 4 weeks
1 to 2 week
2 to 6 days
1 day or less
I did/will not research/decide in advance
1%
2%
3%
5%
10%
10%
26%
41%
More than one year
6 to 12 months
3 to 5 months
1 to 2 months
3 to 4 weeks�
1 to 2 week�
2 to 6 days
I did/will not research/decide in advance 1%
2%
7%
10%
24%
35%
19%
1%
United States of AmericaUnited Kingdom
Canada
Spain
ItalyBrazil
Singapore
Indonesia
Ireland
Vietnam
MalaysiaIndia
Portugal
Mexico
Argentina
Austria
PeruAfrica
South Africa
Egypt NewZealand
Switzerland
New ZealandJapan
ThailandGermany Greece
ChinaFrance
Top 5 Channels Used in Destination Selection for Last Intercontinental Trip
Channels % Selected
Websites via Computer or Laptop
66%
Personal Recommendations from Family and Friends
42%
Information in Printed Travel Guidebooks
27%
Personal advice from travel professionals/travel agents
26%
Printed publications, articles and brochures
25%
Question: What sources of information did/will you use to select the destination for this
holiday? Select all that apply.
2012 Arrivals 2012 Spending
1.12 million $5.4 billion
+8% v 2011 +10% v 2011
Rank: 10 Rank: 8
U.S. Department of Commerce, Office of Travel and Tourism Industries (OTTI)
Countries travelers from Australia would most like to visit
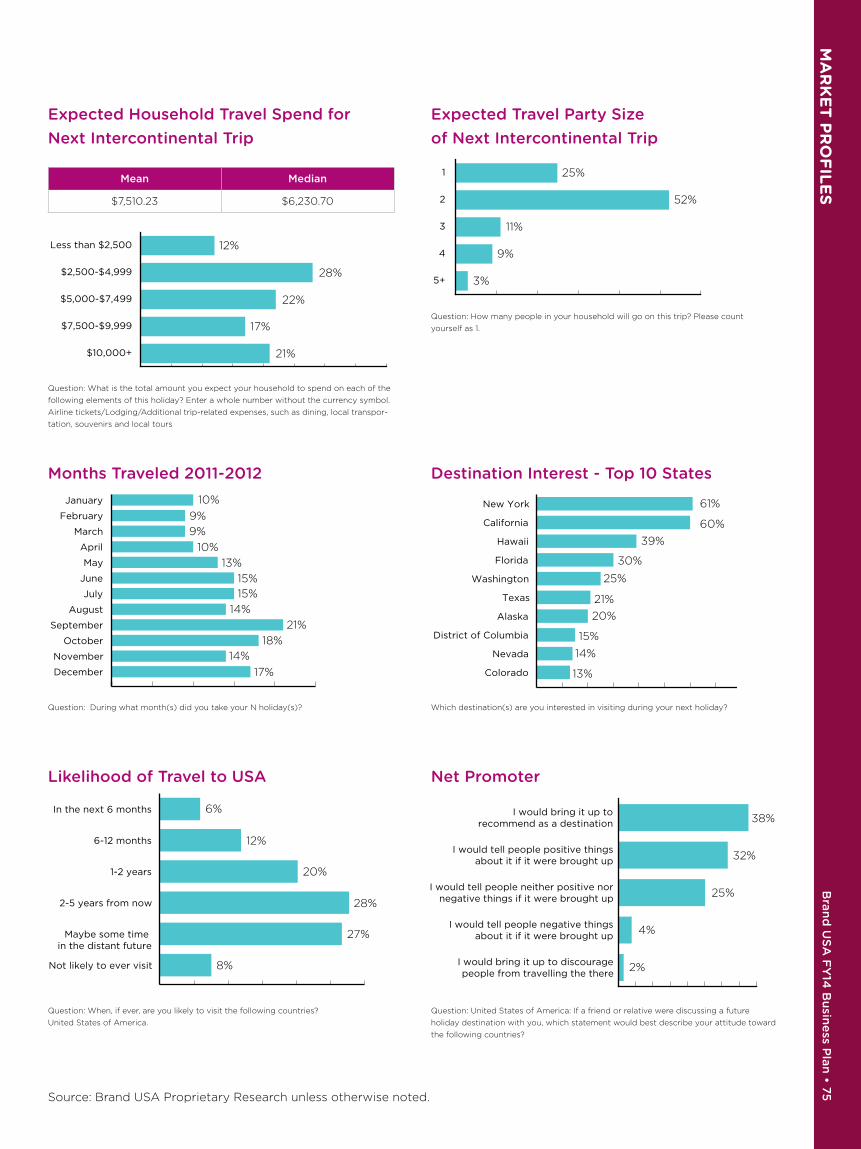
MA
RK
ET
PR
OF
ILE
S
Bran
d U
SA
FY
14 B
usin
ess P
lan • 75
Source: Brand USA Proprietary Research unless otherwise noted.
Expected Household Travel Spend for Next Intercontinental Trip
Mean Median
$7,510.23 $6,230.70
Question: What is the total amount you expect your household to spend on each of the
following elements of this holiday? Enter a whole number without the currency symbol.
Airline tickets/Lodging/Additional trip-related expenses, such as dining, local transpor-
tation, souvenirs and local tours
Expected Travel Party Size of Next Intercontinental Trip
Question: How many people in your household will go on this trip? Please count
yourself as 1.
Months Traveled 2011-2012
Question: During what month(s) did you take your N holiday(s)?
Likelihood of Travel to USA
Question: When, if ever, are you likely to visit the following countries?
United States of America.
Destination Interest - Top 10 States
Which destination(s) are you interested in visiting during your next holiday?
Net Promoter
Question: United States of America: If a friend or relative were discussing a future
holiday destination with you, which statement would best describe your attitude toward
the following countries?
12%
28%
22%
17%
21%$10,000+
$7,500-$9,999
$5,000-$7,499
$2,500-$4,999
Less than $2,500
25%
52%
11%
9%
3%5+
4
3
2
1
10%
9%
9%
10%
13%
15%15%
14%
21%
18%
14%
17%December
November
October
September
August
July
June
May
April
March
February
January
6%
12%
20%
28%
27%
8%Not likely to ever visit
Maybe some time in the distant future
2-5 years from now
1-2 years
6-12 months
In the next 6 months
Colorado
Nevada
District of Columbia
Alaska
Texas
Washington
Florida
Hawaii
California
New York 61%
60%
39%
30%
25%
21%
20%
15%
14%
13%
38%
32%
25%
4%
2%I would bring it up to discouragepeople from travelling the there
I would tell people negative thingsabout it if it were brought up
I would tell people neither positive nornegative things if it were brought up
I would tell people positive thingsabout it if it were brought up
I would bring it up torecommend as a destination

Bra
nd
US
A F
Y14
Bu
sin
ess
Pla
n •
76
M
AR
KE
T P
RO
FIL
ES
Source: Brand USA Proprietary Research unless otherwise noted.
Market Profile: BrazilTop 5 Motivations for Selecting Last Intercontinental Destination
Motivation % Selected
Urban attractions 48%
Shopping 43%
Dining/gastronomy 42%
Historical/archaeological attractions
42%
Theme parks 36%
Top 5 Strongest Impressions of the USA
Impression % Selected
Trendy 65%
Sophisticated 49%
Diverse 47%
Energetic 40%
Adventurous 38%
Question: What motivates your desire to visit that destination? Select all that apply. For each of the following countries, select which characteristics, if any, describe it as a holiday destina-
tion. Select all that apply.
Destination Decision and Air Booking Windows for Next Intercontinental Trip
DESTINATION DECISION AIR BOOKING
Question: How far in advance of your departure date did/will you decide on the destination? Please select one answer for each of the following questions. How far in advance of your
departure date did/will you book the travel products for this holiday? Select one option from the drop-down box
3%
2%
9%
8%
10%
14%
6%
25%
23%
More than one year
6 to 12 months
3 to 5 months
1 to 2 months
3 to 4 weeks�
1 to 2 week�
2 to 6 days
1 day or less
I did/will not research/decide in advance
1%
2%
5%
8%
19%
2%
37%
26%
More than one year
6 to 12 months
3 to 5 months
1 to 2 months
3 to 4 weeks�
1 to 2 week�
2 to 6 days
I did/will not research/decide in advance
Top 5 Channels Used in Destination Selection for Last Intercontinental Trip
Channels % Selected
Personal recommendations from friends/family
42%
Websites via computer 39%
Printed publications, articles or brochures
37%
Information in printed travel guidebooks
24%
Online advertising/email 24%
Question: What sources of information did/will you use to select the destination for this
holiday? Select all that apply.
Countries travelers from Brazil would most like to visit
United States of AmericaFrance Mexico
Argentina
PortugalGermany
GreeceEgypt
New Zealand China
HollandSouth Africa
United Arab Emirates
PeruSpain
CanadaUruguay
IrelandChileJapanCaribbeanSwitzerland
Turkey
ItalyUnited KingdomAustralia
2012 Arrivals 2012 Spending
1.79 million $9.3 billion
+19% v 2011 +11% v 2011
Rank: 6 Rank: 5
U.S. Department of Commerce, Office of Travel and Tourism Industries (OTTI)
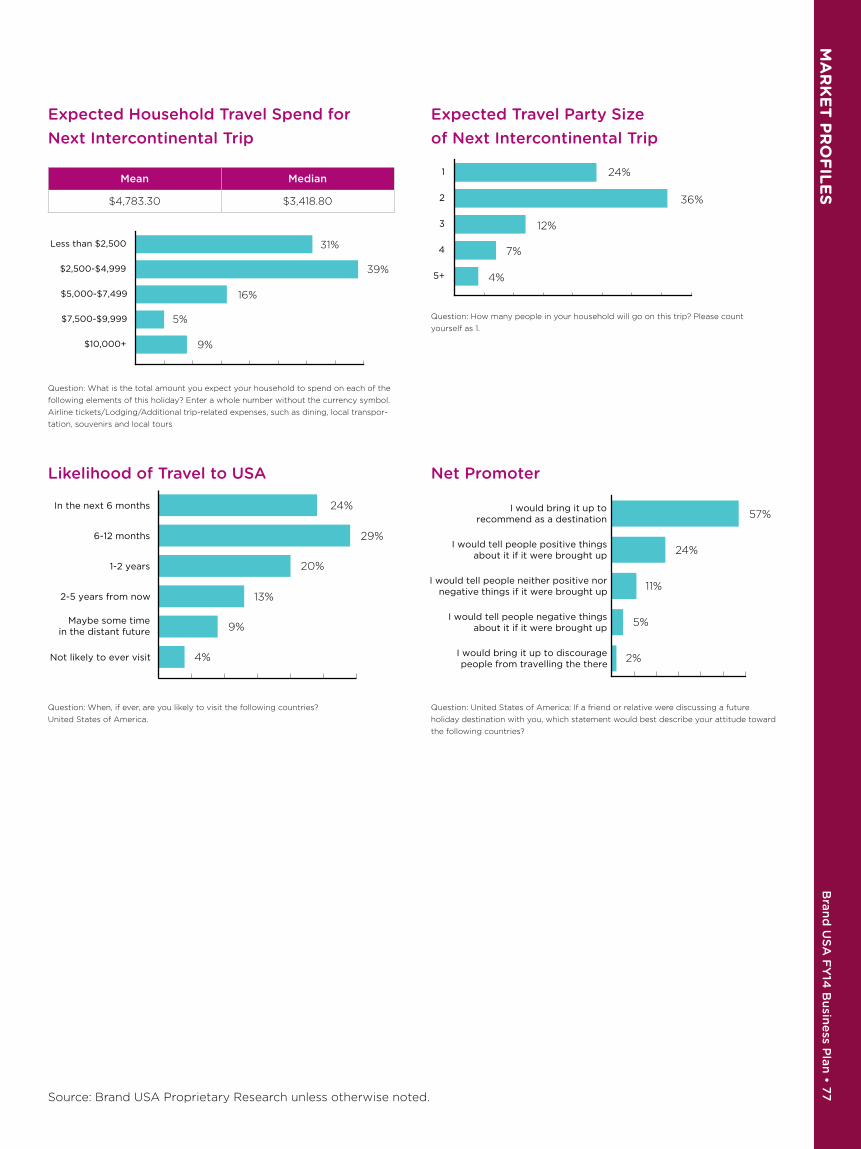
MA
RK
ET
PR
OF
ILE
S
Bran
d U
SA
FY
14 B
usin
ess P
lan • 7
7
Source: Brand USA Proprietary Research unless otherwise noted.
Expected Household Travel Spend for Next Intercontinental Trip
Mean Median
$4,783.30 $3,418.80
Question: What is the total amount you expect your household to spend on each of the
following elements of this holiday? Enter a whole number without the currency symbol.
Airline tickets/Lodging/Additional trip-related expenses, such as dining, local transpor-
tation, souvenirs and local tours
Expected Travel Party Size of Next Intercontinental Trip
Question: How many people in your household will go on this trip? Please count
yourself as 1.
Likelihood of Travel to USA
Question: When, if ever, are you likely to visit the following countries?
United States of America.
Net Promoter
Question: United States of America: If a friend or relative were discussing a future
holiday destination with you, which statement would best describe your attitude toward
the following countries?
5%
9%
16%
39%
31%
$10,000+
$7,500-$9,999
$5,000-$7,499
$2,500-$4,999
Less than $2,500
24%
7%
4%
12%
36%
5+
4
3
2
1
24%
29%
20%
13%
9%
4%Not likely to ever visit
Maybe some timein the distant future
2-5 years from now
1-2 years
6-12 months
In the next 6 months57%
24%
11%
5%
2%I would bring it up to discouragepeople from travelling the there
I would tell people negative thingsabout it if it were brought up
I would tell people neither positive nornegative things if it were brought up
I would tell people positive thingsabout it if it were brought up
I would bring it up torecommend as a destination
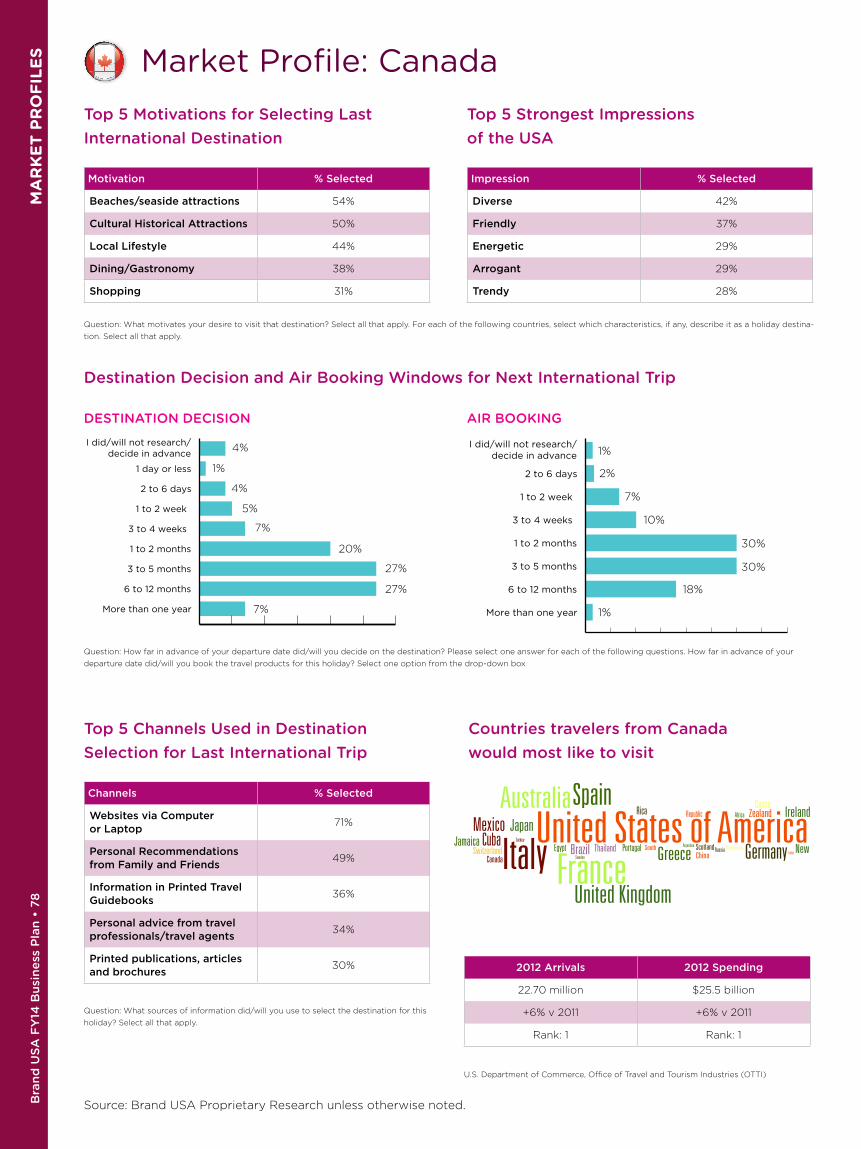
Bra
nd
US
A F
Y14
Bu
sin
ess
Pla
n •
78
M
AR
KE
T P
RO
FIL
ES
Source: Brand USA Proprietary Research unless otherwise noted.
Market Profile: CanadaTop 5 Motivations for Selecting Last International Destination
Motivation % Selected
Beaches/seaside attractions 54%
Cultural Historical Attractions 50%
Local Lifestyle 44%
Dining/Gastronomy 38%
Shopping 31%
Top 5 Strongest Impressions of the USA
Impression % Selected
Diverse 42%
Friendly 37%
Energetic 29%
Arrogant 29%
Trendy 28%
Question: What motivates your desire to visit that destination? Select all that apply. For each of the following countries, select which characteristics, if any, describe it as a holiday destina-
tion. Select all that apply.
Destination Decision and Air Booking Windows for Next International Trip
DESTINATION DECISION AIR BOOKING
Question: How far in advance of your departure date did/will you decide on the destination? Please select one answer for each of the following questions. How far in advance of your
departure date did/will you book the travel products for this holiday? Select one option from the drop-down box
More than one year
6 to 12 months
3 to 5 months
1 to 2 months
3 to 4 weeks�
1 to 2 week�
2 to 6 days
1 day or less
I did/will not research/decide in advance
4%
1%
4%
5%
7%
20%
7%
27%
27%
More than one year
6 to 12 months
3 to 5 months
1 to 2 months
3 to 4 weeks�
1 to 2 week�
2 to 6 days
I did/will not research/decide in advance 1%
1%
2%
7%
10%
30%
30%
18%
Top 5 Channels Used in Destination Selection for Last International Trip
Channels % Selected
Websites via Computer or Laptop
71%
Personal Recommendations from Family and Friends
49%
Information in Printed Travel Guidebooks
36%
Personal advice from travel professionals/travel agents
34%
Printed publications, articles and brochures
30%
Question: What sources of information did/will you use to select the destination for this
holiday? Select all that apply.
United States of AmericaFrance
MexicoCuba
GermanyGreeceArgentina
Zealand
ChinaSouth
Costa
Dominican
AfricaRica
ScotlandRussia
Republic
Jamaica
Spain
Egypt PortugalThailandBrazilCanada
Turkey
Sweden
Ireland
NewIndia
Japan
SwitzerlandItalyUnited Kingdom
Australia
2012 Arrivals 2012 Spending
22.70 million $25.5 billion
+6% v 2011 +6% v 2011
Rank: 1 Rank: 1
U.S. Department of Commerce, Office of Travel and Tourism Industries (OTTI)
Countries travelers from Canada would most like to visit
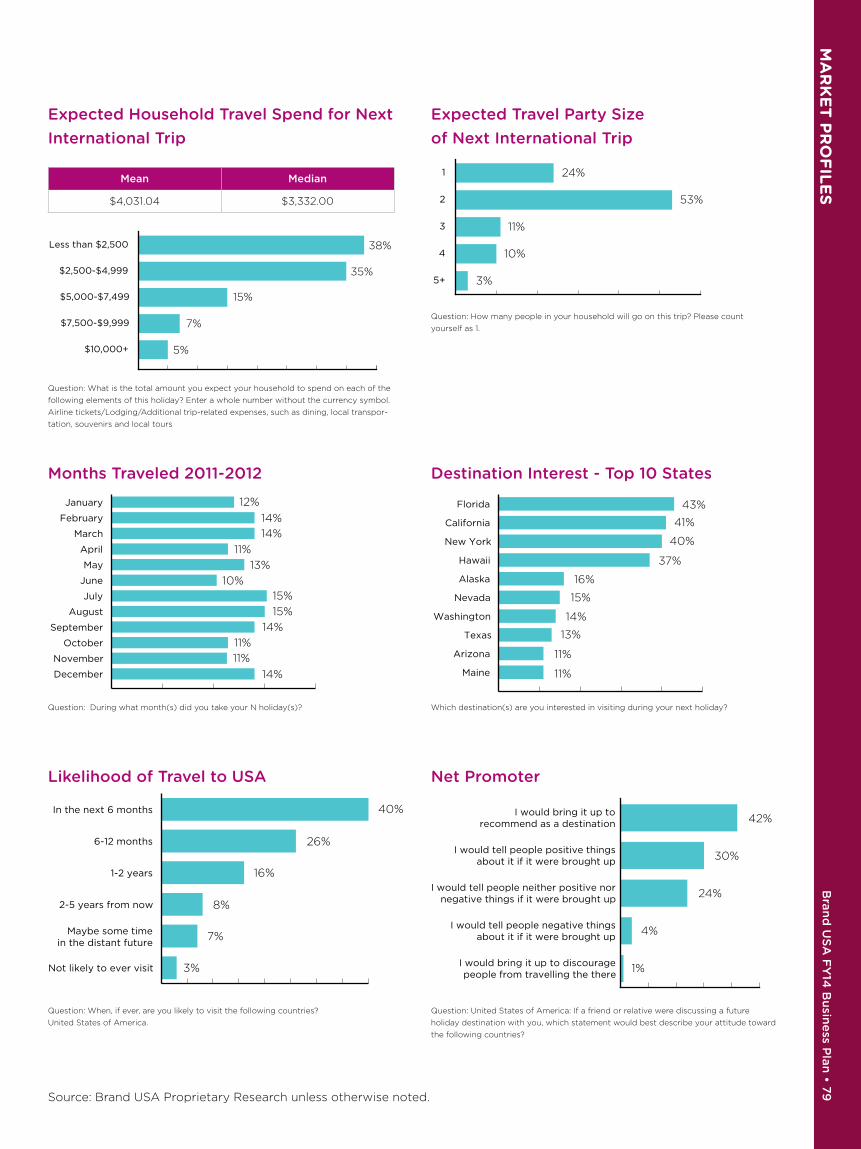
MA
RK
ET
PR
OF
ILE
S
Bran
d U
SA
FY
14 B
usin
ess P
lan • 79
Source: Brand USA Proprietary Research unless otherwise noted.
Expected Household Travel Spend for Next International Trip
Mean Median
$4,031.04 $3,332.00
Question: What is the total amount you expect your household to spend on each of the
following elements of this holiday? Enter a whole number without the currency symbol.
Airline tickets/Lodging/Additional trip-related expenses, such as dining, local transpor-
tation, souvenirs and local tours
Expected Travel Party Size of Next International Trip
Question: How many people in your household will go on this trip? Please count
yourself as 1.
Months Traveled 2011-2012
Question: During what month(s) did you take your N holiday(s)?
Likelihood of Travel to USA
Question: When, if ever, are you likely to visit the following countries?
United States of America.
Destination Interest - Top 10 States
Which destination(s) are you interested in visiting during your next holiday?
Net Promoter
Question: United States of America: If a friend or relative were discussing a future
holiday destination with you, which statement would best describe your attitude toward
the following countries?
$10,000+
$7,500-$9,999
$5,000-$7,499
$2,500-$4,999
Less than $2,500 38%
35%
15%
7%
5%
24%
53%
11%
10%
3%5+
4
3
2
1
December
November
October
September
August
July
June
May
April
March
February
January 12%
14%
14%
11%
13%
10%15%
15%
14%
11%
11%
14%
40%
26%
16%
8%
7%
3%Not likely to ever visit
Maybe some timein the distant future
2-5 years from now
1-2 years
6-12 months
In the next 6 months
43%
41%
40%
37%
16%
15%
14%
13%
11%
11%Maine
Arizona
Texas
Washington
Nevada
Alaska
Hawaii
New York
California
Florida
42%
30%
24%
4%
1%I would bring it up to discouragepeople from travelling the there
I would tell people negative thingsabout it if it were brought up
I would tell people neither positive nornegative things if it were brought up
I would tell people positive thingsabout it if it were brought up
I would bring it up torecommend as a destination

Bra
nd
US
A F
Y14
Bu
sin
ess
Pla
n •
80
M
AR
KE
T P
RO
FIL
ES
Source: Brand USA Proprietary Research unless otherwise noted.
Market Profile: ChinaTop 5 Motivations for Selecting Last Intercontinental Destination
Motivation % Selected
Ecotourism and nature 70%
Cultural Historical Attractions 62%
Beaches/seaside attractions 60%
Urban attractions (Nightlife, City tours)
59%
Dining/Gastronomy 55%
Top 5 Strongest Impressions of the USA
Impression % Selected
Diverse 52%
Energetic 49%
Open-minded 49%
Creative 43%
Trendy 35%
Question: What motivates your desire to visit that destination? Select all that apply. For each of the following countries, select which characteristics, if any, describe it as a holiday destina-
tion. Select all that apply.
Destination Decision and Air Booking Windows for Next Intercontinental Trip
DESTINATION DECISION AIR BOOKING
Question: How far in advance of your departure date did/will you decide on the destination? Please select one answer for each of the following questions. How far in advance of your
departure date did/will you book the travel products for this holiday? Select one option from the drop-down box
More than one year
6 to 12 months
3 to 5 months
1 to 2 months
3 to 4 weeks�
1 to 2 week�
2 to 6 days
1 day or less
I did/will not research/decide in advance 1%
2%
10%
18%
17%
30%
0%
16%
5%
More than one year
6 to 12 months
3 to 5 months
1 to 2 months
3 to 4 weeks�
1 to 2 week�
2 to 6 days
I did/will not research/decide in advance
1%
16%
28%
22%
24%
0%
7%
2%
Top 5 Channels Used in Destination Selection for Last Intercontinental Trip
Channels % Selected
Websites via Computer or Laptop
66%
Personal Recommendations from Family and Friends
53%
Websites or applications via tablet
42%
Personal advice from travel professionals/travel agents
43%
Websites or applications via mobile phone
34%
Question: What sources of information did/will you use to select the destination for this
holiday? Select all that apply.
Countries travelers from China would most like to visit
United States of AmericaFrance
GermanyGreece
KoreaSpain Egypt
BrazilMalaysiaHong Kong
Canada
JapanSingapore
New ZealandSwitzerland Thailand
Italy
AustraliaUnited Kingdom
2012 Arrivals 2012 Spending
1.47 million $8.8 billion
+35% v 2011 +14% v 2011
Rank: 7 Rank: 6
U.S. Department of Commerce, Office of Travel and Tourism Industries (OTTI)
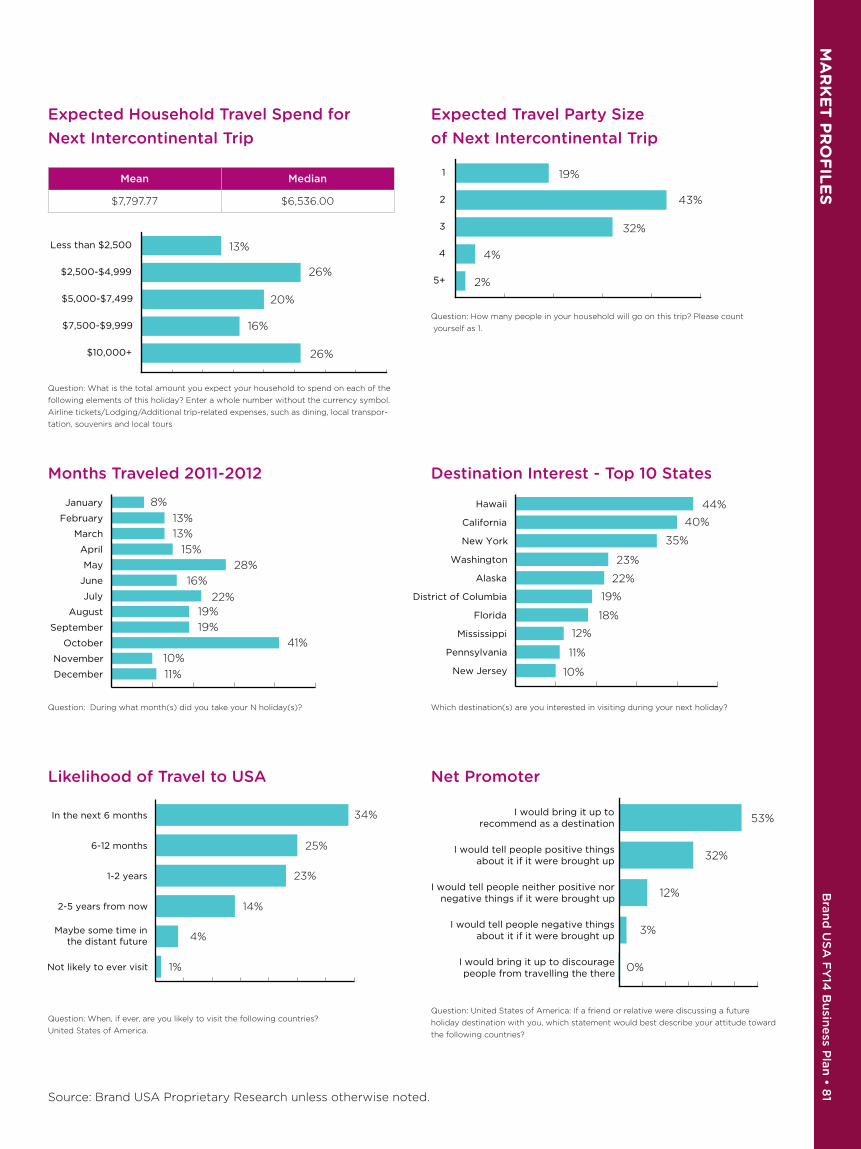
MA
RK
ET
PR
OF
ILE
S
Bran
d U
SA
FY
14 B
usin
ess P
lan • 8
1Source: Brand USA Proprietary Research unless otherwise noted.
Expected Household Travel Spend for Next Intercontinental Trip
Mean Median
$7,797.77 $6,536.00
Question: What is the total amount you expect your household to spend on each of the
following elements of this holiday? Enter a whole number without the currency symbol.
Airline tickets/Lodging/Additional trip-related expenses, such as dining, local transpor-
tation, souvenirs and local tours
Expected Travel Party Size of Next Intercontinental Trip
Question: How many people in your household will go on this trip? Please count
yourself as 1.
Months Traveled 2011-2012
Question: During what month(s) did you take your N holiday(s)?
Likelihood of Travel to USA
Question: When, if ever, are you likely to visit the following countries?
United States of America.
Destination Interest - Top 10 States
Which destination(s) are you interested in visiting during your next holiday?
Net Promoter
Question: United States of America: If a friend or relative were discussing a future
holiday destination with you, which statement would best describe your attitude toward
the following countries?
13%
16%
26%
20%
26%
$10,000+
$7,500-$9,999
$5,000-$7,499
$2,500-$4,999
Less than $2,500
19%
4%
2%
32%
43%
5+
4
3
2
1
8%
13%
13%
15%
28%
16%
22%19%
19%
41%
10%
11%December
November
October
September
August
July
June
May
April
March
February
January
34%
25%
23%
14%
4%
1%Not likely to ever visit
Maybe some time inthe distant future
2-5 years from now
1-2 years
6-12 months
In the next 6 months
44%
40%
35%
23%
22%
19%
18%
12%
11%
10%New Jersey
Pennsylvania
Mississippi
Florida
District of Columbia
Alaska
Washington
New York
California
Hawaii
53%
32%
12%
3%
0%I would bring it up to discouragepeople from travelling the there
I would tell people negative thingsabout it if it were brought up
I would tell people neither positive nornegative things if it were brought up
I would tell people positive thingsabout it if it were brought up
I would bring it up torecommend as a destination
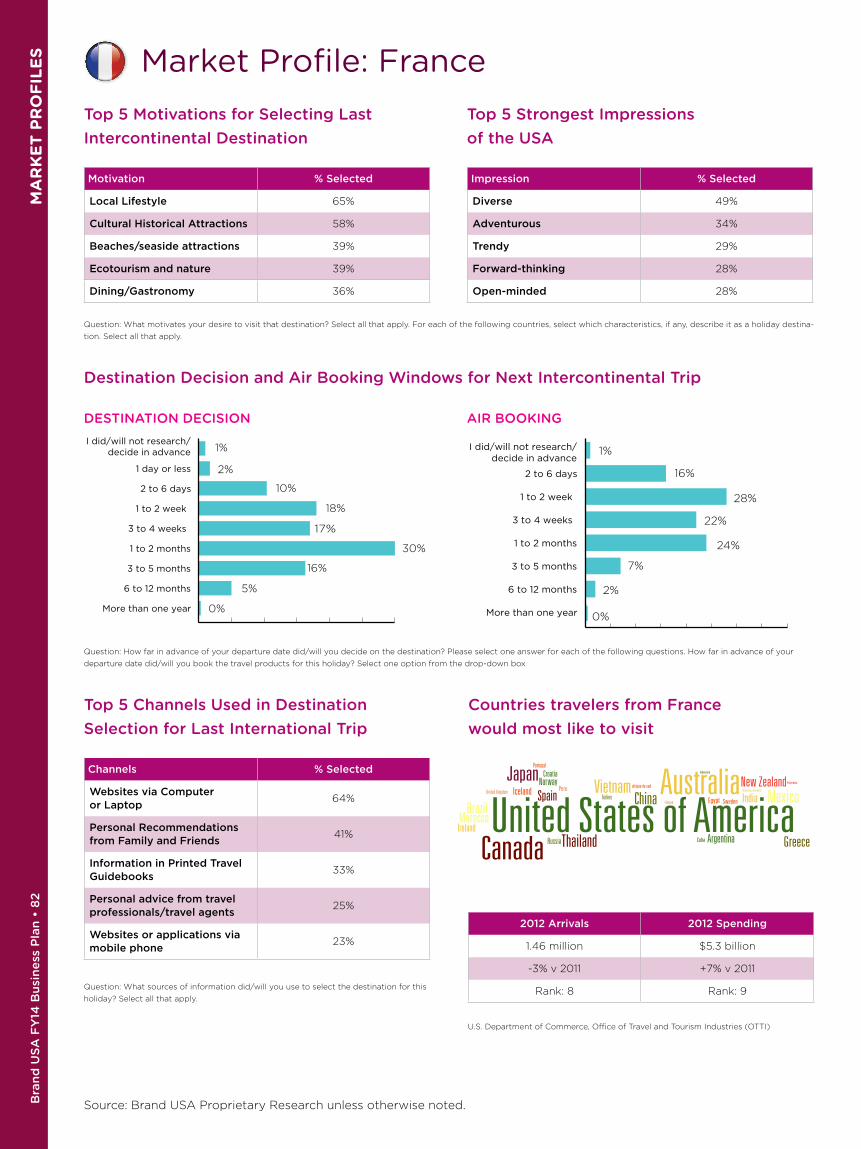
Bra
nd
US
A F
Y14
Bu
sin
ess
Pla
n •
82
M
AR
KE
T P
RO
FIL
ES
Source: Brand USA Proprietary Research unless otherwise noted.
Market Profile: FranceTop 5 Motivations for Selecting Last Intercontinental Destination
Motivation % Selected
Local Lifestyle 65%
Cultural Historical Attractions 58%
Beaches/seaside attractions 39%
Ecotourism and nature 39%
Dining/Gastronomy 36%
Top 5 Strongest Impressions of the USA
Impression % Selected
Diverse 49%
Adventurous 34%
Trendy 29%
Forward-thinking 28%
Open-minded 28%
Question: What motivates your desire to visit that destination? Select all that apply. For each of the following countries, select which characteristics, if any, describe it as a holiday destina-
tion. Select all that apply.
Destination Decision and Air Booking Windows for Next Intercontinental Trip
DESTINATION DECISION AIR BOOKING
Question: How far in advance of your departure date did/will you decide on the destination? Please select one answer for each of the following questions. How far in advance of your
departure date did/will you book the travel products for this holiday? Select one option from the drop-down box
More than one year
6 to 12 months
3 to 5 months
1 to 2 months
3 to 4 weeks�
1 to 2 week�
2 to 6 days
1 day or less
I did/will not research/decide in advance 1%
2%
10%
18%
17%
30%
0%
16%
5%
More than one year
6 to 12 months
3 to 5 months
1 to 2 months
3 to 4 weeks�
1 to 2 week�
2 to 6 days
I did/will not research/decide in advance
1%
16%
28%
22%
24%
0%
7%
2%
Top 5 Channels Used in Destination Selection for Last International Trip
Channels % Selected
Websites via Computer or Laptop
64%
Personal Recommendations from Family and Friends
41%
Information in Printed Travel Guidebooks
33%
Personal advice from travel professionals/travel agents
25%
Websites or applications via mobile phone
23%
Question: What sources of information did/will you use to select the destination for this
holiday? Select all that apply.
Countries travelers from France would most like to visit
United States of AmericaPeru
Finland
Cuba
Dominican Republic
Polynesia
Egypt Sweden
Greece
Iceland
Portugal
afrique du sud
Spain
Canada
Japan Croatia
Russia
Turkey
IrelandMorocco
Brazil
Norway New ZealandMexicoIndia
ArgentinaThailand
VietnamChina
AustraliaUnited Kingdom
Indonesia
2012 Arrivals 2012 Spending
1.46 million $5.3 billion
-3% v 2011 +7% v 2011
Rank: 8 Rank: 9
U.S. Department of Commerce, Office of Travel and Tourism Industries (OTTI)

MA
RK
ET
PR
OF
ILE
S
Bran
d U
SA
FY
14 B
usin
ess P
lan • 8
3
Source: Brand USA Proprietary Research unless otherwise noted.
Expected Household Travel Spend for Next Intercontinental Trip
Mean Median
$4,513.54 $3,749.20
Question: What is the total amount you expect your household to spend on each of the
following elements of this holiday? Enter a whole number without the currency symbol.
Airline tickets/Lodging/Additional trip-related expenses, such as dining, local transpor-
tation, souvenirs and local tours
Expected Travel Party Size of Next Intercontinental Trip
Question: How many people in your household will go on this trip? Please count
yourself as 1.
Months Traveled 2011-2012
Question: During what month(s) did you take your N holiday(s)?
Likelihood of Travel to USA
Question: When, if ever, are you likely to visit the following countries?
United States of America.
Destination Interest - Top 10 States
Which destination(s) are you interested in visiting during your next holiday?
Net Promoter
Question: United States of America: If a friend or relative were discussing a future
holiday destination with you, which statement would best describe your attitude toward
the following countries?
27%
7%
6%
20%
39%
$10,000+
$7,500-$9,999
$5,000-$7,499
$2,500-$4,999
Less than $2,500
19%
11%
3%
11%
57%
5+
4
3
2
1
5%
9%
7%
14%15%
16%
24%28%
18%
12%
8%
8%December
November
October
September
August
July
June
May
April
March
February
January
5%
11%
19%
29%
29%
7%Not likely to ever visit
Maybe some time inthe distant future
2-5 years from now
1-2 years
6-12 months
In the next 6 months
55%
54%
39%
25%
23%
21%
19%
18%
15%
14%New Jersey
Pennsylvania
Mississippi
Florida
District of Columbia
Alaska
Washington
New York
California
Hawaii
41%
26%
28%
4%
1%I would bring it up to discouragepeople from travelling the there
I would tell people negative thingsabout it if it were brought up
I would tell people neither positive nornegative things if it were brought up
I would tell people positive thingsabout it if it were brought up
I would bring it up torecommend as a destination

Bra
nd
US
A F
Y14
Bu
sin
ess
Pla
n •
84
M
AR
KE
T P
RO
FIL
ES
Source: Brand USA Proprietary Research unless otherwise noted.
Market Profile: GermanyTop 5 Motivations for Selecting Last Intercontinental Destination
Motivation % Selected
Cultural Historical Attractions 42%
Ecotourism and nature 38%
Urban attractions (nightlife, city tours)
36%
Shopping 33%
Local lifestyle 30%
Top 5 Strongest Impressions of the USA
Impression % Selected
Diverse 59%
Adventurous 49%
Forward-thinking 33%
Friendly 33%
Trendy 31%
Question: What motivates your desire to visit that destination? Select all that apply. For each of the following countries, select which characteristics, if any, describe it as a holiday destina-
tion. Select all that apply.
Destination Decision and Air Booking Windows for Next Intercontinental Trip
DESTINATION DECISION AIR BOOKING
Question: How far in advance of your departure date did/will you decide on the destination? Please select one answer for each of the following questions. How far in advance of your
departure date did/will you book the travel products for this holiday? Select one option from the drop-down box
More than one year
6 to 12 months
3 to 5 months
1 to 2 months
3 to 4 weeks�
1 to 2 week�
2 to 6 days
1 day or less
I did/will not research/decide in advance 3%
1%
3%
5%
6%
13%
9%
32%
28%
1%
4%
6%
12%
23%
1%
34%
19%
More than one year
6 to 12 months
3 to 5 months
1 to 2 months
3 to 4 weeks�
1 to 2 week�
2 to 6 days
I did/will not research/decide in advance
Top 5 Channels Used in Destination Selection for Last Intercontinental Trip
Channels % Selected
Websites via Computer or Laptop
62%
Personal Recommendations from Family and Friends
42%
Information in Printed Travel Guidebooks
41%
Personal advice from travel professionals/travel agents
29%
Online Advertising/Email 14%
Question: What sources of information did/will you use to select the destination for this
holiday? Select all that apply.
Countries travelers from Germany would most like to visit
United States of AmericaAustralia
Canada New ZealandSpain
ItalyTurkey
Sweden Cuba Ireland
Egypt
JapanFrance
Mexico
ThailandUnited Kingdom GreenlandBrazil
CaribbeanRussia
Austria
Croatia ArgentinaIceland India
Portugal NorwaySwitzerland Monacco
South AfricaChinaDominican Republic
2012 Arrivals 2012 Spending
1.88 million $6.9 billion
+3% v 2011 +10% v 2011
Rank: 5 Rank: 7
U.S. Department of Commerce, Office of Travel and Tourism Industries (OTTI)
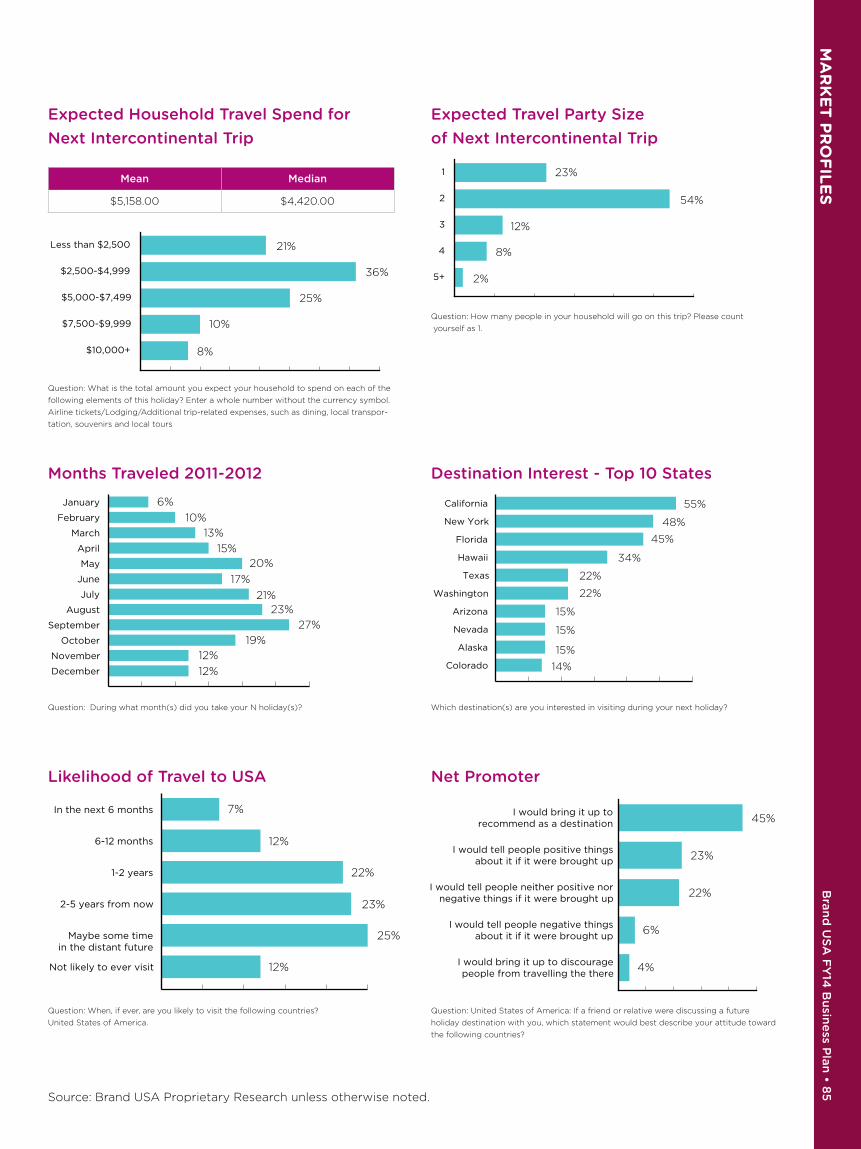
MA
RK
ET
PR
OF
ILE
S
Bran
d U
SA
FY
14 B
usin
ess P
lan • 8
5
Source: Brand USA Proprietary Research unless otherwise noted.
Expected Household Travel Spend for Next Intercontinental Trip
Mean Median
$5,158.00 $4,420.00
Question: What is the total amount you expect your household to spend on each of the
following elements of this holiday? Enter a whole number without the currency symbol.
Airline tickets/Lodging/Additional trip-related expenses, such as dining, local transpor-
tation, souvenirs and local tours
Expected Travel Party Size of Next Intercontinental Trip
Question: How many people in your household will go on this trip? Please count
yourself as 1.
Months Traveled 2011-2012
Question: During what month(s) did you take your N holiday(s)?
Likelihood of Travel to USA
Question: When, if ever, are you likely to visit the following countries?
United States of America.
Destination Interest - Top 10 States
Which destination(s) are you interested in visiting during your next holiday?
Net Promoter
Question: United States of America: If a friend or relative were discussing a future
holiday destination with you, which statement would best describe your attitude toward
the following countries?
21%
10%
8%
25%
36%
$10,000+
$7,500-$9,999
$5,000-$7,499
$2,500-$4,999
Less than $2,500
23%
8%
2%
12%
54%
5+
4
3
2
1
6%
10%
13%
15%20%
17%
21%23%
27%
19%
12%
12%December
November
October
September
August
July
June
May
April
March
February
January
7%
12%
22%
23%
25%
12%Not likely to ever visit
Maybe some timein the distant future
2-5 years from now
1-2 years
6-12 months
In the next 6 months
55%
48%
45%
34%
22%
22%
15%
15%
15%
14%Colorado
Alaska
Nevada
Arizona
Washington
Texas
Hawaii
Florida
New York
California
45%
23%
22%
6%
4%I would bring it up to discouragepeople from travelling the there
I would tell people negative thingsabout it if it were brought up
I would tell people neither positive nornegative things if it were brought up
I would tell people positive thingsabout it if it were brought up
I would bring it up torecommend as a destination
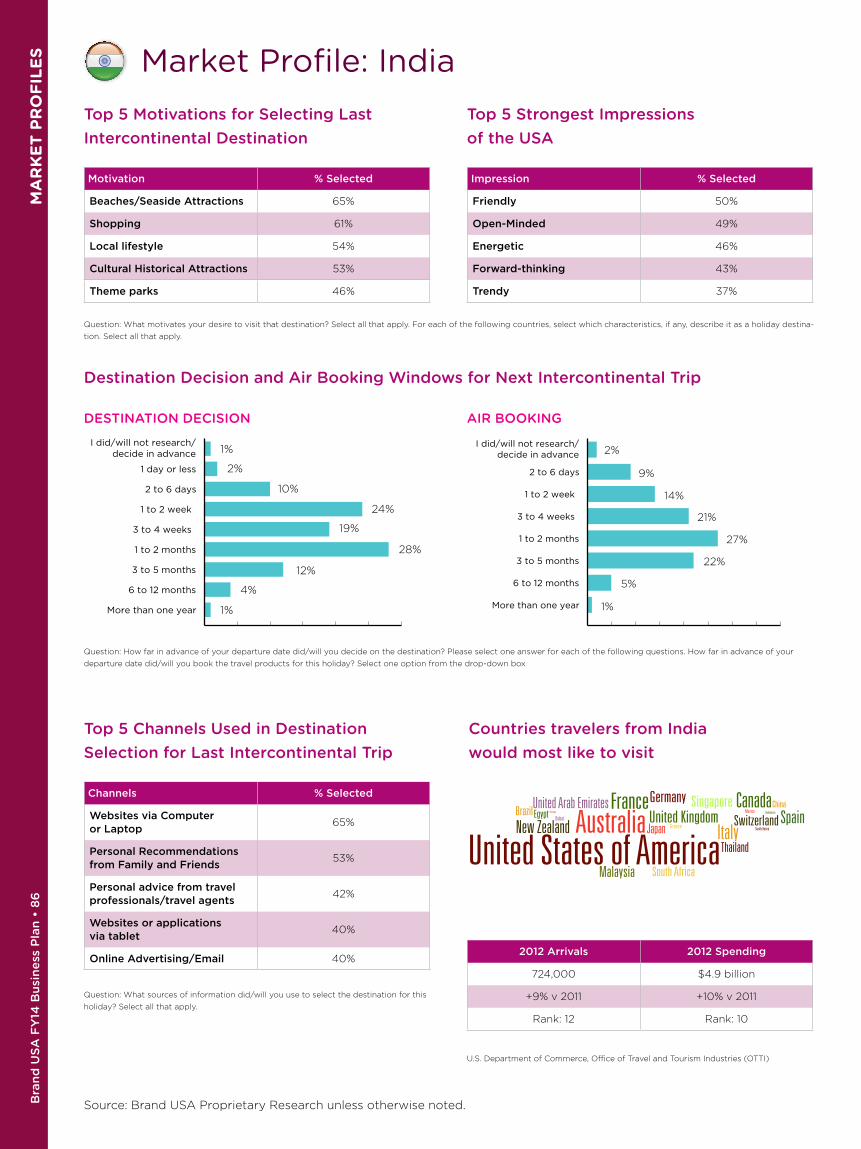
Bra
nd
US
A F
Y14
Bu
sin
ess
Pla
n •
86
M
AR
KE
T P
RO
FIL
ES
Source: Brand USA Proprietary Research unless otherwise noted.
Market Profile: IndiaTop 5 Motivations for Selecting Last Intercontinental Destination
Motivation % Selected
Beaches/Seaside Attractions 65%
Shopping 61%
Local lifestyle 54%
Cultural Historical Attractions 53%
Theme parks 46%
Top 5 Strongest Impressions of the USA
Impression % Selected
Friendly 50%
Open-Minded 49%
Energetic 46%
Forward-thinking 43%
Trendy 37%
Question: What motivates your desire to visit that destination? Select all that apply. For each of the following countries, select which characteristics, if any, describe it as a holiday destina-
tion. Select all that apply.
Destination Decision and Air Booking Windows for Next Intercontinental Trip
DESTINATION DECISION AIR BOOKING
Question: How far in advance of your departure date did/will you decide on the destination? Please select one answer for each of the following questions. How far in advance of your
departure date did/will you book the travel products for this holiday? Select one option from the drop-down box
1%
2%
10%
24%
19%
28%
1%
12%
4%
More than one year
6 to 12 months
3 to 5 months
1 to 2 months
3 to 4 weeks�
1 to 2 week�
2 to 6 days
1 day or less
I did/will not research/decide in advance 2%
9%
14%
21%
27%
1%
22%
5%
More than one year
6 to 12 months
3 to 5 months
1 to 2 months
3 to 4 weeks�
1 to 2 week�
2 to 6 days
I did/will not research/decide in advance
Top 5 Channels Used in Destination Selection for Last Intercontinental Trip
Channels % Selected
Websites via Computer or Laptop
65%
Personal Recommendations from Family and Friends
53%
Personal advice from travel professionals/travel agents
42%
Websites or applications via tablet
40%
Online Advertising/Email 40%
Question: What sources of information did/will you use to select the destination for this
holiday? Select all that apply.
Countries travelers from India would most like to visit
United States of AmericaAustralia
CanadaNew Zealand
United Arab EmiratesSpain
ItalyJapan
France
Malaysia
Thailand
BrazilEgypt DubaiPortugal
SwitzerlandSouth Korea
Mexico Indonesia
South Africa
SingaporeGermany
United KingdomGreece
China
2012 Arrivals 2012 Spending
724,000 $4.9 billion
+9% v 2011 +10% v 2011
Rank: 12 Rank: 10
U.S. Department of Commerce, Office of Travel and Tourism Industries (OTTI)

MA
RK
ET
PR
OF
ILE
S
Bran
d U
SA
FY
14 B
usin
ess P
lan • 8
7
Source: Brand USA Proprietary Research unless otherwise noted.
Expected Household Travel Spend for Next Intercontinental Trip
Mean Median
$5,461.47 $4,425.00
Question: What is the total amount you expect your household to spend on each of the
following elements of this holiday? Enter a whole number without the currency symbol.
Airline tickets/Lodging/Additional trip-related expenses, such as dining, local transpor-
tation, souvenirs and local tours
Expected Travel Party Size of Next Intercontinental Trip
Question: How many people in your household will go on this trip? Please count
yourself as 1.
Months Traveled 2011-2012
Question: During what month(s) did you take your N holiday(s)?
Likelihood of Travel to USA
Question: When, if ever, are you likely to visit the following countries?
United States of America.
Destination Interest - Top 10 States
Which destination(s) are you interested in visiting during your next holiday?
Net Promoter
Question: United States of America: If a friend or relative were discussing a future
holiday destination with you, which statement would best describe your attitude toward
the following countries?
28%
12%
14%
16%
30%
$10,000+
$7,500-$9,999
$5,000-$7,499
$2,500-$4,999
Less than $2,500
8%
22%
8%
30%
32%
5+
4
3
2
1
8%
10%
10%
17%24%
20%
13%12%
15%
18%
15%
14%December
November
October
September
August
July
June
May
April
March
February
January
20%
25%
24%
16%
12%
2%Not likely to ever visit
Maybe some timein the distant future
2-5 years from now
1-2 years
6-12 months
In the next 6 months
58%
51%
34%
33%
33%
34%
28%
24%
14%
11%Massachusetts
Virginia
Alaska
Texas
New Jersey
Hawaii
Florida
Washington
California
New York
56%
28%
11%
3%
1%I would bring it up to discouragepeople from travelling the there
I would tell people negativethings about it if it were brought up
I would tell people neither positive nornegative things if it were brought up
I would tell people positive thingsabout it if it were brought up
I would bring it up torecommend as a destination
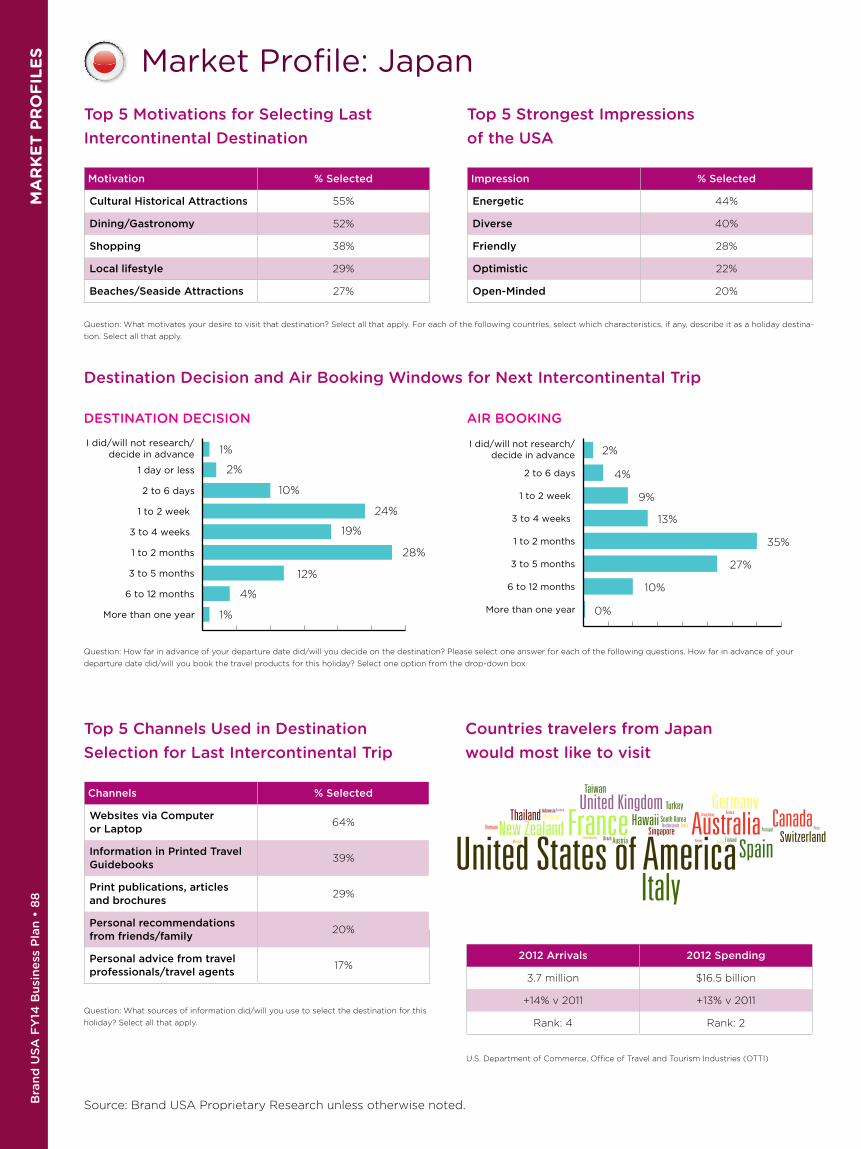
Bra
nd
US
A F
Y14
Bu
sin
ess
Pla
n •
88
M
AR
KE
T P
RO
FIL
ES
Source: Brand USA Proprietary Research unless otherwise noted.
Market Profile: JapanTop 5 Motivations for Selecting Last Intercontinental Destination
Motivation % Selected
Cultural Historical Attractions 55%
Dining/Gastronomy 52%
Shopping 38%
Local lifestyle 29%
Beaches/Seaside Attractions 27%
Top 5 Strongest Impressions of the USA
Impression % Selected
Energetic 44%
Diverse 40%
Friendly 28%
Optimistic 22%
Open-Minded 20%
Question: What motivates your desire to visit that destination? Select all that apply. For each of the following countries, select which characteristics, if any, describe it as a holiday destina-
tion. Select all that apply.
Destination Decision and Air Booking Windows for Next Intercontinental Trip
DESTINATION DECISION AIR BOOKING
Question: How far in advance of your departure date did/will you decide on the destination? Please select one answer for each of the following questions. How far in advance of your
departure date did/will you book the travel products for this holiday? Select one option from the drop-down box
1%
2%
10%
24%
19%
28%
1%
12%
4%
More than one year
6 to 12 months
3 to 5 months
1 to 2 months
3 to 4 weeks�
1 to 2 week�
2 to 6 days
1 day or less
I did/will not research/decide in advance 2%
4%
9%
13%
35%
0%
27%
10%
More than one year
6 to 12 months
3 to 5 months
1 to 2 months
3 to 4 weeks�
1 to 2 week�
2 to 6 days
I did/will not research/decide in advance
Top 5 Channels Used in Destination Selection for Last Intercontinental Trip
Channels % Selected
Websites via Computer or Laptop
64%
Information in Printed Travel Guidebooks
39%
Print publications, articles and brochures
29%
Personal recommendations from friends/family
20%
Personal advice from travel professionals/travel agents
17%
Question: What sources of information did/will you use to select the destination for this
holiday? Select all that apply.
Countries travelers from Japan would most like to visit
United States of AmericaAustralia CanadaNew Zealand
Spain
Italy
FranceTaiwan
Turkey
HawaiiAustriaBrazilCzech Republic
Mexico
VietnamSouth KoreaNetherlands India
Norway
Hong Kong Greece
Finland
Portugal Peru
Egypt
Thailand MalaysiaIndonesia Belgium
SwitzerlandSingapore
United Kingdom Germany
2012 Arrivals 2012 Spending
3.7 million $16.5 billion
+14% v 2011 +13% v 2011
Rank: 4 Rank: 2
U.S. Department of Commerce, Office of Travel and Tourism Industries (OTTI)
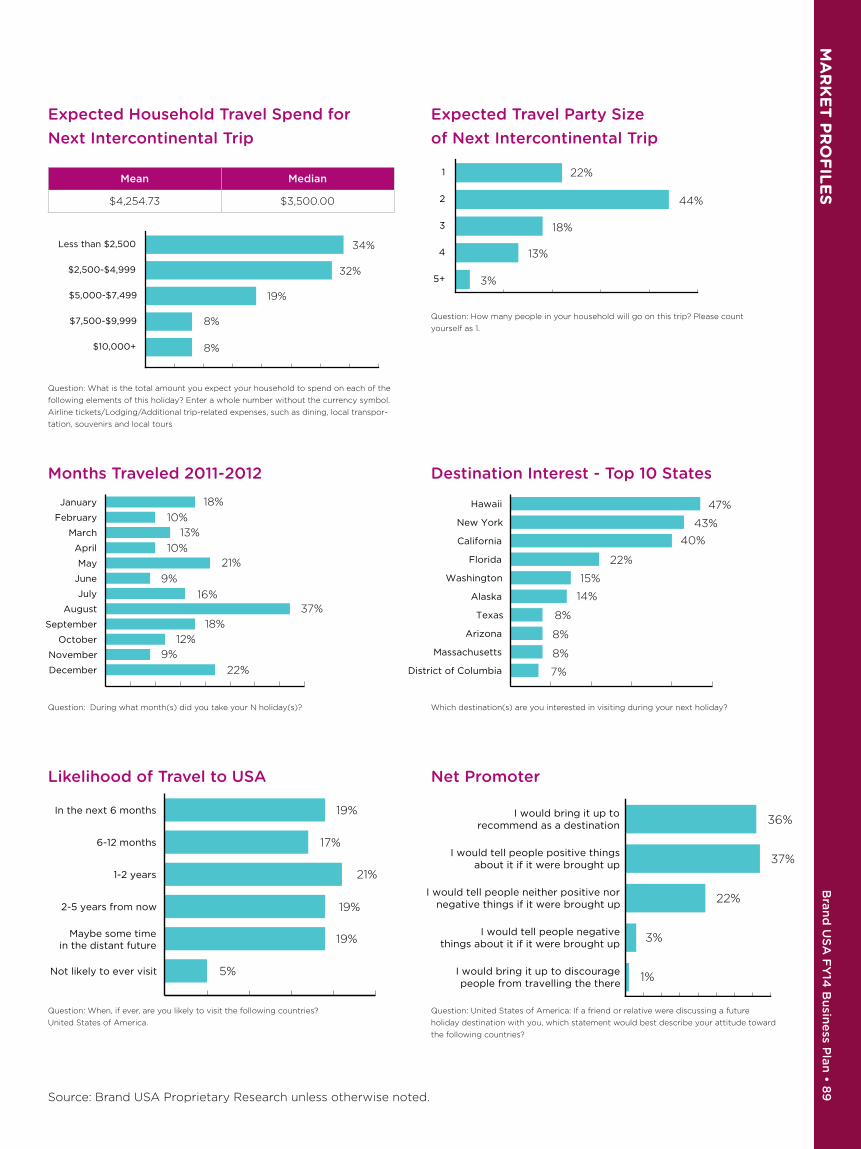
MA
RK
ET
PR
OF
ILE
S
Bran
d U
SA
FY
14 B
usin
ess P
lan • 8
9
Source: Brand USA Proprietary Research unless otherwise noted.
Expected Household Travel Spend for Next Intercontinental Trip
Mean Median
$4,254.73 $3,500.00
Question: What is the total amount you expect your household to spend on each of the
following elements of this holiday? Enter a whole number without the currency symbol.
Airline tickets/Lodging/Additional trip-related expenses, such as dining, local transpor-
tation, souvenirs and local tours
Expected Travel Party Size of Next Intercontinental Trip
Question: How many people in your household will go on this trip? Please count
yourself as 1.
Months Traveled 2011-2012
Question: During what month(s) did you take your N holiday(s)?
Likelihood of Travel to USA
Question: When, if ever, are you likely to visit the following countries?
United States of America.
Destination Interest - Top 10 States
Which destination(s) are you interested in visiting during your next holiday?
Net Promoter
Question: United States of America: If a friend or relative were discussing a future
holiday destination with you, which statement would best describe your attitude toward
the following countries?
8%
8%
19%
32%
34%
$10,000+
$7,500-$9,999
$5,000-$7,499
$2,500-$4,999
Less than $2,500
22%
13%
3%
18%
44%
5+
4
3
2
1
18%
10%
13%
10%21%
9%
16%37%
18%
12%
9%
22%December
November
October
September
August
July
June
May
April
March
February
January
19%
17%
21%
19%
19%
5%Not likely to ever visit
Maybe some timein the distant future
2-5 years from now
1-2 years
6-12 months
In the next 6 months
43%
47%
40%
22%
15%
14%
8%
8%
8%
7%District of Columbia
Massachusetts
Arizona
Texas
Alaska
Washington
Florida
California
New York
Hawaii
36%
37%
22%
3%
1%I would bring it up to discouragepeople from travelling the there
I would tell people negativethings about it if it were brought up
I would tell people neither positive nornegative things if it were brought up
I would tell people positive thingsabout it if it were brought up
I would bring it up torecommend as a destination

Bra
nd
US
A F
Y14
Bu
sin
ess
Pla
n •
90
M
AR
KE
T P
RO
FIL
ES
Source: Brand USA Proprietary Research unless otherwise noted.
Market Profile: South KoreaTop 5 Motivations for Selecting Last Intercontinental Destination
Motivation % Selected
Cultural Historical Attractions 59%
Beaches/Seaside Attractions 50%
Ecotourism/Nature 49%
Urban attractions/Nightlife 43%
Local lifestyle 37%
Top 5 Strongest Impressions of the USA
Impression % Selected
Open-Minded 56%
Diverse 53%
Energetic 47%
Down-to-earth 34%
Sophisticated 28%
Question: What motivates your desire to visit that destination? Select all that apply. For each of the following countries, select which characteristics, if any, describe it as a holiday destina-
tion. Select all that apply.
Destination Decision and Air Booking Windows for Next Intercontinental Trip
DESTINATION DECISION AIR BOOKING
Question: How far in advance of your departure date did/will you decide on the destination? Please select one answer for each of the following questions. How far in advance of your
departure date did/will you book the travel products for this holiday? Select one option from the drop-down box
2%
1%
7%
8%
10%
27%
3%
30%
12%
More than one year
6 to 12 months
3 to 5 months
1 to 2 months
3 to 4 weeks�
1 to 2 week�
2 to 6 days
1 day or less
I did/will not research/decide in advance 2%
4%
8%
20%
35%
0%
27%
5%
More than one year
6 to 12 months
3 to 5 months
1 to 2 months
3 to 4 weeks�
1 to 2 week�
2 to 6 days
I did/will not research/decide in advance
Top 5 Channels Used in Destination Selection for Last Intercontinental Trip
Channels % Selected
Websites via Computer or Laptop
66%
Personal recommendations from friends/family
46%
Personal advice from travel professionals/travel agents
38%
Information in printed travel guidebook
29%
Websites or applications via mobile phone
25%
Question: What sources of information did/will you use to select the destination for this
holiday? Select all that apply.
Countries travelers from South Korea would most like to visit
United States of AmericaUnited Kingdom
Switzerland
Australia
CanadaNew Zealand Spain
ItalyMaldives
FranceTurkey
Brazil
Mexico
Austria TaiwanHawaii
RussiaNetherlands
India
Philippines
Hong Kong
GreeceFinland
Norway
Vietnam
Sweden
Czech RepublicSingapore Japan
DenmarkEgypt
Indonesia
Thailand
Germany
China
2012 Arrivals 2012 Spending
1.25 million $4.2 billion
+9% v 2011 +10% v 2011
Rank: 9 Rank: 11
U.S. Department of Commerce, Office of Travel and Tourism Industries (OTTI)
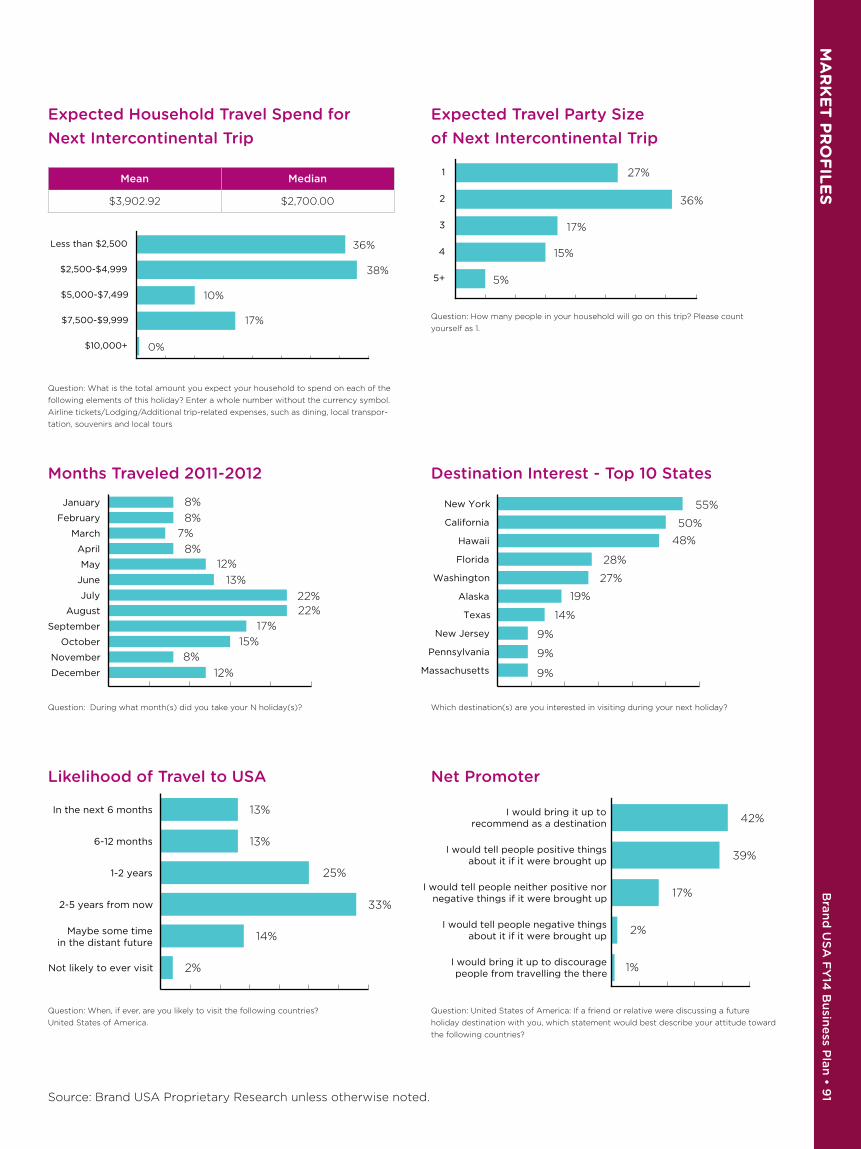
MA
RK
ET
PR
OF
ILE
S
Bran
d U
SA
FY
14 B
usin
ess P
lan • 9
1Source: Brand USA Proprietary Research unless otherwise noted.
Expected Household Travel Spend for Next Intercontinental Trip
Mean Median
$3,902.92 $2,700.00
Question: What is the total amount you expect your household to spend on each of the
following elements of this holiday? Enter a whole number without the currency symbol.
Airline tickets/Lodging/Additional trip-related expenses, such as dining, local transpor-
tation, souvenirs and local tours
Expected Travel Party Size of Next Intercontinental Trip
Question: How many people in your household will go on this trip? Please count
yourself as 1.
Months Traveled 2011-2012
Question: During what month(s) did you take your N holiday(s)?
Likelihood of Travel to USA
Question: When, if ever, are you likely to visit the following countries?
United States of America.
Destination Interest - Top 10 States
Which destination(s) are you interested in visiting during your next holiday?
Net Promoter
Question: United States of America: If a friend or relative were discussing a future
holiday destination with you, which statement would best describe your attitude toward
the following countries?
17%
0%
10%
38%
36%
$10,000+
$7,500-$9,999
$5,000-$7,499
$2,500-$4,999
Less than $2,500
27%
15%
5%
17%
36%
5+
4
3
2
1
December
November
October
September
August
July
June
May
April
March
February
January 8%
8%
7%
8%12%
13%
22%22%
17%
15%
8%
12%
13%
13%
25%
33%
14%
2%Not likely to ever visit
Maybe some timein the distant future
2-5 years from now
1-2 years
6-12 months
In the next 6 months
50%
55%
48%
28%
27%
19%
14%
9%
9%
9%Massachusetts
Pennsylvania
New Jersey
Texas
Alaska
Washington
Florida
Hawaii
California
New York
42%
39%
17%
2%
1%I would bring it up to discouragepeople from travelling the there
I would tell people negative thingsabout it if it were brought up
I would tell people neither positive nornegative things if it were brought up
I would tell people positive thingsabout it if it were brought up
I would bring it up torecommend as a destination

Bra
nd
US
A F
Y14
Bu
sin
ess
Pla
n •
92
M
AR
KE
T P
RO
FIL
ES
Source: Brand USA Proprietary Research unless otherwise noted.
Market Profile: MexicoTop 5 Motivations for Selecting Last International Destination
Motivation % Selected
Shopping 46%
Visiting friends/relatives 44%
Urban attractions 44%
Dining/Gastronomy 42%
Historical/archaeological attractions
36%
Top 5 Strongest Impressions of the USA
Impression % Selected
Trendy 73%
Diverse 61%
Open-minded 52%
Forward thinking 50%
Adventurous 43%
Question: What motivates your desire to visit that destination? Select all that apply. For each of the following countries, select which characteristics, if any, describe it as a holiday destina-
tion. Select all that apply.
Destination Decision and Air Booking Windows for Next International Trip
DESTINATION DECISION AIR BOOKING
Question: How far in advance of your departure date did/will you decide on the destination? Please select one answer for each of the following questions. How far in advance of your
departure date did/will you book the travel products for this holiday? Select one option from the drop-down box
1%
3%
6%
9%
11%
23%
4%
24%
19%
More than one year
6 to 12 months
3 to 5 months
1 to 2 months
3 to 4 weeks�
1 to 2 week�
2 to 6 days
1 day or less
I did/will not research/decide in advance 2%
11%
15%
21%
23%
1%
19%
9%
More than one year
6 to 12 months
3 to 5 months
1 to 2 months
3 to 4 weeks�
1 to 2 week�
2 to 6 days
I did/will not research/decide in advance
Top 5 Channels Used in Destination Selection for Last International Trip
Channels % Selected
Personal recommendations from friends/family
54%
Websites via computer 54%
Websites or applications via tablet
24%
Online advertising/email 23%
Information in printed travel guidebooks
21%
Question: What sources of information did/will you use to select the destination for this
holiday? Select all that apply.
United States of America
PeruChileCuba
ColombiaGreece Holland
Egypt United KingdomAustralia Canada
SpainArgentina ItalyBrazil
Russia
Thailand
Turkey
India Costa Rica
New Zealand
Portugal
Norway
Japan
Germany
Switzerland China
France
Countries travelers from Mexico would most like to visit
2012 Arrivals 2012 Spending
14.51 million $10 billion
+8% v 2011 +8% v 2011
Rank: 2 Rank: 4
U.S. Department of Commerce, Office of Travel and Tourism Industries (OTTI)

MA
RK
ET
PR
OF
ILE
S
Bran
d U
SA
FY
14 B
usin
ess P
lan • 9
3
Source: Brand USA Proprietary Research unless otherwise noted.
Top 5 Channels Used in Destination Selection for Last International Trip
Mean Median
$3,687.67 $2,333.37
Question: What is the total amount you expect your household to spend on each of the
following elements of this holiday? Enter a whole number without the currency symbol.
Airline tickets/Lodging/Additional trip-related expenses, such as dining, local transpor-
tation, souvenirs and local tours
Expected Travel Party Size of Next International Trip
Question: How many people in your household will go on this trip? Please count
yourself as 1.
Likelihood of Travel to USA
Question: When, if ever, are you likely to visit the following countries?
United States of America.
Net Promoter
Question: United States of America: If a friend or relative were discussing a future
holiday destination with you, which statement would best describe your attitude toward
the following countries?
10%
7%
5%
23%
32%
22%
$10,000+
$7,500-$9,999
$5,000-$7,499
$2,500-$4,999
$1,000-$2,499
Less than $1,000
22%
18%
11%
18%
31%
5+
4
3
2
1
52%
21%
11%
6%
7%
4%Not likely to ever visit
Maybe some timein the distant future
2-5 years from now
1-2 years
6-12 months
In the next 6 months49%
28%
19%
3%
1%I would bring it up to discouragepeople from travelling the there
I would tell people negative thingsabout it if it were brought up
I would tell people neither positive nornegative things if it were brought up
I would tell people positive thingsabout it if it were brought up
I would bring it up torecommend as a destination
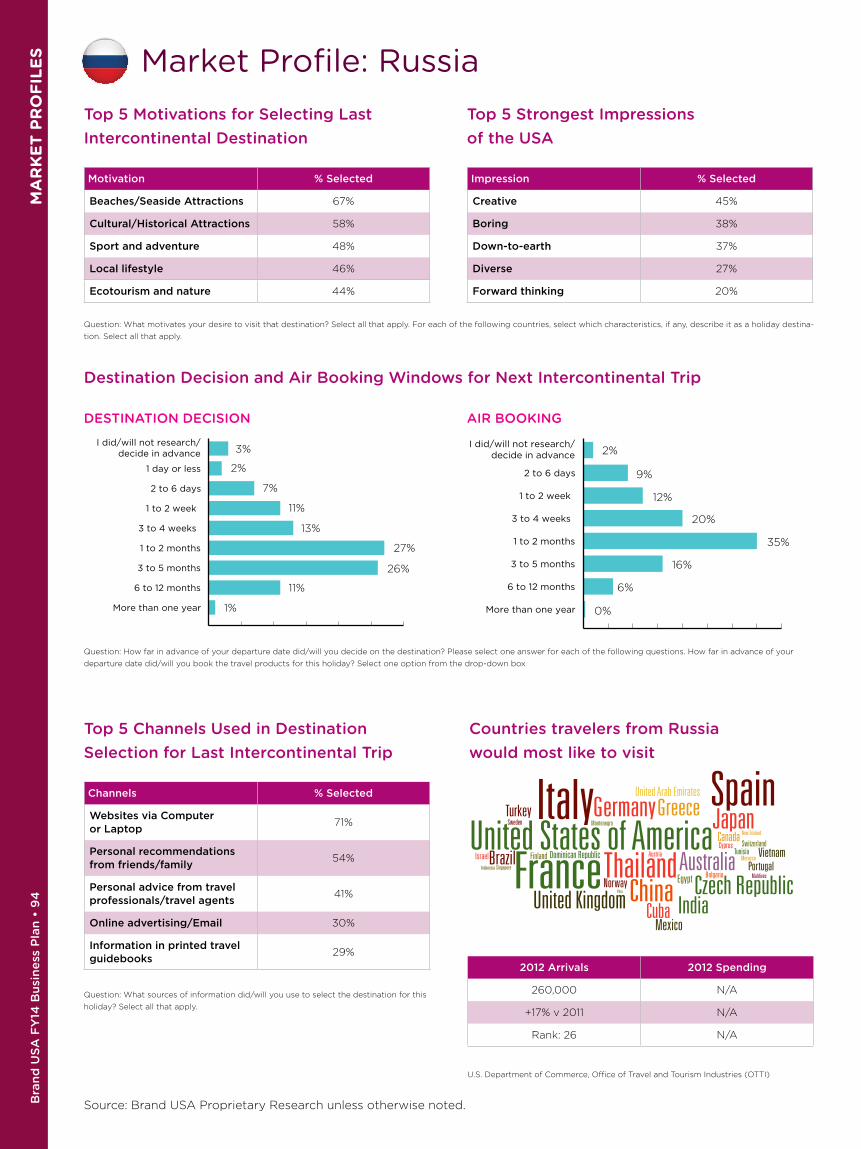
Bra
nd
US
A F
Y14
Bu
sin
ess
Pla
n •
94
M
AR
KE
T P
RO
FIL
ES
Source: Brand USA Proprietary Research unless otherwise noted.
Market Profile: RussiaTop 5 Motivations for Selecting Last Intercontinental Destination
Motivation % Selected
Beaches/Seaside Attractions 67%
Cultural/Historical Attractions 58%
Sport and adventure 48%
Local lifestyle 46%
Ecotourism and nature 44%
Top 5 Strongest Impressions of the USA
Impression % Selected
Creative 45%
Boring 38%
Down-to-earth 37%
Diverse 27%
Forward thinking 20%
Question: What motivates your desire to visit that destination? Select all that apply. For each of the following countries, select which characteristics, if any, describe it as a holiday destina-
tion. Select all that apply.
Destination Decision and Air Booking Windows for Next Intercontinental Trip
DESTINATION DECISION AIR BOOKING
Question: How far in advance of your departure date did/will you decide on the destination? Please select one answer for each of the following questions. How far in advance of your
departure date did/will you book the travel products for this holiday? Select one option from the drop-down box
3%
2%
7%
11%
13%
27%
1%
26%
11%
More than one year
6 to 12 months
3 to 5 months
1 to 2 months
3 to 4 weeks�
1 to 2 week�
2 to 6 days
1 day or less
I did/will not research/decide in advance 2%
9%
12%
20%
35%
0%
16%
6%
More than one year
6 to 12 months
3 to 5 months
1 to 2 months
3 to 4 weeks�
1 to 2 week�
2 to 6 days
I did/will not research/decide in advance
Top 5 Channels Used in Destination Selection for Last Intercontinental Trip
Channels % Selected
Websites via Computer or Laptop
71%
Personal recommendations from friends/family
54%
Personal advice from travel professionals/travel agents
41%
Online advertising/Email 30%
Information in printed travel guidebooks
29%
Question: What sources of information did/will you use to select the destination for this
holiday? Select all that apply.
Countries travelers from Russia would most like to visit
France
United Arab Emirates
United States of America
CubaUnited KingdomMexico
AustraliaCanada
SpainItalyBrazil
TurkeySweden
Norway
Finland
India
Dominican Republic
Montenegro
Peru
Indonesia
IsraelSingapore
Czech Republic
New Zealand
MoroccoVietnam
Portugal
Switzerland
Egypt
Cyprus
Bolgaria Maldives
Tunisia
Japan
Thailand
GermanyGreece
China
Austria
2012 Arrivals 2012 Spending
260,000 N/A
+17% v 2011 N/A
Rank: 26 N/A
U.S. Department of Commerce, Office of Travel and Tourism Industries (OTTI)
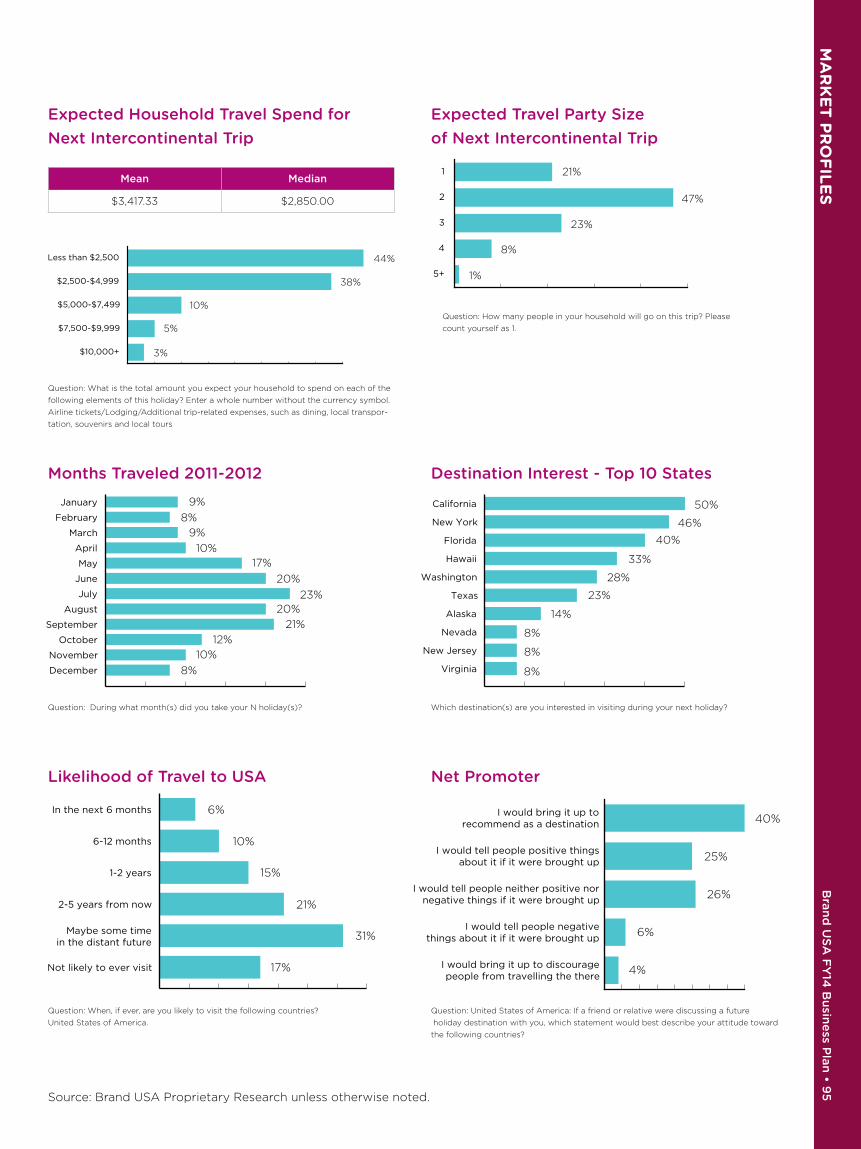
MA
RK
ET
PR
OF
ILE
S
Bran
d U
SA
FY
14 B
usin
ess P
lan • 9
5
Source: Brand USA Proprietary Research unless otherwise noted.
Expected Household Travel Spend for Next Intercontinental Trip
Mean Median
$3,417.33 $2,850.00
Question: What is the total amount you expect your household to spend on each of the
following elements of this holiday? Enter a whole number without the currency symbol.
Airline tickets/Lodging/Additional trip-related expenses, such as dining, local transpor-
tation, souvenirs and local tours
Expected Travel Party Size of Next Intercontinental Trip
Question: How many people in your household will go on this trip? Please
count yourself as 1.
Months Traveled 2011-2012
Question: During what month(s) did you take your N holiday(s)?
Likelihood of Travel to USA
Question: When, if ever, are you likely to visit the following countries?
United States of America.
Destination Interest - Top 10 States
Which destination(s) are you interested in visiting during your next holiday?
Net Promoter
Question: United States of America: If a friend or relative were discussing a future
holiday destination with you, which statement would best describe your attitude toward
the following countries?
5%
3%
10%
38%
44%
$10,000+
$7,500-$9,999
$5,000-$7,499
$2,500-$4,999
Less than $2,500
21%
8%
1%
23%
47%
5+
4
3
2
1
9%
8%
9%
10%17%
20%
23%20%
21%
12%
10%
8%December
November
October
September
August
July
June
May
April
March
February
January
6%
10%
15%
21%
31%
17%Not likely to ever visit
Maybe some timein the distant future
2-5 years from now
1-2 years
6-12 months
In the next 6 months
46%
50%
40%
33%
28%
23%
14%
8%
8%
8%Virginia
New Jersey
Nevada
Alaska
Texas
Washington
Hawaii
Florida
New York
California
40%
25%
26%
6%
4%I would bring it up to discouragepeople from travelling the there
I would tell people negativethings about it if it were brought up
I would tell people neither positive nornegative things if it were brought up
I would tell people positive thingsabout it if it were brought up
I would bring it up torecommend as a destination
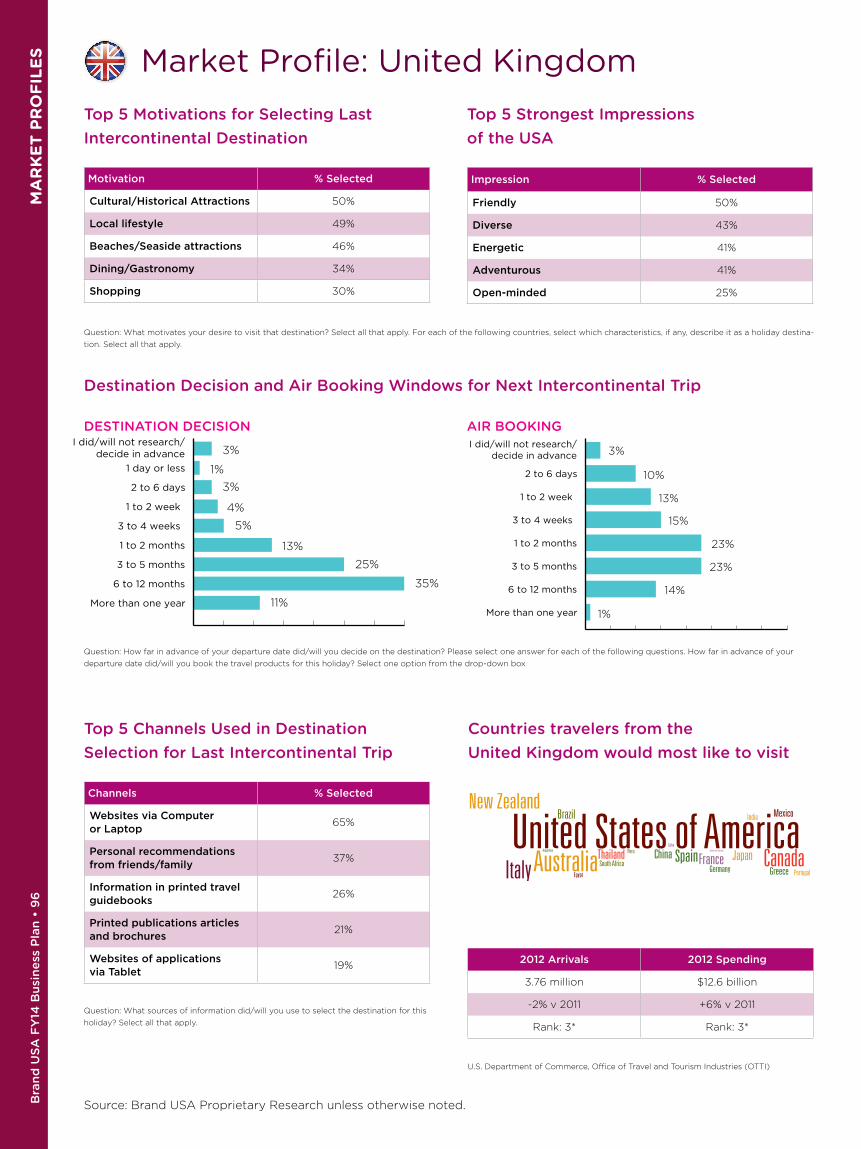
Bra
nd
US
A F
Y14
Bu
sin
ess
Pla
n •
96
M
AR
KE
T P
RO
FIL
ES
Source: Brand USA Proprietary Research unless otherwise noted.
Market Profile: United KingdomTop 5 Motivations for Selecting Last Intercontinental Destination
Motivation % Selected
Cultural/Historical Attractions 50%
Local lifestyle 49%
Beaches/Seaside attractions 46%
Dining/Gastronomy 34%
Shopping 30%
Top 5 Strongest Impressions of the USA
Impression % Selected
Friendly 50%
Diverse 43%
Energetic 41%
Adventurous 41%
Open-minded 25%
Question: What motivates your desire to visit that destination? Select all that apply. For each of the following countries, select which characteristics, if any, describe it as a holiday destina-
tion. Select all that apply.
Destination Decision and Air Booking Windows for Next Intercontinental Trip
DESTINATION DECISION AIR BOOKING
Question: How far in advance of your departure date did/will you decide on the destination? Please select one answer for each of the following questions. How far in advance of your
departure date did/will you book the travel products for this holiday? Select one option from the drop-down box
3%
1%
3%
4%
5%
13%
11%
25%
35%
More than one year
6 to 12 months
3 to 5 months
1 to 2 months
3 to 4 weeks�
1 to 2 week�
2 to 6 days
1 day or less
I did/will not research/decide in advance 3%
10%
13%
15%
23%
1%
23%
14%
More than one year
6 to 12 months
3 to 5 months
1 to 2 months
3 to 4 weeks�
1 to 2 week�
2 to 6 days
I did/will not research/decide in advance
Top 5 Channels Used in Destination Selection for Last Intercontinental Trip
Channels % Selected
Websites via Computer or Laptop
65%
Personal recommendations from friends/family
37%
Information in printed travel guidebooks
26%
Printed publications articles and brochures
21%
Websites of applications via Tablet
19%
Question: What sources of information did/will you use to select the destination for this
holiday? Select all that apply.
United States of AmericaAustralia CanadaSpain
Italy
BrazilNew Zealand
Egypt
Japan
India
Portugal
ThailandGermany Greece
Mexico
ChinaSouth Africa
PeruCuba
Argentina United Arab Emirates
France
2012 Arrivals 2012 Spending
3.76 million $12.6 billion
-2% v 2011 +6% v 2011
Rank: 3* Rank: 3*
U.S. Department of Commerce, Office of Travel and Tourism Industries (OTTI)
Countries travelers from the United Kingdom would most like to visit

MA
RK
ET
PR
OF
ILE
S
Bran
d U
SA
FY
14 B
usin
ess P
lan • 9
7
Source: Brand USA Proprietary Research unless otherwise noted.
Expected Household Travel Spend for Next Intercontinental Trip
Mean Median
$4,941.16 $4,190.04
Question: What is the total amount you expect your household to spend on each of the
following elements of this holiday? Enter a whole number without the currency symbol.
Airline tickets/Lodging/Additional trip-related expenses, such as dining, local transpor-
tation, souvenirs and local tours
Expected Travel Party Size of Next Intercontinental Trip
Question: How many people in your household will go on this trip? Please count
yourself as 1.
Months Traveled 2011-2012
Question: During what month(s) did you take your N holiday(s)?
Likelihood of Travel to USA
Question: When, if ever, are you likely to visit the following countries?
United States of America.
Destination Interest - Top 10 States
Which destination(s) are you interested in visiting during your next holiday?
Net Promoter
Question: United States of America: If a friend or relative were discussing a future
holiday destination with you, which statement would best describe your attitude toward
the following countries?
10%
8%
20%
37%
25%
$10,000+
$7,500-$9,999
$5,000-$7,499
$2,500-$4,999
Less than $2,500
22%
11%
4%
14%
49%
5+
4
3
2
1
9%
12%
12%
15%17%
20%
19%20%
25%
19%
11%
13%December
November
October
September
August
July
June
May
April
March
February
January
11%
16%
23%
24%
18%
8%Not likely to ever visit
Maybe some timein the distant future
2-5 years from now
1-2 years
6-12 months
In the next 6 months
60%
61%
39%
30%
25%
21%
20%
15%
14%
13%Colorado
Nevada
District of Columbia
Alaska
Texas
Washington
Florida
Hawaii
California
New York
41%
28%
24%
5%
2%I would bring it up to discouragepeople from travelling the there
I would tell people negative thingsabout it if it were brought up
I would tell people neither positive nornegative things if it were brought up
I would tell people positive thingsabout it if it were brought up
I would bring it up torecommend as a destination

Partnership Programs and Resources

PA
RT
NE
RS
HIP
PR
OG
RA
MS
AN
D R
ES
OU
RC
ES
B
rand
US
A F
Y14
Bu
sine
ss Plan
• 99
Ways to Engage with Brand USA
Brand USA offers a variety of marketing-driven programs to amplify your reach internationally, inspire visitors to travel to the United States and drive tourism dollars to your organiza-tion, city or state.
Discover America Global Inspiration GuideThese language-specific guides are designed to inspire
travel by displaying the richness and variety of American
experiences through stunning photography and com-
pelling copy. You can sponsor content that encourages
readers to connect with additional online, mobile, email
and social assets. In FY14, more than 550,000 print copies
will be produced, creating impressions in 16 international
markets.
DiscoverAmerica�comBrand USA’s global website is becoming an essential
resource for potential and future visitors to the USA to
explore destinations and experiences, natural wonders and
find valuable travel information. Choose from a variety of
programs designed to drive traffic and referrals, including:
• Experience, regional, state and city enhanced pages
featuring destination content, photos, videos, links
and more
• 2-minute in-language content video journals
• TripTuner® – An interactive online tool for exploring
destinations based on experiences and interests
• Digital marketing initiatives, including search engine
marketing campaigns, will extend your current search
budget and drive traffic to DiscoverAmerica.com
• Social media stories and promotions customized for
each country, led by an in-country editor
• Country specific digital programs created in language
and following in-market online behaviors
Media Planning & BuyingBrand USA works with each partner on an individual basis
to determine which programs can be maximized to extend
your reach and drive international visitors to you.
Brand USA In-Country Multi-Channel ProgramsThese market-driven multi-channel programs are created
individually for each country and coincide with Brand USA
consumer marketing campaigns. They are customized
based on the channels that are most effective in each
country and include print, digital, email, radio and
television. Packaged affordably, they feature calls to action
that drive travelers directly to your organization.
Customized In-Country Marketing InitiativesBrand USA international representative offices can develop
customized programs for your destination or organization.
During a Brand USA-funded ideation session, we work with
you to identify goals, objectives and budgets. Then our
experienced in-country representatives put together an
effective plan based on your needs. Many programs qualify
for additional Brand USA support, further extending the
reach of your marketing efforts.
Media and Travel Trade OutreachBrand USA will help you directly target and connect with
international travel media, generating media coverage for
your destination or organization and helping you expand
your network and connections with international travel
trade representatives. Through the Brand USA Media
Network powered by TravMedia and the Brand USA
Travel Trade Network powered by TravTrade, we help you
increase your profile with international journalists and
influential members of the travel community.
USA Discovery Program Launched in June in the United Kingdom and Ireland, this
online training tool inspires the travel industry to sell the
diverse destinations and experiences available in the USA
like never before. Destinations that have already invested
in a training program for agents and tour operators will
have the opportunity to link into the Brand USA Discovery
Program.
Bra
nd
US
A F
Y14
Bu
sin
ess
Pla
n •
10
0
PA
RT
NE
RS
HIP
PR
OG
RA
MS
AN
D R
ES
OU
RC
ES Influential international travel industry experts are incen-
tivized to learn more about U.S. destinations, experiences
and organizations by earning badges and accreditations as
they progress though the program.
International Tradeshows and MissionsBrand USA creates a strong United States presence at
key travel trade shows throughout the world. Through
highly branded USA Pavilions that are vibrant, open and
welcoming, we are able to provide a higher profile for the
United States and participating partners. Additional Brand
USA organized events will take place before, during and
after shows, based on the market and the needs of the
partners.
Your destination or organization will retain its own identity
but be part of a collaborative United States effort. Partner
with us and receive opportunities and a variety of benefits,
including:
• Increased exposure through Brand USA events at the
tradeshow
• Marketing, advertising and public relations activities
pre and post event
• Participation in customer engagement and
entertainment opportunities
• Unified United States branding elements
Sales missions are planned in many countries where Brand
USA has international representation and are currently
scheduled for Australia, Brazil, Hong Kong, and India
during FY14.
In-Kind Support: Promotion and Contributions• Promoting the United States in your marketing initiatives
is a key way to support Brand USA. Through simple
activities, your cash and in-kind support powers the
United States international marketing campaign with
matching federal funds:
• Include the Brand USA logo in advertising
• Provide ad space to Brand USA
• Add the Brand USA logo to your internationally focused
websites, emails, Facebook pages, etc.
• Donate photos, videos and international research to
Brand USA
• Contribute airfare, accommodations, food & beverage or
other services to support Brand USA events, familiariza-
tion trips, travel missions, and trade show.
Brand USA Authorized Co-Op Marketing Programs – Extending Your ReachBy participating in these customizable programs with
independent publishers and online travel agencies (OTAs)
you enhance your budget because Brand USA matches
your investment. Print publications, digital media and
publishers, broadcast media, tour operators, OTAs and
multi-platform media outlets are participating in the
following countries, with additional media platforms
added regularly:
• Australia • South Korea
• Canada • Mexico
• China • New Zealand
• Germany • Scotland
• India • Taiwan
• Japan • United Kingdom
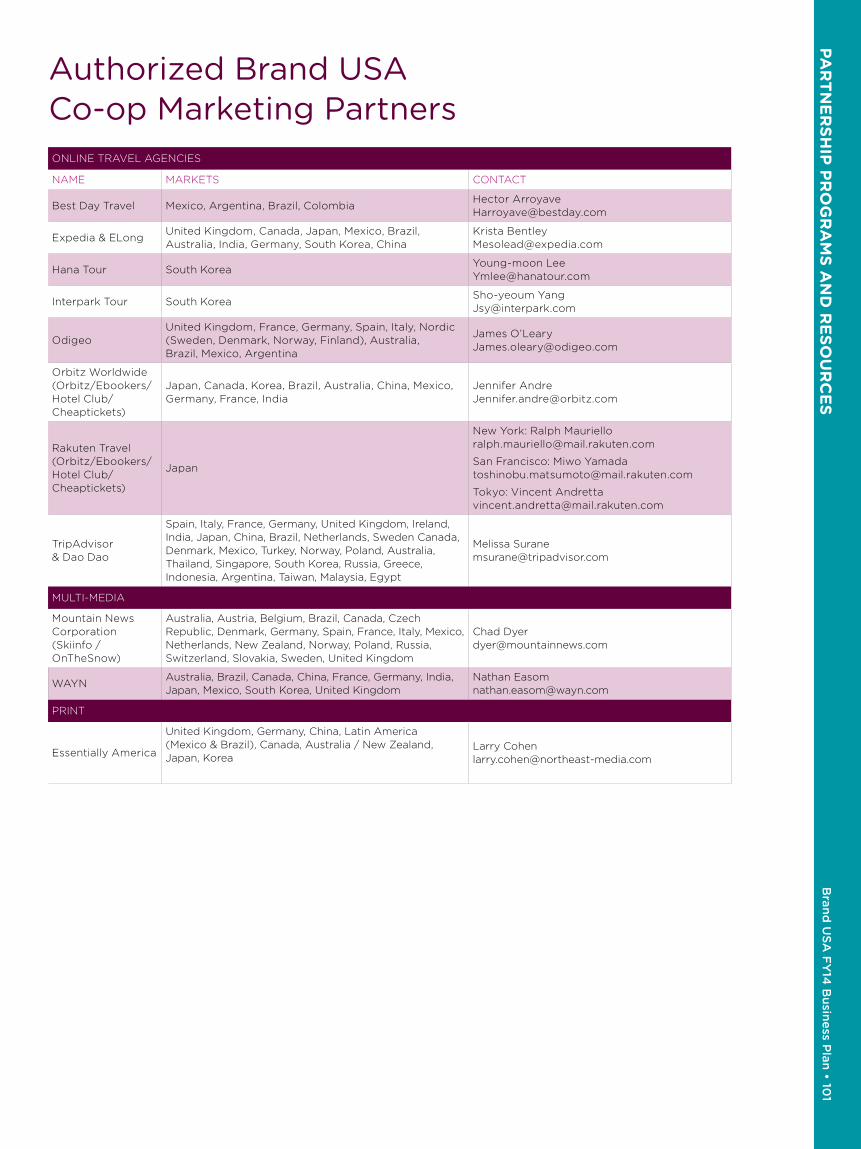
PA
RT
NE
RS
HIP
PR
OG
RA
MS
AN
D R
ES
OU
RC
ES
B
rand
US
A F
Y14
Bu
sine
ss Plan
• 101
Authorized Brand USA Co-op Marketing PartnersONLINE TRAVEL AGENCIES
NAME MARKETS CONTACT
Best Day Travel Mexico, Argentina, Brazil, ColombiaHector Arroyave [email protected]
Expedia & ELongUnited Kingdom, Canada, Japan, Mexico, Brazil, Australia, India, Germany, South Korea, China
Krista Bentley [email protected]
Hana Tour South KoreaYoung-moon Lee [email protected]
Interpark Tour South KoreaSho-yeoum Yang [email protected]
OdigeoUnited Kingdom, France, Germany, Spain, Italy, Nordic (Sweden, Denmark, Norway, Finland), Australia, Brazil, Mexico, Argentina
James O’Leary [email protected]
Orbitz Worldwide (Orbitz/Ebookers/Hotel Club/Cheaptickets)
Japan, Canada, Korea, Brazil, Australia, China, Mexico, Germany, France, India
Jennifer Andre [email protected]
Rakuten Travel (Orbitz/Ebookers/Hotel Club/Cheaptickets)
Japan
New York: Ralph Mauriello [email protected]
San Francisco: Miwo Yamada [email protected]
Tokyo: Vincent Andretta [email protected]
TripAdvisor & Dao Dao
Spain, Italy, France, Germany, United Kingdom, Ireland, India, Japan, China, Brazil, Netherlands, Sweden Canada, Denmark, Mexico, Turkey, Norway, Poland, Australia, Thailand, Singapore, South Korea, Russia, Greece, Indonesia, Argentina, Taiwan, Malaysia, Egypt
Melissa Surane [email protected]
MULTI-MEDIA
Mountain News Corporation (Skiinfo / OnTheSnow)
Australia, Austria, Belgium, Brazil, Canada, Czech Republic, Denmark, Germany, Spain, France, Italy, Mexico, Netherlands, New Zealand, Norway, Poland, Russia, Switzerland, Slovakia, Sweden, United Kingdom
Chad Dyer [email protected]
WAYNAustralia, Brazil, Canada, China, France, Germany, India, Japan, Mexico, South Korea, United Kingdom
Nathan Easom [email protected]
Essentially America
United Kingdom, Germany, China, Latin America (Mexico & Brazil), Canada, Australia / New Zealand, Japan, Korea
Larry Cohen [email protected]
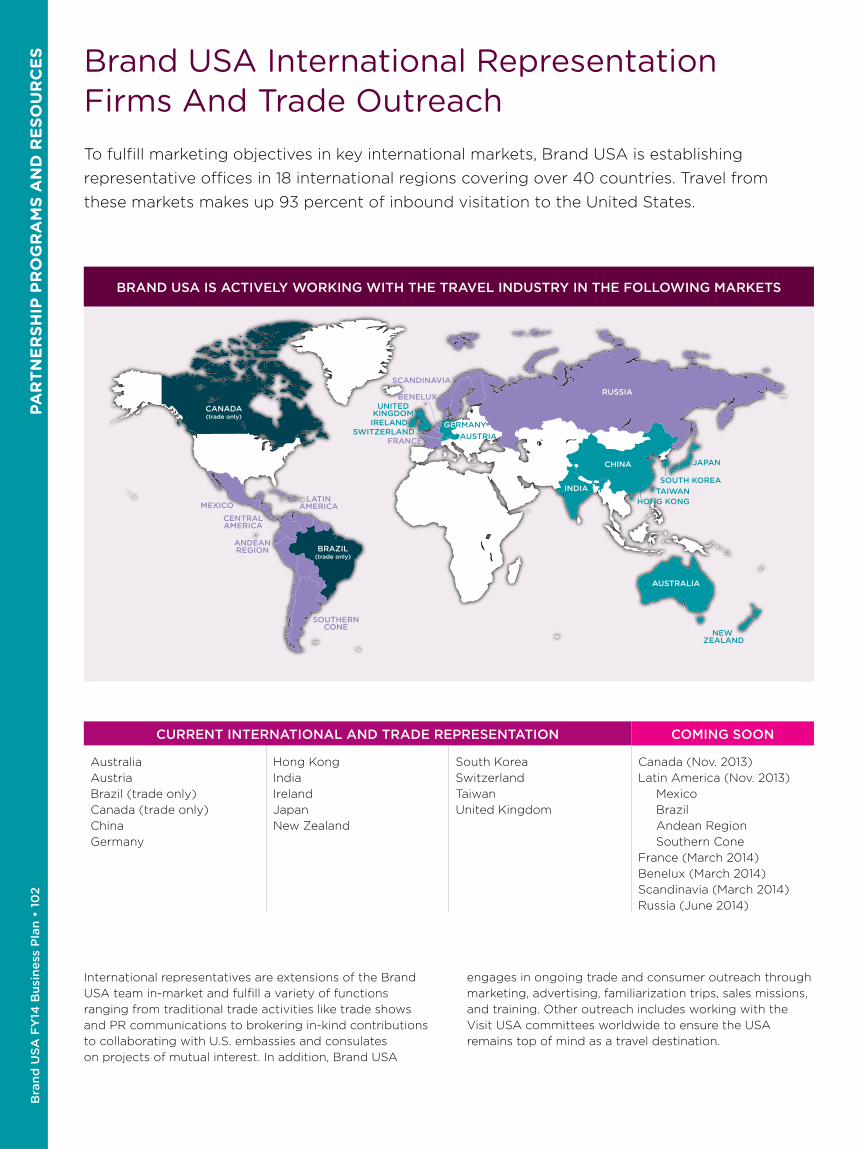
Bra
nd
US
A F
Y14
Bu
sin
ess
Pla
n •
10
2
PA
RT
NE
RS
HIP
PR
OG
RA
MS
AN
D R
ES
OU
RC
ES Brand USA International Representation
Firms And Trade OutreachTo fulfill marketing objectives in key international markets, Brand USA is establishing
representative offices in 18 international regions covering over 40 countries. Travel from
these markets makes up 93 percent of inbound visitation to the United States.
BRAZIL(trade only)
AUSTRALIA
AUSTRIAGERMANY
FRANCE
BENELUX
SCANDINAVIA
CANADA(trade only)
INDIA
CHINA
RUSSIA
IRELAND
SOUTHERNCONE
ANDEANREGION
CENTRALAMERICA
LATINAMERICA
JAPAN
MEXICO
UNITEDKINGDOM
SOUTH KOREA
NEW ZEALAND
TAIWANHONG KONG
SWITZERLAND
BRAND USA IS ACTIVELY WORKING WITH THE TRAVEL INDUSTRY IN THE FOLLOWING MARKETS
CURRENT INTERNATIONAL AND TRADE REPRESENTATION COMING SOON
Australia
Austria
Brazil (trade only)
Canada (trade only)
China
Germany
Hong Kong
India
Ireland
Japan
New Zealand
South Korea
Switzerland
Taiwan
United Kingdom
Canada (Nov. 2013)
Latin America (Nov. 2013)
Mexico
Brazil
Andean Region
Southern Cone
France (March 2014)
Benelux (March 2014)
Scandinavia (March 2014)
Russia (June 2014)
International representatives are extensions of the Brand
USA team in-market and fulfill a variety of functions
ranging from traditional trade activities like trade shows
and PR communications to brokering in-kind contributions
to collaborating with U.S. embassies and consulates
on projects of mutual interest. In addition, Brand USA
engages in ongoing trade and consumer outreach through
marketing, advertising, familiarization trips, sales missions,
and training. Other outreach includes working with the
Visit USA committees worldwide to ensure the USA
remains top of mind as a travel destination.
PA
RT
NE
RS
HIP
PR
OG
RA
MS
AN
D R
ES
OU
RC
ES
B
rand
US
A F
Y14
Bu
sine
ss Plan
• 103
Brand USA International Representation FirmsAUSTRALIA & NEW ZEALAND
Gate 7
Founded in 1998, Gate 7 was inspired in equal part by
passion for the travel experience, the discipline of market-
ing, and the challenge of creating something from scratch.
For more than 15 years, it has built a reputation as a strong,
reliable and vibrant partner in destination marketing and
representation in the Australian and New Zealand markets,
winning multiple travel industry awards.
As outbound travel from Down Under has strengthened
and boomed over recent years, Gate 7’s capabilities have
continued to evolve beyond the key competencies of travel
trade and public relations, with experience working on large
scale, consumer facing programs and complex integrated
marketing campaigns. On June 1, 2013, Gate 7 launched its
second office in Auckland, New Zealand.
Contact: Jo Palmer [email protected]
CHINA
AVIAREPS Marketing Garden Ltd
Formed in 1999, Tokyo-based AVIAREPS is a destination
marketing company specializing in outbound travel. The
largest company of its kind in Asia-Pacific, it has 11 offices.
AVIAREPS is known for its expertise in inbound mission
organization, embassy and government relations, traded
educational seminars, travel trade cooperative programs,
trade shows, media relations and website development.
Contact: Mavis Zheng [email protected]
GERMANY, AUSTRIA, & SWITZERLAND
Brandmasters America
Four leading agencies in Germany, Austria and Switzerland
joined together to provide Brand USA with the best
international team for the region. Together, the following
organizations work under the Brandmasters umbrella to
leverage their individual and collective talents to oversee
and execute high-impact campaigns.
Get it Across Marketing & PR is a full-service tourism
marketing and public relations company based in Cologne.
Opened in 1999, it’s recognized for strong industry and
press contacts.
Launched in 1990, MSi – Marketing Services International
is a leading tourism representation company in German-
speaking markets. Based in Frankfurt, Germany, MSi
specializes in travel trade marketing and representation
services, publicity and sales promotions, company analysis
and management consultancy, and event planning.
Travel Marketing Romberg (TMR) was founded in 1992.
Located near Dusseldorf, Germany, it’s well known as an
efficient agency covering destination marketing, public
relations, destination education, social media and multime-
dia services.
Frankfurt-based Weichmann Tourism Service GmbH was
established in 1981 and is a full-service travel/tourism sales,
marketing and public relations company.
Contact: Christian Zerbian [email protected]
Bra
nd
US
A F
Y14
Bu
sin
ess
Pla
n •
10
4
PA
RT
NE
RS
HIP
PR
OG
RA
MS
AN
D R
ES
OU
RC
ES
HONG KONG & TAIWAN
BrandStory Inc. & Connectworldwide
Established in 2002 and headquartered in the U.S.,
Connectworldwide provides outsourced global travel
representation in the areas of sales and marketing for the
travel industry. Connectworldwide’s global network now
extends to 40 markets with 36 agencies around the world.
Contact: Reene Ho-Phang [email protected]
INDIA
Sartha Marketing
Sartha Marketing is an industry leader that offers inte-
grated sales and marketing consultancy and solutions to
companies, tourism products, and destinations seeking to
set up operations and do business in India. Sartha focuses
on tourism, hospitality, aviation, and trade/economic
boards. Headquartered in New Delhi, the company also
operates branch offices in Mumbai and Chennai.
Contact: Sheema Vohra [email protected]
JAPAN
AVIAREPS Marketing Garden Ltd
Formed in 1999, Tokyo-based AVIAREPS is a destination
marketing company specializing in outbound travel. The
largest company of its kind in Asia-Pacific, it has 11 offices.
AVIAREPS is known for its expertise in inbound mission
organization, embassy and government relations, traded
educational seminars, travel trade cooperative programs,
trade shows, media relations and website development.
Contact: Yoichi Hayase [email protected]
SOUTH KOREA
AVIAREPS Marketing Garden Ltd
Formed in 1999, Tokyo-based AVIAREPS is a destination
marketing company specializing in outbound travel. The
largest company of its kind in Asia-Pacific, it has 11 offices.
AVIAREPS is known for its expertise in inbound mission
organization, embassy and government relations, traded
educational seminars, travel trade cooperative programs,
trade shows, media relations and website development.
Contact: Gina Choi [email protected]
THE UNITED KINGDOM & IRELAND
Black Diamond
Founded in 1991, Black Diamond is an experienced mar-
keting organization that has represented 25 United States
destinations. It’s made up of numerous divisions, including
travel, television and research. The London-based
company provides trade, marketing, communications,
technology, creative, media planning and brand strategy
services.
Award-winning Black Diamond brings a fresh and effective
perspective, using a rigorous and analytical approach that
employs planners and digital strategists alongside staff
and consultants with decades of United Kingdom travel
trade representation and public relations experience.
Contact: Sarah Barnett [email protected]
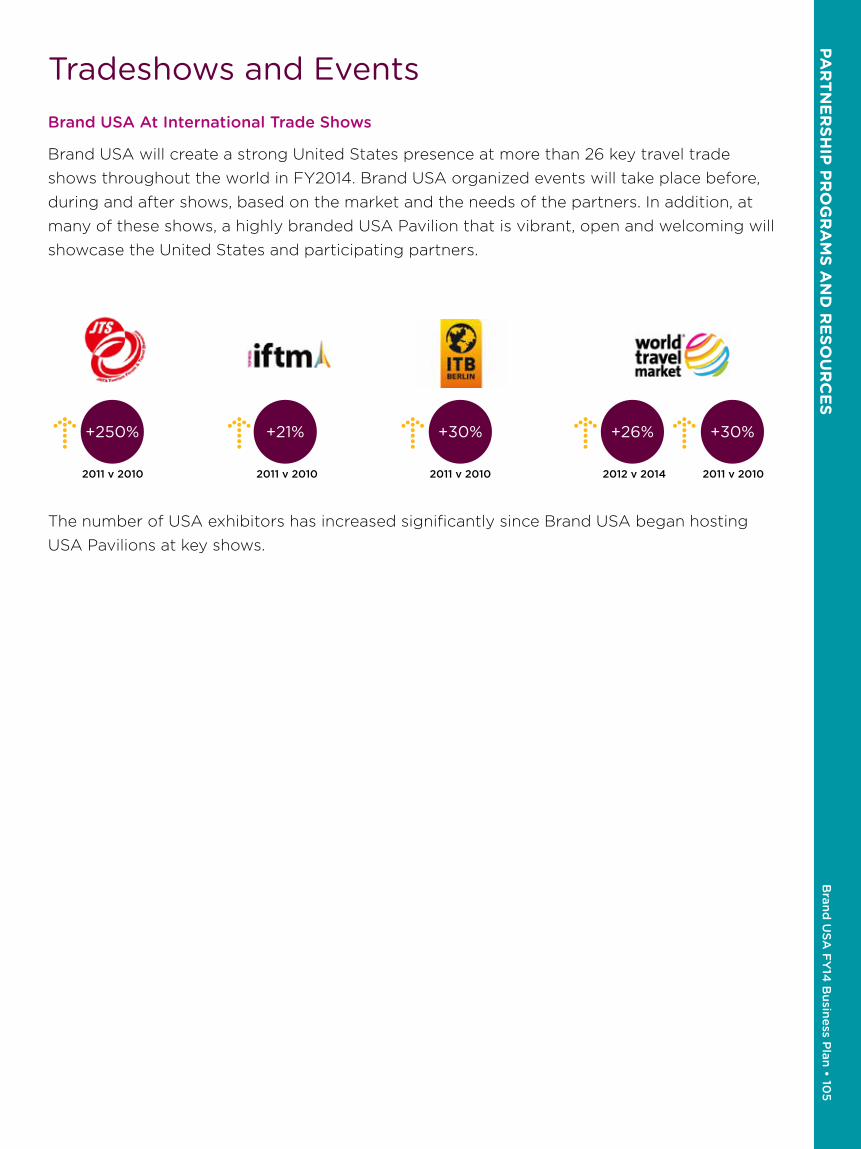
PA
RT
NE
RS
HIP
PR
OG
RA
MS
AN
D R
ES
OU
RC
ES
B
rand
US
A F
Y14
Bu
sine
ss Plan
• 105
Tradeshows and EventsBrand USA At International Trade Shows
Brand USA will create a strong United States presence at more than 26 key travel trade
shows throughout the world in FY2014. Brand USA organized events will take place before,
during and after shows, based on the market and the needs of the partners. In addition, at
many of these shows, a highly branded USA Pavilion that is vibrant, open and welcoming will
showcase the United States and participating partners.
The number of USA exhibitors has increased significantly since Brand USA began hosting
USA Pavilions at key shows.
+250%
2011 v 2010
+21%
2011 v 2010
+30%
2011 v 2010
+26% +30%
2012 v 2014 2011 v 2010

Bra
nd
US
A F
Y14
Bu
sin
ess
Pla
n •
10
6
PA
RT
NE
RS
HIP
PR
OG
RA
MS
AN
D R
ES
OU
RC
ES
Brand USA Trade Show ScheduleBrand USA will also increase its presence at influential international travel shows and
hold a number of sales missions, workshops and seminars that provide partners and
the USA increased visibility and effectiveness in its travel trade outreach and consumer
marketing efforts.
EVENT CITY/COUNTRY DATESCONSUMER (C)/ TRADE (T) TARGET
NUMBER OF VISITORS
TTG Incontri Rimini, Italy October 17-19, 2013 T T: 50,685
Taipei ITF Taipei, Taiwan October 18-19, 2013 T&C T: 18,581 + C: 232,650 = 251, 231
ITB Asia Singapore October 23-25, 2013 T T: 8,500
WTM London, United Kingdom
November 4-7, 2013 T T: 47,776
EIBTM Barcelona, Spain November 19-21, 2013 T T: 9,330
VakantiebeursUtrecht, The Netherlands
January 15-19, 2014 C C: 103,856 (2013)
SATTE New Delhi, India January 29-31, 2014 T T: 7,419 (2013)
FITUR Madrid, Spain January 22-26, 2014 T&C T: 64,473 + C: 91,082 = 155,555 (2013)
BIT Milan, Italy February 13-16, 2014 T&C T: 60,000 + C: 30,000 = 90,000 (2013)
ITB Berlin Berlin, Germany March 5-9, 2014 T&CT: 110,000 + C: 60,000 = 170,000 (2013 prel.)
MITT Moscow, Russia March 19-22, 2014 T&C T: 54,586 + C: 19,179 = 73,765 (2013)
TUR Gothenburg, Sweden March 20-23, 2014 T&C T: 11,700 + C: 21,000 = 32,700 (2013)
WTM Latin America São Paulo, Brazil April 23-25, 2014 T T: 8,000+ (2013)
ATMDubai, United Arab Emirates
May 5-8, 2014 T T: 17,575 (2012)
IMEX Frankfurt, Germany May 20-22, 2014 T T: 8,782 (2012)
HITS Seoul, South Korea TBA, May-June 2014 T&C T+C: 71,000 (2012)
ABAV São Paulo, Brazil TBA, September 2014 T&C T: 28,000 (2012)
FITA Mexico City, Mexico September 25-28, 2014 T&C T+C: 60,000 (2012)
JATA Tokyo, Japan TBA September 2014 T&C T: 49,485 + C: 76,504 = 125,989 (2012)
IFTM Top Resa Paris, France September 23-26, 2014 T T: 28,788 (2012)
TTG Incontri Rimini, Italy October 9-11, 2014 T T: 50,685 (2012)
Taipei ITF Taipei, Taiwan November 7-10, 2014 T&C T+C: 262,590 (2012)
ITB Asia Singapore October 29-31, 2014 T T: 8,500 (2012)
FITBuenos Aires, Argentina
TBA T&C T+C: 92,233 (2012)
International Golf Travel Market
Italy TBA, October 2014 T T: 1,300 (2012)
WTM London, England November 3-6, 2014 T T: 47,425 (2012)
CITM Shanghai, China TBA T&C T+C: 100,000+ (2012)
EIBTM Barcelona, Spain November 18-20, 2014 T T: 15,200 (2012)
AIME Melbourne, Australia February 18-19, 2014 T
BITE Beijing, China June 27-29, 2014 T&C
Tianguis Turístico Quintana Roo, Mexico TBD T
Expoviajes CA San Jose, Costa Rica March 7-9 T&C
NOTE: Schedule also posted on www.TheBrandUSA.com/industry-partners/events

PA
RT
NE
RS
HIP
PR
OG
RA
MS
AN
D R
ES
OU
RC
ES
B
rand
US
A F
Y14
Bu
sine
ss Plan
• 107
Tradeshow DescriptionsTTG IncontriLocation: Rimini, Italy
Date: October 17–19, 2013
Type of Show: Business-to-Business
Background: TTG Incontri is the main international B2B
exhibition on tourism in Italy. It is a marketplace for
negotiations, networking and business between Italian
and international companies and the intermediaries
for tourist products.
Taipei ITFDate: October 18-21, 2013
Location: Taipei, Taiwan
Type of Show: Business-to-Business and Consumer
Background: Taipei ITF brings the world to Taiwan and
presents Taiwan to the world. The ITF B2B Travel Mart is
staged on the day before the fair and the Taiwan Tourism
Bureau specially invites international buyers to Taiwan
to participate.
ITB AsiaDate: October 23-25, 2013
Location: Singapore
Type of Show: Business-to-business
Background: ITB Asia, a three day B2B trade show, is
organized by Messe Berlin (Singapore) Pte Ltd and supported
by the Singapore Exhibition & Convention Bureau.
WTMLocation: London, United Kingdom
Date: November 4–7, 2013
Type of Show: Trade
Background: Staged annually at ExCeL – London, WTM
is a vibrant must-attend business-to-business event
presenting a diverse range of destinations and industry
sectors to global travel professionals. Worldwide buyers
and sellers from every sector of the travel industry come
together at WTM.
EIBTMLocation: Barcelona, Spain
Date: November 19–21, 2013
Type of Show: Business-to-Business
Background: EIBTM is the leading global event for the
meetings and events industry, taking place in the award
winning business and tourism destination of Barcelona.
The event gathers over 15,000 industry professionals
for three days of focused access to a dynamic business
environment, thought provoking professional education
and business networks.
VakantiebeursDate: January 15-19, 2014
Location: Utrecht, The Netherlands
Type of Show: Consumer
Background: The Vakantiebeurs is a major tourism and
leisure fair. Many travel agencies, countries, theaters and
cultural associations from all over the world present
themselves and their countries here. Visit the exhibition
and discover the most interesting and exciting destinations.
Here something is presented for every audience, from
vacation to adventure travel.
FITURDate: January 22-26, 2014
Location: Madrid, Spain
Type of Show: Trade & Consumer
Background: FITUR is a global meeting point for tourism
professionals and the leading trade fair for inbound and
outbound Ibero American markets. Exhibiting companies
from many countries/regions, trade participants, the general
public, and journalists from many countries meet during
FITUR to transform leisure into business and business
into development.
SATTEDate: January 29-31, 2014
Location: New Delhi, India
Type of Show: Trade
Background: SATTE caters to travel, tourism and hospitality
professionals, and provides opportunities to discuss and
learn about economic trends in the airline industry and travel
sector, opportunities for the hospitality industry, and how to
leverage technology.
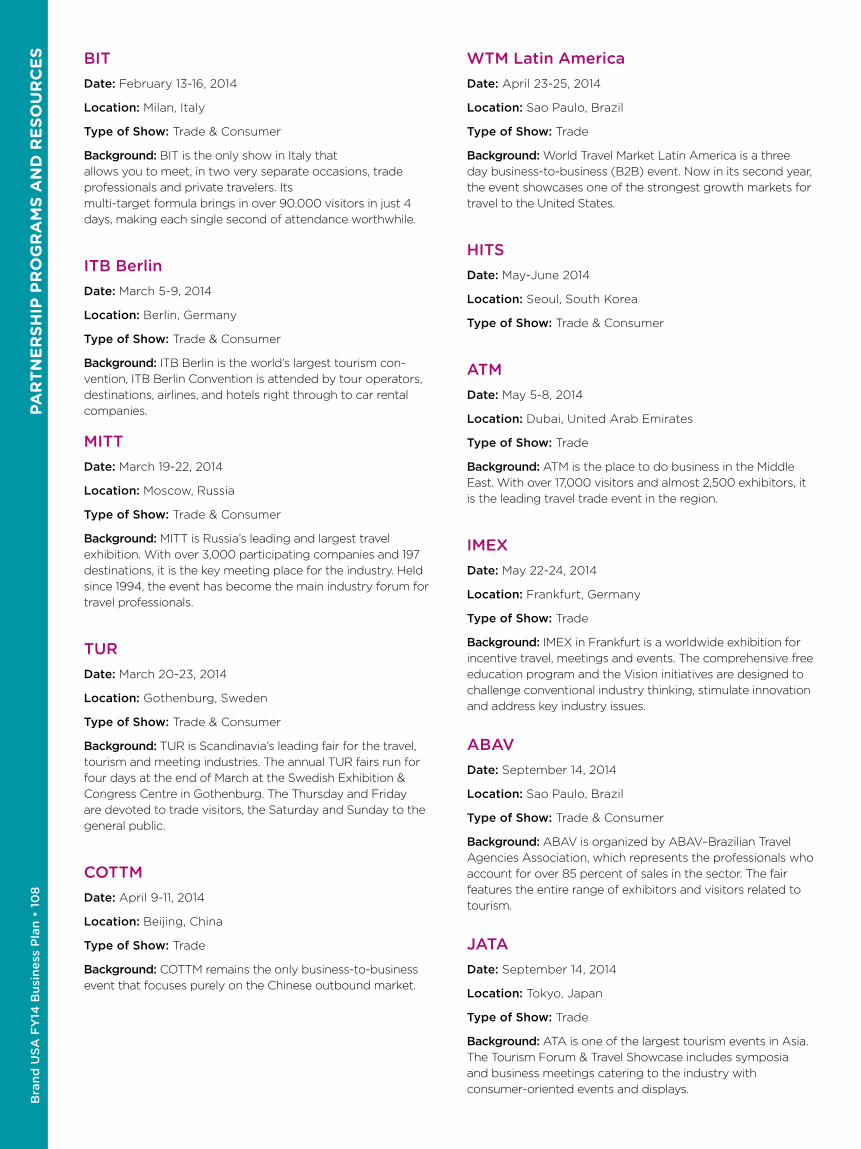
Bra
nd
US
A F
Y14
Bu
sin
ess
Pla
n •
10
8
PA
RT
NE
RS
HIP
PR
OG
RA
MS
AN
D R
ES
OU
RC
ES BIT
Date: February 13-16, 2014
Location: Milan, Italy
Type of Show: Trade & Consumer
Background: BIT is the only show in Italy that
allows you to meet, in two very separate occasions, trade
professionals and private travelers. Its
multi-target formula brings in over 90.000 visitors in just 4
days, making each single second of attendance worthwhile.
ITB BerlinDate: March 5-9, 2014
Location: Berlin, Germany
Type of Show: Trade & Consumer
Background: ITB Berlin is the world’s largest tourism con-
vention, ITB Berlin Convention is attended by tour operators,
destinations, airlines, and hotels right through to car rental
companies.
MITTDate: March 19-22, 2014
Location: Moscow, Russia
Type of Show: Trade & Consumer
Background: MITT is Russia’s leading and largest travel
exhibition. With over 3,000 participating companies and 197
destinations, it is the key meeting place for the industry. Held
since 1994, the event has become the main industry forum for
travel professionals.
TURDate: March 20-23, 2014
Location: Gothenburg, Sweden
Type of Show: Trade & Consumer
Background: TUR is Scandinavia’s leading fair for the travel,
tourism and meeting industries. The annual TUR fairs run for
four days at the end of March at the Swedish Exhibition &
Congress Centre in Gothenburg. The Thursday and Friday
are devoted to trade visitors, the Saturday and Sunday to the
general public.
COTTMDate: April 9-11, 2014
Location: Beijing, China
Type of Show: Trade
Background: COTTM remains the only business-to-business
event that focuses purely on the Chinese outbound market.
WTM Latin AmericaDate: April 23-25, 2014
Location: Sao Paulo, Brazil
Type of Show: Trade
Background: World Travel Market Latin America is a three
day business-to-business (B2B) event. Now in its second year,
the event showcases one of the strongest growth markets for
travel to the United States.
HITSDate: May-June 2014
Location: Seoul, South Korea
Type of Show: Trade & Consumer
ATMDate: May 5-8, 2014
Location: Dubai, United Arab Emirates
Type of Show: Trade
Background: ATM is the place to do business in the Middle
East. With over 17,000 visitors and almost 2,500 exhibitors, it
is the leading travel trade event in the region.
IMEXDate: May 22-24, 2014
Location: Frankfurt, Germany
Type of Show: Trade
Background: IMEX in Frankfurt is a worldwide exhibition for
incentive travel, meetings and events. The comprehensive free
education program and the Vision initiatives are designed to
challenge conventional industry thinking, stimulate innovation
and address key industry issues.
ABAV
Date: September 14, 2014
Location: Sao Paulo, Brazil
Type of Show: Trade & Consumer
Background: ABAV is organized by ABAV–Brazilian Travel
Agencies Association, which represents the professionals who
account for over 85 percent of sales in the sector. The fair
features the entire range of exhibitors and visitors related to
tourism.
JATA
Date: September 14, 2014
Location: Tokyo, Japan
Type of Show: Trade
Background: ATA is one of the largest tourism events in Asia.
The Tourism Forum & Travel Showcase includes symposia
and business meetings catering to the industry with
consumer-oriented events and displays.
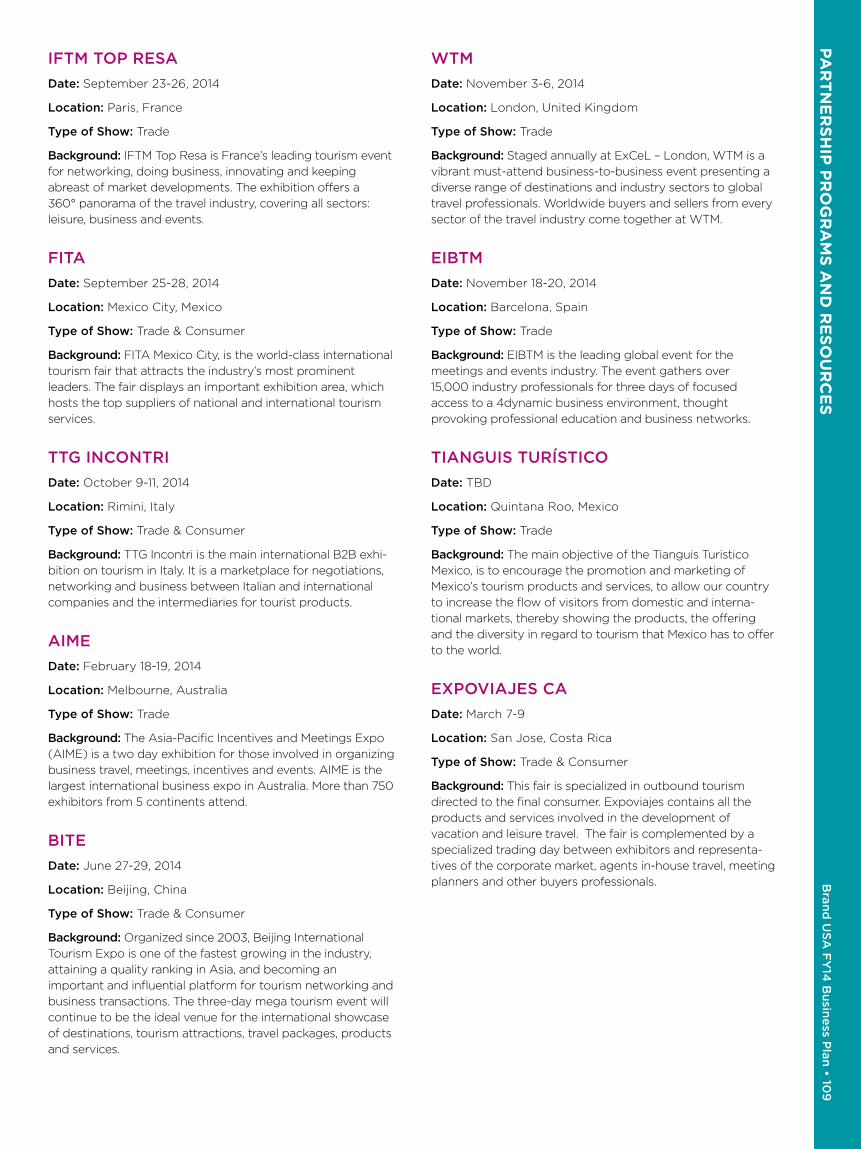
PA
RT
NE
RS
HIP
PR
OG
RA
MS
AN
D R
ES
OU
RC
ES
B
rand
US
A F
Y14
Bu
sine
ss Plan
• 109
IFTM TOP RESA
Date: September 23-26, 2014
Location: Paris, France
Type of Show: Trade
Background: IFTM Top Resa is France’s leading tourism event
for networking, doing business, innovating and keeping
abreast of market developments. The exhibition offers a
360° panorama of the travel industry, covering all sectors:
leisure, business and events.
FITA
Date: September 25-28, 2014
Location: Mexico City, Mexico
Type of Show: Trade & Consumer
Background: FITA Mexico City, is the world-class international
tourism fair that attracts the industry’s most prominent
leaders. The fair displays an important exhibition area, which
hosts the top suppliers of national and international tourism
services.
TTG INCONTRI
Date: October 9-11, 2014
Location: Rimini, Italy
Type of Show: Trade & Consumer
Background: TTG Incontri is the main international B2B exhi-
bition on tourism in Italy. It is a marketplace for negotiations,
networking and business between Italian and international
companies and the intermediaries for tourist products.
AIME
Date: February 18-19, 2014
Location: Melbourne, Australia
Type of Show: Trade
Background: The Asia-Pacific Incentives and Meetings Expo
(AIME) is a two day exhibition for those involved in organizing
business travel, meetings, incentives and events. AIME is the
largest international business expo in Australia. More than 750
exhibitors from 5 continents attend.
BITE
Date: June 27-29, 2014
Location: Beijing, China
Type of Show: Trade & Consumer
Background: Organized since 2003, Beijing International
Tourism Expo is one of the fastest growing in the industry,
attaining a quality ranking in Asia, and becoming an
important and influential platform for tourism networking and
business transactions. The three-day mega tourism event will
continue to be the ideal venue for the international showcase
of destinations, tourism attractions, travel packages, products
and services.
WTM
Date: November 3-6, 2014
Location: London, United Kingdom
Type of Show: Trade
Background: Staged annually at ExCeL – London, WTM is a
vibrant must-attend business-to-business event presenting a
diverse range of destinations and industry sectors to global
travel professionals. Worldwide buyers and sellers from every
sector of the travel industry come together at WTM.
EIBTM
Date: November 18-20, 2014
Location: Barcelona, Spain
Type of Show: Trade
Background: EIBTM is the leading global event for the
meetings and events industry. The event gathers over
15,000 industry professionals for three days of focused
access to a 4dynamic business environment, thought
provoking professional education and business networks.
TIANGUIS TURÍSTICO
Date: TBD
Location: Quintana Roo, Mexico
Type of Show: Trade
Background: The main objective of the Tianguis Turistico
Mexico, is to encourage the promotion and marketing of
Mexico’s tourism products and services, to allow our country
to increase the flow of visitors from domestic and interna-
tional markets, thereby showing the products, the offering
and the diversity in regard to tourism that Mexico has to offer
to the world.
EXPOVIAJES CA
Date: March 7-9
Location: San Jose, Costa Rica
Type of Show: Trade & Consumer
Background: This fair is specialized in outbound tourism
directed to the final consumer. Expoviajes contains all the
products and services involved in the development of
vacation and leisure travel. The fair is complemented by a
specialized trading day between exhibitors and representa-
tives of the corporate market, agents in-house travel, meeting
planners and other buyers professionals.

Bra
nd
US
A F
Y14
Bu
sin
ess
Pla
n •
110
P
AR
TN
ER
SH
IP P
RO
GR
AM
S A
ND
RE
SO
UR
CE
S
Consumer Target and Media / Market Strategy and Campaign ElementsLeveraging and building on the momentum of the campaign launch from May 2012 as
indicated by the pre- and post-wave study conducted by Hall and Partners, as well as the the
deep market intelligence that guided the campaign’s creative development, Brand USA will
continue to use the established creative and incorporate, where applicable, greater partner
integration.
Brand USA Target: A25-59• Universally, local markets recommended targeting a segment, if not all of, adults 25-59
• Core Characteristics: Affluent, educated travelers
• In addition, we will plan media and approach keeping in mind any uniquely identified specific local demographic and/or
psychographic traits to best reach travelers
AUSTRALIA& NEW ZEALAND
BRAZIL
CANADA
CHINA
GERMANY
JAPAN
SOUTH KOREA
MEXICO
TAIWAN
UNITED KINGDOM
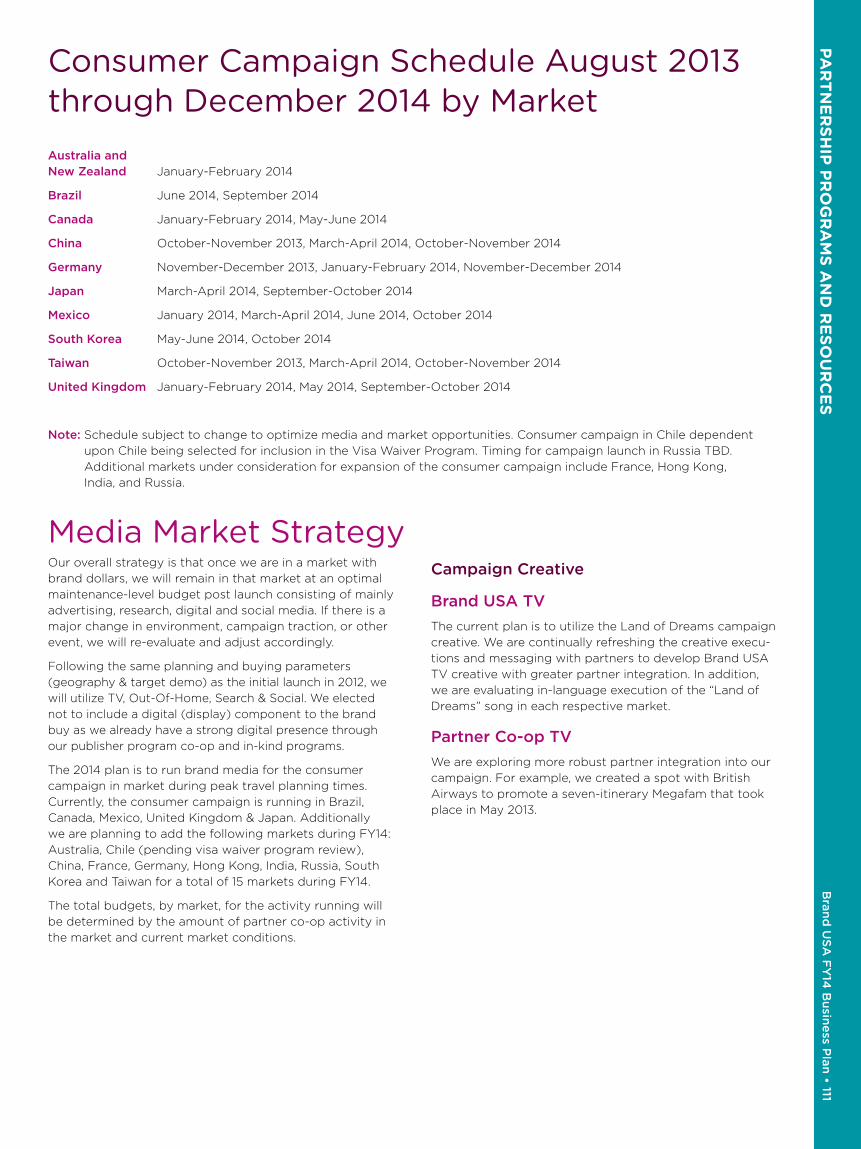
PA
RT
NE
RS
HIP
PR
OG
RA
MS
AN
D R
ES
OU
RC
ES
B
rand
US
A F
Y14
Bu
sine
ss Plan
• 111
Consumer Campaign Schedule August 2013 through December 2014 by MarketAustralia and New Zealand January-February 2014
Brazil June 2014, September 2014
Canada January-February 2014, May-June 2014
China October-November 2013, March-April 2014, October-November 2014
Germany November-December 2013, January-February 2014, November-December 2014
Japan March-April 2014, September-October 2014
Mexico January 2014, March-April 2014, June 2014, October 2014
South Korea May-June 2014, October 2014
Taiwan October-November 2013, March-April 2014, October-November 2014
United Kingdom January-February 2014, May 2014, September-October 2014
Note: Schedule subject to change to optimize media and market opportunities. Consumer campaign in Chile dependent
upon Chile being selected for inclusion in the Visa Waiver Program. Timing for campaign launch in Russia TBD.
Additional markets under consideration for expansion of the consumer campaign include France, Hong Kong,
India, and Russia.
Media Market StrategyOur overall strategy is that once we are in a market with
brand dollars, we will remain in that market at an optimal
maintenance-level budget post launch consisting of mainly
advertising, research, digital and social media. If there is a
major change in environment, campaign traction, or other
event, we will re-evaluate and adjust accordingly.
Following the same planning and buying parameters
(geography & target demo) as the initial launch in 2012, we
will utilize TV, Out-Of-Home, Search & Social. We elected
not to include a digital (display) component to the brand
buy as we already have a strong digital presence through
our publisher program co-op and in-kind programs.
The 2014 plan is to run brand media for the consumer
campaign in market during peak travel planning times.
Currently, the consumer campaign is running in Brazil,
Canada, Mexico, United Kingdom & Japan. Additionally
we are planning to add the following markets during FY14:
Australia, Chile (pending visa waiver program review),
China, France, Germany, Hong Kong, India, Russia, South
Korea and Taiwan for a total of 15 markets during FY14.
The total budgets, by market, for the activity running will
be determined by the amount of partner co-op activity in
the market and current market conditions.
Campaign Creative
Brand USA TV
The current plan is to utilize the Land of Dreams campaign
creative. We are continually refreshing the creative execu-
tions and messaging with partners to develop Brand USA
TV creative with greater partner integration. In addition,
we are evaluating in-language execution of the “Land of
Dreams” song in each respective market.
Partner Co-op TV
We are exploring more robust partner integration into our
campaign. For example, we created a spot with British
Airways to promote a seven-itinerary Megafam that took
place in May 2013.
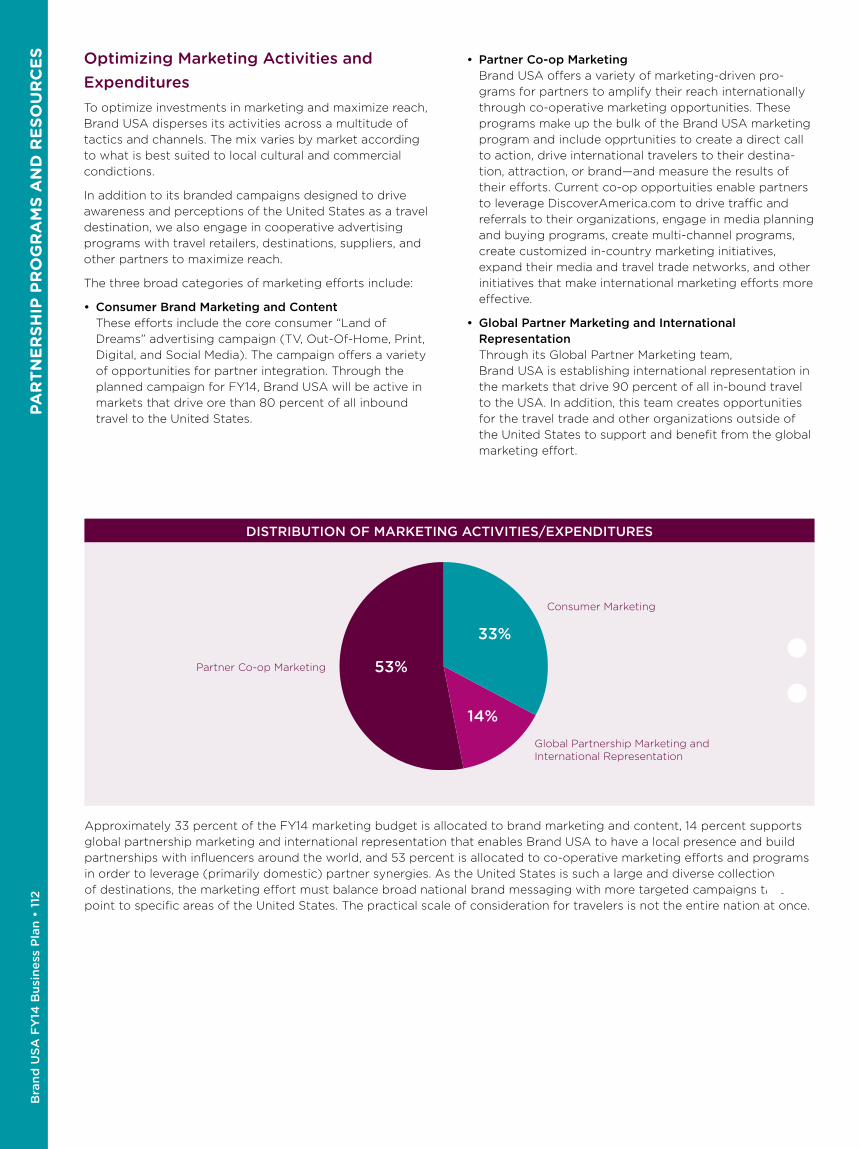
Bra
nd
US
A F
Y14
Bu
sin
ess
Pla
n •
112
P
AR
TN
ER
SH
IP P
RO
GR
AM
S A
ND
RE
SO
UR
CE
S Optimizing Marketing Activities and ExpendituresTo optimize investments in marketing and maximize reach,
Brand USA disperses its activities across a multitude of
tactics and channels. The mix varies by market according
to what is best suited to local cultural and commercial
condictions.
In addition to its branded campaigns designed to drive
awareness and perceptions of the United States as a travel
destination, we also engage in cooperative advertising
programs with travel retailers, destinations, suppliers, and
other partners to maximize reach.
The three broad categories of marketing efforts include:
• Consumer Brand Marketing and Content These efforts include the core consumer “Land of
Dreams” advertising campaign (TV, Out-Of-Home, Print,
Digital, and Social Media). The campaign offers a variety
of opportunities for partner integration. Through the
planned campaign for FY14, Brand USA will be active in
markets that drive ore than 80 percent of all inbound
travel to the United States.
• Partner Co-op Marketing Brand USA offers a variety of marketing-driven pro-
grams for partners to amplify their reach internationally
through co-operative marketing opportunities. These
programs make up the bulk of the Brand USA marketing
program and include opprtunities to create a direct call
to action, drive international travelers to their destina-
tion, attraction, or brand—and measure the results of
their efforts. Current co-op opportuities enable partners
to leverage DiscoverAmerica.com to drive traffic and
referrals to their organizations, engage in media planning
and buying programs, create multi-channel programs,
create customized in-country marketing initiatives,
expand their media and travel trade networks, and other
initiatives that make international marketing efforts more
effective.
• Global Partner Marketing and International Representation Through its Global Partner Marketing team,
Brand USA is establishing international representation in
the markets that drive 90 percent of all in-bound travel
to the USA. In addition, this team creates opportunities
for the travel trade and other organizations outside of
the United States to support and benefit from the global
marketing effort.
DISTRIBUTION OF MARKETING ACTIVITIES/EXPENDITURES
53%
33%
14%
Partner Co-op Marketing
Global Partnership Marketing andInternational Representation
Consumer Marketing
Approximately 33 percent of the FY14 marketing budget is allocated to brand marketing and content, 14 percent supports
global partnership marketing and international representation that enables Brand USA to have a local presence and build
partnerships with influencers around the world, and 53 percent is allocated to co-operative marketing efforts and programs
in order to leverage (primarily domestic) partner synergies. As the United States is such a large and diverse collection
of destinations, the marketing effort must balance broad national brand messaging with more targeted campaigns that
point to specific areas of the United States. The practical scale of consideration for travelers is not the entire nation at once.
TH
E B
RA
ND
US
A T
EA
M
Bran
d U
SA
FY
14 B
usin
ess P
lan • 113
The Brand USA Team

Bra
nd
US
A F
Y14
Bu
sin
ess
Pla
n •
114
T
HE
BR
AN
D U
SA
TE
AM
THE BRAND USA TEAM
Christopher L� Thompson President & Chief Executive Officer
Yvonne La Penotiere Chief Marketing Officer
GLOBAL PARTNERSHIPS
Alfredo GonzalezSenior Vice President
Global Partnerships
Jay GrayVice President,
Global Partnerships
Devon DowManager, Global Partnerships
Suzana DuriniManager, Global Partnerships
Anna KlapperManager, Global Partnerships
Allison SchneiderExecutive Assistant
PARTNER SALES, PROGRAMS & SERVICES
Tom GarzilliSenior Vice President
Amir EylonVice President, Partner Services
Karyn GruenbergVice President, Partner Programs
Patricia McNallyDirector, Partner Services
Tiffany WaddellDirector, Sales
Dianne TurnerRegional Sales Manager
(Southeast)
Cassady BaileyPartner Services Representative
Philip JosephPartner Services Representative
Brian ScreptockIn-Kind Coordinator
Carol BillingsleyExecutive Assistant
Tiwana PerryExecutive Assistant
RESEARCH AND ANALYTICS
Carroll RheemVice President,
Research and Analytics
ADVERTISING AND MEDIA
Roberta HatchettDirector, Advertising and Media
James NamudeProject Manager,
Advertising and Media
DIGITAL MARKETING
Jiri MarousekDirector, Digital Marketing
Talia SalemSpecialist, Social Media
Donald RichardsonChief Financial Officer
Jake ConteDirector and In-House Counsel
Narciso TorrenteDirector, Accounting
Blanca RomeroOffice Manager
Brian WatkinsManager, Information Technology
Odette AlvarezIn-Kind Coordinator
Marc BrooksContracts Assistant
Erika GibsonAccounts Payable Coordinator
James VelasquezCoordinator, Accounts Payable
Maria KafarakisCoordinator, Marketing & Billing
Jennifer RossLegal Assistant
Robyn JordanExecutive Assistant to the CFO
and CMO
Rachael PingueloReceptionist
Anne MadisonChief Communications Officer
Camila ClarkDirector, Marketing
Communications
Michael FullertonDirector, Public Affairs
Aaron Wodin-SchwartzDirector, Public Policy
Judie MacalinoExecutive Administrative Assistant,
Office of the CEO & CCO
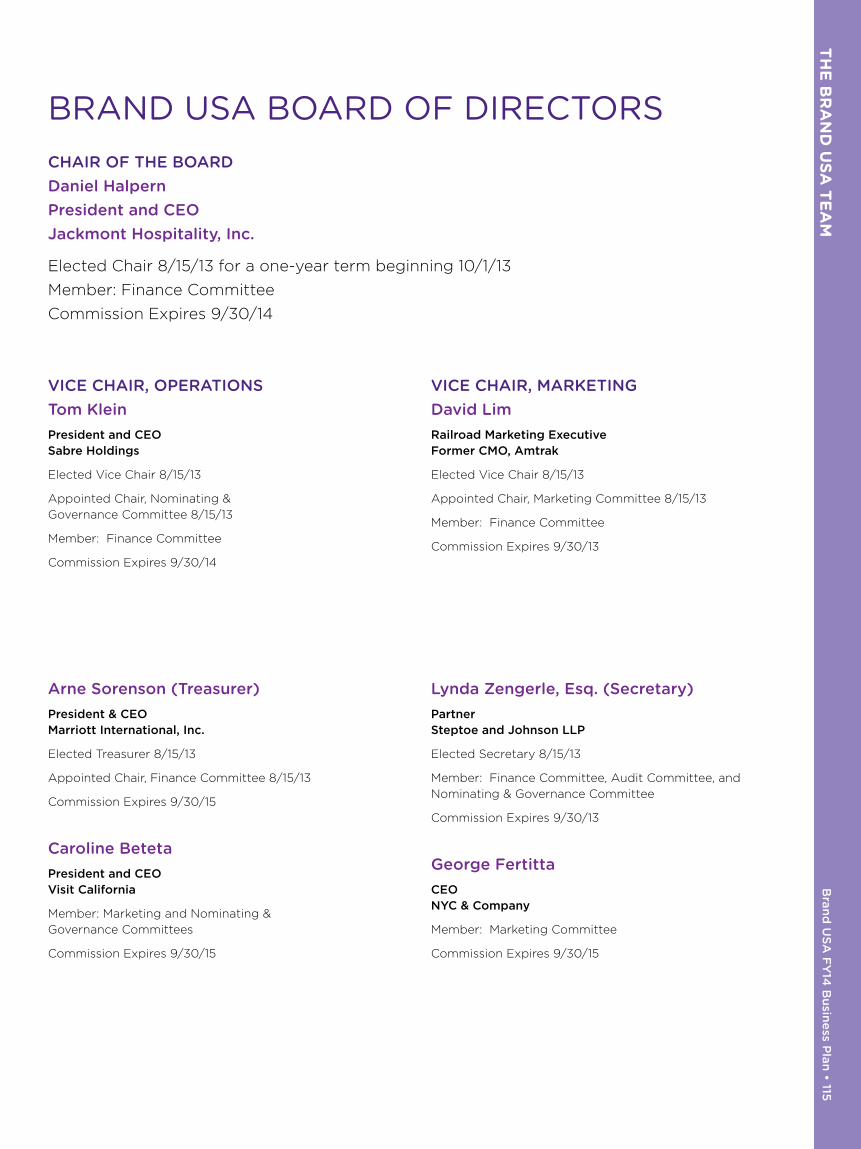
TH
E B
RA
ND
US
A T
EA
M
Bran
d U
SA
FY
14 B
usin
ess P
lan • 115
BRAND USA BOARD OF DIRECTORS CHAIR OF THE BOARDDaniel Halpern President and CEO Jackmont Hospitality, Inc�
Elected Chair 8/15/13 for a one-year term beginning 10/1/13
Member: Finance Committee
Commission Expires 9/30/14
VICE CHAIR, OPERATIONS Tom Klein
President and CEO Sabre Holdings
Elected Vice Chair 8/15/13
Appointed Chair, Nominating &
Governance Committee 8/15/13
Member: Finance Committee
Commission Expires 9/30/14
VICE CHAIR, MARKETING David LimRailroad Marketing Executive Former CMO, Amtrak
Elected Vice Chair 8/15/13
Appointed Chair, Marketing Committee 8/15/13
Member: Finance Committee
Commission Expires 9/30/13
Arne Sorenson (Treasurer)President & CEO Marriott International, Inc.
Elected Treasurer 8/15/13
Appointed Chair, Finance Committee 8/15/13
Commission Expires 9/30/15
Caroline BetetaPresident and CEO Visit California
Member: Marketing and Nominating &
Governance Committees
Commission Expires 9/30/15
Lynda Zengerle, Esq� (Secretary)Partner Steptoe and Johnson LLP
Elected Secretary 8/15/13
Member: Finance Committee, Audit Committee, and
Nominating & Governance Committee
Commission Expires 9/30/13
George FertittaCEO NYC & Company
Member: Marketing Committee
Commission Expires 9/30/15

Bra
nd
US
A F
Y14
Bu
sin
ess
Pla
n •
116
T
HE
BR
AN
D U
SA
TE
AM
Randy GarfieldExecutive Vice President, Worldwide Sales & Travel Operations Disney Destinations, and President, Walt Disney Travel Company
Member: Audit and Marketing Committees
Commission Expires 9/30/13
Mark SchwabCEO Star Alliance Services GmbH
Member: Audit Committee
Commission Expires 9/30/13
Diane ShoberState Tourism Director Wyoming Office of Tourism
Member: Governance & Nominating
and Marketing Committees
Commission Expires 9/30/14
Roy YamaguchiOwner & Founder Roy’s Restaurant
Appointed Chair, Audit Committee 8/15/13
Commission Expires 9/30/15
Board CommitteesCommittee Members Elected and Committee Chairs Appointed 8/15/13 for one-year terms
beginning 10/1/13
Finance Committee Audit CommitteeGovernance &
Nominating Committee Marketing Committee
Arne Sorenson, Chair
Daniel Halpern
Tom Klein
David Lim
Lynda Zengerle, Esq.
Roy Yamaguchi, Chair
Randy Garfield
Mark Schwab
Lynda Zengerle, Esq.
Tom Klein, Chair
Caroline Beteta
Diane Shober
Lynda Zengerle, Esq.
David Lim, Chair
Caroline Beteta
George Fertitta
Randy Garfield
Diane Shober
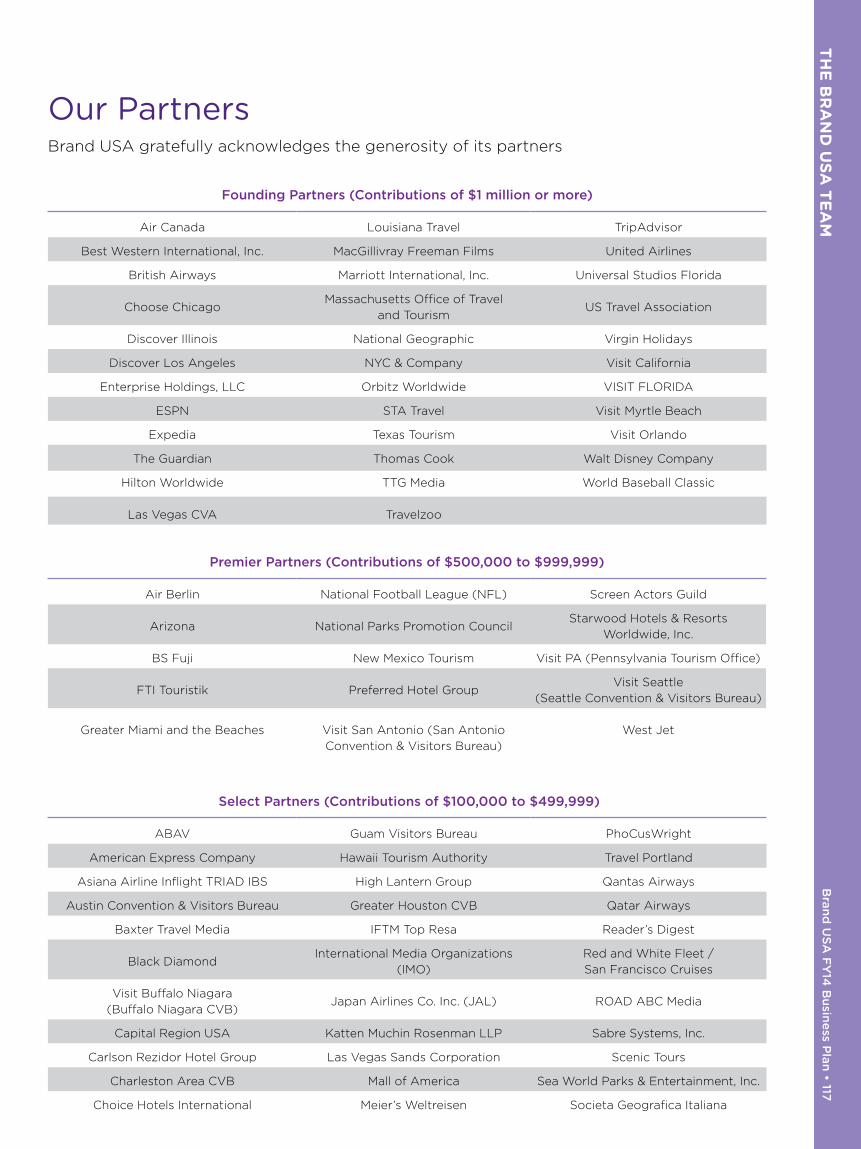
TH
E B
RA
ND
US
A T
EA
M
Bran
d U
SA
FY
14 B
usin
ess P
lan • 117
Our PartnersBrand USA gratefully acknowledges the generosity of its partners
Founding Partners (Contributions of $1 million or more)
Air Canada Louisiana Travel TripAdvisor
Best Western International, Inc. MacGillivray Freeman Films United Airlines
British Airways Marriott International, Inc. Universal Studios Florida
Choose ChicagoMassachusetts Office of Travel
and TourismUS Travel Association
Discover Illinois National Geographic Virgin Holidays
Discover Los Angeles NYC & Company Visit California
Enterprise Holdings, LLC Orbitz Worldwide VISIT FLORIDA
ESPN STA Travel Visit Myrtle Beach
Expedia Texas Tourism Visit Orlando
The Guardian Thomas Cook Walt Disney Company
Hilton Worldwide TTG Media World Baseball Classic
Las Vegas CVA Travelzoo
Premier Partners (Contributions of $500,000 to $999,999)
Air Berlin National Football League (NFL) Screen Actors Guild
Arizona National Parks Promotion CouncilStarwood Hotels & Resorts
Worldwide, Inc.
BS Fuji New Mexico Tourism Visit PA (Pennsylvania Tourism Office)
FTI Touristik Preferred Hotel GroupVisit Seattle
(Seattle Convention & Visitors Bureau)
Greater Miami and the Beaches Visit San Antonio (San Antonio
Convention & Visitors Bureau)
West Jet
Select Partners (Contributions of $100,000 to $499,999)
ABAV Guam Visitors Bureau PhoCusWright
American Express Company Hawaii Tourism Authority Travel Portland
Asiana Airline Inflight TRIAD IBS High Lantern Group Qantas Airways
Austin Convention & Visitors Bureau Greater Houston CVB Qatar Airways
Baxter Travel Media IFTM Top Resa Reader’s Digest
Black DiamondInternational Media Organizations
(IMO)
Red and White Fleet /
San Francisco Cruises
Visit Buffalo Niagara
(Buffalo Niagara CVB)Japan Airlines Co. Inc. (JAL) ROAD ABC Media
Capital Region USA Katten Muchin Rosenman LLP Sabre Systems, Inc.
Carlson Rezidor Hotel Group Las Vegas Sands Corporation Scenic Tours
Charleston Area CVB Mall of America Sea World Parks & Entertainment, Inc.
Choice Hotels International Meier’s Weltreisen Societa Geografica Italiana
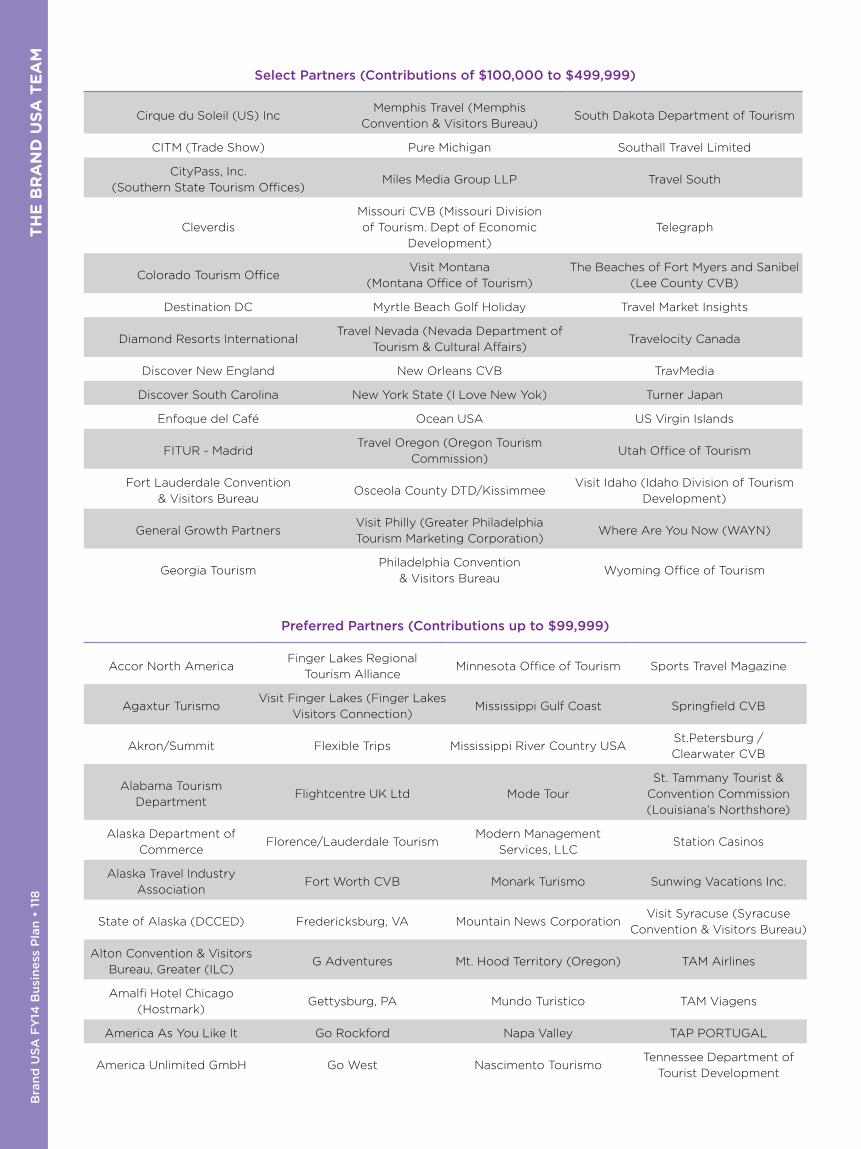
Bra
nd
US
A F
Y14
Bu
sin
ess
Pla
n •
118
T
HE
BR
AN
D U
SA
TE
AM
Select Partners (Contributions of $100,000 to $499,999)
Cirque du Soleil (US) IncMemphis Travel (Memphis
Convention & Visitors Bureau)South Dakota Department of Tourism
CITM (Trade Show) Pure Michigan Southall Travel Limited
CityPass, Inc.
(Southern State Tourism Offices)Miles Media Group LLP Travel South
Cleverdis
Missouri CVB (Missouri Division
of Tourism. Dept of Economic
Development)
Telegraph
Colorado Tourism OfficeVisit Montana
(Montana Office of Tourism)
The Beaches of Fort Myers and Sanibel
(Lee County CVB)
Destination DC Myrtle Beach Golf Holiday Travel Market Insights
Diamond Resorts InternationalTravel Nevada (Nevada Department of
Tourism & Cultural Affairs)Travelocity Canada
Discover New England New Orleans CVB TravMedia
Discover South Carolina New York State (I Love New Yok) Turner Japan
Enfoque del Café Ocean USA US Virgin Islands
FITUR - MadridTravel Oregon (Oregon Tourism
Commission)Utah Office of Tourism
Fort Lauderdale Convention
& Visitors BureauOsceola County DTD/Kissimmee
Visit Idaho (Idaho Division of Tourism
Development)
General Growth PartnersVisit Philly (Greater Philadelphia
Tourism Marketing Corporation)Where Are You Now (WAYN)
Georgia TourismPhiladelphia Convention
& Visitors BureauWyoming Office of Tourism
Preferred Partners (Contributions up to $99,999)
Accor North AmericaFinger Lakes Regional
Tourism AllianceMinnesota Office of Tourism Sports Travel Magazine
Agaxtur TurismoVisit Finger Lakes (Finger Lakes
Visitors Connection)Mississippi Gulf Coast Springfield CVB
Akron/Summit Flexible Trips Mississippi River Country USASt.Petersburg /
Clearwater CVB
Alabama Tourism
DepartmentFlightcentre UK Ltd Mode Tour
St. Tammany Tourist &
Convention Commission
(Louisiana’s Northshore)
Alaska Department of
CommerceFlorence/Lauderdale Tourism
Modern Management
Services, LLCStation Casinos
Alaska Travel Industry
AssociationFort Worth CVB Monark Turismo Sunwing Vacations Inc.
State of Alaska (DCCED) Fredericksburg, VA Mountain News CorporationVisit Syracuse (Syracuse
Convention & Visitors Bureau)
Alton Convention & Visitors
Bureau, Greater (ILC)G Adventures Mt. Hood Territory (Oregon) TAM Airlines
Amalfi Hotel Chicago
(Hostmark)Gettysburg, PA Mundo Turistico TAM Viagens
America As You Like It Go Rockford Napa Valley TAP PORTUGAL
America Unlimited GmbH Go West Nascimento TourismoTennessee Department of
Tourist Development
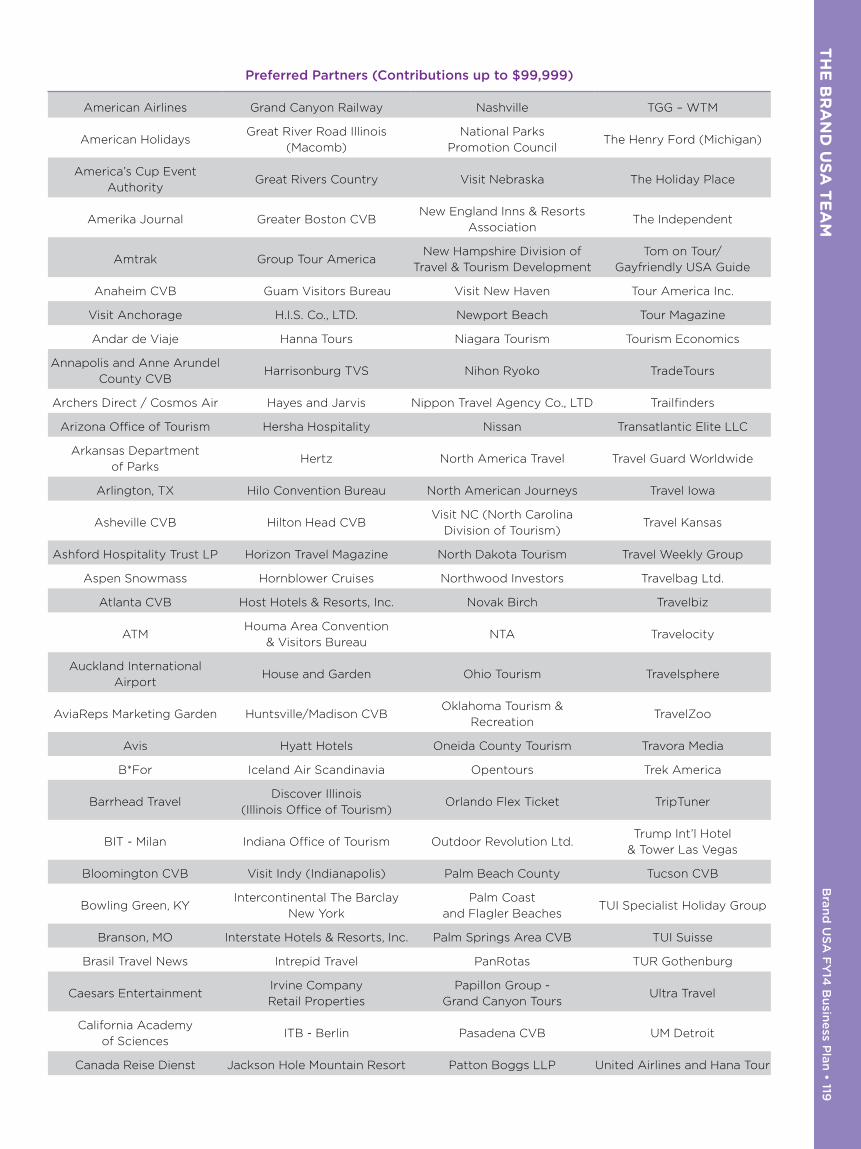
TH
E B
RA
ND
US
A T
EA
M
Bran
d U
SA
FY
14 B
usin
ess P
lan • 119
Preferred Partners (Contributions up to $99,999)
American Airlines Grand Canyon Railway Nashville TGG – WTM
American HolidaysGreat River Road Illinois
(Macomb)
National Parks
Promotion CouncilThe Henry Ford (Michigan)
America’s Cup Event
AuthorityGreat Rivers Country Visit Nebraska The Holiday Place
Amerika Journal Greater Boston CVBNew England Inns & Resorts
AssociationThe Independent
Amtrak Group Tour AmericaNew Hampshire Division of
Travel & Tourism Development
Tom on Tour/
Gayfriendly USA Guide
Anaheim CVB Guam Visitors Bureau Visit New Haven Tour America Inc.
Visit Anchorage H.I.S. Co., LTD. Newport Beach Tour Magazine
Andar de Viaje Hanna Tours Niagara Tourism Tourism Economics
Annapolis and Anne Arundel
County CVBHarrisonburg TVS Nihon Ryoko TradeTours
Archers Direct / Cosmos Air Hayes and Jarvis Nippon Travel Agency Co., LTD Trailfinders
Arizona Office of Tourism Hersha Hospitality Nissan Transatlantic Elite LLC
Arkansas Department
of ParksHertz North America Travel Travel Guard Worldwide
Arlington, TX Hilo Convention Bureau North American Journeys Travel Iowa
Asheville CVB Hilton Head CVBVisit NC (North Carolina
Division of Tourism)Travel Kansas
Ashford Hospitality Trust LP Horizon Travel Magazine North Dakota Tourism Travel Weekly Group
Aspen Snowmass Hornblower Cruises Northwood Investors Travelbag Ltd.
Atlanta CVB Host Hotels & Resorts, Inc. Novak Birch Travelbiz
ATMHouma Area Convention
& Visitors BureauNTA Travelocity
Auckland International
AirportHouse and Garden Ohio Tourism Travelsphere
AviaReps Marketing Garden Huntsville/Madison CVBOklahoma Tourism &
RecreationTravelZoo
Avis Hyatt Hotels Oneida County Tourism Travora Media
B*For Iceland Air Scandinavia Opentours Trek America
Barrhead TravelDiscover Illinois
(Illinois Office of Tourism)Orlando Flex Ticket TripTuner
BIT - Milan Indiana Office of Tourism Outdoor Revolution Ltd.Trump Int’l Hotel
& Tower Las Vegas
Bloomington CVB Visit Indy (Indianapolis) Palm Beach County Tucson CVB
Bowling Green, KYIntercontinental The Barclay
New York
Palm Coast
and Flagler BeachesTUI Specialist Holiday Group
Branson, MO Interstate Hotels & Resorts, Inc. Palm Springs Area CVB TUI Suisse
Brasil Travel News Intrepid Travel PanRotas TUR Gothenburg
Caesars EntertainmentIrvine Company
Retail Properties
Papillon Group -
Grand Canyon ToursUltra Travel
California Academy
of SciencesITB - Berlin Pasadena CVB UM Detroit
Canada Reise Dienst Jackson Hole Mountain Resort Patton Boggs LLP United Airlines and Hana Tour
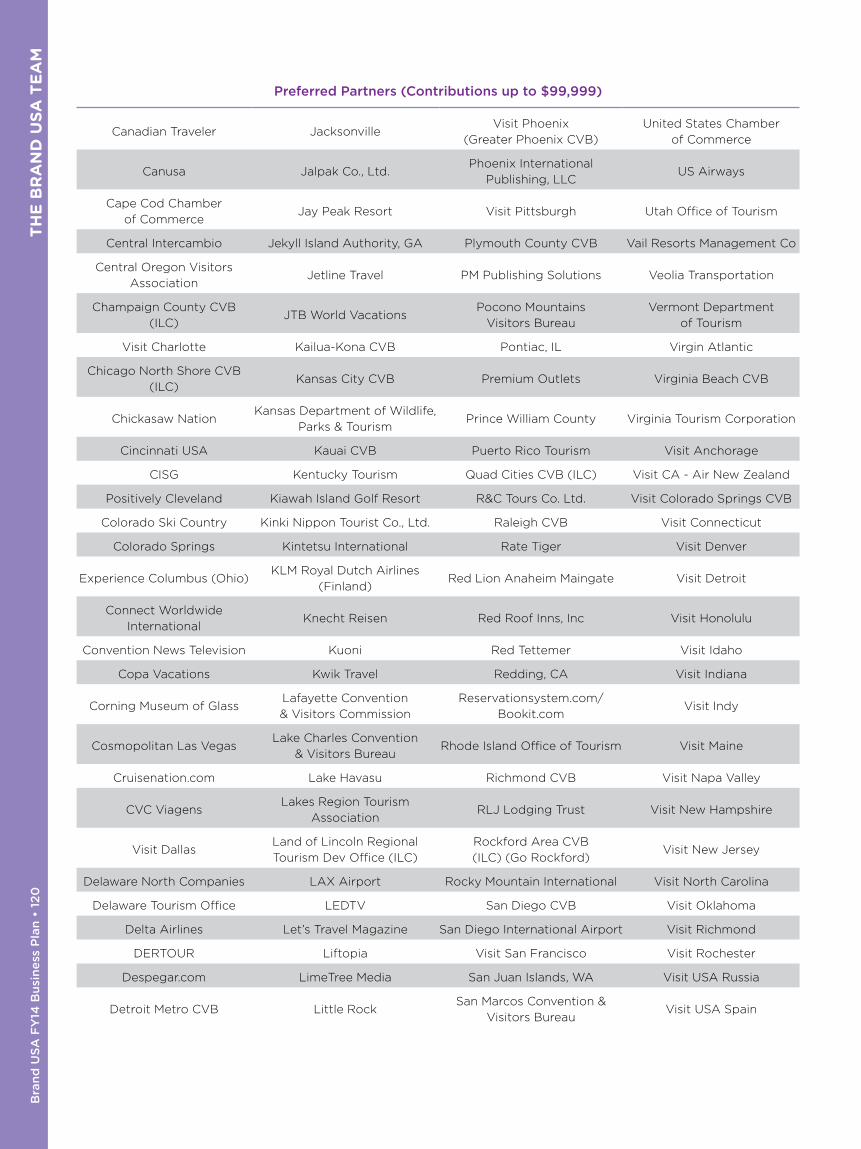
Bra
nd
US
A F
Y14
Bu
sin
ess
Pla
n •
12
0
TH
E B
RA
ND
US
A T
EA
M
Preferred Partners (Contributions up to $99,999)
Canadian Traveler JacksonvilleVisit Phoenix
(Greater Phoenix CVB)
United States Chamber
of Commerce
Canusa Jalpak Co., Ltd.Phoenix International
Publishing, LLCUS Airways
Cape Cod Chamber
of CommerceJay Peak Resort Visit Pittsburgh Utah Office of Tourism
Central Intercambio Jekyll Island Authority, GA Plymouth County CVB Vail Resorts Management Co
Central Oregon Visitors
AssociationJetline Travel PM Publishing Solutions Veolia Transportation
Champaign County CVB
(ILC)JTB World Vacations
Pocono Mountains
Visitors Bureau
Vermont Department
of Tourism
Visit Charlotte Kailua-Kona CVB Pontiac, IL Virgin Atlantic
Chicago North Shore CVB
(ILC)Kansas City CVB Premium Outlets Virginia Beach CVB
Chickasaw NationKansas Department of Wildlife,
Parks & TourismPrince William County Virginia Tourism Corporation
Cincinnati USA Kauai CVB Puerto Rico Tourism Visit Anchorage
CISG Kentucky Tourism Quad Cities CVB (ILC) Visit CA - Air New Zealand
Positively Cleveland Kiawah Island Golf Resort R&C Tours Co. Ltd. Visit Colorado Springs CVB
Colorado Ski Country Kinki Nippon Tourist Co., Ltd. Raleigh CVB Visit Connecticut
Colorado Springs Kintetsu International Rate Tiger Visit Denver
Experience Columbus (Ohio)KLM Royal Dutch Airlines
(Finland)Red Lion Anaheim Maingate Visit Detroit
Connect Worldwide
InternationalKnecht Reisen Red Roof Inns, Inc Visit Honolulu
Convention News Television Kuoni Red Tettemer Visit Idaho
Copa Vacations Kwik Travel Redding, CA Visit Indiana
Corning Museum of GlassLafayette Convention
& Visitors Commission
Reservationsystem.com/
Bookit.comVisit Indy
Cosmopolitan Las VegasLake Charles Convention
& Visitors BureauRhode Island Office of Tourism Visit Maine
Cruisenation.com Lake Havasu Richmond CVB Visit Napa Valley
CVC ViagensLakes Region Tourism
AssociationRLJ Lodging Trust Visit New Hampshire
Visit DallasLand of Lincoln Regional
Tourism Dev Office (ILC)
Rockford Area CVB
(ILC) (Go Rockford)Visit New Jersey
Delaware North Companies LAX Airport Rocky Mountain International Visit North Carolina
Delaware Tourism Office LEDTV San Diego CVB Visit Oklahoma
Delta Airlines Let’s Travel Magazine San Diego International Airport Visit Richmond
DERTOUR Liftopia Visit San Francisco Visit Rochester
Despegar.com LimeTree Media San Juan Islands, WA Visit USA Russia
Detroit Metro CVB Little RockSan Marcos Convention &
Visitors BureauVisit USA Spain

TH
E B
RA
ND
US
A T
EA
M
Bran
d U
SA
FY
14 B
usin
ess P
lan • 12
1
Preferred Partners (Contributions up to $99,999)
Diversity Tourism UG Lonely Planet Santa Barbara CVB Visit West Hollywood
DMAI (Destination Marketing
Association International)Visit Loudon County
Santa Cruz County Conference
and Visitors CouncilVisit Oakland
DNC Parks and Resorts
at YosemiteLove Beverly Hills Santa Fe CVB Warren County, OH
Donohoe Hospitality Services LVH Hotel Las Vegas Santa Monica CVB Washington Tourism Alliance
Discover Dupage Macon, GA Visit Sarasota Watkins Glen International
Durango, CO Macy’s SATTEWest Hollywood Marketing
& Visitor’s Bureau
Econo Lodge Times Square Maine Office of Tourism Visit Savannah
West Virginia Tourism (West
Virginia Department of
Commerce)
Elvis Presley Enterprises Mammoth Lakes Tourism Schneider / Sports TravelWhite Mountains Attractions
(NH)
Empire Hotel Marianas Tourism Board Scottsdale CVBWhite Pass Scenic Byway
- WA
Empire State Building
Observatory
Marriott Vacation Club
International
Sedona Chamber of
CommerceWiechmann Tourism Service
enVision Hotel Martin County Serino/Coyne Williams Grand
ES Tour Maryland Office of TourismShenandoah Valley Travel
AssociationWine, Water, Wonders
Essentially America Maui CVB Shop America AllianceWisconsin Department of
Tourism
Explore Saint Louis Meet Chicago Northwest (ILC) Smithfield Source Media WTM - London
Explorer Fernreisen Meltwater SoftTravel Wynn Las Vegas
Explore Fairbanks Mendocino County Sonoma County Tourism Yosemite National Park
Fairmont Hotels & Resorts MGM Mirage Las VegasSouth Street Seaport
& MuseumYosemite Sierra
Fairmont Raffles Hotels Int’l
Pte LtdMGM Resorts Space Coast, FL
Yosemite/Mariposa County
Tourism Bureau
FelCor Lodging Trust
IncorporatedExplore Minnesota Visit Spokane
Bra
nd
US
A F
Y14
Bu
sin
ess
Pla
n •
12
2
TH
E B
RA
ND
US
A T
EA
M
Our Shared Commitment As we execute the strategies outlined in our business plan this year and for years to come,
our shared commitment is that we will conduct our business with integrity, in collaboration
with key stakeholders, and with a focus on results.
We will accomplish this by demonstrating our commitment to our mission, our vision, and
our values—and continually working to create and pursue a shared vision with all of our
public and private partners.
Integrity and TransparencyFirst and foremost, we will meet the requirements of the Travel Promotion Act—in both the letter and spirit of the law.
We will work to do the right thing in our day-to-day operations, and are committed to fiscal integrity, accountability, and
sound financial management through transparency and collaboration with our government partners.
We will provide timely updates on our progress and open access to information that the public, our partners and govern-
ment officials are entitled to request and receive.
We will establish and follow a clear and rational valuation and submission process for evaluating in-kind contributions and
receiving matching funds for cash and in-kind contributions.
We will follow procurement processes and policies that demonstrate our commitment to integrity, transparency, and doing
what’s best for our partners and the achievement of our long-term mission.
CollaborationWe will develop a superior understanding of what our partners need and want—with a focus on doing what local tourism
and travel entities cannot do for themselves and providing programs that support their ability to achieve their strategic
objectives as we pursue our mandate of welcoming more international travelers to the USA.
We will work collaboratively with our stakeholders to develop innovative programs and initiatives that support our mission.
We will only offer and promote programs once all parties have a clear understanding of how they work, their intended
results, and how they will be valued and matched with public funds, as well as what the specific requirements, roles and
responsibilities are of each party to execute these programs, including having all required agreements in place and fully
executed in advance.
We will develop close, mutually productive relationships with our program partners, suppliers, the travel industry, and the
U.S. government and will work with each of them in ways that are good for all of us.
We will communicate early and often with all of our stakeholders—with an unwavering goal of building trust by sharing
information and seeking input on an ongoing basis.
Superior Marketing and Teams that Drive ResultsWe will develop superior marketing capable of giving us a clear and sustainable advantage as we compete for a growing
share of international in-bound travelers.
We will build high-caliber talent internally and a strong network of in-country market representation to best maximize our
marketing reach, efficiency and effectiveness in key markets that have the most potential to increase international visitation
to the United States.
We will demonstrate a strong return on investment for all of our activities by reporting the results of our efforts and
campaigns with qualitative and quantitative data based on sound market research, analysis, and pre-established metrics
that support our reason for being.
We will focus our efforts on programs, marketing, and collaborative, open communication as mandated by the Travel
Promotion Act—leaving politics to those organizations and individuals that have that right and responsibility.
As a leadership team, and on behalf of everyone at Brand USA, we fully recognize and respect the compelling case for
marketing the United States as a premier travel destination in order to strengthen our nation’s economy by generating
hundreds of thousands of jobs annually.

TH
E B
RA
ND
US
A T
EA
M
Bran
d U
SA
FY
14 B
usin
ess P
lan • 12
3
While specific objectives, goals, timelines, budgets, accountabilities, and results will be published each year in our business
plan, we realize that the true measure of our success will be the degree by which we increase international visitation and
spend and our country benefits in economic prosperity and growth as a result of our efforts.
Together we are Brand USA.
Christopher L. Thompson
President & CEO
Yvonne La Penotiere
Chief Marketing Officer
Anne Madison
Chief Communications Officer
Donald Richardson
Chief Financial Officer
Bra
nd
US
A F
Y14
Bu
sin
ess
Pla
n •
124
T
HE
BR
AN
D U
SA
TE
AM
Key Contact Information Our Social Media ChannelsTo follow our progress and announcements of new initiatives, please connect with us on these social media channels.
Travel Industry Information@BrandUSA on Twitter
Consumer Information@DiscoverAmerica on Twitter
Facebook.com/DiscoverAmerica
Our WebsitesFor industry or partner information about Brand USA, please visit www.TheBrandUSA.com.
For information about exceptional and unexpected travel experiences in the United States, please visit Brand USA’s
consumer website at www.DiscoverAmerica.com.

1725 Eye Street NW • Suite 800
Washington, DC 20006 • 202-536-2060
www.TheBrandUSA.com
www.DiscoverAmerica.com