Embed Size (px)
Citation preview

Data Visualization in Cancer Control
Bradford W. Hesse, PhDChief, Health Communication & Informatics ResearchNational Cancer Institute

In 2005, 61.6% (+/- 1.6) of Americans thought of cancer as a death sentence.
Is it?

In 2015, news outlets reported that cancer is “just bad luck.”
Is that right?

What do the Data Say? What researchers found:
Correlation between • Type of cell (frequent / infrequent
division) &• Life time risk (not luck vs. cause)
“It’s like ... traffic patterns. There is a tight correlation between the number
of cars on the roads and the number of accidents, but that doesn’t mean that it’s
pure bad luck if you have an accident.
Bad luck is not scientific: Many cases can be prevented”

Age-Adjusted Mortality: Trend

Unpacking Trend: Males
public health control of h-pylori
public health control of tobacco
early detection, better treatment

Unpacking Trend: Females
public health control of h-pylori
public health control of tobacco
early detection, better treatment


224,210
preventable,

371,040
detectable, treatable

604,040
detectable, treatable
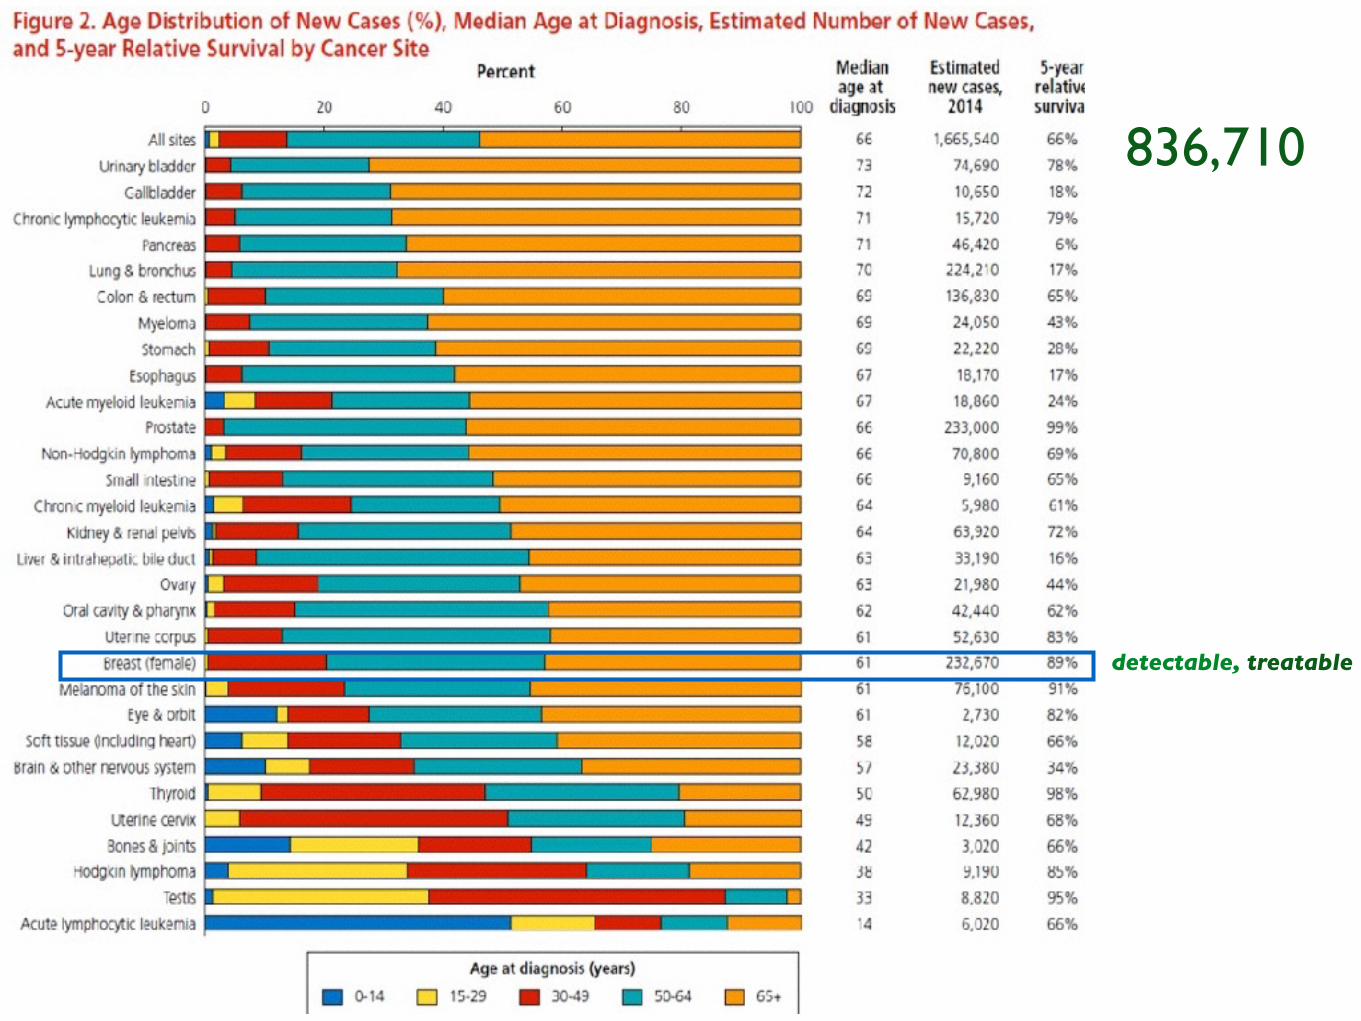
836,710
detectable, treatable


Just a 1% reduction would save $400 billion

Confusion Can Cost LivesPhilip Morris CEO, 1971

Confusion Can Cost Lives
“Selling Scientific Doubt”
Tobacco Lobby Document found through Discovery

Confusion Can Cost Lives
Do vaccines cause autism?
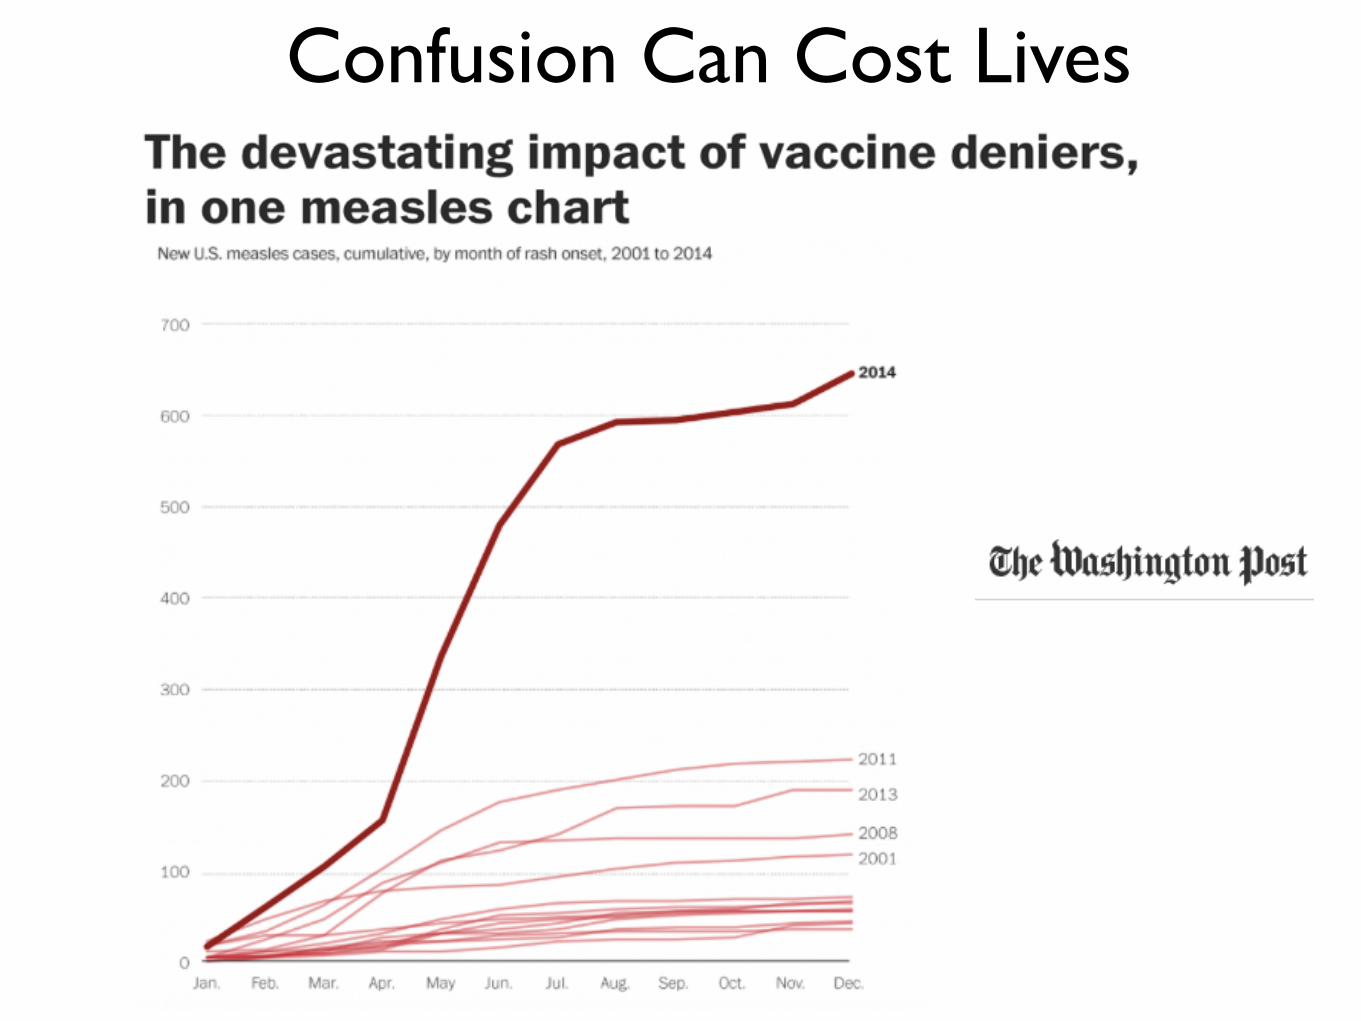
Confusion Can Cost Lives

Confusion Can Cost Lives
“One in four people in the United States—nearly 80 million—are infected with at least one type of
human papillomavirus (HPV)”

Confusion Can Cost Lives
Decision Paralysis
Anxiety
Confusion
Impulsivity
Frustration, Anger

Confusion Can Cost Lives
Poorly DesignedData Displays

Making Data Talk
Inform Support Decisions
Educate Persuade
Nelson, Hesse, Croyle, 2009

Knowledge in the Head*
Knowledge in The World*
Task Relevant Schemata
General model

Chapter 4: Visual Displays

SOURCE: http://alleydog.com/topics/sensation_and_perception.php
Perceptual Basics

source: Carpenter PA, Shah P. A model of the perceptual and conceptual processes in graph comprehension. J Educ Psychol. 1999, 91(4): 690-702.
• Constructive process
• Gaze goes to center for pattern
• Contiguous labels for meaning
• Left to right tendency in western culture
• Perceptual rules guide meaning
Cognitive / Perceptual Research

source: Carpenter PA, Shah P. A model of the perceptual and conceptual processes in graph comprehension. J Educ Psychol. 1999, 91(4): 690-702.
• Constructive process
• Gaze goes to center for pattern
• Contiguous labels for meaning
• Left to right tendency in western culture
• Perceptual rules guide meaning
Visualizing Long Term Change

• Constructive process
• Gaze goes to center for pattern
• Contiguous labels for meaning
• Left to right tendency in western culture
• Perceptual rules guide meaning
Hans Rosling, BBC
Visualizing Change Dynamically

Monitoring for Change in EHR Systems
Aging In Place, IntelRule of Thumb* for “Big Data” Systems
• Overview
• Zoom / filter
• Details on demand
*Ben Shneiderman

Overcome “small numbers” bias

Exceptional Case
Fallacy of small numbers;Tversky & Kahneman, 1971
Illnesses322,000,000
Hospitalizations21,000,000
Prevented
Deaths732,000

See: Fagerlin, A., Ubel, P. A., Smith, D. M., & Zikmund-Fisher, B. J. (2007). Making numbers matter: present and future research in risk communication. Am J Health Behav, 31 Suppl 1, S47-56.
Icon arrays designed to convey natural frequencies

Portraying trends to policy makersChoropleth Maps: CDC Obesity Trends, BRFSS 1985

Nonsegmented geographic data
Isopleth “Weather Maps,” HINTS

Juxtaposing geographic distributionsFor Example: Knowledge Maps (HINTS): Does Smoking Cause Cancer?

Juxtaposing geographic distributions
Mortality Maps (SEER): Lung Cancer Mortality
For Example: Knowledge Maps (HINTS): Does Smoking Cause Cancer?

Added User Controls 14 datasets spanning 6 years
NSF, NIH Collaboration
Disolving Barriers Between Clinical and Community Health
source: Hesse, Bradford W. (2007). Public Health Informatics. In M. C. Gibbons (Ed.), eHealth Solutions for Healthcare Disparities (pp. 109-129). New York, NY: Springer.

Why is this Important?

National Committee on Vital and Health Statistics, 2001


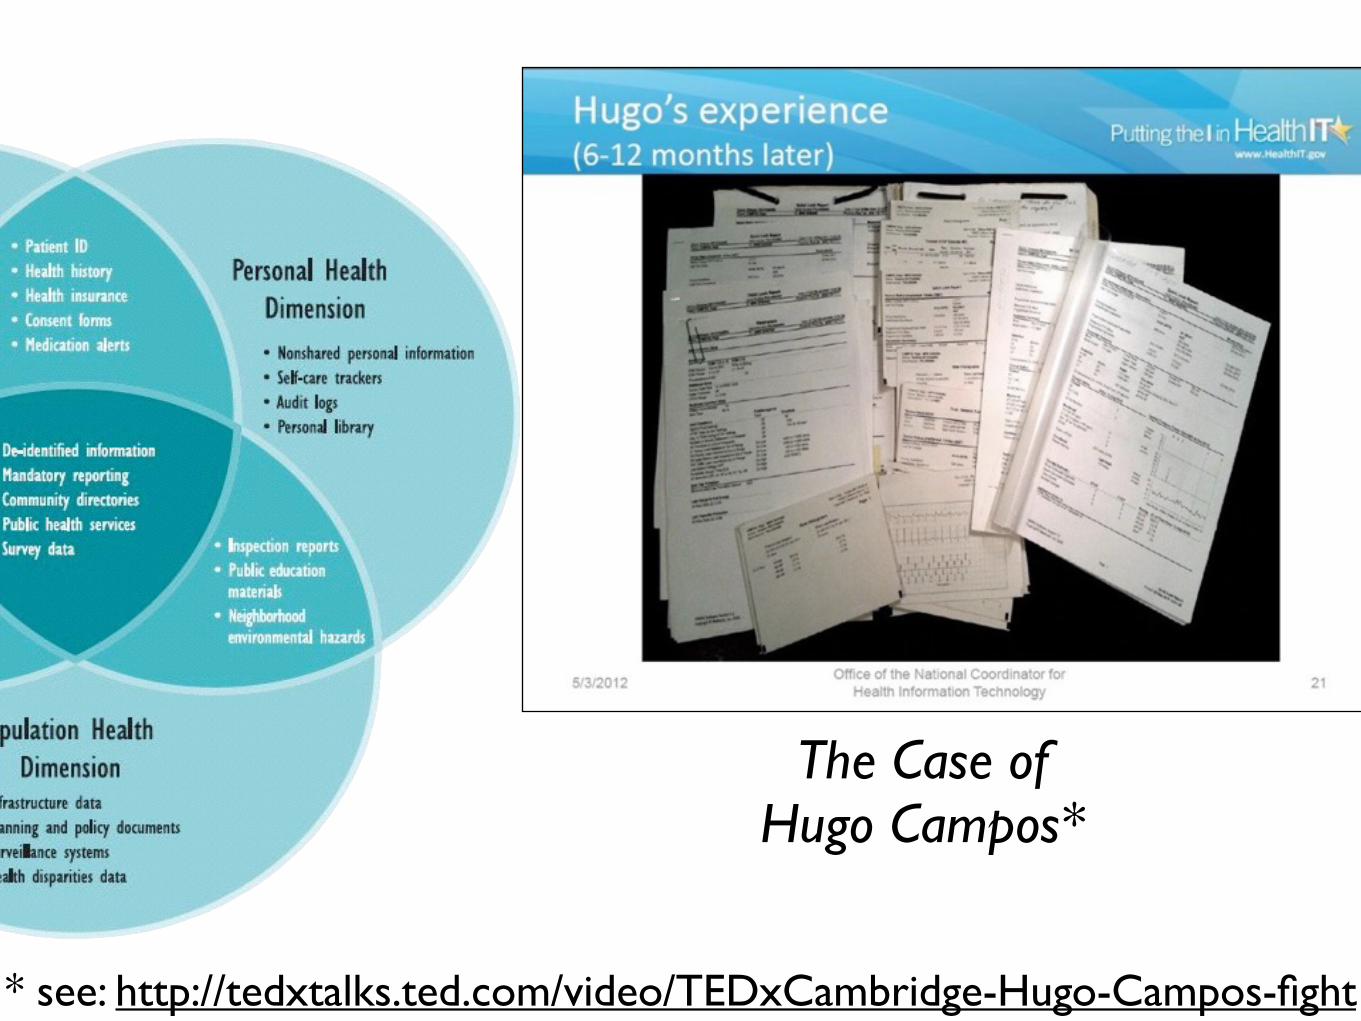
The Case of Hugo Campos*
* see: http://tedxtalks.ted.com/video/TEDxCambridge-Hugo-Campos-fight

The Case of Hugo Campos*
* see: http://tedxtalks.ted.com/video/TEDxCambridge-Hugo-Campos-fight
The Case of Hugo Campos*
* see: http://tedxtalks.ted.com/video/TEDxCambridge-Hugo-Campos-fight
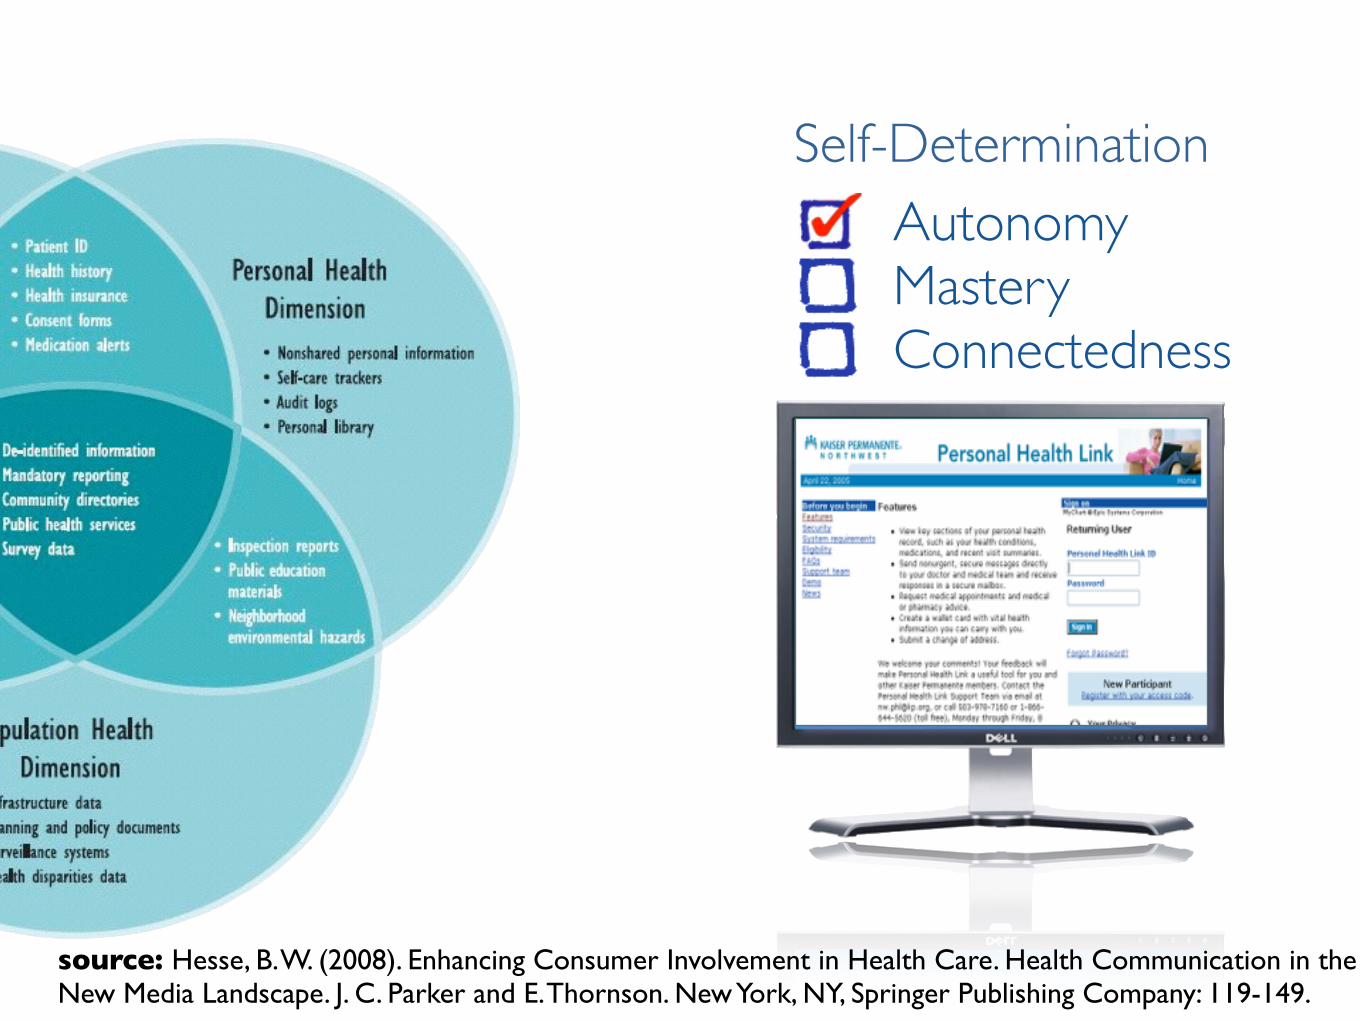
Self-DeterminationAutonomyMasteryConnectedness
source: Hesse, B. W. (2008). Enhancing Consumer Involvement in Health Care. Health Communication in the New Media Landscape. J. C. Parker and E. Thornson. New York, NY, Springer Publishing Company: 119-149.

AutonomyMasteryConnectedness
Self-Determination
source: Hesse, B. W. (2008). Enhancing Consumer Involvement in Health Care. Health Communication in the New Media Landscape. J. C. Parker and E. Thornson. New York, NY, Springer Publishing Company: 119-149.

AutonomyMasteryConnectedness
Self-Determination
source: Hesse, B. W. (2008). Enhancing Consumer Involvement in Health Care. Health Communication in the New Media Landscape. J. C. Parker and E. Thornson. New York, NY, Springer Publishing Company: 119-149.

Connecting Home and Office
Jim Cleary, David GustafsonU of Wisconsin

Coordinating Multiple Input Streams
Hospital Based EHR Data
Hospital Based EHR Data
Health Information Exchange
MedicalTeam
Patient &
FamilyHospital System
DecisionSupportNeeds
Subjective• Chief complaint• Patient Reported Outcomes
• Risk modeling• Diagnostic support • Treatment selection • Guideline adherence• Error detection/correction
Medical Researcher
• Situational awareness• Population health• Continuity of care• Identify side effects• Inform discovery
Objective• Clinical measures• Laboratory findings • Sensor data
Assessment• Diagnosis• Categorical reporting• Prognosis
Plan• Treatment planning• Self-care planning• Post treatment• Surveillance
source: Hesse, B. W. (2015). Decisional Architectures. Handbook of Health Decision Science. M. A. Dieffenbach, S. M. Miller and D. Bowen. New York, NY, Springer Verlag.

Ubiquitous Access to Patient Data

Exploring Data Over Timeand Over Patients
UMD Lifelines

• Manage populations, not just individuals
• Consider upstream causes, prevention
• Form interdisciplinary teams


Where are we going?

Na#onal Cancer Ins#tute


Precision Medicine Initiative


Big Data

Big DataKnowledge

Big Data &Action
Knowledge

“We are only going to succeed
if we work closely together -‐-‐
between those with biological
sophis9ca9on and those with
computa9onal sophis9ca9on”
Dr. Francis S. CollinsDirector, Na9onal Ins9tutes of HealthOct. 23, 2011
American Medical Informa9cs Associa9on, Keynote Address 2011