Embed Size (px)
Citation preview


24 KURARAY CO., LTD.
プロフィール PROFILE
1926年にレーヨンの企業化を目的に設立、1950年には世界初の合成繊維ビニロンの事業化に成功するなど繊維を中心に展開してきました。その後、高分子化学・合成化学の独自技術をベースに酢ビ・ポバール系事業のポバール、<エバール>をはじめ高機能樹脂等の化学品分野でも世界的な競争力を背景に拡大を続け、2007年度には化学品関連(繊維以外)の売上高が全体の75%、海外売上高が全体の48%を占めるまでになりました。2007年10月には東京・大阪両証券取引所での当社株式の所属業種が「繊維製品」から「化学」に変更され、クラレグループは名実ともにスペシャリティ化学企業となりました。2006年度から始まった中期経営計画『GS-21』(2006年度~2008年度)では、次の4点を重点課題として取り組んでいきます。まず、新事業・新成長領域の開発スピードを加速します。光学、自動車、エネルギー等の成長市場のニーズに沿ったテーマに絞込み、スピードアップを図っていきます。2番目に、グローバルな効率経営と経営のスピード化を図ります。3番目に『GS-21』の経営戦略に沿って必要な人材の採用・育成と最適配置を進めます。4番目はサステイナビリティ、すなわち地球環境と企業の持続可能性への取り組みです。現在推進中の環境中期計画(2001年度-2010年度)に基づき、環境対策と環境対応製品の拡大に努めます。さらなる原燃料の高騰など厳しい外部環境にありますが、価格転嫁への取り組みや、新増設した主要素材拡販を鋭意進めることによって中期経営計画『GS-21』の必達目標である営業利益500億円に向けて業容拡大を目指していきます。
目次 CONTENTSクラレグループの歩み Kuraray Group Milestones 1財務ハイライト(連結) Financial Highlights (Consolidated) 2クラレの株主還元について Kuraray’s Dividend Policy 3セグメント情報 Segment Information 4化成品・樹脂セグメント Chemicals and Resins 4繊維セグメント Fibers and Textiles 6機能材料・メディカル他セグメント High-Performance Materials, Medical Products and Others 7
財務データ Financial Data 8成長性・収益性 Growth/Profitability 8収益性・効率性 Profitability/Efficiency 9効率性・安全性 Efficiency/Stability 10安全性 Stability 111株当たり指標 Performance Indicators 12その他指標 Other Data 13
連結貸借対照表(6年間) Six-Year Consolidated Balance Sheets 14連結損益計算書(6年間) Six-Year Consolidated Statements of Income 16連結キャッシュ・フロー計算書(6年間) Six-Year Consolidated Statements of Cash Flows 17製造工程フロー Manufacturing Process Flow 18会社情報/株式情報 Corporate Information/Stock Data 21
注1 記載の財務数値は、有価証券報告書を基準としていますが、監査法人等の監査を受けているものではありません。
注2 ファクトブックで記載されている< >は当社グループ製品の商標です。Note 1: Results in this fact book are based on figures appearing in the Company’s financial statements, and
have not been reviewed by an auditing firm.Note 2: Words appearing in italics indicate trade names.
クラレグループ主要海外活動拠点 Main Overseas Network(2008年3月31日/March 31, 2008)
◆
◆◆◆◆
◆
◆◆
◆◆
◆
米州Americas
アジアAsia
欧州Europe
Kuraray Co., Ltd., was established in 1926 with the objective of commercializing rayon, and the Company’sbusiness essentially developed around fibers and textiles. In 1950, the Company achieved a corporatemilestone as the first in the world to bring polyvinyl alcohol synthetic fiber to market.
In subsequent years, we used our proprietary technology in the areas of polymer chemistry and syn-thetic chemistry to engineer a number of high-performance resins, such as poval and EVAL, which helpedus hone an internationally competitive edge with which to expand operations in the field of chemicals.
The progress we have made is clear. In fiscal 2007, ended March 31, 2008, sales of chemicals-relatedproducts (total sales other than fibers and textiles) represented 75% of net sales, highlighting the growingweight of chemicals in our product mix. Overseas sales accounted for 48% of the total, reflecting anenhanced profile in markets outside of Japan.
In October 2007, the industry category under which Kuraray shares were classified on the Tokyo StockExchange and the Osaka Securities Exchange switched from “Textiles” to “Chemicals,” exemplifying theKuraray Group’s real operations as a provider of specialty chemicals.
Kuraray is charting the business course laid out in “GS-21,” a medium-term business plan launched infiscal 2006. Management identified four priority issues and policies that the Company must address dur-ing the three years of the plan: (1) accelerate the development of new businesses and new growth fieldsand seek to capitalize on opportunities in promising markets, including optics, automobiles and energy;(2) pursue globally effective and speedy management; (3) secure and educate personnel in line with thestrategies described in “GS-21” and optimize employee assignments; and (4) address sustainability issues,that is the pursuit of an equitable balance between the environment and corporate growth.
Based on its medium-term environmental plan, which runs from fiscal 2001 through fiscal 2010, Kurarayis also formulating global environment initiatives and working to expand sales of environmentally friendlyproducts.
Despite a challenging external environment characterized by skyrocketing fuel costs, we strive to ad-just product prices appropriately. At the same time, we aim to boost sales of mainstay materials throughinvestments in new and expanded facilities. These efforts will widen the scope of our business activitiesand underpin achievement of stated medium-term targets: ¥50 billion in operating income by March 31,2009.

KURARAY CO., LTD. 1
クラレグループの歩み KURARAY GROUP MILESTONES
0
1,200
2,400
3,600
4,800
0
150
300
450
600
◆ 売上高・営業利益の推移
■ 売上高(左軸)■ 営業利益(右軸)
◆ セグメント別売上高構成比 各3月31日時点 At March 31
■ 化成品・樹脂 Chemicals and resins
■ 繊維 Fibers and textiles
■ 機能材料、メディカル他 High-performance materials, medical products and others
2005200019951990198519801975197019651960195519501920 2008
1985 1990 2000 2008
15%
31%
45%58%
5% 7% 13% 17%
80%62%
42%25%
(億円/¥ million) (億円/¥ million)
Net Sales and Operating Income Movement
Breakdown of Net Sales by Segment
Net sales (left) Operating income (right)
年/year
1926 倉敷絹織(株)創立1928 レーヨン事業化1949 倉敷レイヨン(株)と
社名変更
1926 Kurashiki KenshokuCo., Ltd., established
1928 Rayoncommercialized
1949 Company renamedKurashiki RayonCo., Ltd.
2001 レーヨン事業から撤退クラレメディカル(株)設立独:クラリアント社のPVA関連事業を買収
2002 米国で〈セプトン〉の生産を開始2004 独:HTトロプラスト社のPVBフィルム事業を買収2005 米:セラニーズアドバンスドマテリアルズ社の〈ベクト
ラン〉事業を買収
2001 Production of Rayon ceasedKuraray Medical Inc. establishedAcquisition of Clariant’s PVA-related products
2002 Production of SEPTON started in the U.S.2004 Acquisition of the PVB film business of HT Troplast2005 Acquisition of VECTRAN business of U.S.-based
Celanese Advanced Materials Inc.
1950 ビニロン事業化1958 ポバール(PVA)事業化
1950 KURALON commercialized1958 Poval commercialized (and
introduced to the market)
1962 ポバールフィルム操業開始1964 エステル事業化
〈クラリーノ〉事業化1969〈クラベラ〉事業化
1962 Poval film commercialized1964 Polyester staple/CLARINO
commercialized1969 Polyester filament commercialized
1970(株)クラレと社名変更1972〈エバール〉事業化
<クラフレックス>の生産開始イソプレン化学事業を開始
1978 歯科材料事業を開始
1970 Company renamed Kuraray Co., Ltd.1972 EVAL/isoprene chemicals/non-woven
fabrics commercialized1978 Production of dental material started
1983 セメント補強用ビニロン繊維を開発1986 米国で〈エバール〉樹脂の生産を開始
1983 Cement-reinforcing KURALONdeveloped
1986 Production of EVAL resin started inthe U.S.
1990〈ベクトラン〉〈セプトン〉事業化1999 シンガポールでポバールの生産を開始
ベルギーで〈エバール〉の生産を開始〈ジェネスタ〉の生産を開始
1990 VECTRAN/SEPTON commercialized1999 Production of Poval resin started in
SingaporeProduction of EVAL resin started inBelgiumGENESTAR commercialized

2 KURARAY CO., LTD.
財務ハイライト(連結) Financial Highlights (Consolidated)
売上高・当期純利益 Net sales•Net income
20082004
(百万円 /¥ million)
売上高 Net sales 当期純利益 Net income
2007200620050
60,000
120,000
180,000
240,000
300,000
420,000
360,000
0
5,000
10,000
15,000
20,000
25,000
35,000
30,000
1株当たり当期純利益・1株当たり配当金・配当性向 Earnings per share•Dividends per share•Payout ratio(円 /¥) (%)
0
10
20
30
40
50
60
80
0
5
10
15
20
25
30
40
70 35
20082007200620052004
1株当たり当期純利益(左軸) Earnings per share (left)1株当たり配当金(左軸) Dividends per share (left)配当性向(右軸)Payout ratio (right)
配当金額・自社株買付総額・株主還元率 Dividends•Repurchase of own shares•Shareholder return ratio
0
5,000
10,000
15,000
20,000
25,000
30,000
35,000
40,000
200820072006200520040
20
40
60
80
100
120
140
160(百万円 /¥ million) (%)
配当金額 Dividends自社株買付総額 Repurchase of own shares株主還元率 Shareholder return ratio
自己資本・ROE Shareholders’ equity•Return on equity
0
100,000
200,000
300,000
400,000
20082007200620052004
8
6
4
2
0
(百万円 /¥ million) (%)
自己資本 Shareholders’ equityROE Return on equity
FY2001 FY2002 FY2003各3月31日時点 At March 31 2002 2003 2004
売上高 Net sales 305,861 322,523 332,149営業利益 Operating income 18,957 25,186 28,045当期純利益 Net income 2,866 8,051 15,181
EPS (1株当たり当期純利益) (円) Earnings per share (¥) 7.49 21.01 40.811株当たり配当金 (円) Dividends per share (¥) 9.0 9.0 10.0配当性向 (%) Payout ratio (%) 120.2 42.8 24.5配当・自己株式取得 Dividends and repurchase of own shares 3,445 10,409 7,921自己資本 Shareholders’ equity 290,642 287,262 300,306自己資本比率 (%) Equity ratio (%) 59.6 67.3 72.7ROE (%) Return on equity (%) 1.0 2.8 5.2
海外売上高 Sales by region 92,334 124,006 137,147北米 North America 29,830 32,266 31,869欧州 Europe 24,863 43,870 49,308アジア Asia 32,267 41,910 51,101その他 Others 5,372 5,958 4,868海外売上高比率 (%) Overseas sales ratio (%) 30.2 38.4 41.3配当性向=1株当たり配当金÷EPS(1株当たり当期純利益) Payout ratio=Dividends per share/Earnings per share自己資本=純資産-少数株主持分-新株予約権 Shareholders’ equity=Net assets–Minority interests–Subscription rights to shares

KURARAY CO., LTD. 3
0
50000
100000
150000
200000
2008200720062005200420032002
0
15
30
45
60
0
50,000
100,000
150,000
200,000
0
15
45
30
60
20082007200620052002 2003 2004
海外売上高・海外売上高比率 Sales by region•Overseas sales ratio
(百万円 /¥ million) (%)
海外売上高 Sales by region 北米 North America海外売上高比率 Overseas sales ratio
欧州 Europe アジア Asia その他 Others
北米North America
欧州Europe
アジアAsia
その他Others
当社は株主に対する利益配分を経営の重要課題と位置付けています。連結当期純利益に対する配当性向は30%以上を目標とし、持続的な業績向上を通した増配を目指します。中期経営計画『GS-21』(2006~2008年度)の3年間で配当と自己株式取得をあわせて株主還元率70%を目標とし、資本効率の向上を目指します。
The distribution of profits to shareholders is one ofthe Group’s top management issues. Our target isto maintain a dividend payout ratio of 30% of con-solidated net income and to increase returns toshareholders through continuous improvements inperformance. Under the “GS-21” medium-termbusiness plan, Kuraray has targeted a shareholderreturn ratio (defined as the sum of dividends paidand share buybacks as a percentage of net income)of 70% for fiscal 2006 to 2008 in an aim to improvecapital efficiency.
クラレの株主還元についてKuraray’s Dividend Policy
前中計『G-21』(2001~2005年度)株主還元率(%) 現中計『GS-21』(2006~2008年度)株主還元率(%)Total shareholder return under
the former “G-21” medium-term business plan
48% 70%
Total shareholder return underthe new “GS-21” medium-term business plan
『GS-21』期間中の株主還元率を70%へBring total shareholder return under “GS-21” to 70%
新事業プロジェクトやM&A資金を必要に応じて外部調達Procure external funds for new projects and M&As as required
<GS-21:2006~2008年度>■ 連結配当性向30%以上■『GS-21』3年間の株主還元率*70%を目標
300億円の自社株買いを実施(2007年6月~9月)Repurchasing Treasury Stock ¥30 billion (June 2007 to September 2007)
資本効率の向上Improving capital efficiency
*株主還元率=(配当金額+自己株式取得額)/連結当期純利益*Total Shareholder return ratio=(Dividends+Cost of buyback)/Consolidated net income
■ Dividend payout ratio of 30% or more■ Total shareholder return ratio* during
“GS-21” (FY06-08) to 70%➮
KURARAY CO., LTD. 3
(百万円 / ¥ million)
FY2004 FY2005 FY2006 FY20072005 2006 2007 2008
354,874 375,072 385,284 417,60133,186 38,277 40,220 48,13018,465 21,185 22,412 25,554
50.13 57.51 60.95 72.1512.0 15.0 18.5 22.023.9 26.1 30.4 30.5
4,406 5,510 6,805 37,660312,929 339,127 356,139 341,889
68.8 70.5 70.0 69.76.0 6.5 6.4 7.3
150,116 163,042 166,751 199,77730,828 35,412 28,984 31,33349,980 58,925 63,210 80,36162,077 60,062 67,090 78,6817,230 8,641 7,464 9,40042.3 43.5 43.3 47.8

4 KURARAY CO., LTD.
セグメント情報 SEGMENT INFORMATION
化成品・樹脂セグメントChemicals and Resins
(億円 / ¥100 million)
FY2003 FY2004 FY2005 FY2006 FY2007各3月31日時点 At March 31 2004 2005 2006 2007 2008
売上高 Net sales 1,559 1,673 1,908 2,012 2,438
営業利益 Operating income 252 284 319 356 502
営業利益率 (%) Operating income ratio (%) 16.2 17.0 16.7 17.7 20.6
総資産 Total assets 1,840 2,208 2,434 2,698 2,848
ROA(%) Return on assets (%) 14.1 14.0 13.7 13.9 18.1
設備投資 Capital expenditures 215 323 238 228 234
減価償却費 Depreciation and amortization 120 121 160 164 223ROA=営業利益÷期首・期末平均総資産×100(%) Return on assets=Operating income/Average total assetsx100 (%)
売上高・営業利益率Net sales・Operating income ratio
(億円 /¥100 million) (%)
売上高 Net sales営業利益率 Operating income ratio
0
500
1,000
1,500
2,500
0
5
10
15
25
2,000 20
20082007200620052004
総資産・ROATotal assets•Return on assets
(億円 /¥100 million) (%)
総資産 Total assetsROA Return on assets
0
600
1,200
1,800
2,400
3,000
20082007200620052004 200820072006200520040
4
8
12
16
20
設備投資・減価償却費Capital expenditures・Depreciation and amortization(億円 /¥100 million)
設備投資 Capital expenditures減価償却費 Depreciation and amortization
0
100
200
300
400
20082007200620052004 20082007200620052004
■売上高:2,438億円、58%Net sales: ¥243.8 billion, 58%
58%
25%
■売上高:1,052億円、25%Net sales: ¥105.2 billion, 25%
17%
■売上高:686億円、17%Net sales: ¥68.6 billion, 17%
化成品・樹脂セグメント Chemicals and Resins
繊維セグメント Fibers and Textiles
・ポバール Povalポバール樹脂 Poval resin / ポバールフィルム Poval film /ブチラール樹脂 Polyvinyl butyral resin /ブチラールフィルム Polyvinyl butyral film
・<エバール> EVAL
・イソプレンケミカル Isoprene Chemicals<セプトン> SEPTON / 香料原料 Aroma chemicals /医農薬中間体 Pharmaceutical and agrochemical intermediates
・メタクリル Methacrylメタクリル樹脂 Methacrylic resin / メタクリル板 Methacrylic sheets
・メディカル製品 Medical Products歯科材料 Dental materials
・高耐熱性ポリアミド樹脂 Highly Heat Resistant Polyamide Resin<ジェネスタ> GENESTER
・環境事業 Environmental Businesses活性炭 Activated carbon /工業用ろ過膜 Industrial membranes
・ビニロン KURALON / <クラロンK -II> KURALON K-II
・人工皮革 Man-Made Leather<クラリーノ> CLARINO
・ポリエステル New-Type Polyester
・乾式不織布 Non-Woven Fabrics<クラフレックス> KURAFLEX
・面ファスナー Fastening Materials<マジックテープ> MAGIC TAPE
機能材料・メディカル他セグメント High-Performance Materials, Medical Products and Others
FY2007
FY2007
FY2007

KURARAY CO., LTD. 5
主要製品別生産能力 Production Capacity for Major Productsマーケットシェア Market Share 製品 生産拠点 国名 生産能力
Major Products Production Facilities Country Annual Production Capacity
ポバール ポバール樹脂 岡山事業所 Okayama Plant Japan 96,000t
Poval PVA resin 新潟事業所 Niigata Plant Japan 28,000t
ポバールアジア Poval Asia Pte Ltd. Singapore 40,000t
クラレヨーロッパ Kuraray Europe GmbH Germany 70,000t
ポバールフィルム 西条事業所 3,100万m2
Poval film Saijo Plant Japan 31 million m2
倉敷事業所 7,500万m2
Kurashiki Plant Japan 75 million m2
ブチラール樹脂 クラレヨーロッパ 29,000t
PVB Kuraray Europe GmbH Germany
ブチラールフィルム クラレヨーロッパ 36,000t
PVB film Kuraray Europe GmbH Germany
クラレヨーロッパ 04,000t
Kuraray Europe GmbH Russia
<エバール> 岡山事業所 Okayama Plant Japan 10,000t
EVAL クラレアメリカ Kuraray America, Inc. U.S.A. 35,000t
エバールヨーロッパ EVAL Europe N.V. Belgium 24,000t
メタクリル樹脂 モノマー 新潟事業所 Niigata Plant Japan 67,000t
Methacrylic resin Monomer
成形材 新潟事業所 Niigata Plant Japan 44,000t
Molding compound
シート 新潟事業所 Niigata Plant Japan 33,600t
Sheets
<セプトン> 鹿島事業所 Kashima Plant Japan 23,000t
SEPTON クラレアメリカ Kuraray America, Inc. U.S.A. 18,000t
2008年4月現在 (As of April, 2008)
ポバール(除:中国)
Poval(excluding China)
35%
光学用ポバールフィルムPVA film for LCDs
80%
<エバール>EVAL
70%
<セプトン>(熱可塑性エラストマー)
SEPTON(thermoplastic elastomers)
20%
導光板向けメタクリル成形材Methacrylic molding compound
for light guide plate
65%
建築用ガラス中間膜向けブチラールフィルム
PVB film for interlayer films for laminated glass in the construction industry
40%
(当社推定)As of 2007, data from Kuraray estimates

6 KURARAY CO., LTD.
繊維セグメントFibers and Textiles
(億円 / ¥100 million)
FY2003 FY2004 FY2005 FY2006 FY2007各3月31日時点 At March 31 2004 2005 2006 2007 2008
売上高 Net sales 1,060 1,098 1,091 1,079 1,052
営業利益 Operating income 53 79 95 80 69
営業利益率 (%) Operating income ratio (%) 5.0 7.2 8.7 7.4 6.5
総資産 Total assets 790 800 805 801 793
ROA(%) Return on assets (%) 6.5 10.0 11.8 9.9 8.6
設備投資 Capital expenditures 37 41 48 59 78
減価償却費 Depreciation and amortization 42 41 38 42 47ROA=営業利益÷期首・期末平均総資産×100(%) Return on assets=Operating income/Average total assetsx100 (%)
マーケットシェア Market Share
製品 生産拠点 国名 生産能力Major Products Production Facilities Country Annual Production Capacity
ビニロン 岡山事業所 35,000tKURALON Okayama Plant Japan
<クラロンK-II> 岡山事業所 07,000tKURALON K-II Okayama Plant Japan
人工皮革 岡山事業所 1,550万m2
Man-made leather Okayama Plant Japan 15.5 million m2
禾欣可樂麗超繊皮(嘉興)有限公司 0,400万m2
Hexin Kuraray Micro Fiber Leather (Jianxing) Co., Ltd. China 4 million m2
乾式不織布 クラレクラフレックス 10,500tMelt-blown non-woven fabrics Kuraray Kuraflex Co., Ltd. Japan
クラフレックス茨城 03,500tKuraflex Ibaraki Co., Ltd. Japan
<ベクトラン> クラレ西条(株) 01,000tVECTRAN Kuraray Saijo Co., Ltd. Japan
2008年4月現在 (As of April, 2008)
主要製品別生産能力 Production Capacity for Major Products
売上高・営業利益率Net sales・Operating income ratio
(億円 /¥100 million) (%)
売上高 Net sales営業利益率 Operating income ratio
0
200
600
400
800
1,200
1,000
200820072006200520040
2
6
4
8
12
10
総資産・ROATotal asset s・Return on assets
(億円 /¥100 million) (%)
総資産 Total assetsROA Return on assets
200820072006200520040
200
400
600
800
1,000
1,200
0
2
4
6
8
10
12
設備投資・減価償却費Capital expenditures•
Depreciation and amortization(億円 /¥100 million)
設備投資 Capital expenditures減価償却費 Depreciation and amortization
20082007200620052004 200820072006200520040
15
30
45
60
75
90
人工皮革<クラリーノ>Man-made leather
CLARINO
面ファスナーFastening materials
ビニロン(除:中国)KURALON
(excluding China)
25%
65%80%
セグメント情報 SEGMENT INFORMATION
(当社推定)As of 2007, data from Kuraray estimates

KURARAY CO., LTD. 7
機能材料・メディカル他セグメントHigh-Performance Materials, Medical Products and Others
(億円 / ¥100 million)
FY2003 FY2004 FY2005 FY2006 FY2007各3月31日時点 At March 31 2004 2005 2006 2007 2008
売上高 Net sales 702 778 752 761 686
営業利益 Operating income 80 73 85 79 62
営業利益率 (%) Operating income ratio (%) 11.4 9.4 11.2 10.4 9.1
総資産 Total assets 761 821 696 688 681
ROA(%) Return on assets (%) 10.5 9.3 11.1 11.5 9.1
設備投資 Capital expenditures 51 72 33 32 86
減価償却費 Depreciation and amortization 32 37 37 31 23ROA=営業利益÷期首・期末平均総資産×100(%) Return on assets=Operating income/Average total assetsx100 (%)
マーケットシェア Market Share
製品 生産拠点 国名 生産能力Major Products Production Facilities Country Annual Production Capacity
<ジェネスタ> クラレ西条(株) Kuraray Saijo Co., Ltd. Japan 05,500tGENESTAR
活性炭 クラレケミカル株式会社 鶴海工場 22,500tActivated carbon Kuraray Chemical, Tsurumi Plant Japan
可樂麗化学(寧夏)環境化工有限公司 02,000tKuraray Chemical (Ningxia) Environmental Industry Co., Ltd. Chinaセナプロケミカル・コーポレーション 13,000tCenapro Chemical Corporation Philippines
2008年4月現在 (As of April, 2008)
主要製品別生産能力 Production Capacity for Major Products
売上高・営業利益率Net sales・Operating income ratio
(億円 /¥100 million)
0
200
400
600
800
0
3
6
9
12(%)
売上高 Net sales営業利益率 Operating income ratio
20082007200620052004
総資産・ROATotal assets・Return on assets
(億円 /¥100 million) (%)
総資産 Total assetsROA Return on assets
200820072006200520040
200
400
600
800
1,000
0
3
6
9
12
15
設備投資・減価償却費Capital expenditures•
Depreciation and amortization(億円 /¥100 million)
設備投資 Capital expenditures減価償却費 Depreciation and amortization
20082007200620052004 200820072006200520040
20
40
60
80
100
歯科材料Dental material
耐熱性樹脂<ジェネスタ>Highly heat resistant polyamide resin
GENESTAR
40%100%
活性炭Activated carbon
30%
(当社推定)As of 2007, data from Kuraray estimates
8 KURARAY CO., LTD.
財務データ FINANCIAL DATA
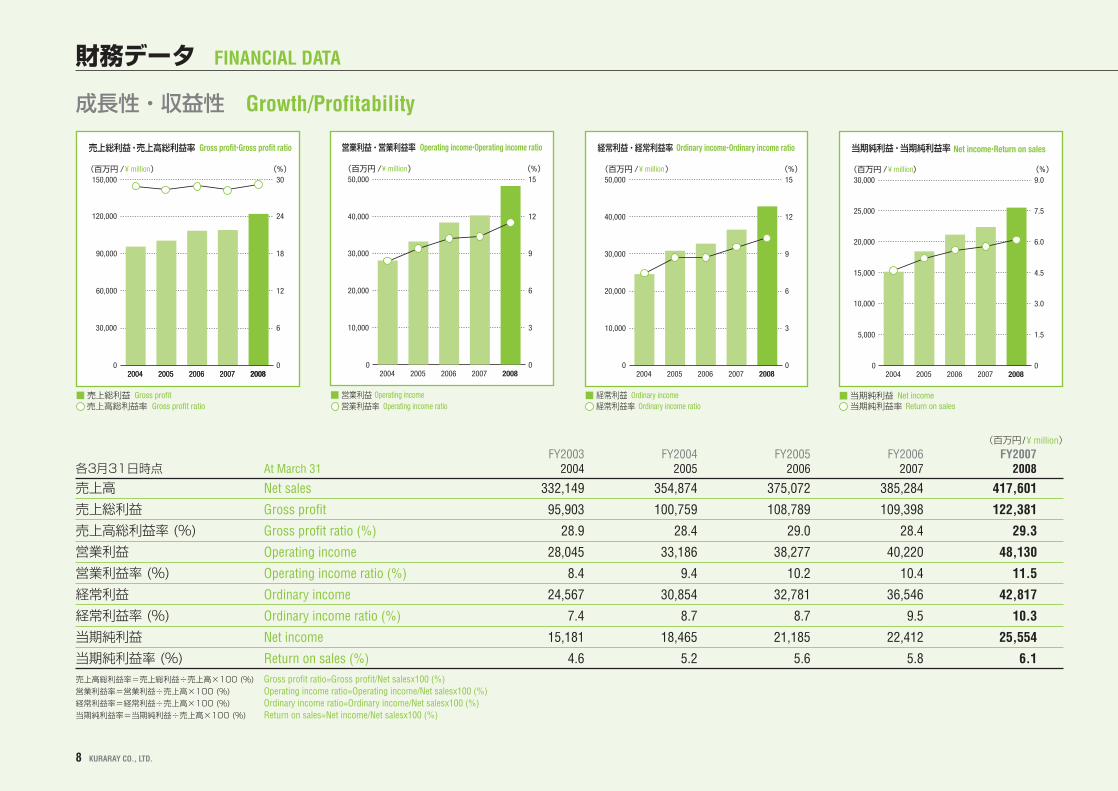
成長性・収益性 Growth/Profitability
(百万円 / ¥ million)
FY2003 FY2004 FY2005 FY2006 FY2007各3月31日時点 At March 31 2004 2005 2006 2007 2008
売上高 Net sales 332,149 354,874 375,072 385,284 417,601
売上総利益 Gross profit 95,903 100,759 108,789 109,398 122,381
売上高総利益率 (%) Gross profit ratio (%) 28.9 28.4 29.0 28.4 29.3
営業利益 Operating income 28,045 33,186 38,277 40,220 48,130
営業利益率 (%) Operating income ratio (%) 8.4 9.4 10.2 10.4 11.5
経常利益 Ordinary income 24,567 30,854 32,781 36,546 42,817
経常利益率 (%) Ordinary income ratio (%) 7.4 8.7 8.7 9.5 10.3
当期純利益 Net income 15,181 18,465 21,185 22,412 25,554
当期純利益率 (%) Return on sales (%) 4.6 5.2 5.6 5.8 6.1売上高総利益率=売上総利益÷売上高×100 (%) Gross profit ratio=Gross profit/Net salesx100 (%)営業利益率=営業利益÷売上高×100 (%) Operating income ratio=Operating income/Net salesx100 (%)経常利益率=経常利益÷売上高×100 (%) Ordinary income ratio=Ordinary income/Net salesx100 (%)当期純利益率=当期純利益÷売上高×100 (%) Return on sales=Net income/Net salesx100 (%)
営業利益・営業利益率 Operating income•Operating income ratio
(百万円 /¥ million) (%)
営業利益 Operating income営業利益率 Operating income ratio
0
10,000
20,000
30,000
40,000
50,000
200820072006200520040
3
6
9
12
15
経常利益・経常利益率 Ordinary income•Ordinary income ratio
(百万円 /¥ million) (%)
経常利益 Ordinary income経常利益率 Ordinary income ratio
200820072006200520040
10,000
20,000
30,000
40,000
50,000
0
3
6
9
12
15
当期純利益・当期純利益率 Net income•Return on sales
(百万円 /¥ million) (%)
当期純利益 Net income当期純利益率 Return on sales
200820072006200520040
5,000
10,000
15,000
25,000
30,000
0
1.5
3.0
4.5
20,000 6.0
7.5
9.0
売上総利益・売上高総利益率 Gross profit•Gross profit ratio
(百万円 /¥ million) (%)
売上総利益 Gross profit売上高総利益率 Gross profit ratio
200820072006200520040
30,000
90,000
120,000
150,000
200820072006200520040
6
18
60,000 12
24
30

KURARAY CO., LTD. 9
収益性・効率性 Profitability/Efficiency
(百万円 / ¥ million)
FY2003 FY2004 FY2005 FY2006 FY2007各3月31日時点 At March 31 2004 2005 2006 2007 2008
総資産 Total assets 413,227 454,940 481,357 508,694 490,365
ROA (%) Return on assets (%) 6.7 7.6 8.2 8.1 9.6
自己資本 Shareholders’ equity 300,306 312,929 339,127 356,139 341,889
ROE (%) Return on equity (%) 5.2 6.0 6.5 6.4 7.3
総資産回転率 (回) Total assets turnover (times) 0.8 0.8 0.8 0.8 0.8
自己資本回転率 (回) Equity turnover (times) 1.1 1.2 1.2 1.1 1.2ROA=営業利益÷期首・期末平均総資産×100 (%) Return on assets=Operating income/Average total assetsx100 (%)自己資本=純資産-少数株主持分-新株予約権 Shareholders’ equity=Net assets–Minority interests–Subsription rights to sharesROE=当期純利益÷期首・期末平均自己資本×100 (%) Return on equity=Net income/Average shareholders’ equityx100 (%)総資産回転率=売上高÷期首・期末平均総資産 (回) Total assets turnover=Net sales/Average total assets (times)自己資本回転率=売上高÷期首・期末平均自己資本 (回) Equity turnover=Net sales/Average shareholders’ equity (times)
総資産・ROA Total assets•Return on assets
(百万円 /¥ million) (%)
総資産 Total assetsROA Return on assets
200820072006200520040
100,000
200,000
300,000
400,000
500,000
600,000
200820072006200520040
2
4
6
8
10
12
自己資本・ROE Shareholders’ equity•Return on equity
(百万円 /¥ million) (%)
自己資本 Shareholders’ equityROE Return on equity
20082007200620052004 200820072006200520040
50,000
100,000
150,000
200,000
300,000
350,000
400,000
0
1
2
3
4
250,000 5
6
7
8
20082007200620052004
総資産回転率 Total assets turnover
(回 / times)
200820072006200520040
0.2
0.4
0.6
0.8
1.0
20082007200620052004
自己資本回転率 Equity turnover
(回 / times)
200820072006200520040
1.0
1.1
1.2
1.3
20082007200620052004

10 KURARAY CO., LTD.
財務データ FINANCIAL DATA
効率性・安全性 Efficiency/Stability
(百万円/¥ million)
FY2003 FY2004 FY2005 FY2006 FY2007各3月31日時点 At March 31 2004 2005 2006 2007 2008
有形固定資産回転率 (回) Tangible fixed assets turnover (times) 2.4 2.4 2.4 2.3 2.3
たな卸資産回転月数 (月) Number of months’ sales in inventories (months) 2.2 2.2 2.2 2.2 2.1
売上債権回転月数 (月) Number of months’ sales in receivables (months) 3.0 2.8 2.9 3.0 2.7
インタレスト・カバレッジ・レシオ (倍) Interest coverage ratio (times) 44.5 115.7 95.6 100.6 60.5有形固定資産回転率=売上高÷期首・期末平均有形固定資産 (回) Tangible fixed assets turnover=Net sales/Average tangible fixed assets (times)たな卸資産回転月数=棚卸資産÷売上高×12 (月) Number of months’ sales in inventories=Inventories/Net salesx12 (months)売上債権回転月数=(受取手形+売掛金)÷売上高×12 (月) Number of months’ sales in receivables=(Trade+Accounts receivable)/Net salesx12 (months)インタレスト・カバレッジ・レシオ=(営業利益+受取利息及び配当金)÷支払利息 (倍) Interest coverage ratio=(Operating income+Interest received+Dividends received)/Interest expenses (times)
(回 / times)
20082007200620052004 200820072006200520040
2.0
2.1
2.2
2.3
2.4
有形固定資産回転率 Tangible fixed assets turnover たな卸資産回転月数 Number of months’ sales in inventories
(月 /months)
20082007200620052004 200820072006200520040
2.0
2.1
2.2
2.3
2.4
売上債権回転月数 Number of months’ sales in receivables
(月 /months)
20082007200620052004 200820072006200520040
2.7
2.8
2.9
3.0
3.1
インタレスト・カバレッジ・レシオ Interest coverage ratio
(倍 / times)
20082007200620052004 200820072006200520040
20
40
60
80
100
120

KURARAY CO., LTD. 11
安全性 Stability
(百万円/¥ million)
FY2003 FY2004 FY2005 FY2006 FY2007各3月31日時点 At March 31 2004 2005 2006 2007 2008
自己資本比率 (%) Equity ratio (%) 72.7 68.8 70.5 70.0 69.7
流動比率 (%) Current ratio (%) 228.1 214.9 253.3 230.9 220.4
固定長期適合率 (%) Fixed assets/liability ratio (%) 71.5 74.1 70.2 70.6 73.8
デット・エクイティ・レシオ (%) Debt-to-equity ratio (%) 1.6 4.1 2.4 1.4 6.7自己資本比率=自己資本÷総資産×100 (%) Equity ratio=Shareholders’ equity/Total assetsx100 (%)流動比率=流動資産÷流動負債×100 (%) Current ratio=Current assets/Current liabilitiesx100 (%)固定長期適合率=固定資産÷(自己資本+固定負債)×100 (%) Fixed assets/liability ratio=Fixed assets/(Shareholders’ equity+Long-term liabilities)x100 (%)デット・エクイティ・レシオ=(有利子負債-現金及び預金)÷自己資本×100 (%) Debt-to-equity ratio=(Interest-bearing debt–Cash and cash equivalents)/Shareholders’ equityx100 (%)
自己資本比率 Equity ratio
(%)
20082007200620052004 200820072006200520040
69
68
70
71
72
73
流動比率 Current ratio
(%)
20082007200620052004 200820072006200520040
50
100
150
200
250
300
固定長期適合率 Fixed assets/liability ratio
(%)
20082007200620052004 200820072006200520040
70
72
71
73
74
75
デット・エクイティ・レシオ Debt-to-equity ratio
(%)
20082007200620052004 200820072006200520040
2
4
6
8
12 KURARAY CO., LTD.
財務データ FINANCIAL DATA
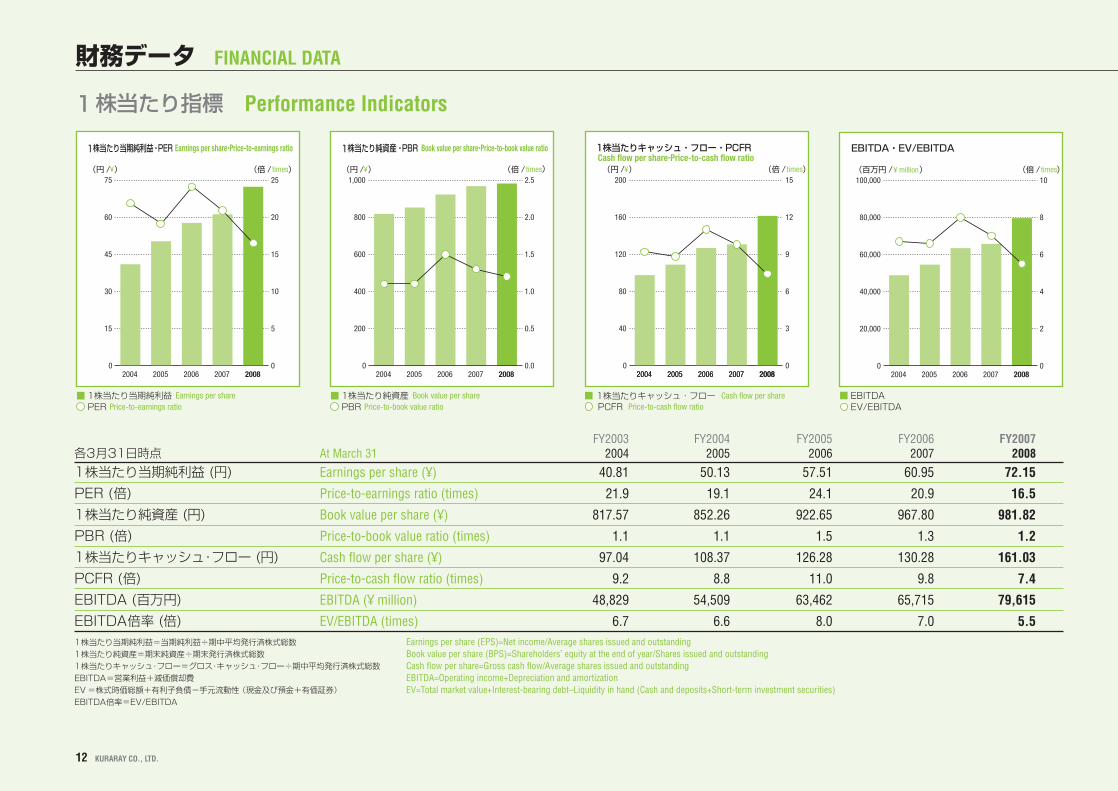
1株当たり指標 Performance Indicators
(百万円/¥ million)
FY2003 FY2004 FY2005 FY2006 FY2007各3月31日時点 At March 31 2004 2005 2006 2007 2008
1株当たり当期純利益 (円) Earnings per share (¥) 40.81 50.13 57.51 60.95 72.15
PER (倍) Price-to-earnings ratio (times) 21.9 19.1 24.1 20.9 16.5
1株当たり純資産 (円) Book value per share (¥) 817.57 852.26 922.65 967.80 981.82
PBR (倍) Price-to-book value ratio (times) 1.1 1.1 1.5 1.3 1.2
1株当たりキャッシュ・フロー (円) Cash flow per share (¥) 97.04 108.37 126.28 130.28 161.03
PCFR (倍) Price-to-cash flow ratio (times) 9.2 8.8 11.0 9.8 7.4
EBITDA (百万円) EBITDA (¥ million) 48,829 54,509 63,462 65,715 79,615
EBITDA倍率 (倍) EV/EBITDA (times) 6.7 6.6 8.0 7.0 5.51株当たり当期純利益=当期純利益÷期中平均発行済株式総数 Earnings per share (EPS)=Net income/Average shares issued and outstanding1株当たり純資産=期末純資産÷期末発行済株式総数 Book value per share (BPS)=Shareholders’ equity at the end of year/Shares issued and outstanding1株当たりキャッシュ・フロー=グロス・キャッシュ・フロー÷期中平均発行済株式総数 Cash flow per share=Gross cash flow/Average shares issued and outstandingEBITDA=営業利益+減価償却費 EBITDA=Operating income+Depreciation and amortizationEV=株式時価総額+有利子負債-手元流動性(現金及び預金+有価証券) EV=Total market value+Interest-bearing debt–Liquidity in hand (Cash and deposits+Short-term investment securities)EBITDA倍率=EV/EBITDA
1株当たり当期純利益・PER Earnings per share•Price-to-earnings ratio
(円 /¥) (倍 / times)
1株当たり当期純利益 Earnings per share PER Price-to-earnings ratio
200820072006200520040
15
30
45
60
75
0
5
10
15
20
25
1株当たり純資産・PBR Book value per share•Price-to-book value ratio
(円 /¥) (倍 / times)
1株当たり純資産 Book value per share PBR Price-to-book value ratio
200820072006200520040
200
400
600
800
1,000
0.0
0.5
1.0
1.5
2.0
2.5(円 /¥) (倍 / times)
200820072006200520040
40
80
120
160
200
200820072006200520040
3
6
9
12
15
1株当たりキャッシュ・フロー・PCFRCash flow per share•Price-to-cash flow ratio
1株当たりキャッシュ・フロー Cash flow per sharePCFR Price-to-cash flow ratio
EBITDA・EV/EBITDA
(百万円 /¥ million) (倍 / times)
EBITDAEV/EBITDA
200820072006200520040
20,000
40,000
60,000
80,000
100,000
0
2
4
6
8
10
KURARAY CO., LTD. 13
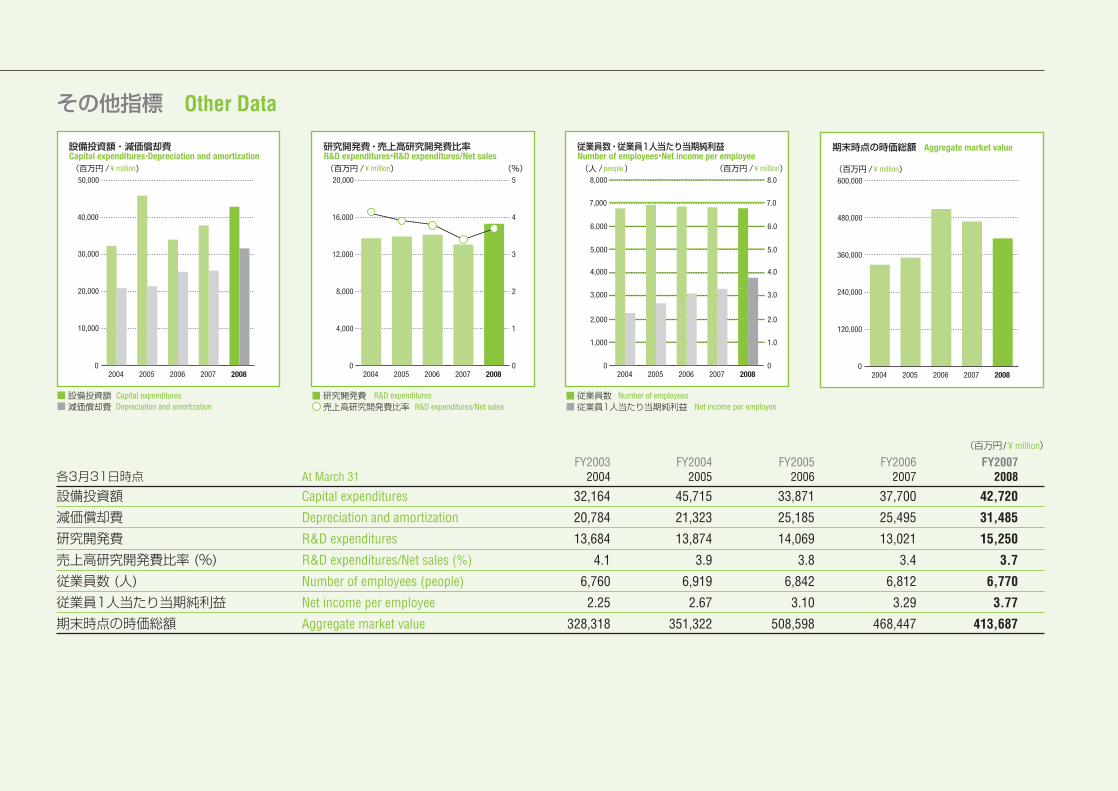
その他指標 Other Data
(百万円 / ¥ million)
FY2003 FY2004 FY2005 FY2006 FY2007各3月31日時点 At March 31 2004 2005 2006 2007 2008
設備投資額 Capital expenditures 32,164 45,715 33,871 37,700 42,720
減価償却費 Depreciation and amortization 20,784 21,323 25,185 25,495 31,485
研究開発費 R&D expenditures 13,684 13,874 14,069 13,021 15,250
売上高研究開発費比率 (%) R&D expenditures/Net sales (%) 4.1 3.9 3.8 3.4 3.7
従業員数 (人) Number of employees (people) 6,760 6,919 6,842 6,812 6,770
従業員1人当たり当期純利益 Net income per employee 2.25 2.67 3.10 3.29 3.77
期末時点の時価総額 Aggregate market value 328,318 351,322 508,598 468,447 413,687
設備投資額 減価償却費
200820072006200520040
10,000
20,000
30,000
40,000
50,000
設備投資額・減価償却費 Capital expenditures•Depreciation and amortization(百万円 /¥ million)
Capital expendituresDepreciation and amortization
研究開発費 R&D expenditures売上高研究開発費比率 R&D expenditures/Net sales
200820072006200520040
4,000
8,000
12,000
16,000
20,000
0
1
2
3
4
5
研究開発費・売上高研究開発費比率 R&D expenditures•R&D expenditures/Net sales(百万円 /¥ million) (%)
従業員数 従業員1人当たり当期純利益
200820072006200520040
1,000
2,000
3,000
4,000
5,000
6,000
7,000
8,000
0
1.0
2.0
3.0
4.0
5.0
6.0
7.0
8.0
従業員数・従業員1人当たり当期純利益 Number of employees•Net income per employee
(百万円 /¥ million)
Number of employeesNet income per employee
(人 / people)
200820072006200520040
120,000
240,000
360,000
480,000
600,000
期末時点の時価総額 Aggregate market value
(百万円 /¥ million)

14 KURARAY CO., LTD.
連結貸借対照表(6年間) SIX-YEAR CONSOLIDATED BALANCE SHEETS(百万円 / ¥ million)
FY2002 FY2003 FY2004 FY2005 FY2006 FY2007各3月31日時点 At March 31 2003 2004 2005 2006 2007 2008
(資産の部) ASSETS
I 流動資産 I Current assets:
現金及び預金 Cash and deposits ¥013,900 ¥007,020 ¥016,743 ¥018,086 ¥022,924 ¥011,109
受取手形及び売掛金 Notes and accounts receivable–trade 82,323 82,901 83,170 90,051 96,186 95,472
有価証券 Short-term investment securities 16,021 8,423 5,990 9,999 12,997 2,062
たな卸資産 Inventories 63,528 61,866 64,173 69,431 72,231 72,534
繰延税金資産 Deferred tax assets 6,653 6,401 7,313 6,478 6,741 7,362
その他 Other 4,177 5,684 5,830 7,635 7,781 8,764
貸倒引当金 Allowance for doubtful accounts (858) (870) (904) (1,014) (892) (1,021)
流動資産合計 Total current assets 185,747 171,428 182,317 200,667 217,970 196,282
II 固定資産 II Noncurrent assets:
1 有形固定資産 1 Tangible fixed assets:
建物及び構築物 Buildings and structures 35,425 34,029 33,526 27,521 30,632 33,853
機械装置及び運搬具 Machinery and equipment 63,395 62,713 80,568 85,141 86,982 110,229
土地 Land 24,303 18,173 20,289 19,675 19,028 19,094
建設仮勘定 Construction in progress 10,810 20,936 21,527 24,590 34,978 26,510
その他 Other 2,049 2,014 2,381 2,466 2,529 2,674
有形固定資産合計 Total tangible fixed assets 135,984 137,867 158,293 159,396 174,151 192,362
2 無形固定資産 2 Intangible fixed assets:
のれん Goodwill 29,066 27,800 31,661 28,625 29,298 28,596
その他 Other intangible fixed assets 1,597 2,434 6,271 6,013 5,940 5,411
無形固定資産合計 Total intangible fixed assets 30,664 30,234 37,933 34,638 35,238 34,008
3 投資その他の資産 3 Investments and other assets:
投資有価証券 Investment securities 25,119 28,047 27,973 42,111 49,238 51,590
長期貸付金 Long-term loans receivable 5,460 4,124 3,566 3,277 2,709 392
繰延税金資産 Deferred tax assets 6,775 2,082 2,077 2,649 2,844 3,538
年金保険積立金 Insurance funds 32,498 33,987 35,188 29,706 14,653 —
前払年金費用 Prepaid pension cost — — — 5,142 7,106 7,540
その他 Other 5,941 6,804 8,928 3,881 4,798 4,962
貸倒引当金 Allowance for doubtful accounts (1,313) (1,348) (1,336) (114) (18) (311)
投資その他の資産合計 Total investments and other assets 74,480 73,696 76,396 86,654 81,333 67,712
固定資産合計 Total noncurrent assets 241,129 241,798 272,623 280,689 290,724 294,083
資産合計 TOTAL ASSETS ¥426,876 ¥413,227 ¥454,940 ¥481,357 ¥508,694 ¥490,365

KURARAY CO., LTD. 15
(百万円 / ¥ million)
FY2002 FY2003 FY2004 FY2005 FY2006 FY2007各3月31日時点 At March 31 2003 2004 2005 2006 2007 2008
(負債の部) LIABILITIESI 流動負債 I Current liabilities:支払手形及び買掛金 Notes and accounts payable–trade ¥040,339 ¥038,628 ¥041,653 ¥040,182 ¥043,604 ¥039,170短期借入金 Short-term loans payable 12,054 5,345 13,447 7,008 11,708 11,997コマーシャルペーパー Commercial papers — 3,000 — — — —一年内に償還すべき社債 Current portion of bonds payable 20,500 — — — — —未払法人税等 Income taxes payable 4,575 4,694 5,849 7,164 6,735 8,826賞与引当金 Provision for bonuses 6,061 5,968 5,916 6,283 6,200 6,716その他の引当金 Other provision 36 31 10 41 29 66その他 Other 13,825 17,497 17,978 18,547 26,126 22,296流動負債合計 Total current liabilities 97,394 75,165 84,856 79,228 94,404 89,074
II 固定負債 II Noncurrent liabilities:社債 Bonds payable — — 10,000 10,000 10,000 10,000長期借入金 Long-term loans payable 4,427 3,474 6,234 9,255 6,255 11,954繰延税金負債 Deferred tax liabilities 3,913 4,204 7,344 13,713 11,128 5,686退職給付引当金 Provision for retirement benefits 15,421 13,049 12,718 12,598 12,890 12,959役員退職慰労引当金 Provision for directors’ retirement benefits 1,122 755 750 804 180 191その他 Other 17,270 16,384 17,852 14,273 15,242 15,665固定負債合計 Total noncurrent liabilities 42,155 37,689 54,900 60,646 55,697 56,457負債合計 TOTAL LIABILITIES 139,549 112,854 139,757 139,875 150,101 145,532
(少数株主持分) MINORITY INTERESTS少数株主持分 Minority interests 64 66 2,253 2,354 — —
(資本の部) SHAREHOLDERS’ EQUITY資本金 Capital stock 88,955 88,955 88,955 88,955 — —資本剰余金 Capital surplus 87,147 87,149 87,156 87,226 — —利益剰余金 Retained earnings 115,367 127,147 138,950 155,377 — —その他有価証券評価差額金 Valuation difference on available-for-sale securities 1,520 7,902 9,011 16,425 — —為替換算調整勘定 Foreign currency translation adjustment 1,656 841 679 2,726 — —自己株式 Treasury stock (7,384) (11,690) (11,823) (11,583) — —
資本合計 TOTAL SHAREHOLDERS’ EQUITY 287,262 300,306 312,929 339,127 — —負債、少数株主持分及び資本合計 TOTAL LIABILITIES, MINORITY INTERESTS AND SHAREHOLDERS’ EQUITY ¥426,876 ¥413,227 ¥454,940 ¥481,357 — —(純資産の部) NET ASSETSI 株主資本 I Shareholders’ equity:資本金 Capital stock — — — — 88,955 88,955資本剰余金 Capital surplus — — — — 87,314 87,228利益剰余金 Retained earnings — — — — 171,427 189,282自己株式 Treasury stock — — — — (11,280) (40,919)
株主資本合計 Total shareholders’ equity — — — — 336,415 324,547II 評価・換算差額等 II Valuation and translation adjustments:その他有価証券評価差額金 Valuation difference on available-for-sale securities — — — — 11,321 6,895繰延ヘッジ損益 Deferred gains or losses on hedges — — — — (8) 18為替換算調整勘定 Foreign currency translation adjustment — — — — 8,410 10,427
評価・換算差額等合計 Total valuation and translation adjustments — — — — 19,723 17,341III 新株予約権 III Subscription rights to shares — — — — — 69IV 少数株主持分 IV Minority interests — — — — 2,453 2,875純資産合計 TOTAL NET ASSETS — — — — 358,592 344,833負債及び純資産合計 TOTAL LIABILITIES AND NET ASSETS — — — — ¥508,694 ¥490,365

16 KURARAY CO., LTD.
連結損益計算書(6年間) SIX-YEAR CONSOLIDATED STATEMENTS OF INCOME(百万円 / ¥ million)
FY2002 FY2003 FY2004 FY2005 FY2006 FY2007各3月31日終了年度 Years ended March 31 2003 2004 2005 2006 2007 2008I 売上高 I Net sales ¥322,523 ¥332,149 ¥354,874 ¥375,072 ¥385,284 ¥417,601II 売上原価 II Cost of sales 230,617 236,245 254,114 266,283 275,885 295,220売上総利益 Gross profit 91,906 95,903 100,759 108,789 109,398 122,381
III 販売費及び一般管理費 III Selling, general and administrative expenses:販売費 Selling 20,212 19,490 20,107 21,247 21,031 21,833一般管理費 General and administrative expenses 46,507 48,367 47,464 49,264 48,147 52,417販売費及び一般管理費合計 Total selling, general and administrative expenses 66,720 67,857 67,572 70,512 69,178 74,250営業利益 Operating income 25,186 28,045 33,186 38,277 40,220 48,130
IV 営業外収益 IV Non-operating income:受取利息及び配当金 Interest and dividends income 1,642 1,121 1,191 1,294 — —受取利息 Interest income — — — — 1,021 714受取配当金 Dividends income — — — — 918 1,681為替差益 Foreign exchange gains — — 3,126 — — —負ののれん償却額 Amortization of negative goodwill — — 762 — — —受取賃貸料 Rent income 628 667 616 — — —持分法による投資利益 Equity in earnings of affiliates 360 159 30 56 77 —その他雑収益 Miscellaneous income 1,401 837 918 1,106 812 1,360営業外収益合計 Total non-operating income 4,033 2,785 6,646 2,457 2,829 3,756
V 営業外費用 V Non-operating expenses:支払利息 Interest expenses 1,479 655 297 414 419 835持分法による投資損失 Equity in loss of affiliates — — — — — 20長期金銭債権債務等為替評価損失 Appraisal loss on foreign currency translation of long-term monetary debts and credits — 972 — — — —為替差損 Foreign exchange losses — — — — — 1,341たな卸資産処分損 Loss on disposal of inventories — — 4,267 2,265 1,236 1,236低操業損 Loss from low operation capacity — — — 1,210 — —その他雑損失 Miscellaneous expenses 5,337 4,635 4,414 4,063 4,848 5,634営業外費用合計 Total non-operating expenses 6,816 6,263 8,979 7,953 6,503 9,068経常利益 Ordinary income 22,402 24,567 30,854 32,781 36,546 42,817
VI 特別利益 VI Extraordinary income:投資有価証券売却益 Gain on sales of investment securities — — — 1,029 3,078 1,589固定資産売却益 Gain on sales of tangible fixed assets 1,564 3,957 259 8,445 3,746 —退職給付制度移行益 Gain on revision of retirement benefit plan — — — — 634 —特別利益合計 Total extraordinary income 1,564 3,957 259 9,475 7,459 1,589
VII 特別損失 VII Extraordinary loss:減損損失 Impairment loss — — — 5,454 1,658 2,256構造改善特別損失 Business structure improvement losses 3,855 5,030 1,248 1,693 5,802 1,701関係会社貸付金貸倒引当金繰入額 Provision of allowance for doubtful accounts for loans to subsidiaries and affiliates — — — — — 305投資有価証券評価損 Loss on valuation of investment securities 4,950 — — 253 292 269固定資産廃棄損失 Loss on disposal of tangible fixed assets — — — 492 670 246事業分離における移転損失 Loss on transfer from business divestitures — — — — — 88その他特別損失 Others 789 — 19 — — —特別損失合計 Total extraordinary loss 9,595 5,030 1,268 7,893 8,423 4,867税金等調整前当期純利益 Income before income taxes 14,372 23,494 29,845 34,362 35,582 39,539
法人税等 Income taxes法人税、住民税及び事業税 Income taxes–current 7,018 6,828 8,723 11,674 12,612 15,726法人税等調整額 Income taxes–deferred (710) 1,480 2,564 1,393 443 (1,839)
法人税等合計 Total income taxes 6,307 8,308 11,287 13,067 13,055 13,887少数株主利益 Minority interests in income 13 4 92 109 114 97当期純利益 Net income ¥8,051 ¥15,181 ¥18,465 ¥21,185 ¥22,412 ¥25,554

KURARAY CO., LTD. 17
連結キャッシュ・フロー計算書(6年間) SIX-YEAR CONSOLIDATED STATEMENTS OF CASH FLOWS(百万円 / ¥ million)
FY2002 FY2003 FY2004 FY2005 FY2006 FY2007各3月31日終了年度 Years ended March 31 2003 2004 2005 2006 2007 2008I 営業活動によるキャッシュ・フロー I Net cash provided by (used in) operating activities:税金等調整前当期純利益 0 Income before income taxes ¥14,372 ¥23,494 ¥29,845 ¥34,362 ¥35,582 ¥39,539減価償却費 0 Depreciation and amortization 19,107 20,784 21,323 25,185 25,495 31,485貸倒引当金の増加額又は減少額 Increase (decrease) in allowance for doubtful accounts 378 52 26 37 (168) 484退職給付引当金の増加額又は減少額 0 Increase (decrease) in provision for retirement benefits (4,252) (2,365) (357) (141) 227 40長期金銭債権債務等為替評価損失 0 Appraisal loss on foreign currency translation of long-term monetary debts and credits — 972 — — — —その他特別損失 Other extraordinary loss (income) 789 — — — — —固定資産売却益 0 Loss (gain) on sales of tangible fixed assets (1,564) (3,957) (259) (8,445) (3,746) —減損損失 0 Impairment loss — — — 5,454 1,658 2,256固定資産廃棄損失 Loss on disposal of tangible fixed assets — — — 492 670 269投資有価証券売却益 Loss (gain) on sales of investment securities — — — (1,029) (3,078) (1,589)投資有価証券評価損失 Loss (gain) on valuation of investment securities 4,950 — — 253 292 246事業分離における移転損失 Loss on transfer from business divestitures — — — — — 88為替差益 Foreign exchange gains — — (3,126) — — —負ののれん償却額 Amortization of negative goodwill — — (762) — — —受取利息及び受取配当金 Interest and dividends income (1,642) (1,121) (1,191) (1,294) (1,939) (2,395)支払利息 Interest expenses 1,479 655 297 414 419 835売上債権の増加額又は減少額 Decrease (increase) in notes and accounts receivable–trade 6,940 (848 273 (5,838) (4,932) 2,043たな卸資産の増加額又は減少額 Decrease (increase) in inventories 7,058 935 (2,155) (4,219) (1,357) (218)仕入債務の増加額又は減少額 Increase (decrease) in notes and accounts payable–trade (7,917) (232) 2,633 (2,504) 2,822 (3,535)前払年金費用の増加額又は減少額 Decrease (increase) in prepaid pension costs — — — (1,629) (1,963) (433)その他営業活動による収入又は支出 Other, net (543) (1,025) 734 1,263 (1,132) (674)小計 Sub-total 39,156 37,344 47,282 42,362 48,848 68,442利息及び配当金の受取額 Interest and dividends income received 1,404 895 820 942 1,554 2,363保険金の受取額 Proceeds from insurance income — — — — 2,149 —利息の支払額 Interest expenses paid (1,640) (838) (299) (388) (420) (809)法人税等の支払額 Income taxes paid (1,578) (6,633) (8,189) (10,225) (13,170) (13,539)
営業活動によるキャッシュ・フロー Net cash provided by (used in) operating activities 37,343 30,768 39,614 32,690 38,961 56,456II 投資活動によるキャッシュ・フロー II Net cash provided by (used in) investment activities:定期性預金の純増加額又は純減少額 Net decrease (increase) in time deposits — — — — (1,890) 970有価証券の純増加額又は純減少額 Net decrease (increase) in short-term investment securities (18,354) 8,362 (2,999) 3,000 (3,292) (60)有形・無形固定資産の取得による支出 0 Purchase of fixed assets (18,522) (30,248) (47,511) (36,069) (32,574) (44,413)有形・無形固定資産の除却による支出 0 Payments for disposal of tangible fixed assets and intangible fixed assets and intangible fixed assets — — — — (2,744) (2,171)有形・無形固定資産の売却による収入 Proceeds from sales of tangible fixed assets 2,046 10,537 469 10,550 4,926 128投資有価証券の取得による支出 Purchase of investment securities (4,547) (548) (1,607) (1,378) (16,953) (13,263)投資有価証券の売却・償還による収入 Proceeds from sales and redemption of investment securities 35,933 7,846 8,400 3,603 7,464 2,265連結範囲の変更を伴う子会社株式の取得による支出 Purchase of investments in subsidiaries resulting in change in scope of consolidation — — — — — (2,282)年金保険積立金積立てによる支出 0 Purchase of insurance funds (1,078) (1,262) (928) (701) (309) (99)年金保険積立金取崩しによる収入 Proceeds from cancellation of insurance funds 21,877 45 54 6,573 15,842 14,848長期前払費用の取得による支出 Purchase of long-term prepaid expenses — — — — (2,457) —その他投資活動による収入又は支出 Other, net 76 993 (573) 729 3,051 (1,139)
投資活動によるキャッシュ・フロー Net cash provided by (used in) investment activities 17,431 (4,273) (44,696) (13,693) (28,936) (45,217)III 財務活動によるキャッシュ・フロー III Net cash provided by (used in) financing activities:短期借入金の純増加額又は純減少額 0 Net increase (decrease) in short-term loans payable (3,270) (5,391) 7,125 (3,322) (74) 4,069コマーシャルペーパーの純増加額又は純減少額 Net decrease (increase) in commercial paper — 3,000 (3,000) — — —長期借入れによる収入 Proceeds from long-term loans payable — 1,790 6,075 3,400 2,000 9,100長期借入金の返済による支出 0 Repayment of long-term loans payable (3,758) (4,373) (2,820) (3,406) (403) (9,015)社債の発行による収入 0 Proceeds from issuance of bonds — — 10,000 — — —社債の償還による支出 0 Redemption of standard bonds (13,000) (20,500) — — — —転換社債の償還による支出 0 Redemption of convertible bonds (23,393) — — — — —少数株主への配当金の支払額 0 Cash dividends paid to minority shareholders — — — — (13) (13)自己株式の売却による収入 0 Proceeds from sales of treasury stock — 18 57 460 566 436自己株式の取得による支出 Purchase of treasury stock (7,336) (4,321) (177) (150) (176) (30,165)配当金の支払額 Cash dividends paid (3,444) (3,350) (4,039) (4,772) (6,248) (7,509)
財務活動によるキャッシュ・フロー Net cash provided by (used in) financing activities (54,202) (33,128) 13,220 (7,790) (4,350) (33,097)IV 現金及び現金同等物に係る換算差額 IV Effect of exchange rate changes on cash and cash equivalents (183) (252) 454 134 272 (235)V 現金及び現金同等物の増加額又は減少額 V Net increase (decrease) in cash and cash equivalents 388 (6,885) 8,593 11,340 5,947 (22,093)VI 現金及び現金同等物の期首残高 VI Cash and cash equivalents, beginning of year 13,496 13,900 7,015 16,743 28,085 34,032VII 新規連結に伴う現金及び現金同等物の増加額 VII Increase in cash and cash equivalents from newly consolidated subsidiary 16 — 1,134 1 — 112VIII 合併に伴う現金及び現金同等物の増加額 VIII Increase in cash and cash equivalents resulting from merger — — — — — 137IX 現金及び現金同等物の期末残高 IX Cash and cash equivalents, end of year ¥13,900 ¥7,015 ¥16,743 ¥28,085 ¥34,032 ¥12,189

18 KURARAY CO., LTD.
製造工程フロー MANUFACTURING PROCESS FLOW
〈エバール〉製造工程 EVAL Manufacturing Process
エチレンEthylene
エチレンEthylene
酸素Oxygen
酢酸Acetic Acid
酢酸ビニルVinyl-Acetate
共重合Copolymerization
<エバール>EVAL Resin
<エバール>フィルムEVAL Film
回収Recovery
酢酸Acetic Acid
原 料 Materials 半製品 Semi-processed goods 製 品 Products 工 程 Process
岡山事業所 Okayama Plant
クラレアメリカ(ヒューストン) Kuraray America, Inc. (Houston)
エバールヨーロッパ(アントワープ) EVAL Europe N.V. (Antwerp)
Saponification
ポバール・ブチラール製造工程 PVA & PVB Manufacturing ProcessエチレンEthylene
酸素Oxygen
酢酸Acetic Acid
合成Synthesizing
酢酸ビニルVinyl-Acetate
重合Polymerization
ポバールPVA Resin
ポバールフィルムPVA Film
回収Recovery
ブチラール化Butyralization
ブチルアルデヒドButyraldehyde
ブチラールPVB Resin
ブチラールフィルムPVB Film
メタノールMethanol
酢酸Acetic Acid
原 料 Materials
半製品 Semi-processed goods
製 品 Products
工 程 Process
岡山事業所 Okayama Plant
新潟事業所 Niigata Plant
ポバールアジア(シンガポール) Poval Asia Pte Ltd (Singapore)
クラレヨーロッパ(フランクフルト ) Kuraray Europe GmbH (Frankfurt)クラレヨーロッパ(トロイスドルフ)
Kuraray Europe GmbH (Troisdorf)クラレヨーロッパ(ニシニノブゴロド)Kuraray Europe GmbH (Nizhny Novgorod)
西条事業所Saijo Plant
倉敷事業所Kurashiki Plant
Saponification

KURARAY CO., LTD. 19
イソプレン製造工程 Isoprene Manufacturing Process
C4留分C4 Fraction
メタノールMethanol
イソブチレンIsobutylene
ブタジエンButadiene
スチレンモノマーStyrene Monomer
ホルマリンFormalin
合成Synthesizing
イソプレンモノマーIsoprene Monomer
ノナンジアミン・メチル・オクタンジアミンNonanediamine, Methyl Octanediamine
重合Polymerization
テレフタル酸Telephthalic Acid
熱可塑性エストラマーThermoplastic Elastomer
イソプレン誘導品Isoprene Derivative
ファインケミカルズFine Chemicals
<ジェネスタ>GENESTAR
鹿島事業所 Kashima Plant
クラレ西条(株)Kuraray Saijo Co., Ltd.
※ジェネスタ GENESTAR
新潟事業所 Niigata Plant
※ファインケミカルズ Fine chemicals
原 料 Materials 半製品 Semi-processed goods 製 品 Products 工 程 Process
クラレアメリカ(ヒューストン)Kuraray America, Inc. (Houston)
※熱可塑性エラストマー Thermoplastic elastomers
Distillation and Refining
メタクリル樹脂製造工程 Methacrylic Resin Manufacturing Process
空気Air
メタノールMethanol
硫酸Sulfuric Acid
天然ガスNatural Gas
アセトンAcetone
アンモニアAmmonia
アセトンシアンヒドリンAcetone Cyanohydrin
シアン化水素Hydrogen Cyanide
メタクリル酸メチルMethyl Methacrylate
メタクリル酸Methacrylic Acid
シアン誘導品Cyanide Derivative
MMAモノマーMMA Monomer
メタクリル樹脂Methacrylic Resin
原 料 Materials 半製品 Semi-processed goods 製 品 Products 工 程 Process
新潟事業所 Niigata Plant

20 KURARAY CO., LTD.
製造工程フロー MANUFACTURING PROCESS FLOW
ビニロン・〈クラロンK-II〉製造工程 KURALON & KURALON K-II Manufacturing Process
エチレンEthylene
酸素Oxygen
酢酸Acetic Acid
酢酸ビニルVinyl-Acetate
溶剤湿式冷却ゲル紡糸Solvent Wet-Cooled Gel Spinning
造粒・押出Chip Conditioning
and Extrusion
溶解・ろ過・紡糸Dissolution, Filtration
and Spinning
ポバールPVA Resin
ビニロンフィラメントKURALON Filament
ビニロンステープルKURALON Staple
<クラロン K-II>KURALON K-II
仕上Finishing
仕上Finishing
原 料 Materials 半製品 Semi-processed goods 製 品 Products 工 程 Process
岡山事業所 Okayama Plant
人工皮革製造工程 Man-Made Leather Manufacturing Process
ナイロンNylon
ポリウレタンPolyurethane
ポリエステルPolyester
マイクロファイバーMicro Fiber
不織布Non-Woven Fabrics
<クラリーノ>CLARINO
ニードルパンチNeedle Punching
加工・仕上Processing and Finishing
原 料 Materials 半製品 Semi-processed goods 製 品 Products 工 程 Process
岡山事業所 Okayama Plant

KURARAY CO., LTD. 21
会社情報/株式情報 CORPORATE INFORMATION/STOCK DATA
株価チャート Share Price Movement
株式会社クラレKuraray Co., Ltd.
設立年月日: 1926年6月24日Date of establishment: June 24, 1926
資本金: 88,955百万円Capital: ¥88,955 million
発行済株式総数: 382,863,603株Issued number of shares: 382,863,603 shares
0
500
1,000
1,500
2,000
’04/1 2 3 4 5 6 7 8 9 10 11 12 ’05/1 2 3 4 5 6 7 8 9 10 11 12 ’06/1 2 3 4 5 6 7 8 9 10 11 12 ’07/1 2 3 4 5 6 7 8 9 10 11 12
80,000
60,000
40,000
20,000
0
(円 / ¥) (円 / ¥)20,000
15,000
株価(左軸)出来高日経平均(右軸)
Share Price (left)VolumeNikkei Stock Average (right)
’08/1 2 3 4
(千株/Thousands of shares)
会社概要
各3月31日時点 At March 31 2004 2005 2006 2007 2008
信託銀行 Trust banks 30.33 26.78 20.36 21.63 20.48
生命保険会社 Life insurance companies 11.39 10.53 8.90 10.09 9.56
都銀その他金融機関 City banks and other financial institutions 8.96 10.86 12.32 12.47 12.21外国人 Non-Japanese institutions 28.51 32.54 37.62 34.08 32.40
その他国内法人 Other Japanese institutions 3.28 2.70 2.86 2.84 2.99
証券会社 Securities companies 1.46 1.64 1.81 3.28 2.34
自己株式 Treasury stock 4.08 4.11 4.02 3.89 9.05
個人・その他 Individuals and other 11.99 10.84 12.11 11.72 10.97計 Total 100 100 100 100 100
(%)
200820072006200520040
10
20
30
40
50
60
70
80
90
100
所有者別株式分布の推移 Breakdown by Type of Shareholder
株式会社 クラレ本社東京本社 〒100-8115
東京都千代田区大手町1-1-3(大手センタービル)TEL. (03) 6701-1000 FAX. (03) 6701-1005
大阪本社 〒530-8611大阪市北区梅田1-12-39(新阪急ビル)TEL. (06) 6348-2111 FAX. (06) 6348-2165
Kuraray Co., Ltd.Head OfficesTokyo Ote Center Bldg., 1-1-3, Otemachi, Chiyoda-ku, Tokyo
100-8115, JapanTEL. 81-3-6701-1000 FAX. 81-3-6701-1005
Osaka Shin-Hankyu Bldg., 1-12-39, Umeda, Kita-ku, Osaka530-8611, JapanTEL. 81-6-6348-2111 FAX. 81-6-6348-2165
URL http://www.kuraray.co.jp