Embed Size (px)
DESCRIPTION
The Right Question for Health&Safety : ‘ Why has it changed? ’ rather than ‘ How can it be changed? ’. 백 도명 서울대 보건대학원. 우리나라 산재발생의 변화. Dilution of Risk. Transform of Risk. Transfer of Risk. 우리나라 직업병의 규모. A Descriptive Model. 왜 산업안전보건이 변화하는가 ?. EXPANSION. PLATEAU. FALL. - PowerPoint PPT Presentation
Citation preview
The Right Question for Health&Safety:‘Why has it changed?’ rather than ‘How can it be changed?’
백 도명서울대 보건대학원

우리나라 산재발생의 변화
1964
1965
1966
1967
1968
1969
1970
1971
1972
1973
1974
1975
1976
1977
1978
1979
1980
1981
1982
1983
1984
1985
1986
1987
1988
1989
1990
1991
1992
1993
1994
1995
1996
1997
1998
1999
2000
0
12
34
56
78
910
111213
14
0
0.1
0.2
0.3
0.4
0.5
0.6
0.7
0.8
0.9
1
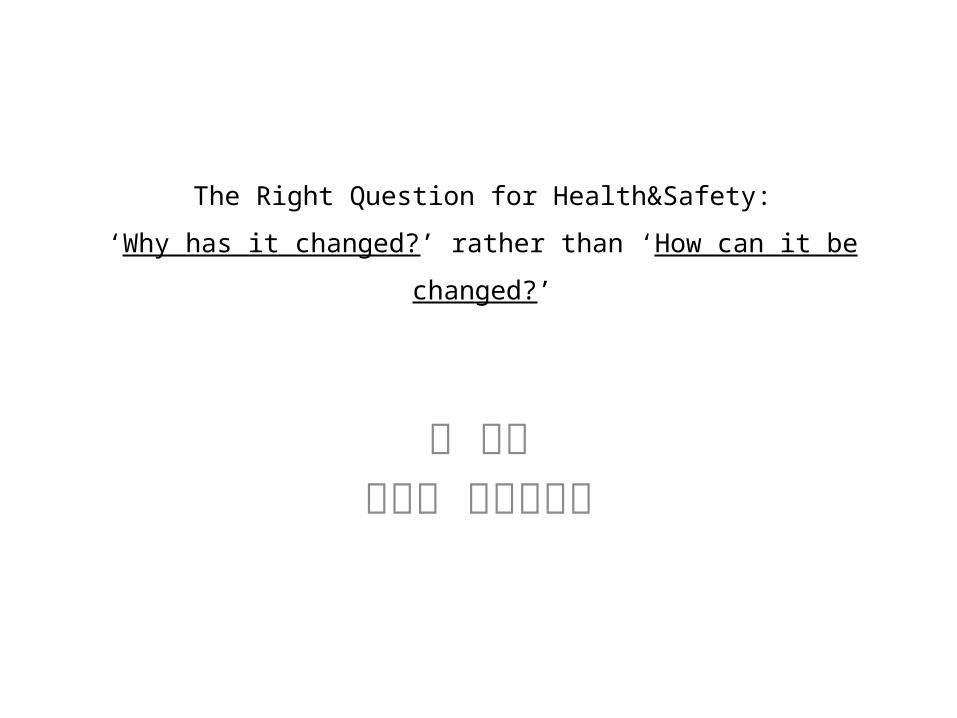
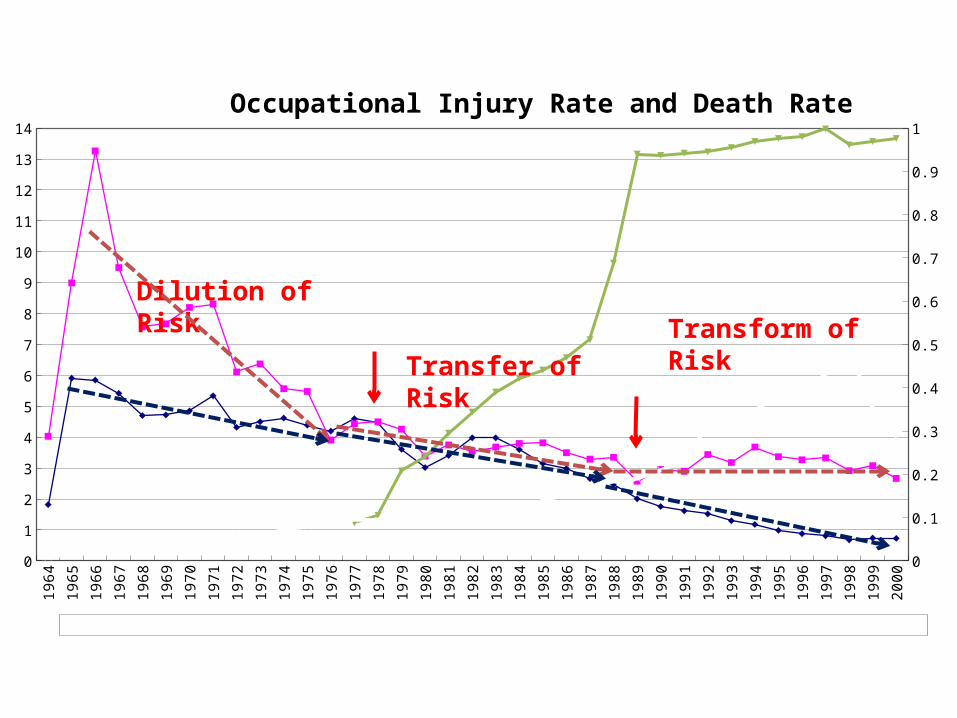
Occupational Injury Rate and Death Rate
Occupational Injury Rate Occupational Death Rate Health Insurance Coverage Proportion of Disabled

1964
1965
1966
1967
1968
1969
1970
1971
1972
1973
1974
1975
1976
1977
1978
1979
1980
1981
1982
1983
1984
1985
1986
1987
1988
1989
1990
1991
1992
1993
1994
1995
1996
1997
1998
1999
2000
0
12
34
56
78
910
111213
14
0
0.1
0.2
0.3
0.4
0.5
0.6
0.7
0.8
0.9
1
Occupational Injury Rate and Death Rate
Occupational Injury Rate Occupational Death Rate Health Insurance Coverage Proportion of Disabled

1964
1965
1966
1967
1968
1969
1970
1971
1972
1973
1974
1975
1976
1977
1978
1979
1980
1981
1982
1983
1984
1985
1986
1987
1988
1989
1990
1991
1992
1993
1994
1995
1996
1997
1998
1999
2000
0
1,000,000
2,000,000
3,000,000
4,000,000
5,000,000
6,000,000
7,000,000
8,000,000
9,000,000
10,000,000
0.0%
5.0%
10.0%
15.0%
20.0%
25.0%
30.0%
35.0%
40.0%
45.0%
50.0%
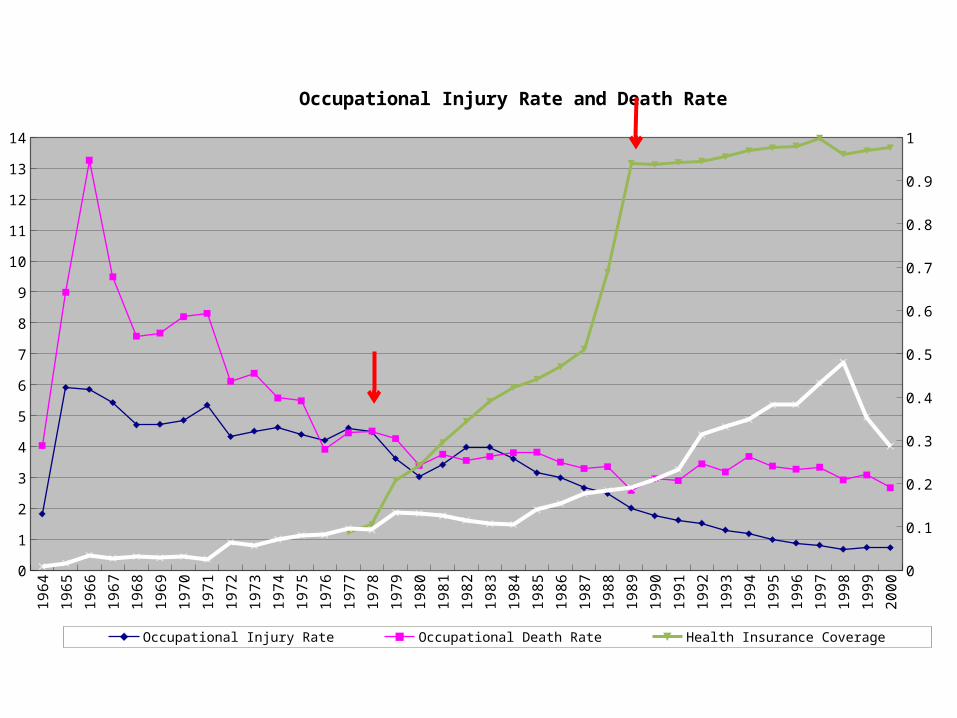
The Number and Proportion Covered by Industrial Accident Compensation Program
Number of Insured Proportion of Insured among Economically Active Population
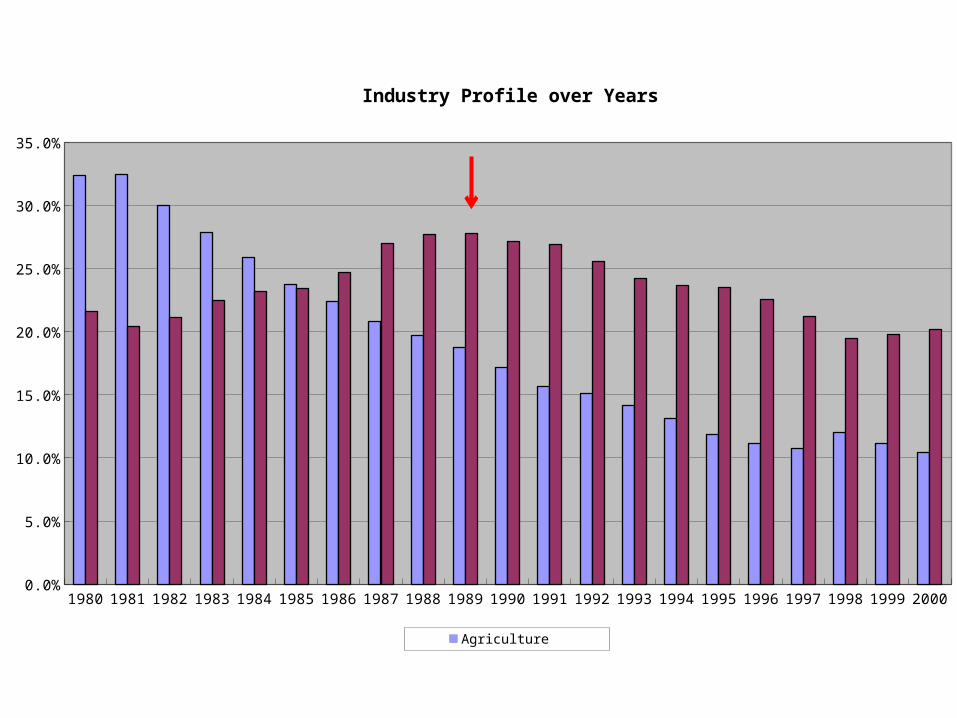
1980 1981 1982 1983 1984 1985 1986 1987 1988 1989 1990 1991 1992 1993 1994 1995 1996 1997 1998 1999 20000.0%
5.0%
10.0%
15.0%
20.0%
25.0%
30.0%
35.0%
Industry Profile over Years
Agriculture Manufacturing
1980
1981
1982
1983
1984
1985
1986
1987
1988
1989
1990
1991
1992
1993
1994
1995
1996
1997
1998
1999
2000
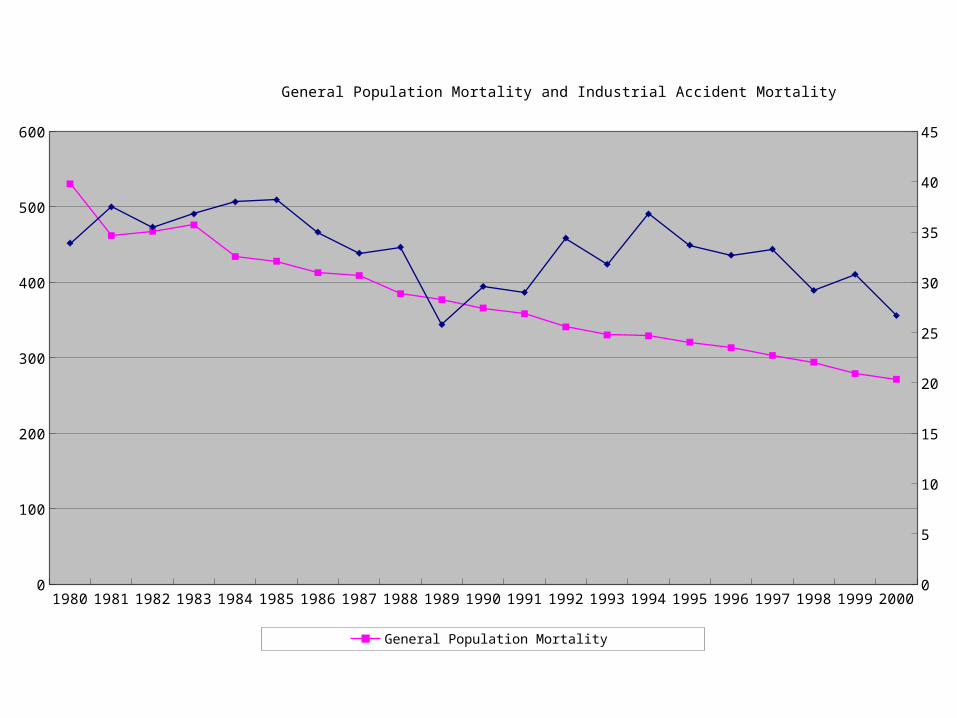
0
100
200
300
400
500
600
0
5
10
15
20
25
30
35
40
45
General Population Mortality and Industrial Accident Mortality
General Population Mortality Industrial Accident Mortality

1980
1981
1982
1983
1984
1985
1986
1987
1988
1989
1990
1991
1992
1993
1994
1995
1996
1997
1998
1999
2000
5.0%
6.0%
7.0%
8.0%
9.0%
10.0%
11.0%
12.0%
Occupational Death Rate and Its Proportion over Total Death Rate among General Population
Proportion over Total Death Rate
1964
1965
1966
1967
1968
1969
1970
1971
1972
1973
1974
1975
1976
1977
1978
1979
1980
1981
1982
1983
1984
1985
1986
1987
1988
1989
1990
1991
1992
1993
1994
1995
1996
1997
1998
1999
2000
0
12
34
56
78
910
1112
1314
0
0.1
0.2
0.3
0.4
0.5
0.6
0.7
0.8
0.9
1Occupational Injury Rate and Death Rate
Occupational Injury Rate Occupational Death Rate Health Insurance Coverage
Dilution of Risk
Transfer of Risk
Transform of Risk

우리나라 직업병의 규모
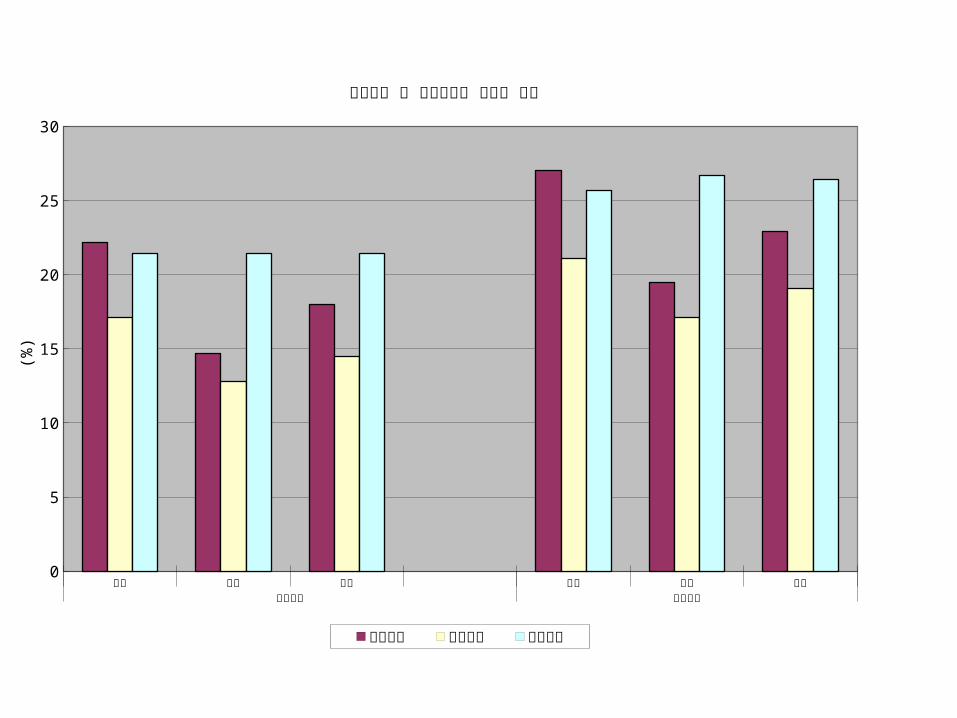
남성 여성 전체 남성 여성 전체급성질환 만성질환
0
5
10
15
20
25
30
위중도로 본 직업관련성 질환의 비중
활동제한 침상와병 활동감소
(%)
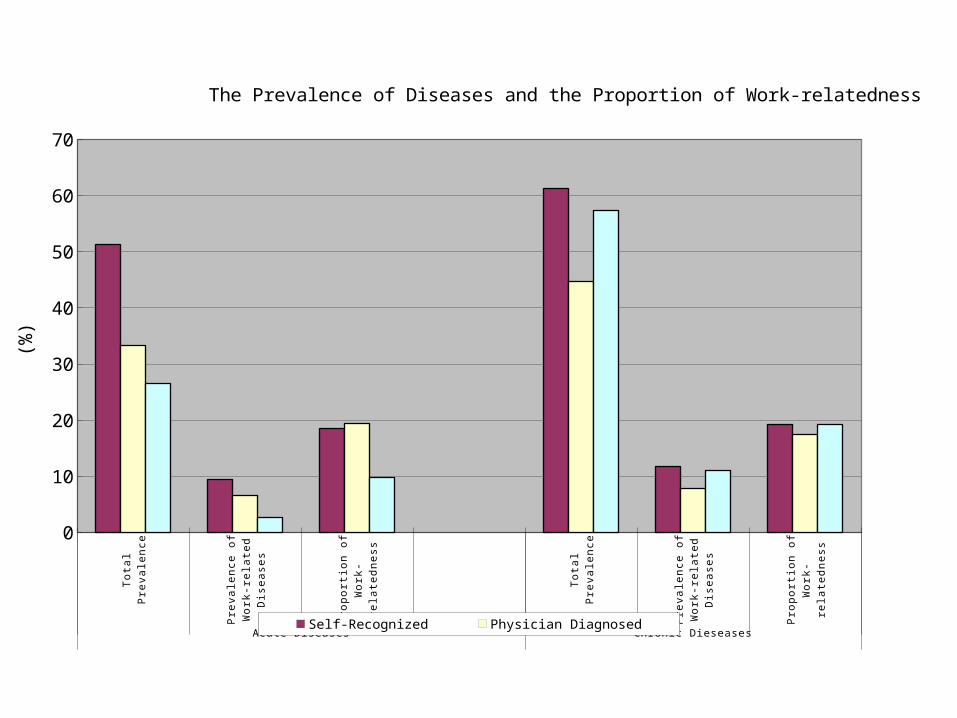
Total Prevalence Prevalence of Work-related
Diseases
Proportion of Work-relatedness
Total Prevalence Prevalence of Work-related
Diseases
Proportion of Work-relatedness
Acute Diseases Chronic Dieseases
0
10
20
30
40
50
60
70
The Prevalence of Diseases and the Proportion of Work-relatedness
Self-Recognized Physician Diagnosed Hospital Treated
(%)

왜 산업안전보건이 변화하는가 ?A Descriptive Model

Asbestos Mining and Import, Korea
0
2,000
4,000
6,000
8,000
10,000
12,000
14,000
16,000
18,000
0
20000
40000
60000
80000
100000
120000
Mining Import
Phases of Change
EXPAN-SION
FALLPLATEAU

Key EventsAsbestos Consumption in Korea and Japan
0
50,000
100,000
150,000
200,000
250,000
300,000
350,000
400,000
0
2,000
4,000
6,000
8,000
10,000
12,000
14,000
16,000
18,000
Import to Japan Mining in Korea
Industrial Safety and Health Act of Japan, 1972
Industrial Safety and
Health Act of Korea, 1981
0
50,000
100,000
150,000
200,000
250,000
300,000
350,000
400,000
ton
Year
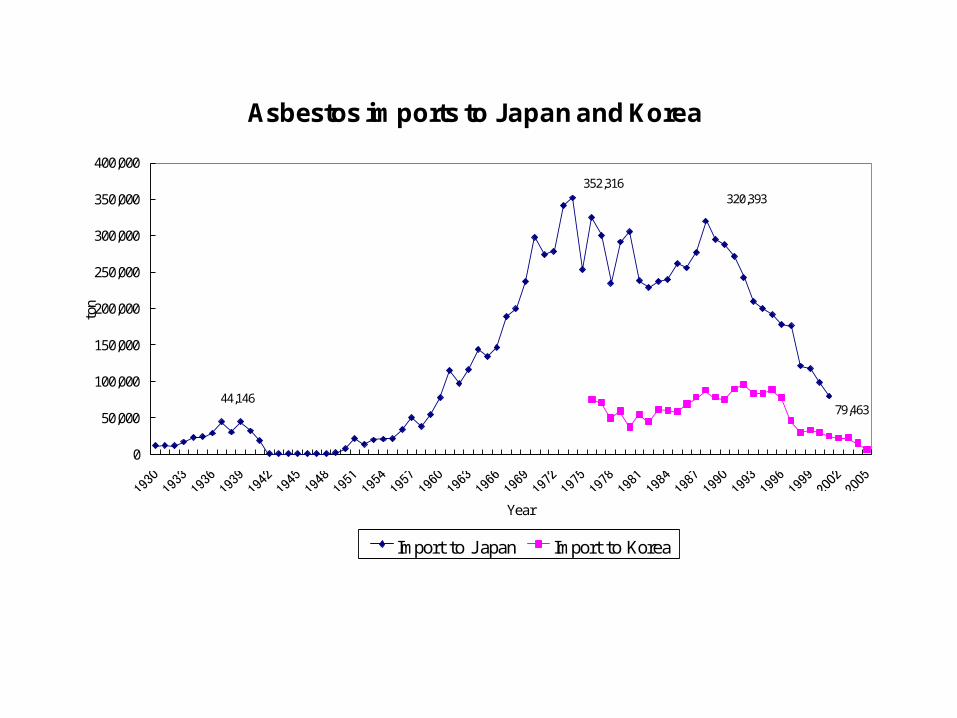
Asbestos imports to Japan and Korea
Import to J apan Import to Korea
352,316
79,46344,146
320,393

Asbestos imports to Japan and Korea
0
50,000
100,000
150,000
200,000
250,000
300,000
350,000
400,000
Year
ton
Import to J apan Import to Korea
352,316(1974)
79,463(2001)
44,146(1939)
320,393(1988)
First Mesothelioma Case in J apan (1978)First Mesothelioma Case in Korea (1994)
Second Mesothelioma Case in J apan (1984)

Asbestos Mining and Import, Korea
0
2,000
4,000
6,000
8,000
10,000
12,000
14,000
16,000
18,000
0
20000
40000
60000
80000
100000
120000
Mining Import
Phases of Change
EXPAN-SION
FALLPLATEAU
Industrial Safety and Health Act of Korea, 1981
First Mesothe-lioma Case in Korea, 1994

Expansion Phase
ShrinkagePhase
PlateauPhase
Source
Expo-sure
Effect
Ac-tion
Repercussions
Foreign Investment
AdministrativeRegulation Asbestos
Ban
Source, Exposure, Effect, and Action (SEEA) Model of Asbestos Industry

왜 산업안전보건이 변화하는가 ?A Theoretical Model
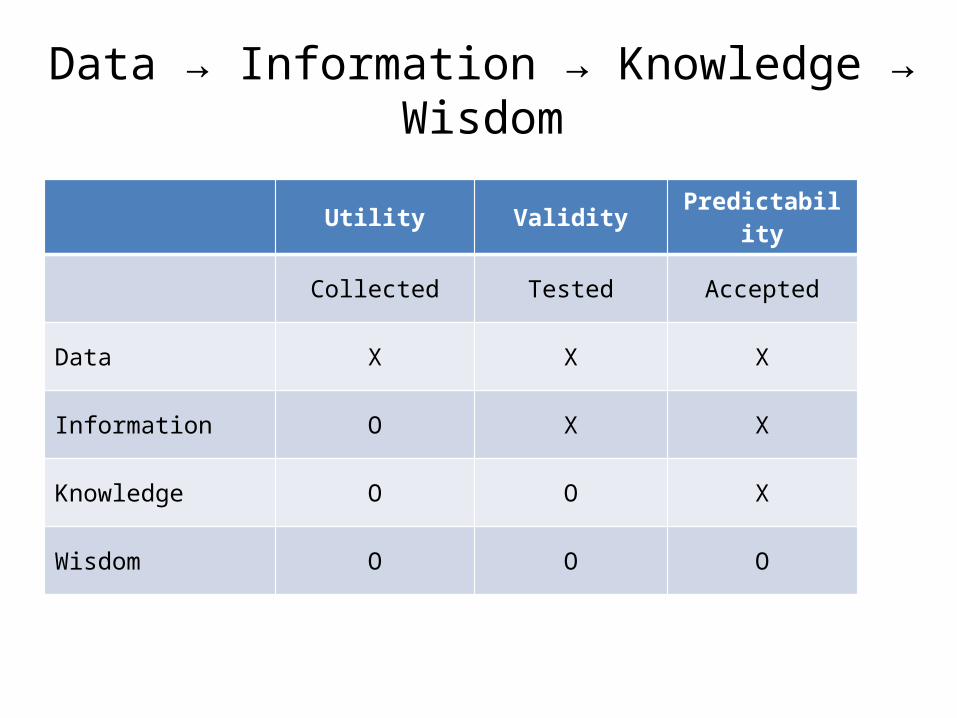
Data → Information → Knowledge → Wis-dom
Utility Validity Predictabil-ity
Collected Tested Accepted
Data X X X
Information O X X
Knowledge O O X
Wisdom O O O

Risk Assessment and Management
Utility ValidityPre-
dicta-bility
Risk Approach
Collected Tested Ac-cepted
Data X X X Assessment Superficial
Informa-tion O X X Technical
Knowledge O O X Institu-tional
Wisdom O O O Manage-ment Cultural
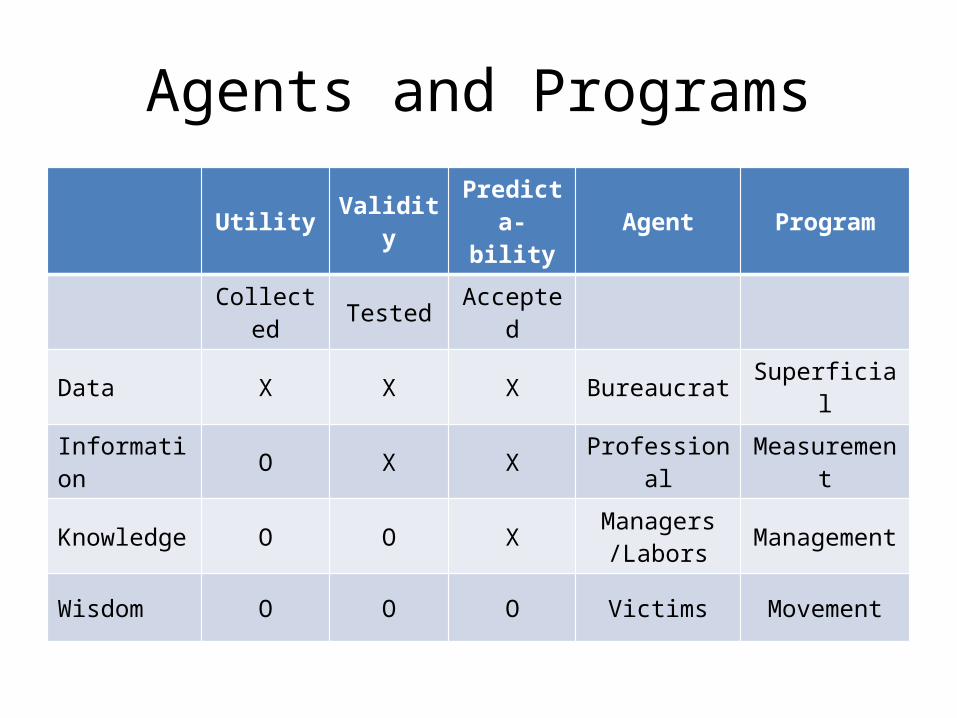
Agents and ProgramsUtility Valid-
ityPre-
dicta-bility
Agent Program
Col-lected Tested Ac-
cepted
Data X X X Bureaucrat Superficial
Informa-tion O X X Professional Measure-
ment
Knowledge O O X Managers/Labors
Manage-ment
Wisdom O O O Victims Movement
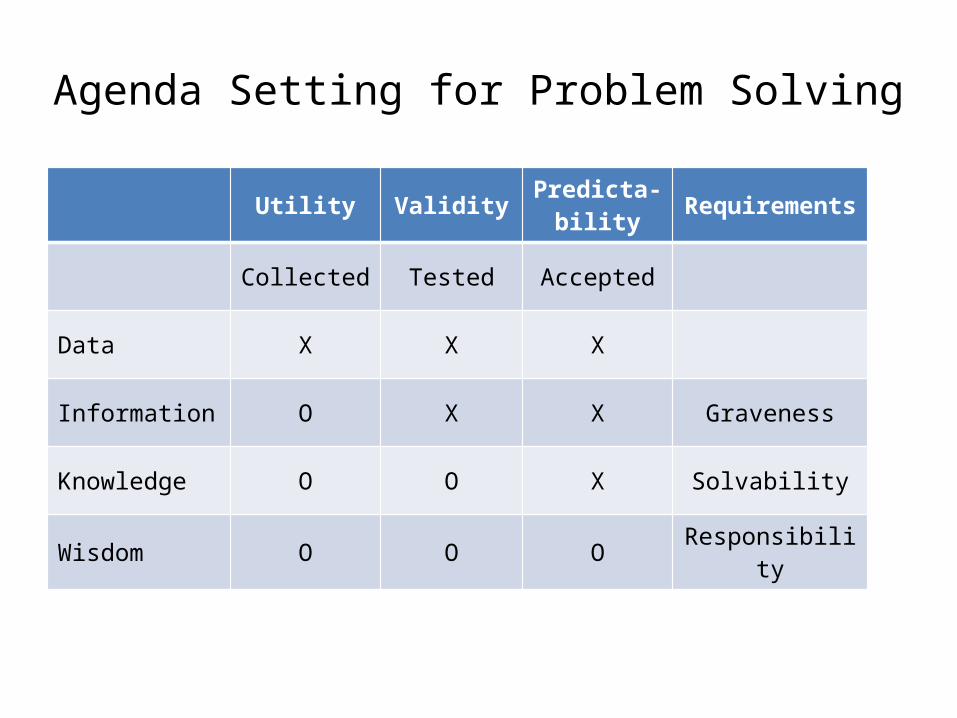
Agenda Setting for Problem SolvingUtility Validity Predicta-
bilityRequire-ments
Collected Tested Accepted
Data X X X
Information O X X Graveness
Knowledge O O X Solvability
Wisdom O O O Responsibility
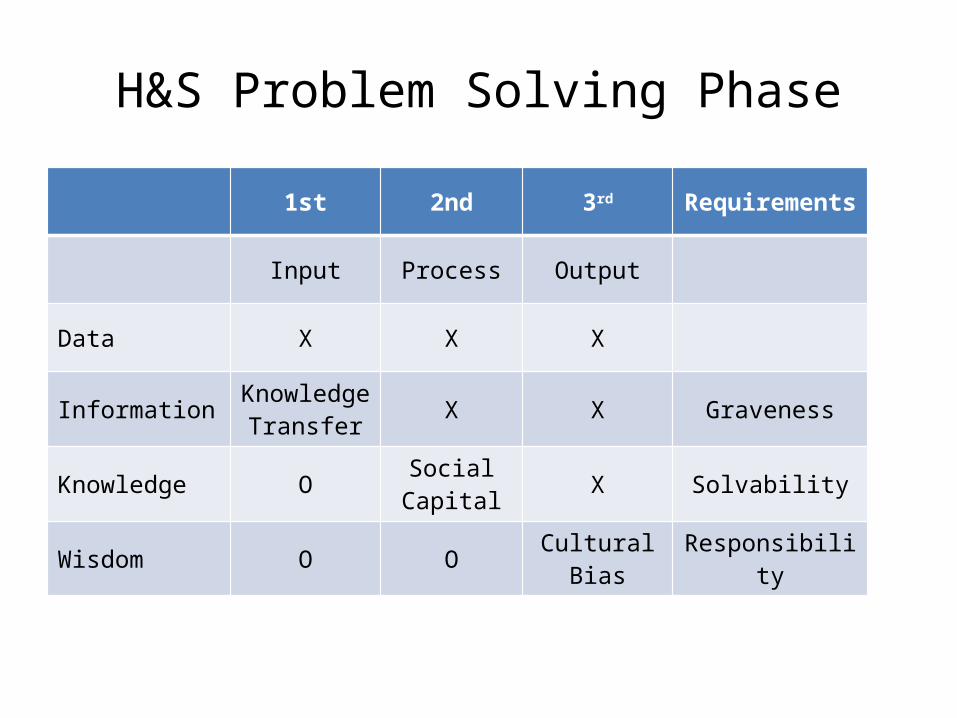
H&S Problem Solving Phase1st 2nd 3rd Require-
ments
Input Process Output
Data X X X
InformationKnowl-edge
TransferX X Graveness
Knowledge O Social Capital X Solvability
Wisdom O O Cultural Bias Responsibility
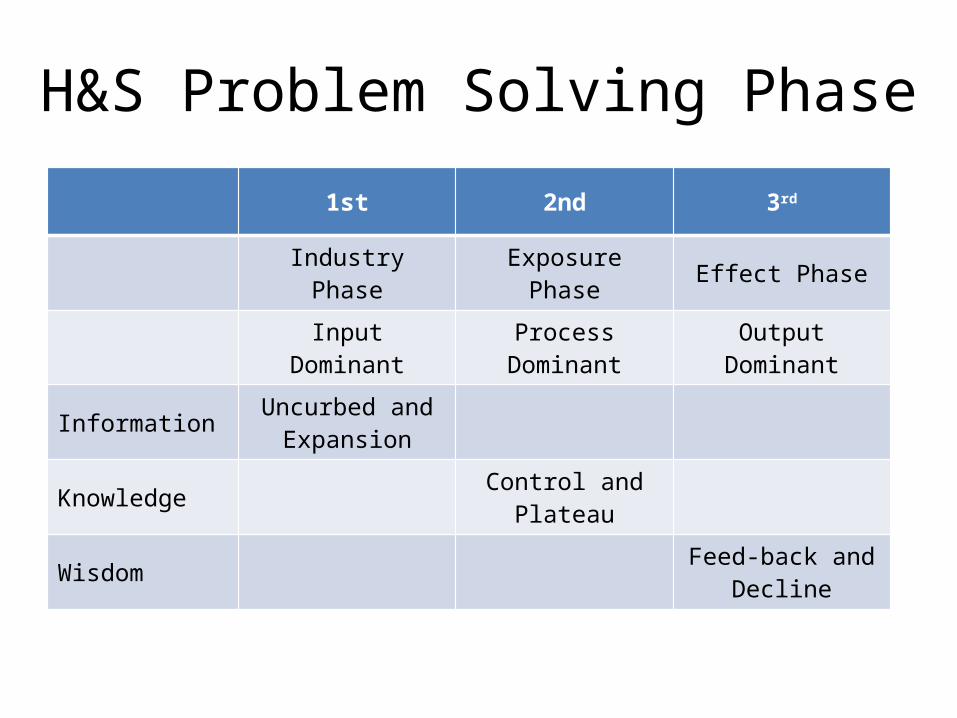
H&S Problem Solving Phase1st 2nd 3rd
Industry Phase Exposure Phase Effect Phase
Input Dominant Process Domi-nant
Output Domi-nant
Information Uncurbed and Expansion
Knowledge Control and Plateau
Wisdom Feed-back and Decline

H&S Problem Solving Phase - Who1st 2nd 3rd
Input Process Output
Data Bureaucrat
Information Employer Professional
Knowledge Labor Union NGO
Wisdom Victim
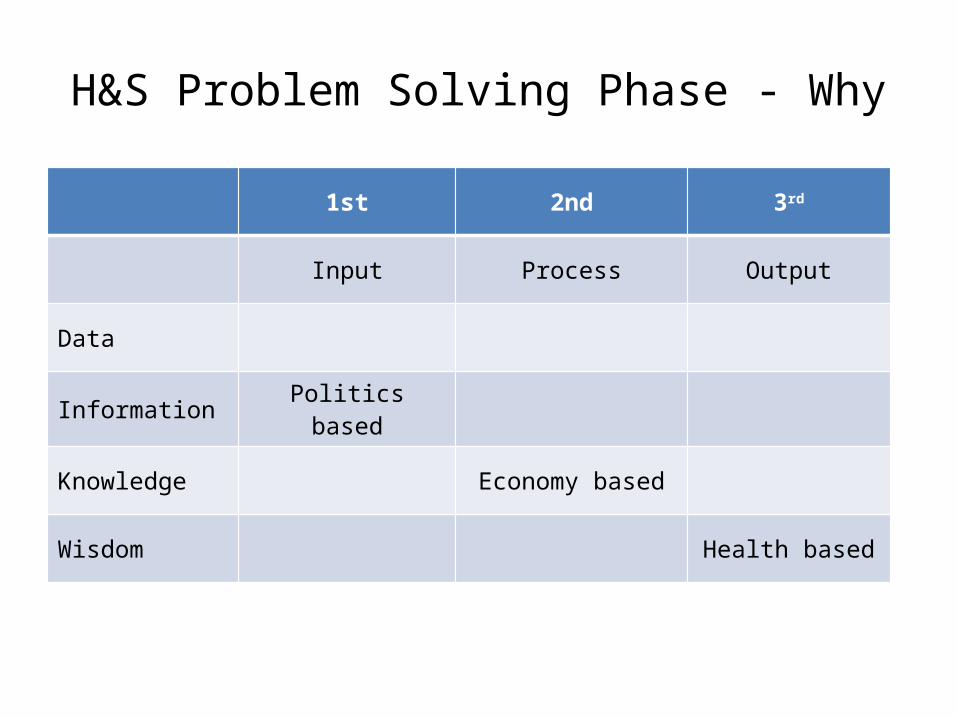
H&S Problem Solving Phase - Why1st 2nd 3rd
Input Process Output
Data
Information Politics based
Knowledge Economy based
Wisdom Health based

H&S Problem Solving Phase - What1st 2nd 3rd
Input Process Output
Data
Information Technical
Knowledge Management
Wisdom Culture

H&S Problem Solving Phase - How1st 2nd 3rd
Input Process Output
Data
Information Code-based
Knowledge Performance-based
Wisdom System-based
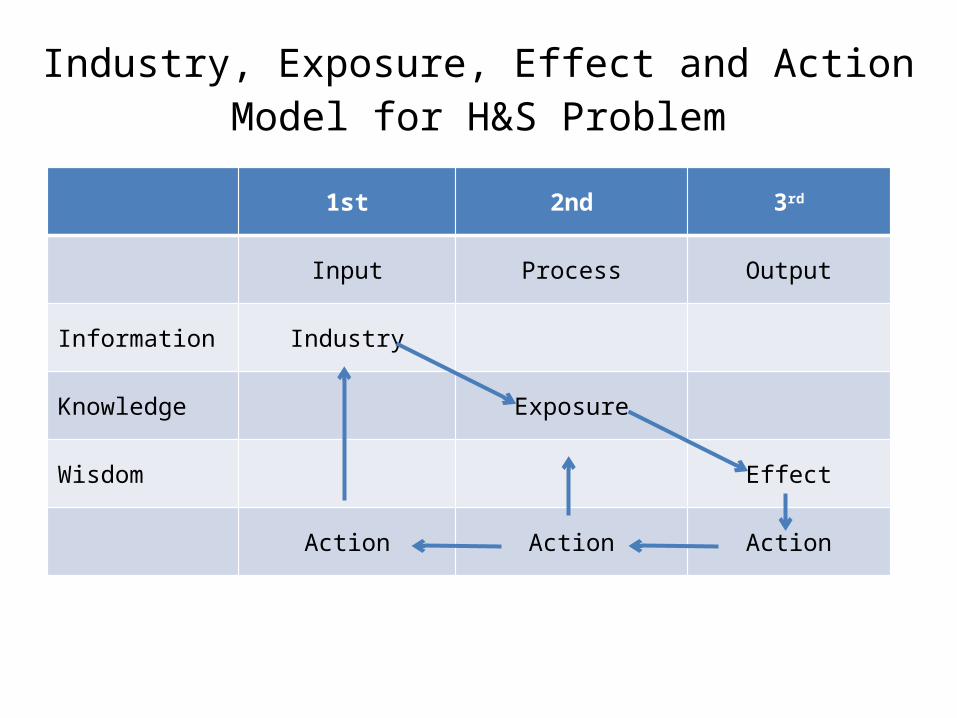
Industry, Exposure, Effect and Action Model for H&S Problem
1st 2nd 3rd
Input Process Output
Information Industry
Knowledge Exposure
Wisdom Effect
Action Action Action
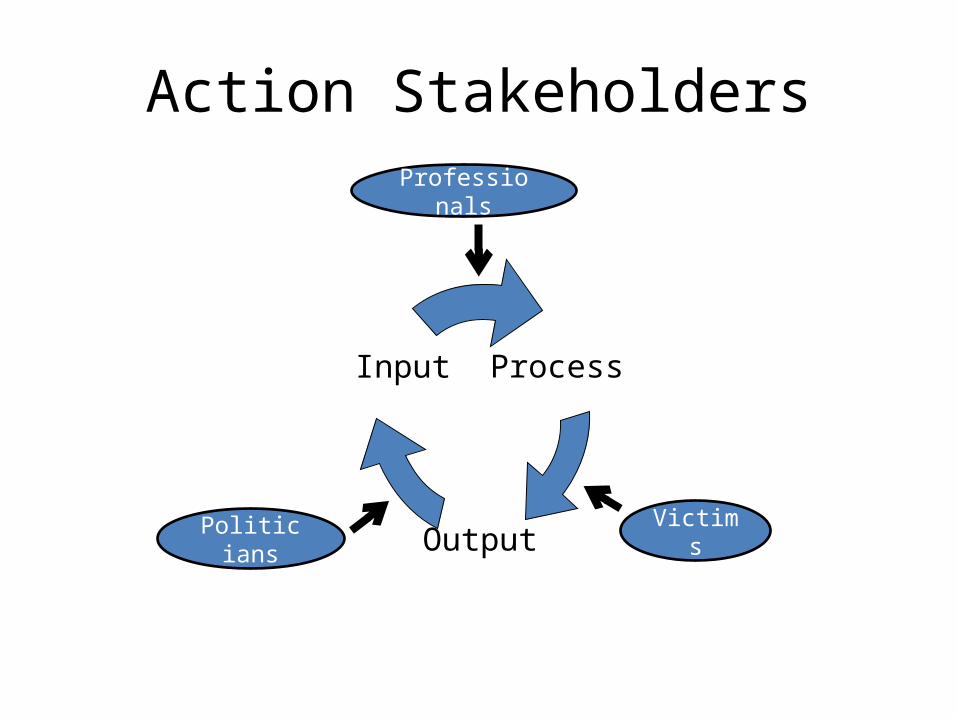
Action Stakeholders
Process
Output
Input
Vic-tims
Politi-cians
Profession-als

IEEA MODEL 의 검증
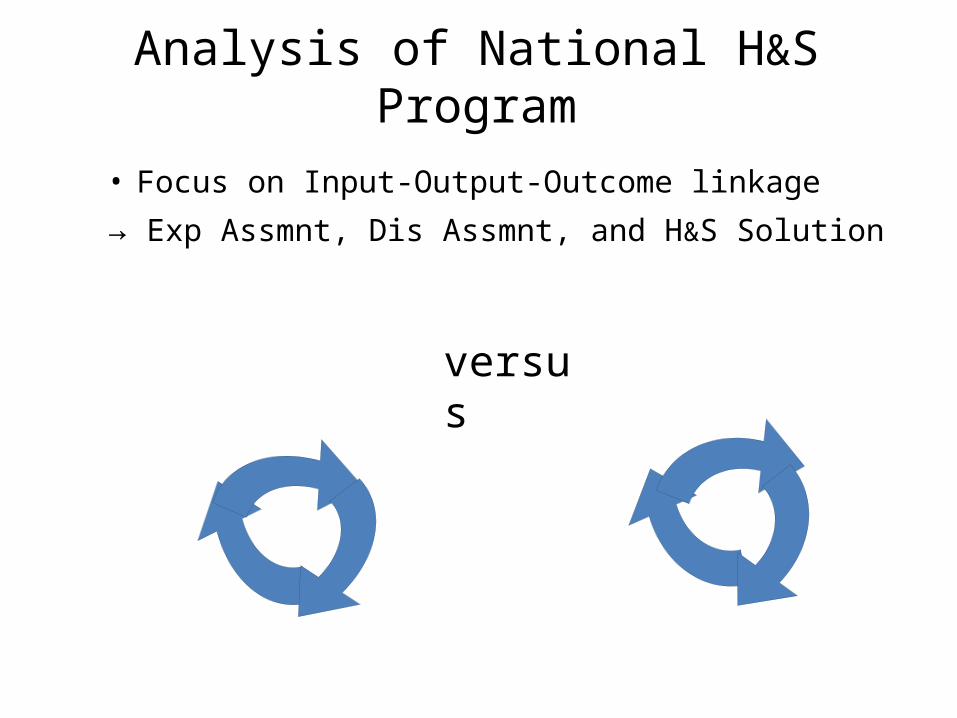
Analysis of National H&S Program• Focus on Input-Output-Outcome linkage→ Exp Assmnt, Dis Assmnt, and H&S Solution
ver-sus
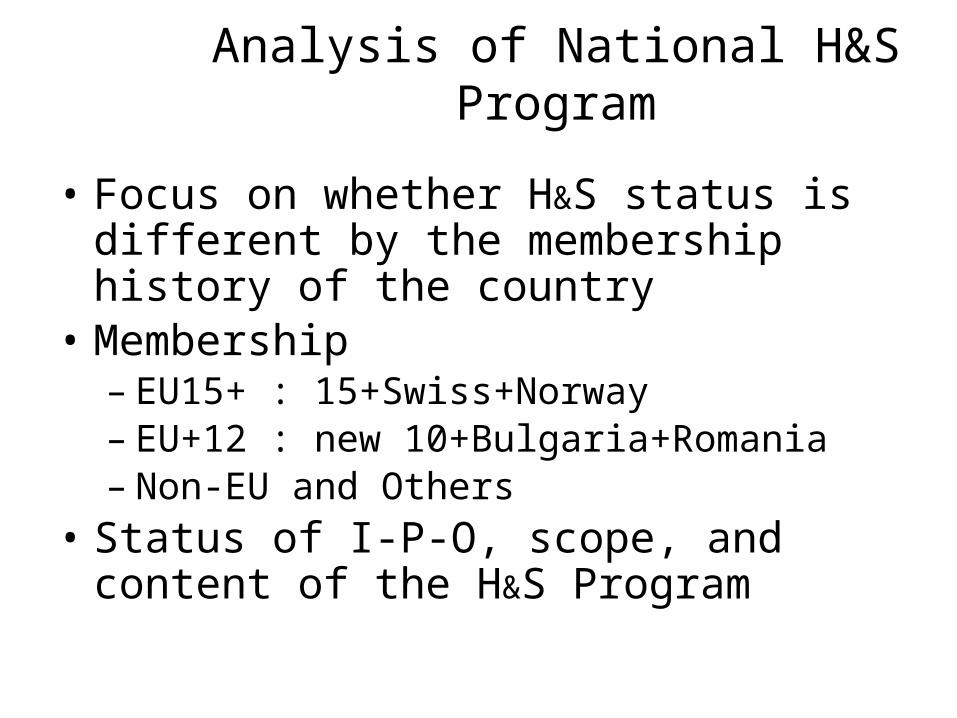
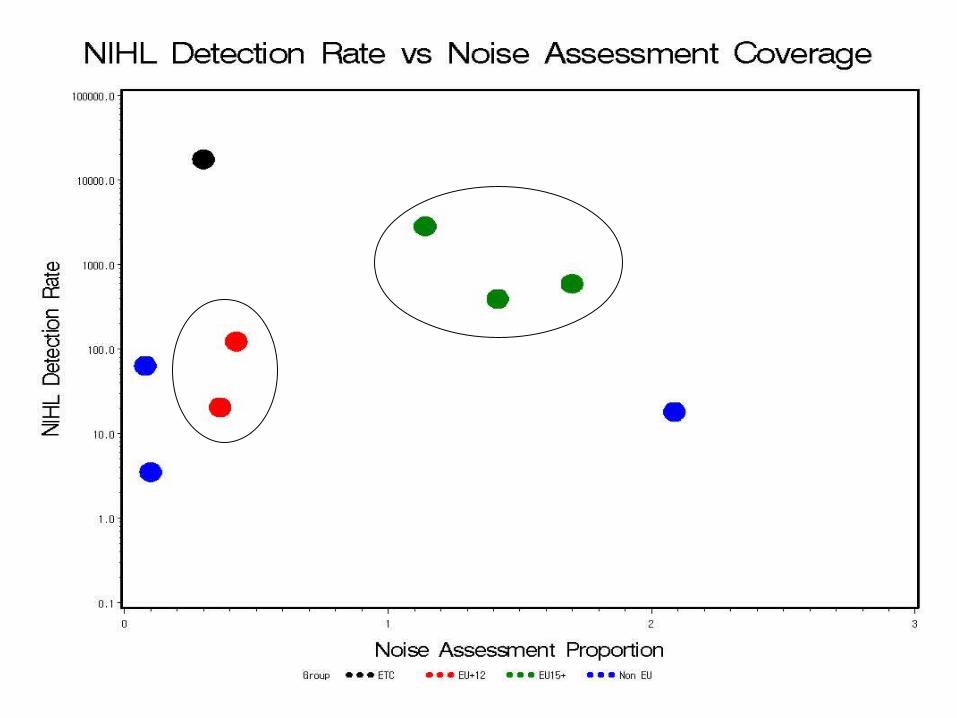
• Focus on whether H&S status is dif -ferent by the membership history of the country
• Membership– EU15+ : 15+Swiss+Norway– EU+12 : new 10+Bulgaria+Romania– Non-EU and Others
• Status of I-P-O, scope, and content of the H&S Program
Analysis of National H&S Program
Questionnaire Survey• National Focal Points and CCs• 20 countries had answered• Because of the nature of the questions,
not all countries could have provided rele-vant information
• The current results are still provisional, and need to be confirmed by the providers
• The survey is still open, and will continue to receive responses from other countries

Analysis of Data• Noise Assessment Coverage No of workers assessed for noise exposure = -------------------------------------------------- No of employees in 1st & 2ndary industries• NIHL Detection Rate No of NIHL Cases per year = -------------------------------------------------- No of employees in 1st & 2ndary industries• Accident Report Coverage No of workers for accident rate denomina-tor = -------------------------------------------------- No of economically active employees

Noise Assessment, Overexposure, and Hearing Loss
0.0%
50.0%
100.0%
150.0%
200.0%
250.0%
EU
15+
EU
15+
EU
15+
EU
15+
EU
15+
EU
15+
EU
15+
EU
+12
EU
+12
EU
+12
EU
+12
EU
+12
EU
+12
Non
EU
Non
EU
Non
EU
Non
EU
Non
EU
ETC
ETC
BelgiumFranceAustriaPortugalGreeceSwissNorwayPolandCzechSlovakEstoniaRomaniaBulgariaUkraineCroatiaRussiaArmeniaTurkeyIsrael USA
Exp
Ass
essm
ent C
over
age
0.1
1.0
10.0
100.0
1000.0
10000.0
100000.0
Hea
ring
Loss
Det
ectio
n R
ate
N_Ass_rate N_Overexp_pcnt N_Diag_rate
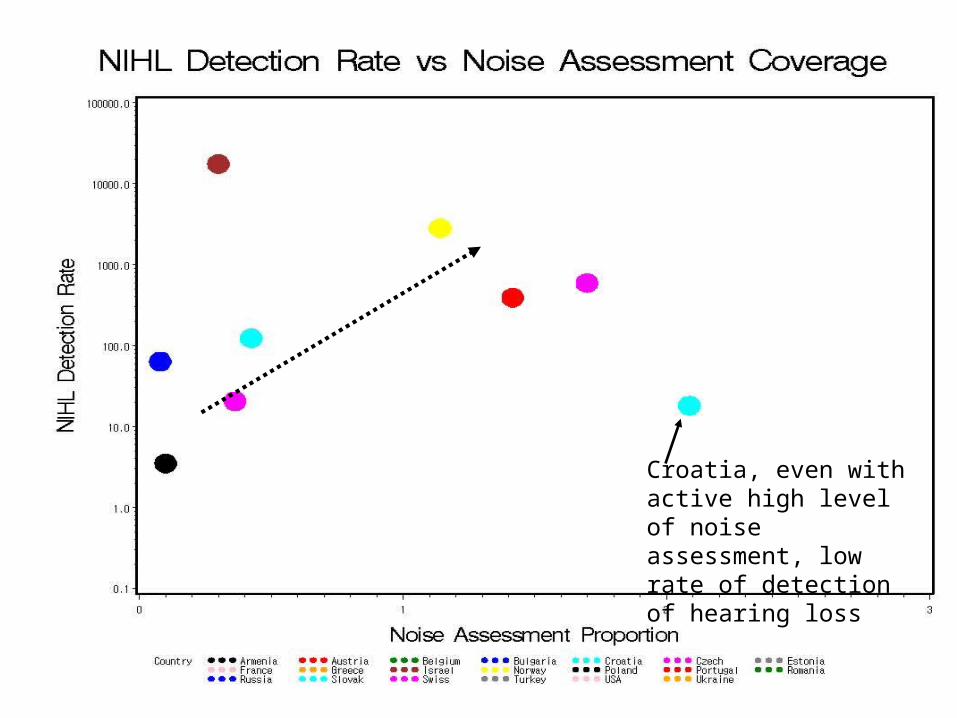
Croatia, even with ac-tive high level of noise assessment, low rate of detection of hearing loss
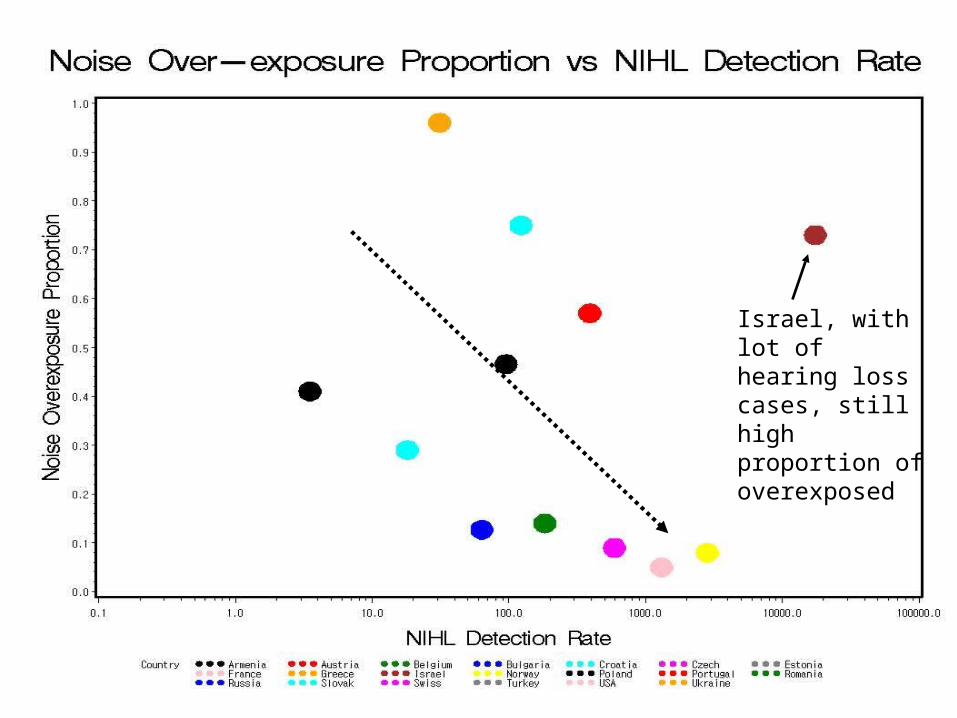
Israel, with lot of hearing loss cases, still high proportion of overexposed
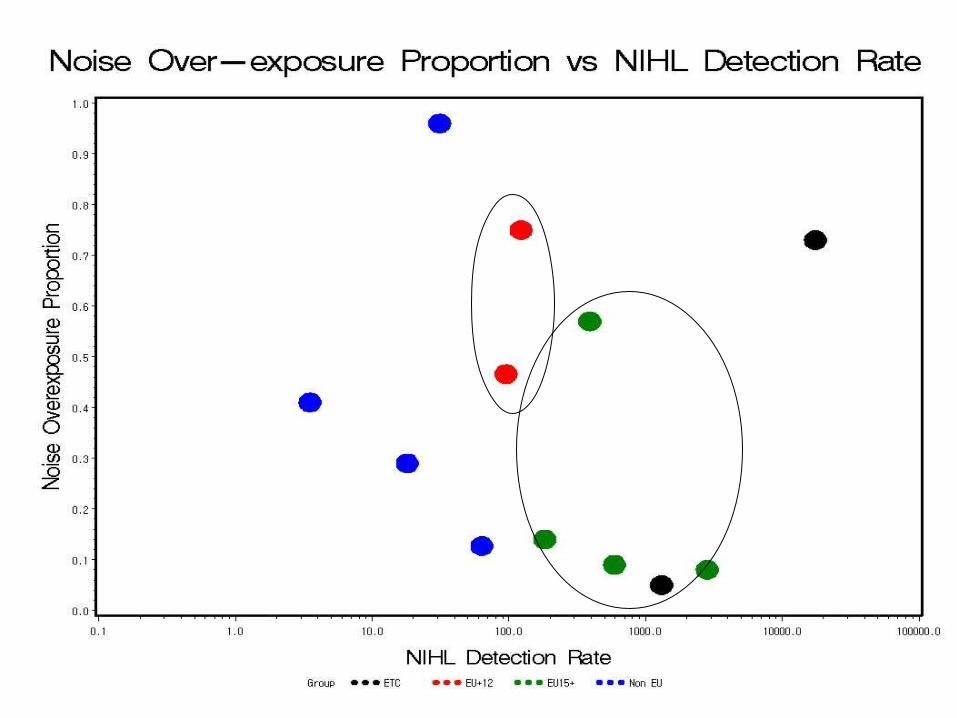
Noise and Hearing Loss• As noise assessment coverage ↑ → No of Noise Induced Hearing Loss ↑• No of Noise Induced Hearing Loss ↑ → Proportion of Noise Overexposure ↓• EU15+ countries tend to have more
Hearing Loss Cases and less Overex-posures than EU+12 countries
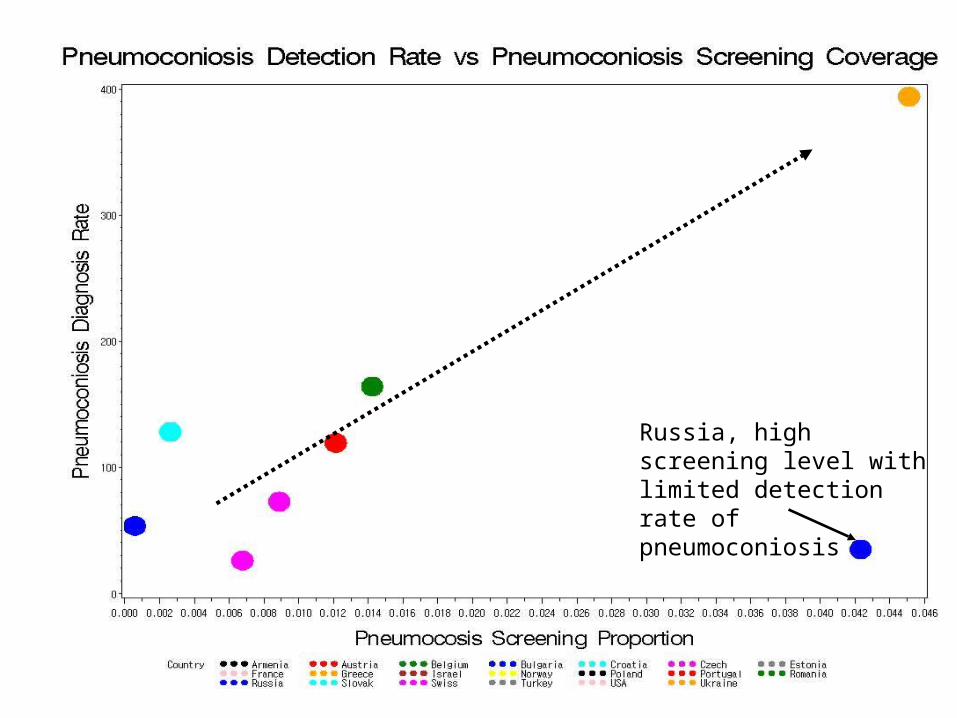
Russia, high screening level with limited detec-tion rate of pneumoco-niosis

Dust and Pneumoconiosis• Pneumoconiosis screening coverage
↑ → Detection rate of pneumoconio-sis ↑
• EU15+ countries are not that differ-ent from EU+12 countries in the screening coverage or detection rate of pneumoconiosis


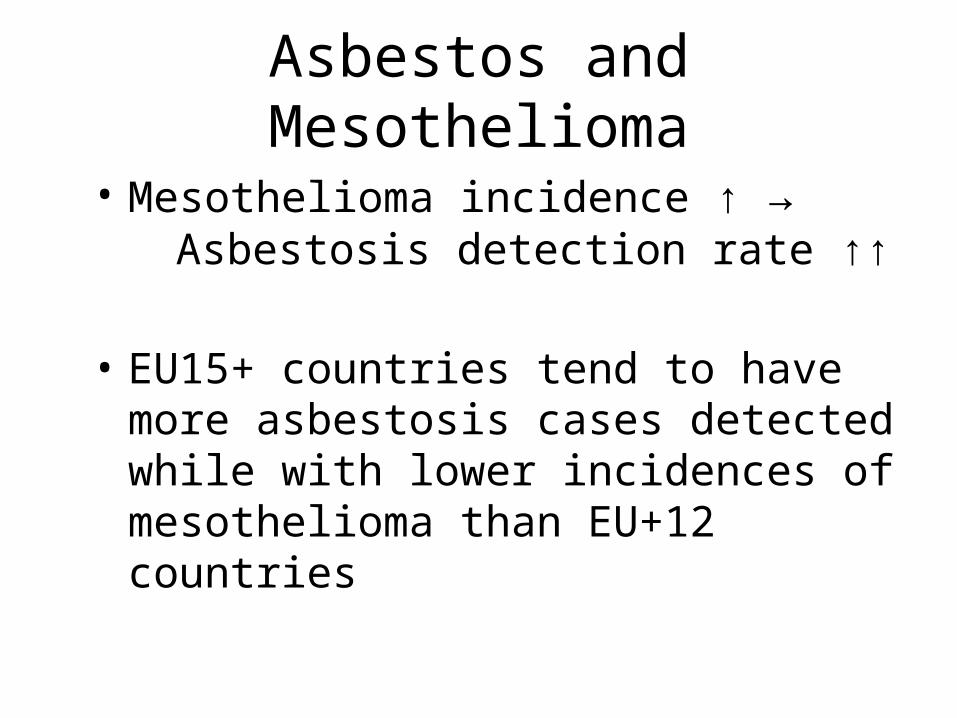
Asbestos and Mesothelioma• Mesothelioma incidence ↑ →
Asbestosis detection rate ↑↑
• EU15+ countries tend to have more asbestosis cases detected while with lower incidences of mesothelioma than EU+12 countries

Accident Report Coverage and Fatal Accident Rate
0.0%
20.0%
40.0%
60.0%
80.0%
100.0%
120.0%
EU15+ EU15+ EU15+ EU15+ EU15+ EU15+ EU15+ EU+12 EU+12 EU+12 EU+12 EU+12 EU+12 Non EU Non EU Non EU Non EU Non EU ETC ETC
Belgium France Austria Portugal Greece Swiss Norway Poland Czech Slovak Estonia RomaniaBulgaria Ukraine Croatia Russia Armenia Turkey Israel USA
Acc
iden
t Rep
ort C
over
age
0.000
0.500
1.000
1.500
2.000
2.500
Fata
l Acc
iden
t Rat
e
Fatal_Accd_Coverage Accd_Fatality(/10000)
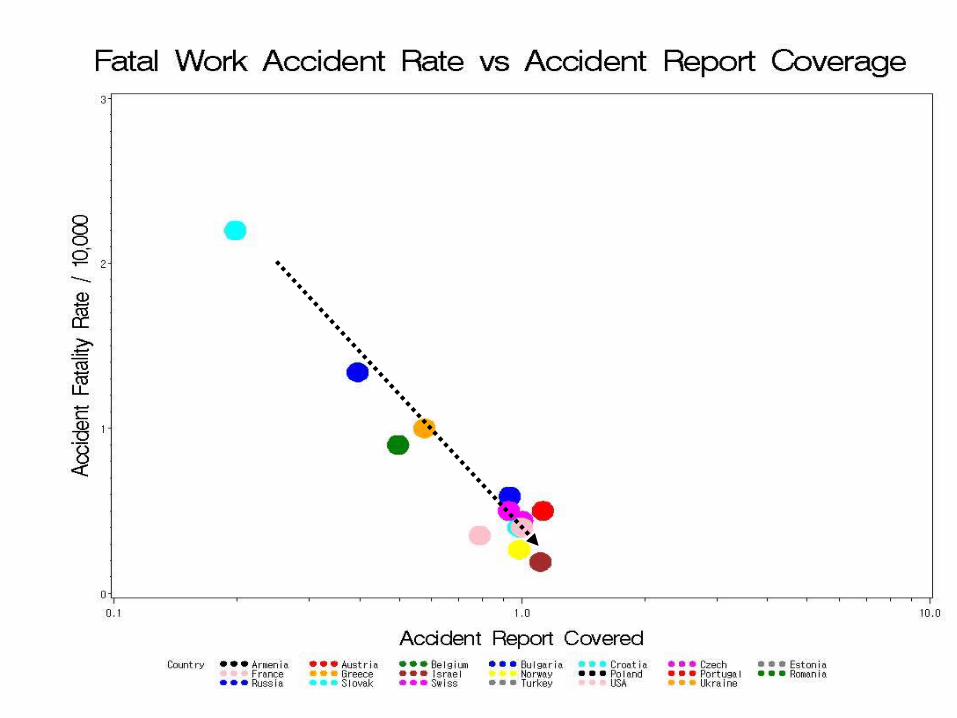
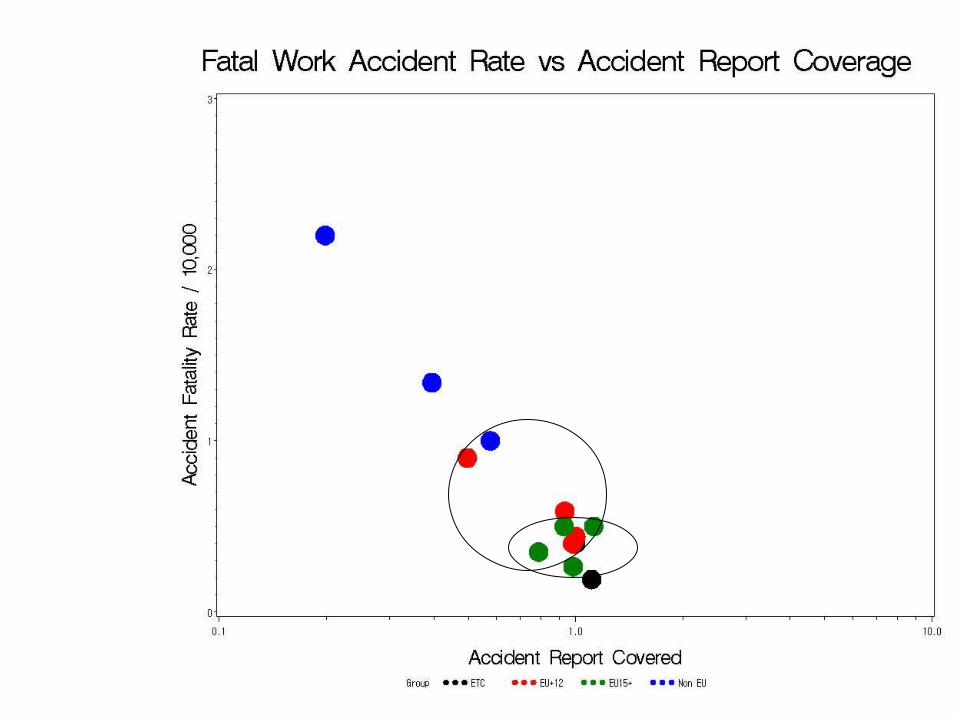
Injury Reporting and Fa-tality
• The broader the segment from which accidents are reported, the lower the fatal accident rates
• EU15+ countries tend to have a broader accident reporting base and a lower fatal accident rate than EU+12 countries

Discussions (1)• The H&S problem solving cycle is
not Exp Ass → Exp Reduction → Dis Reduction, but Exp Ass → Dis Detection → Exp Reduction.
• Here the core ideas of problem solving strategy should lie with how to link exposure assessment with disease detection, and also how to link disease detection to source control.
• Many countries still show high exposure assessment coverage with no or minimal disease detections, and high disease detection rate with no source con-trols.
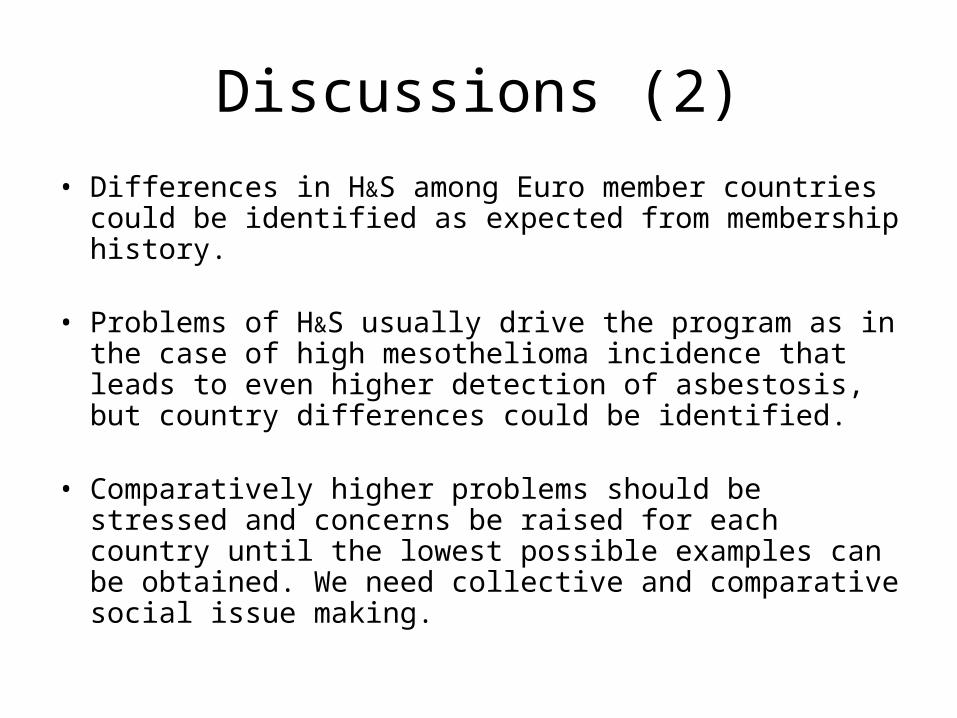
Discussions (2)• Differences in H&S among Euro member countries
could be identified as expected from membership history.
• Problems of H&S usually drive the program as in the case of high mesothelioma incidence that leads to even higher detection of asbestosis, but country dif -ferences could be identified.
• Comparatively higher problems should be stressed and concerns be raised for each country until the lowest possible examples can be obtained. We need collective and comparative social issue making.

Discussions (3)• Scope of the H&S program is important in that
the coverage determines the detection rate of NIHL and pneumoconiosis, and for accidents, it determines the over-all accident rates of the society.
• Target priority may be important, but general universal acknowledgement of H&S values by the society is more fundamental to the effec-tiveness of the program.
• Risk population is at risk, not because of high risk works, but because of acceptance of high risks for that particular working population.
• Minority populations including non-standard workers and illegal migrant workers should be given particular considerations in this issue of the H&S program scopes.

1975 1980 1985 1990 1995 2000 2005 20100
2
4
6
8
10
12
14
16
18
Germany (1993)
Belgium (1998)
Denmark (1986)
Spain (2002)
Finland (1992)France (1996)Italy (1992)
Norway (1981)
Switzerland (1989)
Mesothelioma Incidence (2000) and Year of Asbestos Ban in Europe
Mes
othe
liom
a In
cide
nce
(/M
illio
n)

WHAT SHOULD WE DO?
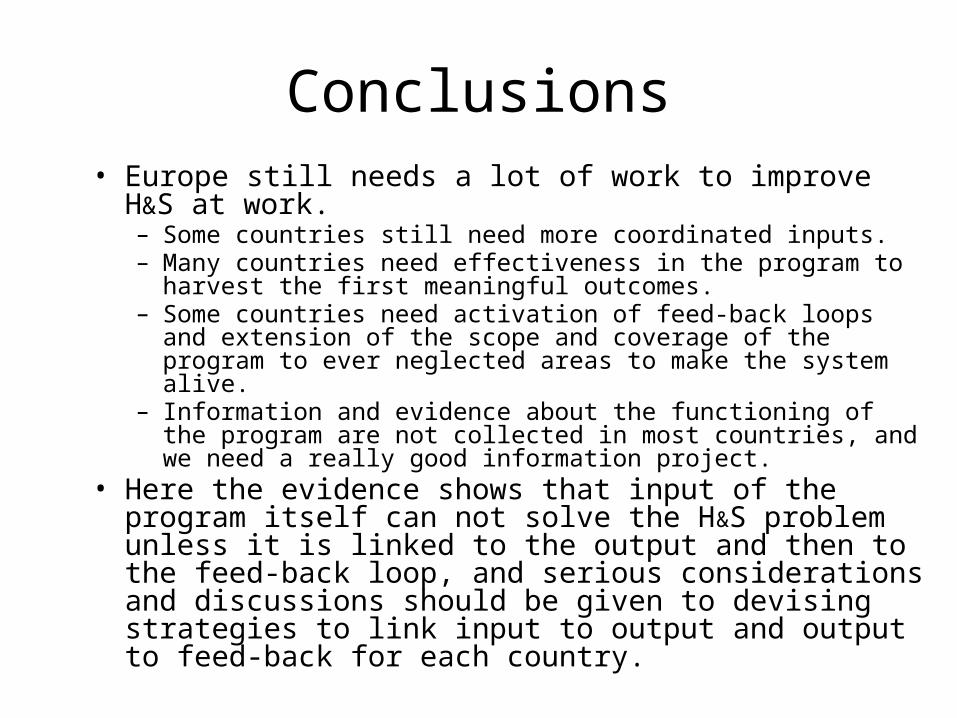
Conclusions• Europe still needs a lot of work to improve H&S at
work.– Some countries still need more coordinated inputs.– Many countries need effectiveness in the program to
harvest the first meaningful outcomes.– Some countries need activation of feed-back loops and
extension of the scope and coverage of the program to ever neglected areas to make the system alive.
– Information and evidence about the functioning of the program are not collected in most countries, and we need a really good information project.
• Here the evidence shows that input of the pro-gram itself can not solve the H&S problem unless it is linked to the output and then to the feed-back loop, and serious considerations and dis-cussions should be given to devising strategies to link input to output and output to feed-back for each country.
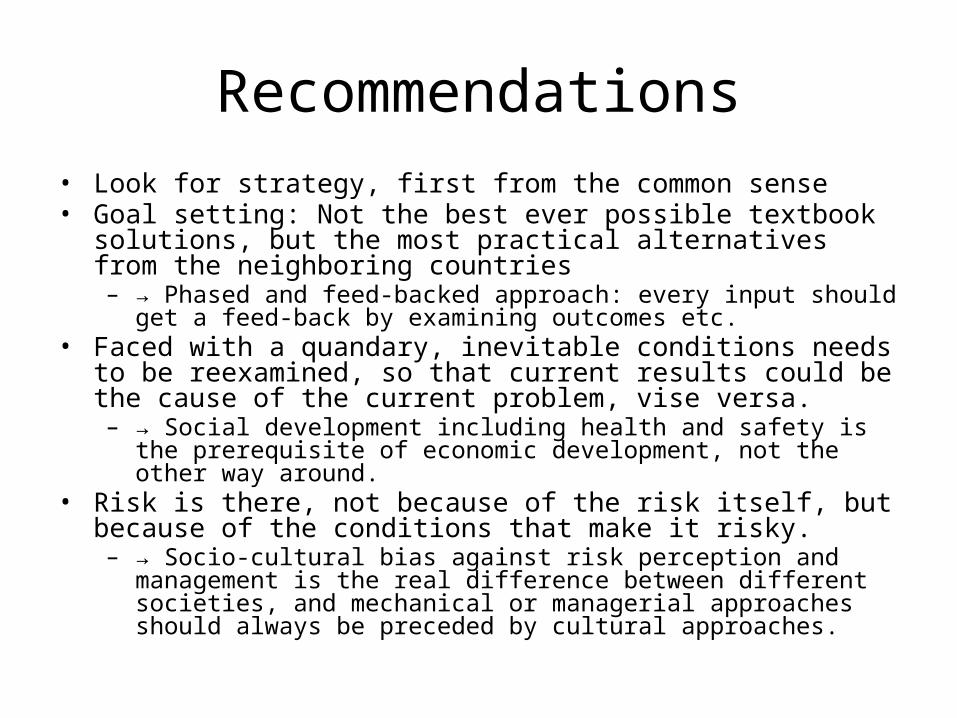
Recommendations• Look for strategy, first from the common sense• Goal setting: Not the best ever possible textbook solutions,
but the most practical alternatives from the neighboring countries– → Phased and feed-backed approach: every input should get a
feed-back by examining outcomes etc.• Faced with a quandary, inevitable conditions needs to be
reexamined, so that current results could be the cause of the current problem, vise versa.– → Social development including health and safety is the pre-
requisite of economic development, not the other way around.• Risk is there, not because of the risk itself, but because of
the conditions that make it risky. – → Socio-cultural bias against risk perception and management
is the real difference between different societies, and mechani-cal or managerial approaches should always be preceded by cultural approaches.