Embed Size (px)
Citation preview
PERFIL
Indústria Brasileira de Transformação de Material Plástico
Brazilian Plastic Processed Industry
Elaboração:Prepared by:
Apoio:Support:
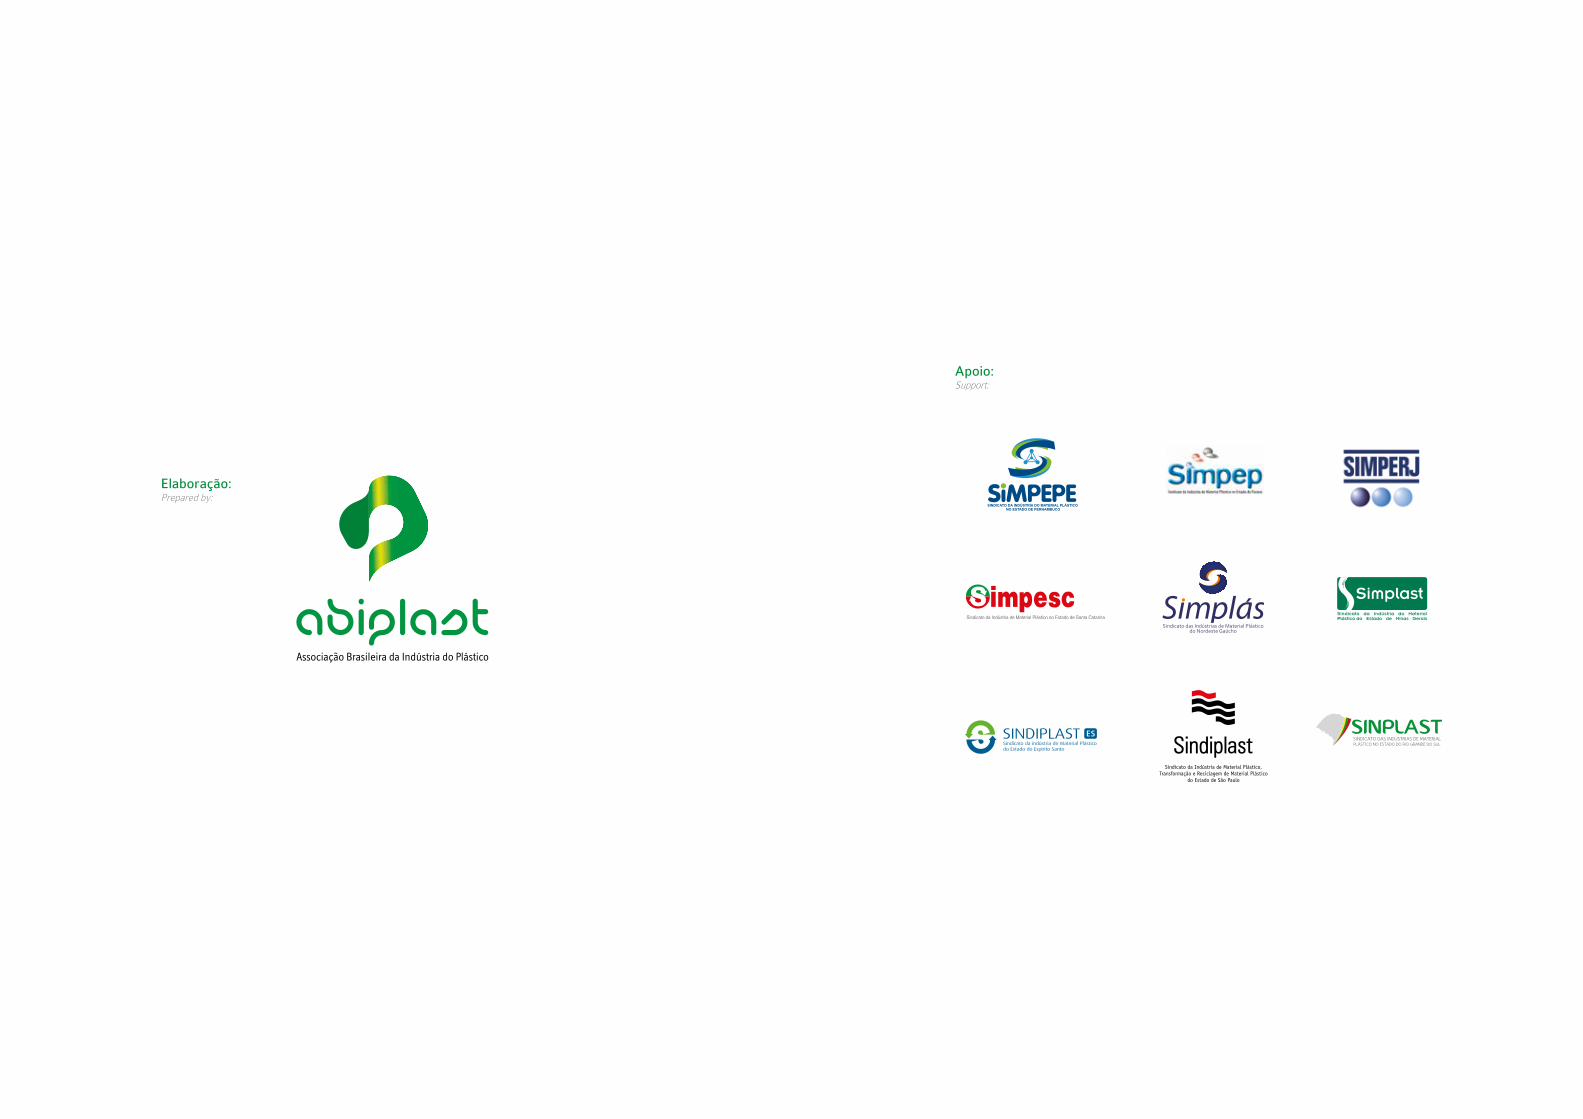
36 44 60 62
Características
da Indústria de
Reciclagem de
Material plástico
Pós-consumo
no Brasil
Desempenho
da Indústria
Brasileira de
Transformados
Plásticos
Indicadores
Econômicos
Entidades
e Sindicatos
Associados
ÍndiceSummary
Abiplast &
Palavra do
Presidente
ABIPLAST and
President´s Report
Affiliated Entities
and UnionsProduction chain and
applications of plastic material
The Processed Plastic
Industry in BrazilPerformance of
Brazilian Processed
Plastics Industry
Economic Indicators
Characteristics of
the post-consumer
plastic recycling
industry in Brazil
Cadeia
Produtiva e
Aplicações do
Material Plástico
O Plástico
no Mundo
O Setor de
Transformados
Plásticos
no Brasil
06 10 16 26
The Plastic Industry
in the World
7PERFIL 20146
A ABIPLAST possui também grande preocupação com
a responsabilidade social e preservação do meio ambiente,
razão pela qual desenvolve programas voltados à gestão de
resíduos sólidos, à reciclagem, ao treinamento das pessoas
que recolhem os materiais recicláveis, entre outros.
Além dos esforços em prol do desenvolvimento setorial,
a Entidade proporciona diversos serviços como:
Defesa comercial e apoio ao comércio exterior
Coordenação executiva das câmaras setoriais
Consultorias: jurídica, tributária, civil, trabalhista e
ambiental
Espaço para realizações de reuniões e eventos em-
presariais
Apoio em feiras no Brasil e no exterior
Cursos, palestras, workshops e treinamentos
Informes setoriais
Publicações técnicas
Representação institucional e defesa do setor
Uma entidade forte e ativa que busca inovação
para, assim, atender cada vez mais as demandas de
suas associadas e de todo setor.
•
•
•
•
•
•
•
•
•
•
•
•
•
•
•
•
•
•
ABIPLAST is also very much concerned with social
responsibility and the preservation of the environment,
therefore it fosters programs for solid waste
management, recycling and training of recyclable
material collectors, amongst others.
In addition to the efforts in favor of the industry
development, the Entity provides several services
such as:
Commercial defense and support in foreign trade
Executive coordination of industry local
chambers
Consulting: Legal, Tax, Civil, Labor and
Environmental
Place or Facilities for meetings and business
events
Support at trade shows in Brazil and abroad
Courses, lectures, workshops and training
Industry reports
Technical Publications
Institutional Representation and plastic industry
defense
A strong and active organization that seeks innovation
in order to meet the increasing demands of its
members and of the entire industry.
A ABIPLAST – Associação Brasileira da Indústria do Plás-
tico – representa o setor em âmbito nacional e está presente
desde 1967 atuando para aumentar a competitividade do se-
tor de transformados plásticos e reciclagem. Para isso, realiza
ações que promovem condições favoráveis à indústria, incenti-
vando novas tecnologias, novos processos, a pesquisa de pro-
dutos com foco na sustentabilidade e muito mais.
Ao completar 48 anos de atividade em 2015, a ABIPLAST
exibe uma série de realizações em prol dos interesses do setor
plástico do país. Representando atualmente 11.590 empresas
que empregam um total de 352 mil pessoas, a entidade, além
de incentivar o uso do plástico nos mais diferentes segmentos
ao longo das últimas quatro décadas, tem exercido ativa parti-
cipação junto aos órgãos governamentais, de forma a reivindi-
car medidas que atendam às necessidades do setor.
Abiplast:Transformando para competir!
Abiplast: Changing to compete
ABIPLAST - The Brazilian Plastics Industry
Association represents the sector in our country
and has been doing so since 1967, acting to increase the
competitiveness of the plastic processing and recycling
industry. In order to accomplish with these goals, Abiplast
develops actions to promote conditions favorable to the
industry, encouraging new technologies, new processes
and product research with a focus on sustainability
amongst other things.
On completing 48 years of activity in 2015, ABIPLAST
shows an impressive number of achievements in its
support of the interests of the country’s plastic industry.
Representing currently 11,590 companies employing a
total of 352 thousand people, and in addition to promoting
the use of plastic in the most diverse segments during the
last four decades, the entity shows an active participation
before government agencies, in order to demand
measures that meet the needs of the sector.
EN
Palavra do PresidentePresident’s Report 9PERFIL 20148
O ano de 2014 foi desafiador para todos os setores pro-
dutivos do Brasil. Já nos primeiros meses, antevíamos difi-
culdades por conta do menor número de dias úteis. Foi um
ano com queda na produção industrial, queda no consumo,
por parte das famílias e do governo, o que levou a estagna-
ção da economia brasileira, que cresceu 0,1% em 2014.
Importantes setores demandantes, como o automobilís-
tico e o da construção civil, sofreram estagnação e retração
no ano de 2014 e os efeitos, como não poderiam deixar de
ser, se refletiram no nosso setor.
No entanto, em momentos de retração de atividade
econômica, a indústria deve buscar novos horizontes de
atuação e um dos caminhos a trilhar, certamente, é o do au-
mento da competitividade. Não há como retomar o rumo do
crescimento sem otimizar métodos de produção, reduzir o
desperdício, aprimorar a mão de obra, fazer gestão racional
e olhar para o aspecto da sustentabilidade – o mundo está
cada vez mais exigente com relação à responsabilidade so-
cial e ambiental das empresas, e esse fator tem-se firmado
como um diferencial importante.
É preciso trabalhar e enfrentar os novos desafios com
tranquilidade, estratégia e munido de informações relevan-
tes para interpretar o mercado. É com esse objetivo que
apresentamos o “PERFIL 2014 da Indústria Brasileira de
Transformação de Material Plástico” um trabalho que apre-
senta um diagnóstico do setor e que esperamos ser útil para
que os empreendedores tenham mais clareza do atual qua-
dro e, assim, possam definir as estratégias mais adequadas
para todos.
Tenham todos uma boa leitura!
The year of 2014 was challenging for all
productive sectors of Brazil. Since the first
months, we could foresee difficulties due to the smaller
number of working days. It was a year with drop in
industrial production, fall in consumption by households
and the Government, which led to stagnation of the
Brazilian economy, which grew 0.1% in 2014.
Important sectors such as the automobile and
construction ones suffered stagnation and decline in
the year 2014 and the effects, as they could not fail to
be, reflected in our sector.
However, in times of economic activity downturn, the
industry needs to seek new horizons of performance
and one of the paths to tread, certainly, is to increase
competitiveness. There is no way to retrieve the
course of growth without optimize production
methods, to reduce waste, to improve workmanship,
to make rational management and to look at the
aspect of sustainability – the world is increasingly
demanding with regard to social and environmental
responsibility of enterprises, and this aspect has been
established as a key distinguishing factor.
It is necessary to work and to face the new challenges
with tranquility, strategy and being provided with
relevant information to interpret the market. In the
light of this objective, we present the “2014 PROFILE of
Brazilian industry of Plastic Material Transformation”,
a job that presents a diagnosis of the sector and which
we hope will be useful for entrepreneurs to have more
clearness of the current frame and thus can set the
most appropriate strategies for everyone.
So happy reading to everyone!
EN
Plásticos: Buscandoo fortalecimentonos desafiosPlastics: Seeking the
strengthening in the challenges
PALAVRA DO PRESIDEN TE:
President´s Report
Production Chain
and Applications
of Plastic Material
PERFIL 201412 13
Óleo CombustívelFuel oil
GLPLiquefied petroleum
GasolinaGasoline
Óleo DieselDiesel Oil
ResíduoWaste
EtenoEthene
PropenoPropene
ButenoButene
ButadienoButadiene
BenzenoBenzene
Tolueno e xilenoToluene and Xylene
RefinoMidstream
CraqueamentoCracking
NaftaNaphta
PolimerizaçãoPolymerization
TransformadosPlásticos
Processing Plastics
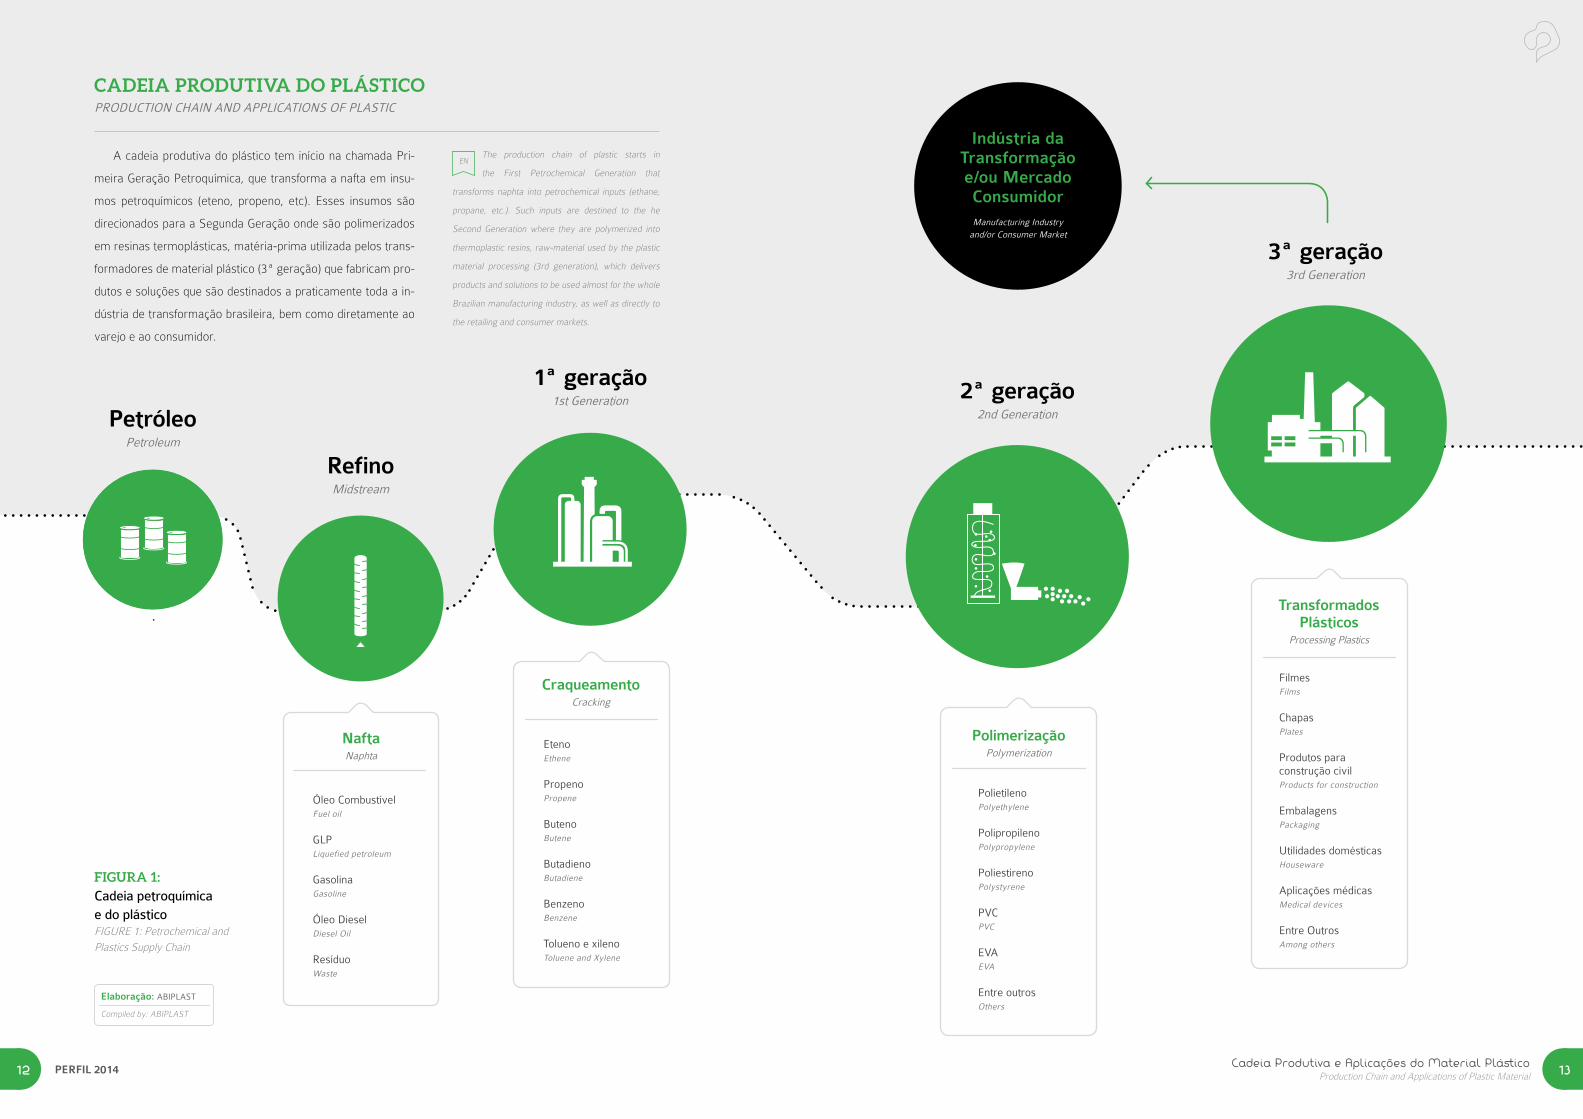
FIGURA 1:
Cadeia petroquímicae do plásticoFIGURE 1: Petrochemical and Plastics Supply Chain
A cadeia produtiva do plástico tem início na chamada Pri-
meira Geração Petroquímica, que transforma a nafta em insu-
mos petroquímicos (eteno, propeno, etc). Esses insumos são
direcionados para a Segunda Geração onde são polimerizados
em resinas termoplásticas, matéria-prima utilizada pelos trans-
formadores de material plástico (3ª geração) que fabricam pro-
dutos e soluções que são destinados a praticamente toda a in-
dústria de transformação brasileira, bem como diretamente ao
varejo e ao consumidor.
The production chain of plastic starts in
the First Petrochemical Generation that
transforms naphta into petrochemical inputs (ethane,
propane, etc.). Such inputs are destined to the he
Second Generation where they are polymerized into
thermoplastic resins, raw-material used by the plastic
material processing (3rd generation), which delivers
products and solutions to be used almost for the whole
Brazilian manufacturing industry, as well as directly to
the retailing and consumer markets.
EN
PolietilenoPolyethylene
PolipropilenoPolypropylene
PoliestirenoPolystyrene
PVCPVC
EVAEVA
Entre outrosOthers
FilmesFilms
ChapasPlates
Produtos para construção civilProducts for construction
EmbalagensPackaging
Utilidades domésticasHouseware
Aplicações médicasMedical devices
Entre OutrosAmong others
2ª geração2nd Generation
3ª geração3rd Generation
1ª geração1st Generation
Indústria daTransformaçãoe/ou MercadoConsumidorManufacturing Industry
and/or Consumer Market
PetróleoPetroleum
CADEIA PRODUTIVA DO PLÁSTICOPRODUCTION CHAIN AND APPLICATIONS OF PLASTIC
Elaboração: ABIPLAST
Compiled by: ABIPLAST
15PERFIL 201414
PP
PVC
1,5%
1,5%
PEAD(HDPE)
Plásticos deengenharia(Engineering Plastic)
PEBDL(LLDPE)
PET
PS EVA
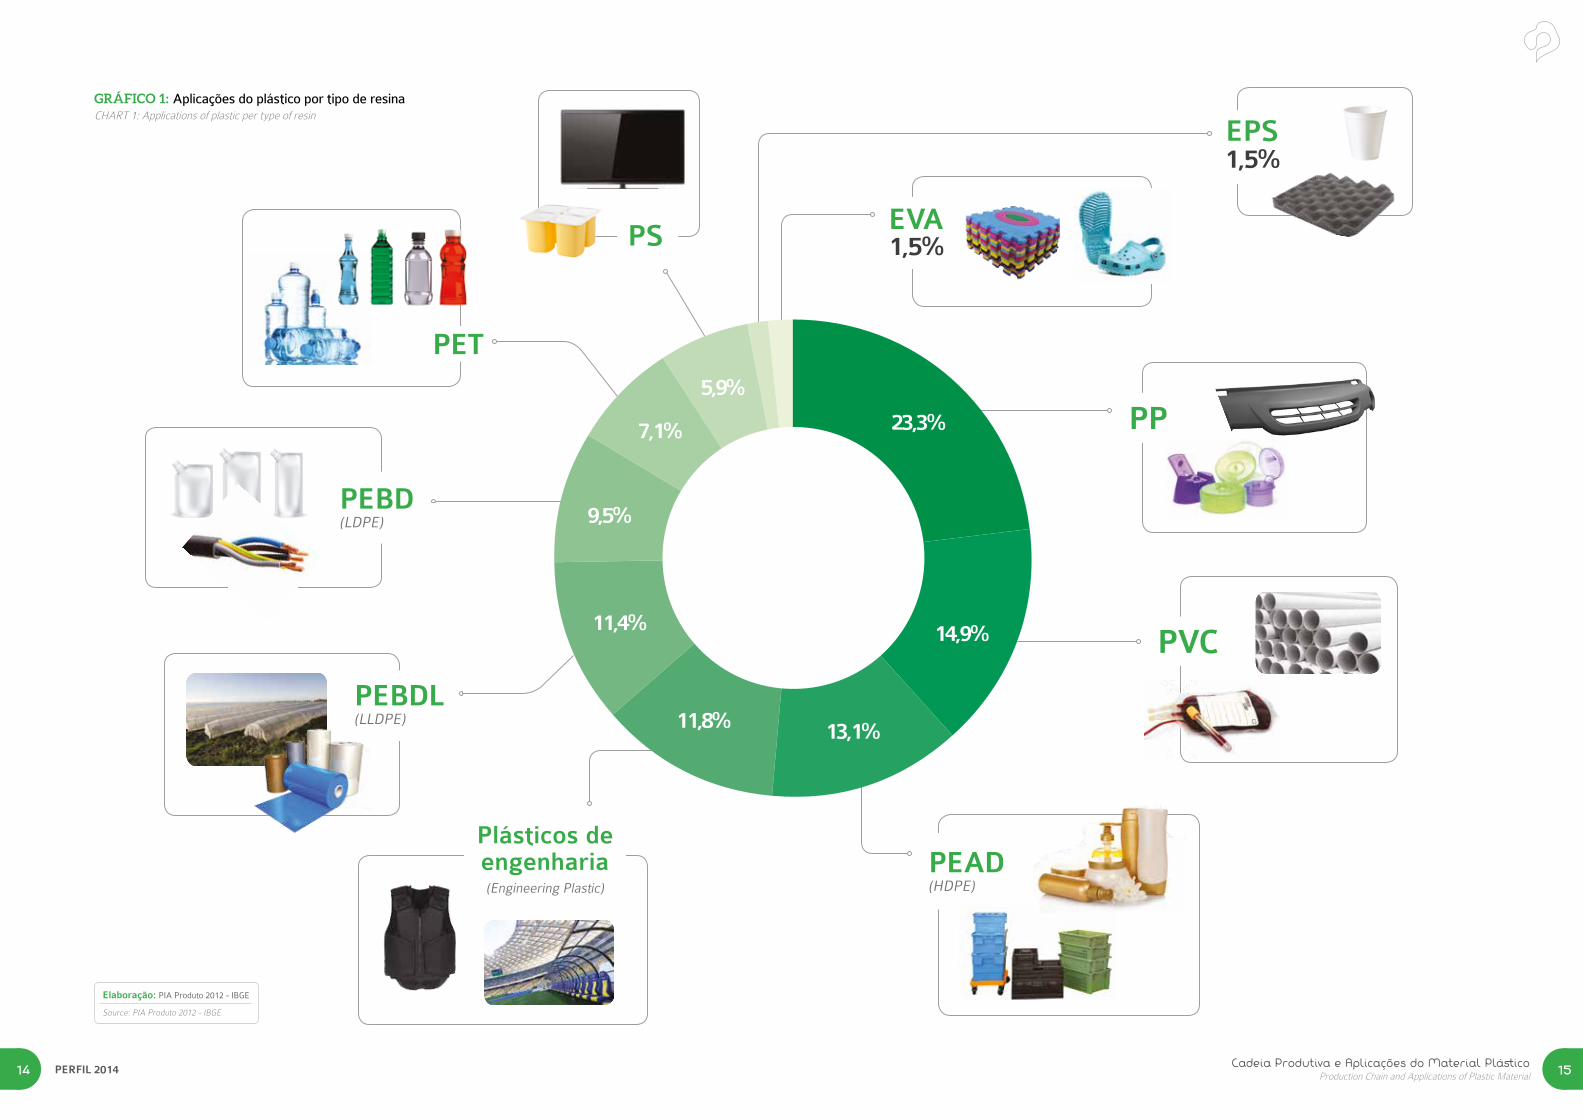
EPSGRÁFICO 1: Aplicações do plástico por tipo de resinaCHART 1: Applications of plastic per type of resin
Elaboração: PIA Produto 2012 - IBGE
Source: PIA Produto 2012 - IBGE
11,8% 13,1%
14,9%
23,3%
11,4%
9,5%
7,1%
5,9%
PEBD(LDPE)
O plásticono Mundo
The Plastic Industry
in the World
PERFIL 201418
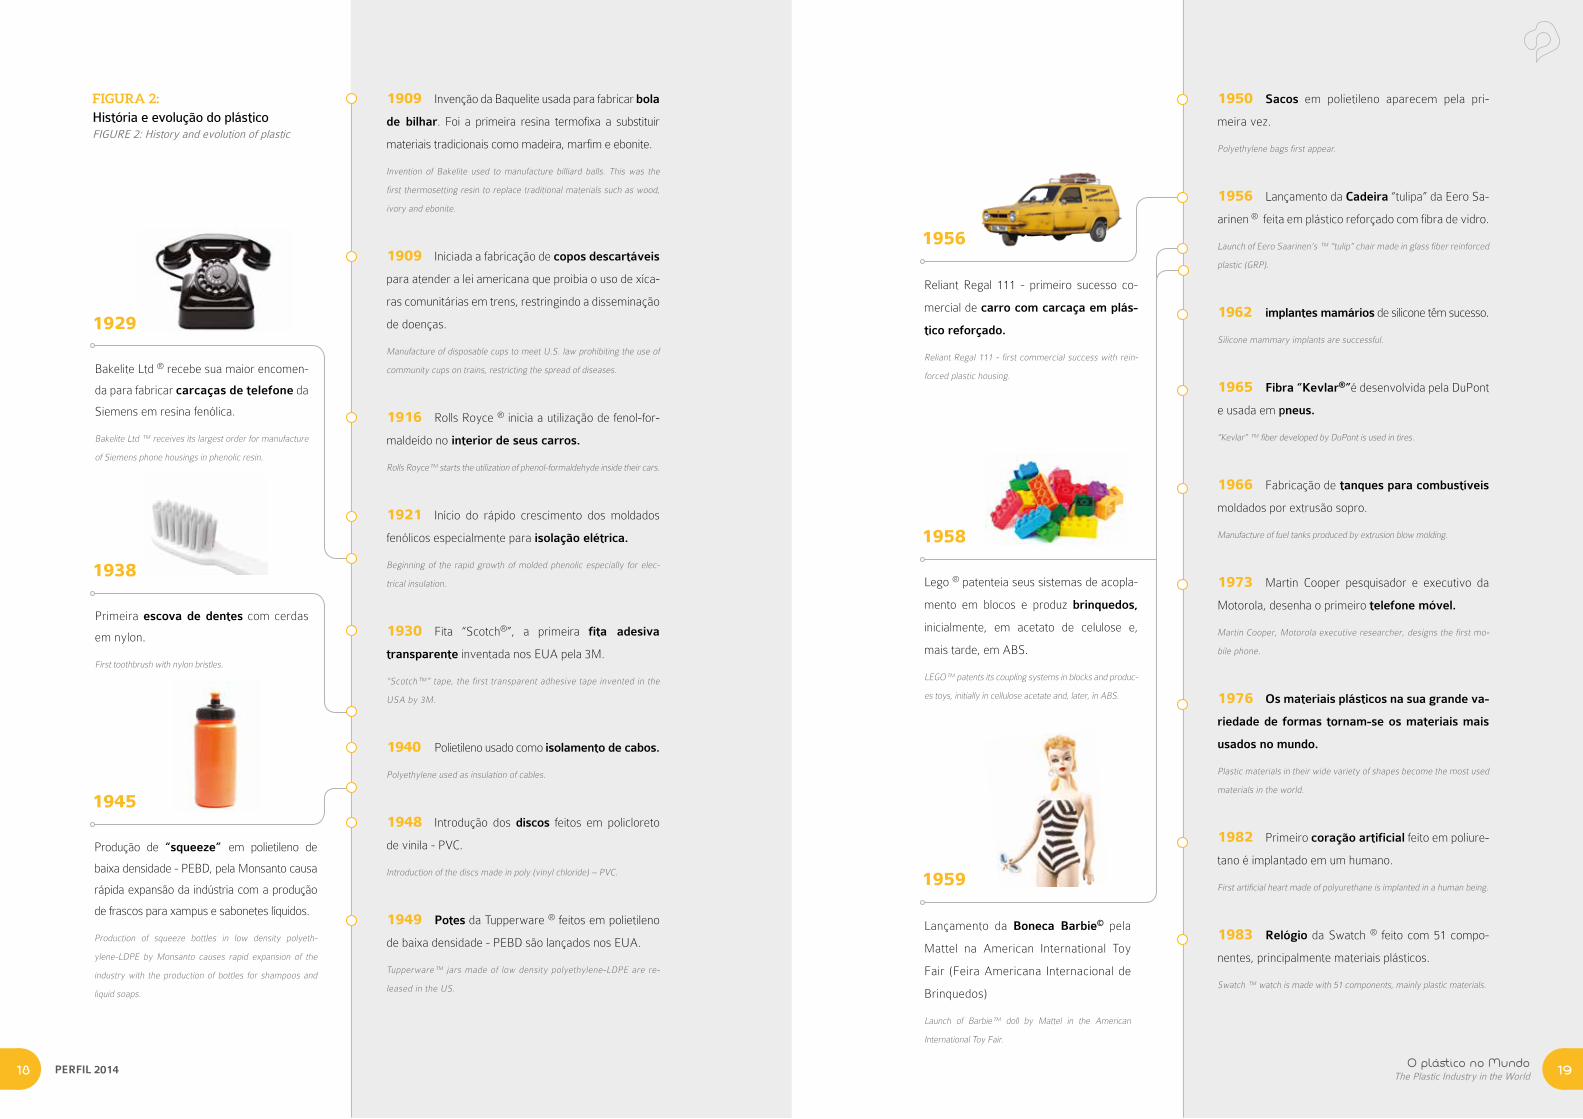
1909 Invenção da Baquelite usada para fabricar bola
de bilhar. Foi a primeira resina termofixa a substituir
materiais tradicionais como madeira, marfim e ebonite.
Invention of Bakelite used to manufacture billiard balls. This was the
first thermosetting resin to replace traditional materials such as wood,
ivory and ebonite.
1909 Iniciada a fabricação de copos descartáveis
para atender a lei americana que proibia o uso de xíca-
ras comunitárias em trens, restringindo a disseminação
de doenças.
Manufacture of disposable cups to meet U.S. law prohibiting the use of
community cups on trains, restricting the spread of diseases.
1916 Rolls Royce ® inicia a utilização de fenol-for-
maldeído no interior de seus carros.
Rolls Royce™ starts the utilization of phenol-formaldehyde inside their cars.
1921 Início do rápido crescimento dos moldados
fenólicos especialmente para isolação elétrica.
Beginning of the rapid growth of molded phenolic especially for elec-
trical insulation.
1930 Fita “Scotch®”, a primeira fita adesiva
transparente inventada nos EUA pela 3M.
“Scotch™” tape, the first transparent adhesive tape invented in the
USA by 3M.
1940 Polietileno usado como isolamento de cabos.
Polyethylene used as insulation of cables.
1948 Introdução dos discos feitos em policloreto
de vinila - PVC.
Introduction of the discs made in poly (vinyl chloride) – PVC.
1949 Potes da Tupperware ® feitos em polietileno
de baixa densidade - PEBD são lançados nos EUA.
Tupperware™ jars made of low density polyethylene-LDPE are re-
leased in the US.
Bakelite Ltd ® recebe sua maior encomen-
da para fabricar carcaças de telefone da
Siemens em resina fenólica.
Bakelite Ltd ™ receives its largest order for manufacture
of Siemens phone housings in phenolic resin.
Primeira escova de dentes com cerdas
em nylon.
First toothbrush with nylon bristles.
Produção de “squeeze” em polietileno de
baixa densidade - PEBD, pela Monsanto causa
rápida expansão da indústria com a produção
de frascos para xampus e sabonetes líquidos.
Production of squeeze bottles in low density polyeth-
ylene-LDPE by Monsanto causes rapid expansion of the
industry with the production of bottles for shampoos and
liquid soaps.
1929
1938
1945
Reliant Regal 111 - primeiro sucesso co-
mercial de carro com carcaça em plás-
tico reforçado.
Reliant Regal 111 - first commercial success with rein-
forced plastic housing.
Lego ® patenteia seus sistemas de acopla-
mento em blocos e produz brinquedos,
inicialmente, em acetato de celulose e,
mais tarde, em ABS.
LEGO™ patents its coupling systems in blocks and produc-
es toys, initially in cellulose acetate and, later, in ABS.
Lançamento da Boneca Barbie© pela
Mattel na American International Toy
Fair (Feira Americana Internacional de
Brinquedos)
Launch of Barbie™ doll by Mattel in the American
International Toy Fair.
1956
1958
1959
1950 Sacos em polietileno aparecem pela pri-
meira vez.
Polyethylene bags first appear.
1956 Lançamento da Cadeira “tulipa” da Eero Sa-
arinen ® feita em plástico reforçado com fibra de vidro.
Launch of Eero Saarinen’s ™ “tulip” chair made in glass fiber reinforced
plastic (GRP).
1962 implantes mamários de silicone têm sucesso.
Silicone mammary implants are successful.
1965 Fibra “Kevlar®”é desenvolvida pela DuPont
e usada em pneus.
“Kevlar” ™ fiber developed by DuPont is used in tires.
1966 Fabricação de tanques para combustíveis
moldados por extrusão sopro.
Manufacture of fuel tanks produced by extrusion blow molding.
1973 Martin Cooper pesquisador e executivo da
Motorola, desenha o primeiro telefone móvel.
Martin Cooper, Motorola executive researcher, designs the first mo-
bile phone.
1976 Os materiais plásticos na sua grande va-
riedade de formas tornam-se os materiais mais
usados no mundo.
Plastic materials in their wide variety of shapes become the most used
materials in the world.
1982 Primeiro coração artificial feito em poliure-
tano é implantado em um humano.
First artificial heart made of polyurethane is implanted in a human being.
1983 Relógio da Swatch ® feito com 51 compo-
nentes, principalmente materiais plásticos.
Swatch ™ watch is made with 51 components, mainly plastic materials.
FIGURA 2: História e evolução do plásticoFIGURE 2: History and evolution of plastic
O plástico no MundoThe Plastic Industry in the World 19
PERFIL 201420
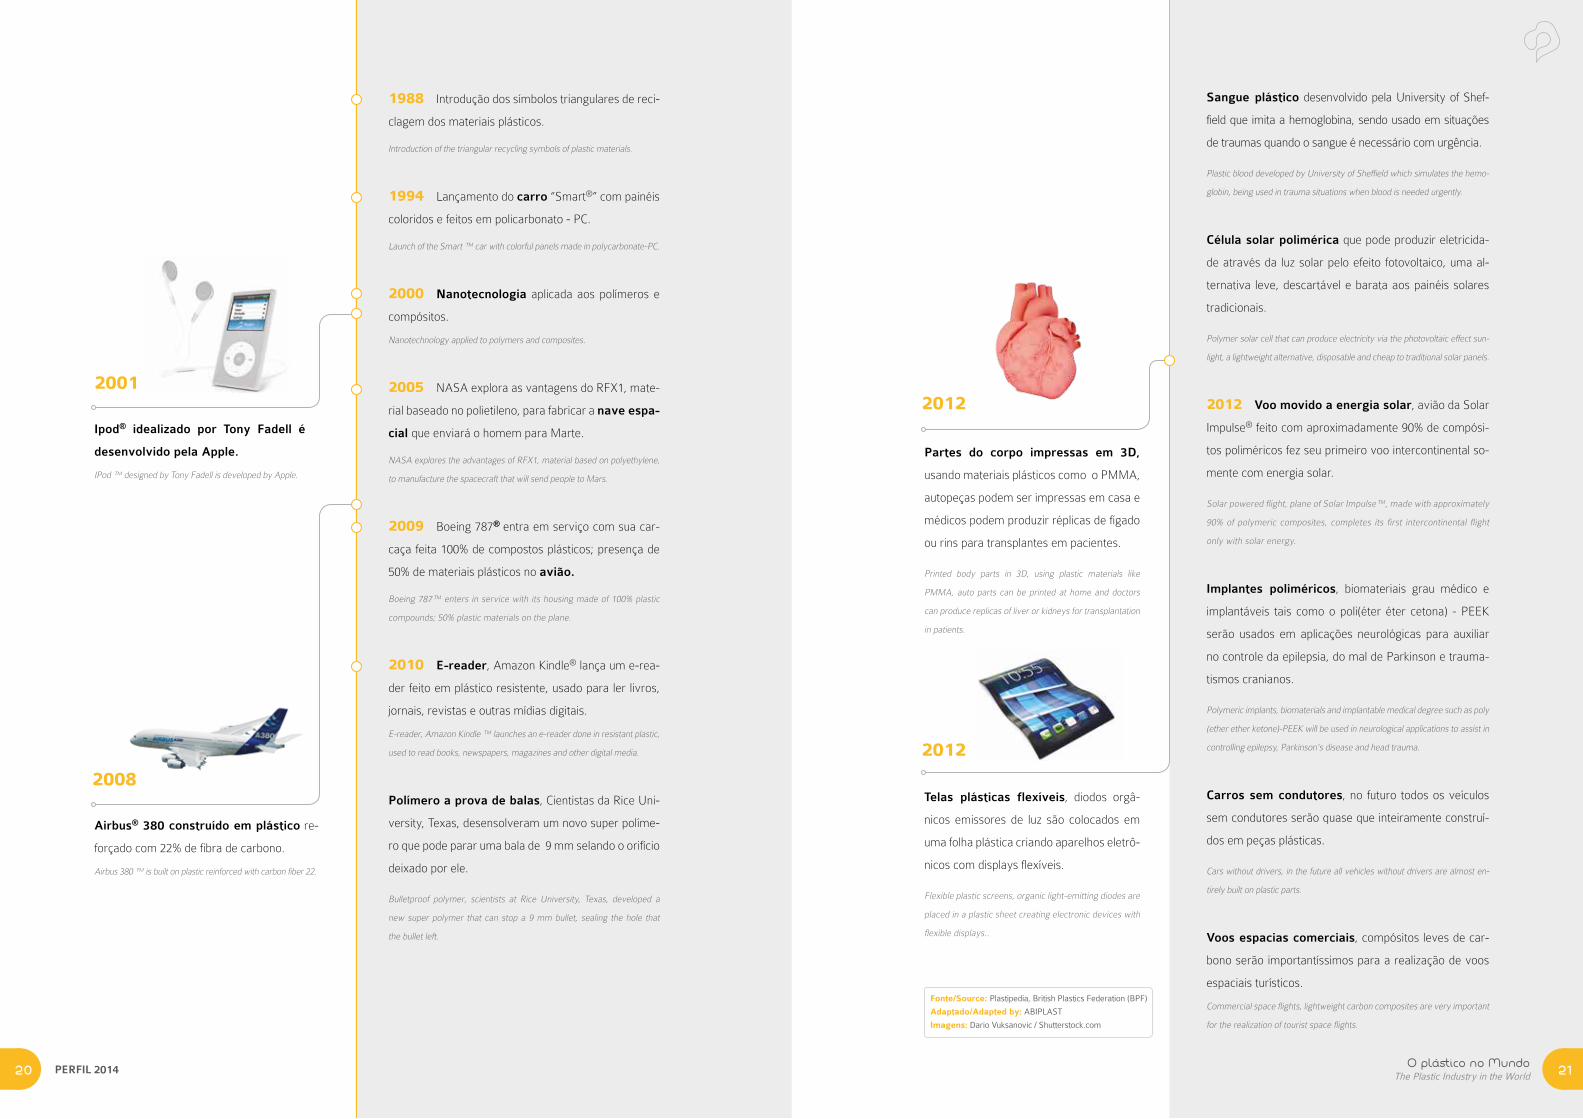
2001
2008
Ipod® idealizado por Tony Fadell é
desenvolvido pela Apple.
IPod ™ designed by Tony Fadell is developed by Apple.
Airbus® 380 construído em plástico re-
forçado com 22% de fibra de carbono.
Airbus 380 ™ is built on plastic reinforced with carbon fiber 22.
1988 Introdução dos símbolos triangulares de reci-
clagem dos materiais plásticos.
Introduction of the triangular recycling symbols of plastic materials.
1994 Lançamento do carro “Smart®” com painéis
coloridos e feitos em policarbonato - PC.
Launch of the Smart ™ car with colorful panels made in polycarbonate-PC.
2000 Nanotecnologia aplicada aos polímeros e
compósitos.
Nanotechnology applied to polymers and composites.
2005 NASA explora as vantagens do RFX1, mate-
rial baseado no polietileno, para fabricar a nave espa-
cial que enviará o homem para Marte.
NASA explores the advantages of RFX1, material based on polyethylene,
to manufacture the spacecraft that will send people to Mars.
2009 Boeing 787® entra em serviço com sua car-
caça feita 100% de compostos plásticos; presença de
50% de materiais plásticos no avião.
Boeing 787™ enters in service with its housing made of 100% plastic
compounds; 50% plastic materials on the plane.
2010 E-reader, Amazon Kindle® lança um e-rea-
der feito em plástico resistente, usado para ler livros,
jornais, revistas e outras mídias digitais.
E-reader, Amazon Kindle ™ launches an e-reader done in resistant plastic,
used to read books, newspapers, magazines and other digital media.
Polímero a prova de balas, Cientistas da Rice Uni-
versity, Texas, desensolveram um novo super políme-
ro que pode parar uma bala de 9 mm selando o orifício
deixado por ele.
Bulletproof polymer, scientists at Rice University, Texas, developed a
new super polymer that can stop a 9 mm bullet, sealing the hole that
the bullet left.
2012
2012
Partes do corpo impressas em 3D,
usando materiais plásticos como o PMMA,
autopeças podem ser impressas em casa e
médicos podem produzir réplicas de fígado
ou rins para transplantes em pacientes.
Printed body parts in 3D, using plastic materials like
PMMA, auto parts can be printed at home and doctors
can produce replicas of liver or kidneys for transplantation
in patients.
Telas plásticas flexíveis, diodos orgâ-
nicos emissores de luz são colocados em
uma folha plástica criando aparelhos eletrô-
nicos com displays flexíveis.
Flexible plastic screens, organic light-emitting diodes are
placed in a plastic sheet creating electronic devices with
flexible displays..
Sangue plástico desenvolvido pela University of Shef-
field que imita a hemoglobina, sendo usado em situações
de traumas quando o sangue é necessário com urgência.
Plastic blood developed by University of Sheffield which simulates the hemo-
globin, being used in trauma situations when blood is needed urgently.
Célula solar polimérica que pode produzir eletricida-
de através da luz solar pelo efeito fotovoltaico, uma al-
ternativa leve, descartável e barata aos painéis solares
tradicionais.
Polymer solar cell that can produce electricity via the photovoltaic effect sun-
light, a lightweight alternative, disposable and cheap to traditional solar panels.
2012 Voo movido a energia solar, avião da Solar
Impulse® feito com aproximadamente 90% de compósi-
tos poliméricos fez seu primeiro voo intercontinental so-
mente com energia solar.
Solar powered flight, plane of Solar Impulse™, made with approximately
90% of polymeric composites, completes its first intercontinental flight
only with solar energy.
Implantes poliméricos, biomateriais grau médico e
implantáveis tais como o poli(éter éter cetona) - PEEK
serão usados em aplicações neurológicas para auxiliar
no controle da epilepsia, do mal de Parkinson e trauma-
tismos cranianos.
Polymeric implants, biomaterials and implantable medical degree such as poly
(ether ether ketone)-PEEK will be used in neurological applications to assist in
controlling epilepsy, Parkinson’s disease and head trauma.
Carros sem condutores, no futuro todos os veículos
sem condutores serão quase que inteiramente construí-
dos em peças plásticas.
Cars without drivers, in the future all vehicles without drivers are almost en-
tirely built on plastic parts.
Voos espacias comerciais, compósitos leves de car-
bono serão importantíssimos para a realização de voos
espaciais turísticos.
Commercial space flights, lightweight carbon composites are very important
for the realization of tourist space flights.
Fonte/Source: Plastipedia, British Plastics Federation (BPF)
Adaptado/Adapted by: ABIPLAST
Imagens: Dario Vuksanovic / Shutterstock.com
O plástico no MundoThe Plastic Industry in the World 21
O plástico no MundoThe Plastic Industry in the World 23PERFIL 201422
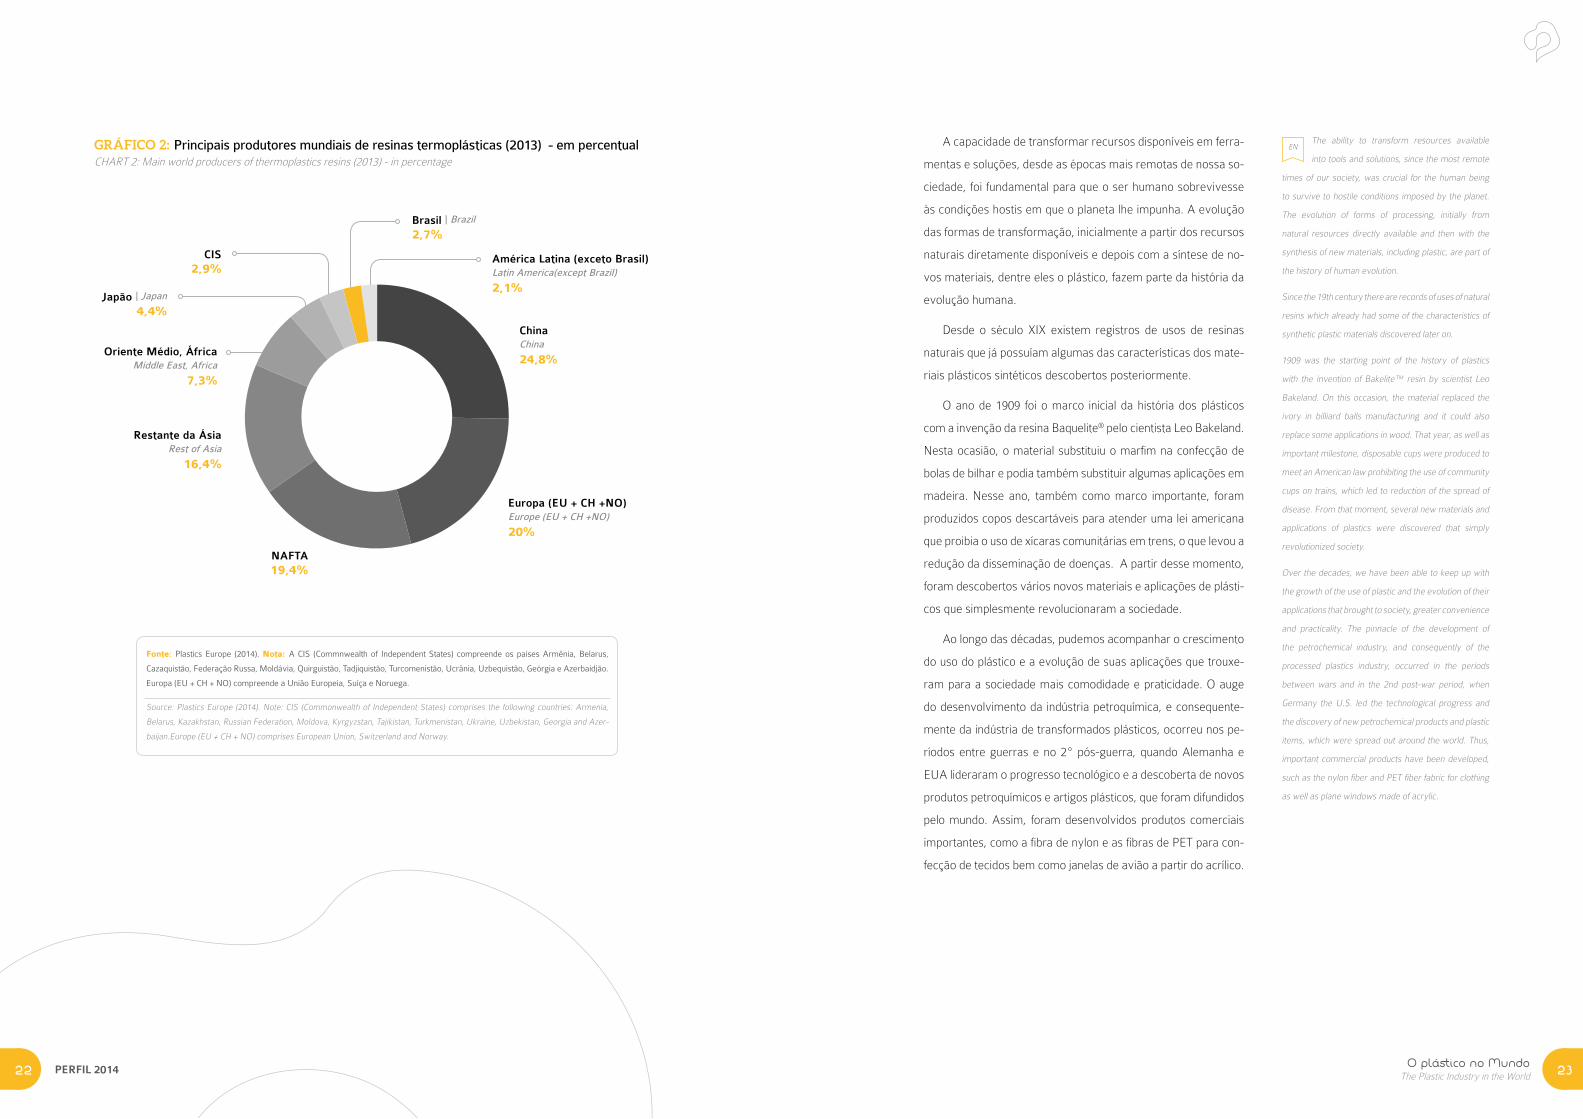
GRÁFICO 2: Principais produtores mundiais de resinas termoplásticas (2013) - em percentualCHART 2: Main world producers of thermoplastics resins (2013) - in percentage
ChinaChina
24,8%
América Latina (exceto Brasil)Latin America(except Brazil)
2,1%
Brasil | Brazil
2,7%
Europa (EU + CH +NO)Europe (EU + CH +NO)
20%
NAFTA19,4%
Restante da ÁsiaRest of Asia
16,4%
Oriente Médio, ÁfricaMiddle East, Africa
7,3%
Japão | Japan
4,4%
CIS2,9%
Fonte: Plastics Europe (2014). Nota: A CIS (Commnwealth of Independent States) compreende os países Armênia, Belarus,
Cazaquistão, Federação Russa, Moldávia, Quirguistão, Tadjiquistão, Turcomenistão, Ucrânia, Uzbequistão, Geórgia e Azerbaidjão.
Europa (EU + CH + NO) compreende a União Europeia, Suíça e Noruega.
Source: Plastics Europe (2014). Note: CIS (Commonwealth of Independent States) comprises the following countries: Armenia,
Belarus, Kazakhstan, Russian Federation, Moldova, Kyrgyzstan, Tajikistan, Turkmenistan, Ukraine, Uzbekistan, Georgia and Azer-
baijan.Europe (EU + CH + NO) comprises European Union, Switzerland and Norway.
ENA capacidade de transformar recursos disponíveis em ferra-
mentas e soluções, desde as épocas mais remotas de nossa so-
ciedade, foi fundamental para que o ser humano sobrevivesse
às condições hostis em que o planeta lhe impunha. A evolução
das formas de transformação, inicialmente a partir dos recursos
naturais diretamente disponíveis e depois com a síntese de no-
vos materiais, dentre eles o plástico, fazem parte da história da
evolução humana.
Desde o século XIX existem registros de usos de resinas
naturais que já possuíam algumas das características dos mate-
riais plásticos sintéticos descobertos posteriormente.
O ano de 1909 foi o marco inicial da história dos plásticos
com a invenção da resina Baquelite® pelo cientista Leo Bakeland.
Nesta ocasião, o material substituiu o marfim na confecção de
bolas de bilhar e podia também substituir algumas aplicações em
madeira. Nesse ano, também como marco importante, foram
produzidos copos descartáveis para atender uma lei americana
que proibia o uso de xícaras comunitárias em trens, o que levou a
redução da disseminação de doenças. A partir desse momento,
foram descobertos vários novos materiais e aplicações de plásti-
cos que simplesmente revolucionaram a sociedade.
Ao longo das décadas, pudemos acompanhar o crescimento
do uso do plástico e a evolução de suas aplicações que trouxe-
ram para a sociedade mais comodidade e praticidade. O auge
do desenvolvimento da indústria petroquímica, e consequente-
mente da indústria de transformados plásticos, ocorreu nos pe-
ríodos entre guerras e no 2º pós-guerra, quando Alemanha e
EUA lideraram o progresso tecnológico e a descoberta de novos
produtos petroquímicos e artigos plásticos, que foram difundidos
pelo mundo. Assim, foram desenvolvidos produtos comerciais
importantes, como a fibra de nylon e as fibras de PET para con-
fecção de tecidos bem como janelas de avião a partir do acrílico.
The ability to transform resources available
into tools and solutions, since the most remote
times of our society, was crucial for the human being
to survive to hostile conditions imposed by the planet.
The evolution of forms of processing, initially from
natural resources directly available and then with the
synthesis of new materials, including plastic, are part of
the history of human evolution.
Since the 19th century there are records of uses of natural
resins which already had some of the characteristics of
synthetic plastic materials discovered later on.
1909 was the starting point of the history of plastics
with the invention of Bakelite™ resin by scientist Leo
Bakeland. On this occasion, the material replaced the
ivory in billiard balls manufacturing and it could also
replace some applications in wood. That year, as well as
important milestone, disposable cups were produced to
meet an American law prohibiting the use of community
cups on trains, which led to reduction of the spread of
disease. From that moment, several new materials and
applications of plastics were discovered that simply
revolutionized society.
Over the decades, we have been able to keep up with
the growth of the use of plastic and the evolution of their
applications that brought to society, greater convenience
and practicality. The pinnacle of the development of
the petrochemical industry, and consequently of the
processed plastics industry, occurred in the periods
between wars and in the 2nd post-war period, when
Germany the U.S. led the technological progress and
the discovery of new petrochemical products and plastic
items, which were spread out around the world. Thus,
important commercial products have been developed,
such as the nylon fiber and PET fiber fabric for clothing
as well as plane windows made of acrylic.
O plástico no MundoThe Plastic Industry in the World 25PERFIL 201424
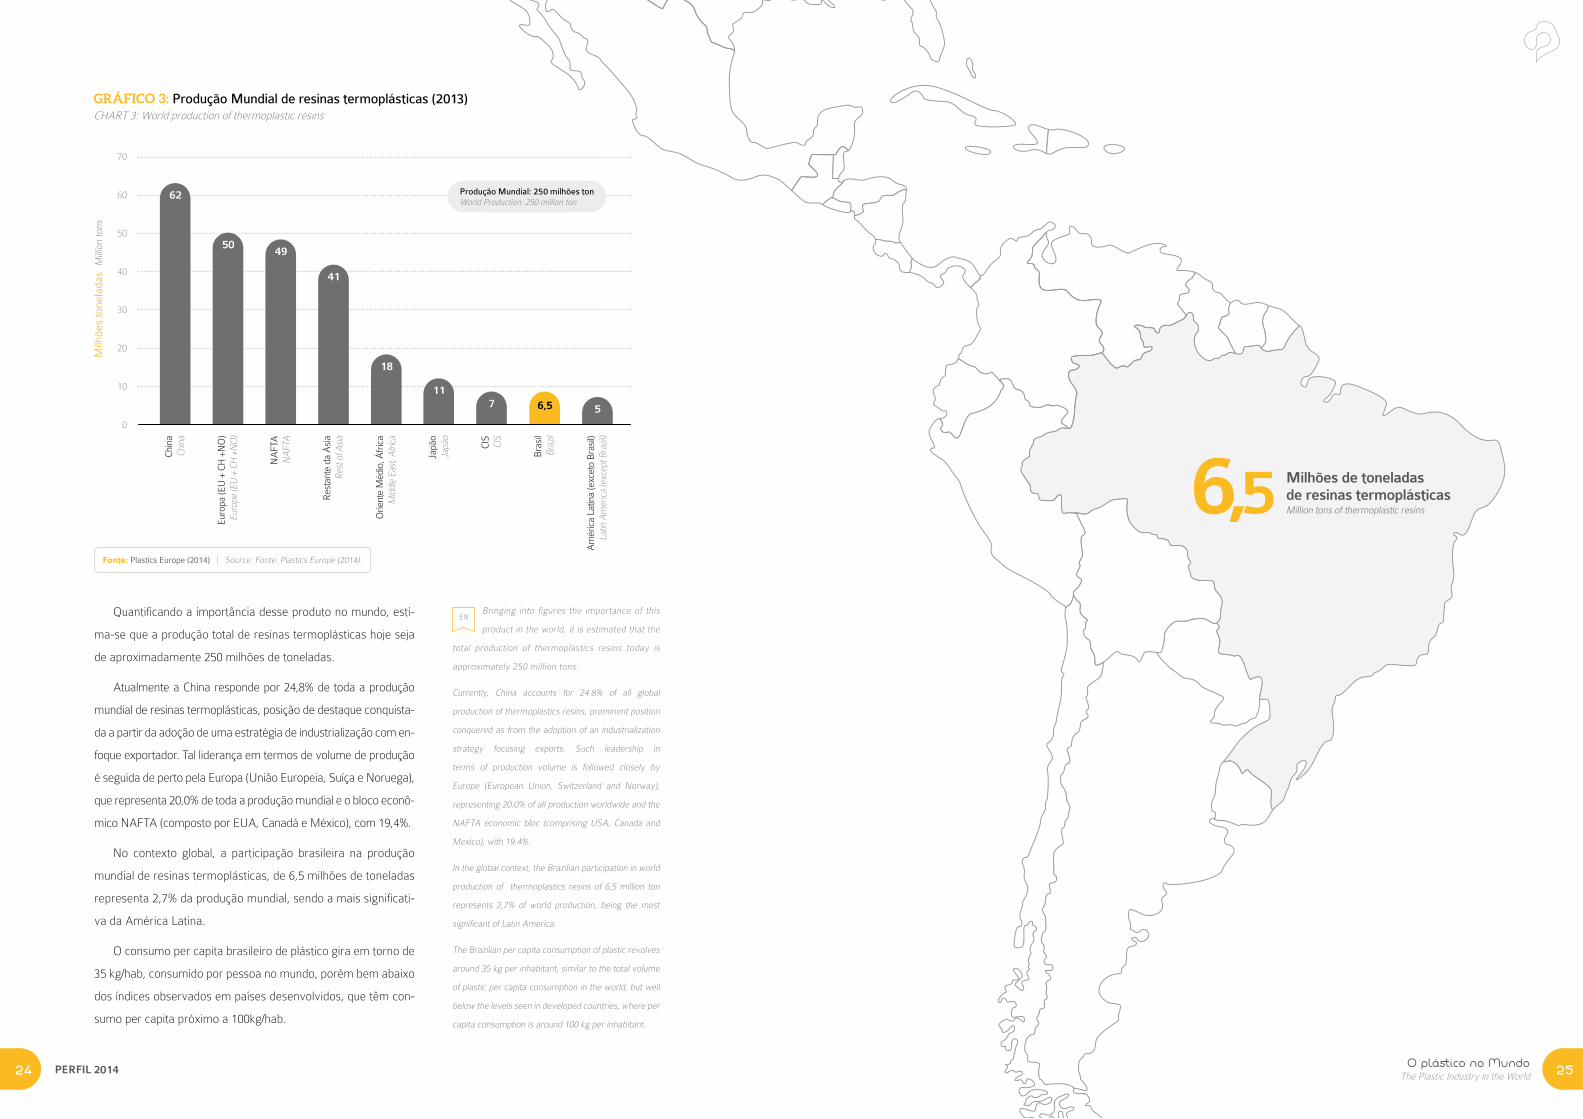
ENQuantificando a importância desse produto no mundo, esti-
ma-se que a produção total de resinas termoplásticas hoje seja
de aproximadamente 250 milhões de toneladas.
Atualmente a China responde por 24,8% de toda a produção
mundial de resinas termoplásticas, posição de destaque conquista-
da a partir da adoção de uma estratégia de industrialização com en-
foque exportador. Tal liderança em termos de volume de produção
é seguida de perto pela Europa (União Europeia, Suíça e Noruega),
que representa 20,0% de toda a produção mundial e o bloco econô-
mico NAFTA (composto por EUA, Canadá e México), com 19,4%.
No contexto global, a participação brasileira na produção
mundial de resinas termoplásticas, de 6,5 milhões de toneladas
representa 2,7% da produção mundial, sendo a mais significati-
va da América Latina.
O consumo per capita brasileiro de plástico gira em torno de
35 kg/hab, consumido por pessoa no mundo, porém bem abaixo
dos índices observados em países desenvolvidos, que têm con-
sumo per capita próximo a 100kg/hab.
Bringing into figures the importance of this
product in the world, it is estimated that the
total production of thermoplastics resins today is
approximately 250 million tons.
Currently, China accounts for 24.8% of all global
production of thermoplastics resins, prominent position
conquered as from the adoption of an industrialization
strategy focusing exports. Such leadership in
terms of production volume is followed closely by
Europe (European Union, Switzerland and Norway),
representing 20.0% of all production worldwide and the
NAFTA economic bloc (comprising USA, Canada and
Mexico), with 19.4%.
In the global context, the Brazilian participation in world
production of thermoplastics resins of 6,5 million ton
represents 2,7% of world production, being the most
significant of Latin America.
The Brazilian per capita consumption of plastic revolves
around 35 kg per inhabitant, similar to the total volume
of plastic per capita consumption in the world, but well
below the levels seen in developed countries, where per
capita consumption is around 100 kg per inhabitant.
GRÁFICO 3: Produção Mundial de resinas termoplásticas (2013)CHART 3: World production of thermoplastic resins
6,5 Milhões de toneladasde resinas termoplásticasMillion tons of thermoplastic resins
70
60
50
40
30
20
10
0
Milh
ões
tone
lada
s M
illio
n to
ns
62
5049
41
18
6,5711
5
Chin
aCh
ina
Euro
pa (E
U +
CH
+N
O)
Euro
pe (E
U +
CH
+N
O)
NA
FTA
NA
FTA
Res
tant
e da
Ási
aRe
st o
f Asia
Orie
nte
Méd
io, Á
fric
aM
iddl
e Ea
st, A
frica
Japã
oJa
pão
CIS
CIS
Bra
sil
Braz
il
Am
éric
a La
tina
(exc
eto
Bra
sil)
Latin
Am
eric
a (e
xcep
t Bra
zil)
Produção Mundial: 250 milhões tonWorld Production: 250 million ton
Fonte: Plastics Europe (2014) Source: Fonte: Plastics Europe (2014).
O setor de Transformados Plásticos no BrasilThe Processed Plastic Industry in Brazil 27PERFIL 201426
O setor deTransformados Plásticos noBrasilThe Processed Plastic
Industry in Brazil
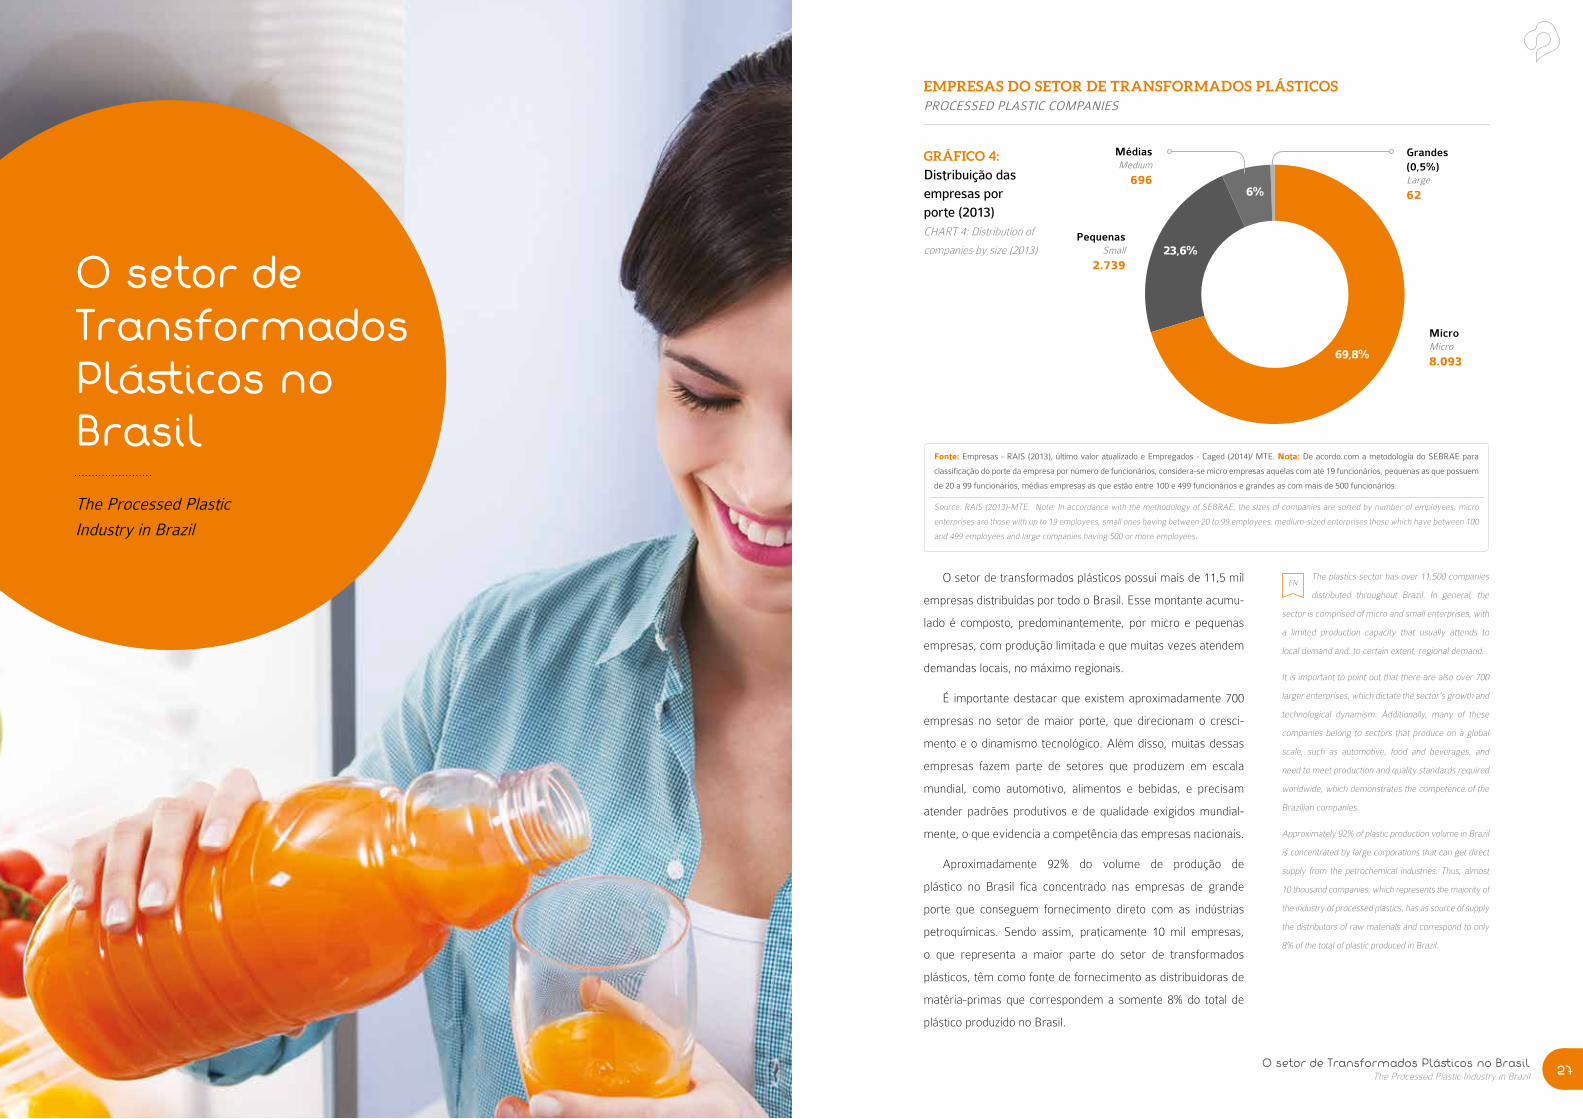
ENO setor de transformados plásticos possui mais de 11,5 mil
empresas distribuídas por todo o Brasil. Esse montante acumu-
lado é composto, predominantemente, por micro e pequenas
empresas, com produção limitada e que muitas vezes atendem
demandas locais, no máximo regionais.
É importante destacar que existem aproximadamente 700
empresas no setor de maior porte, que direcionam o cresci-
mento e o dinamismo tecnológico. Além disso, muitas dessas
empresas fazem parte de setores que produzem em escala
mundial, como automotivo, alimentos e bebidas, e precisam
atender padrões produtivos e de qualidade exigidos mundial-
mente, o que evidencia a competência das empresas nacionais.
Aproximadamente 92% do volume de produção de
plástico no Brasil fica concentrado nas empresas de grande
porte que conseguem fornecimento direto com as indústrias
petroquímicas. Sendo assim, praticamente 10 mil empresas,
o que representa a maior parte do setor de transformados
plásticos, têm como fonte de fornecimento as distribuidoras de
matéria-primas que correspondem a somente 8% do total de
plástico produzido no Brasil.
The plastics sector has over 11,500 companies
distributed throughout Brazil. In general, the
sector is comprised of micro and small enterprises, with
a limited production capacity that usually attends to
local demand and, to certain extent, regional demand.
It is important to point out that there are also over 700
larger enterprises, which dictate the sector’s growth and
technological dynamism. Additionally, many of these
companies belong to sectors that produce on a global
scale, such as automotive, food and beverages, and
need to meet production and quality standards required
worldwide, which demonstrates the competence of the
Brazilian companies.
Approximately 92% of plastic production volume in Brazil
is concentrated by large corporations that can get direct
supply from the petrochemical industries. Thus, almost
10 thousand companies, which represents the majority of
the industry of processed plastics, has as source of supply
the distributors of raw materials and correspond to only
8% of the total of plastic produced in Brazil.
GRÁFICO 4:
Distribuição dasempresas porporte (2013)CHART 4: Distribution of
companies by size (2013)
MicroMicro
8.093
PequenasSmall
2.739
MédiasMedium
696
Grandes (0,5%)Large
62
69,8%
23,6%
6%
Fonte: Empresas - RAIS (2013), último valor atualizado e Empregados - Caged (2014)/ MTE. Nota: De acordo com a metodologia do SEBRAE para
classificação do porte da empresa por número de funcionários, considera-se micro empresas aquelas com até 19 funcionários, pequenas as que possuem
de 20 a 99 funcionários, médias empresas as que estão entre 100 e 499 funcionários e grandes as com mais de 500 funcionários.
Source: RAIS (2013)-MTE. Note: In accordance with the methodology of SEBRAE, the sizes of companies are sorted by number of employees, micro
enterprises are those with up to 19 employees, small ones having between 20 to 99 employees, medium-sized enterprises those which have between 100
and 499 employees and large companies having 500 or more employees.
EMPRESAS DO SETOR DE TRANSFORMADOS PLÁSTICOSPROCESSED PLASTIC COMPANIES
O setor de Transformados Plásticos no BrasilThe Processed Plastic Industry in Brazil 29PERFIL 201428
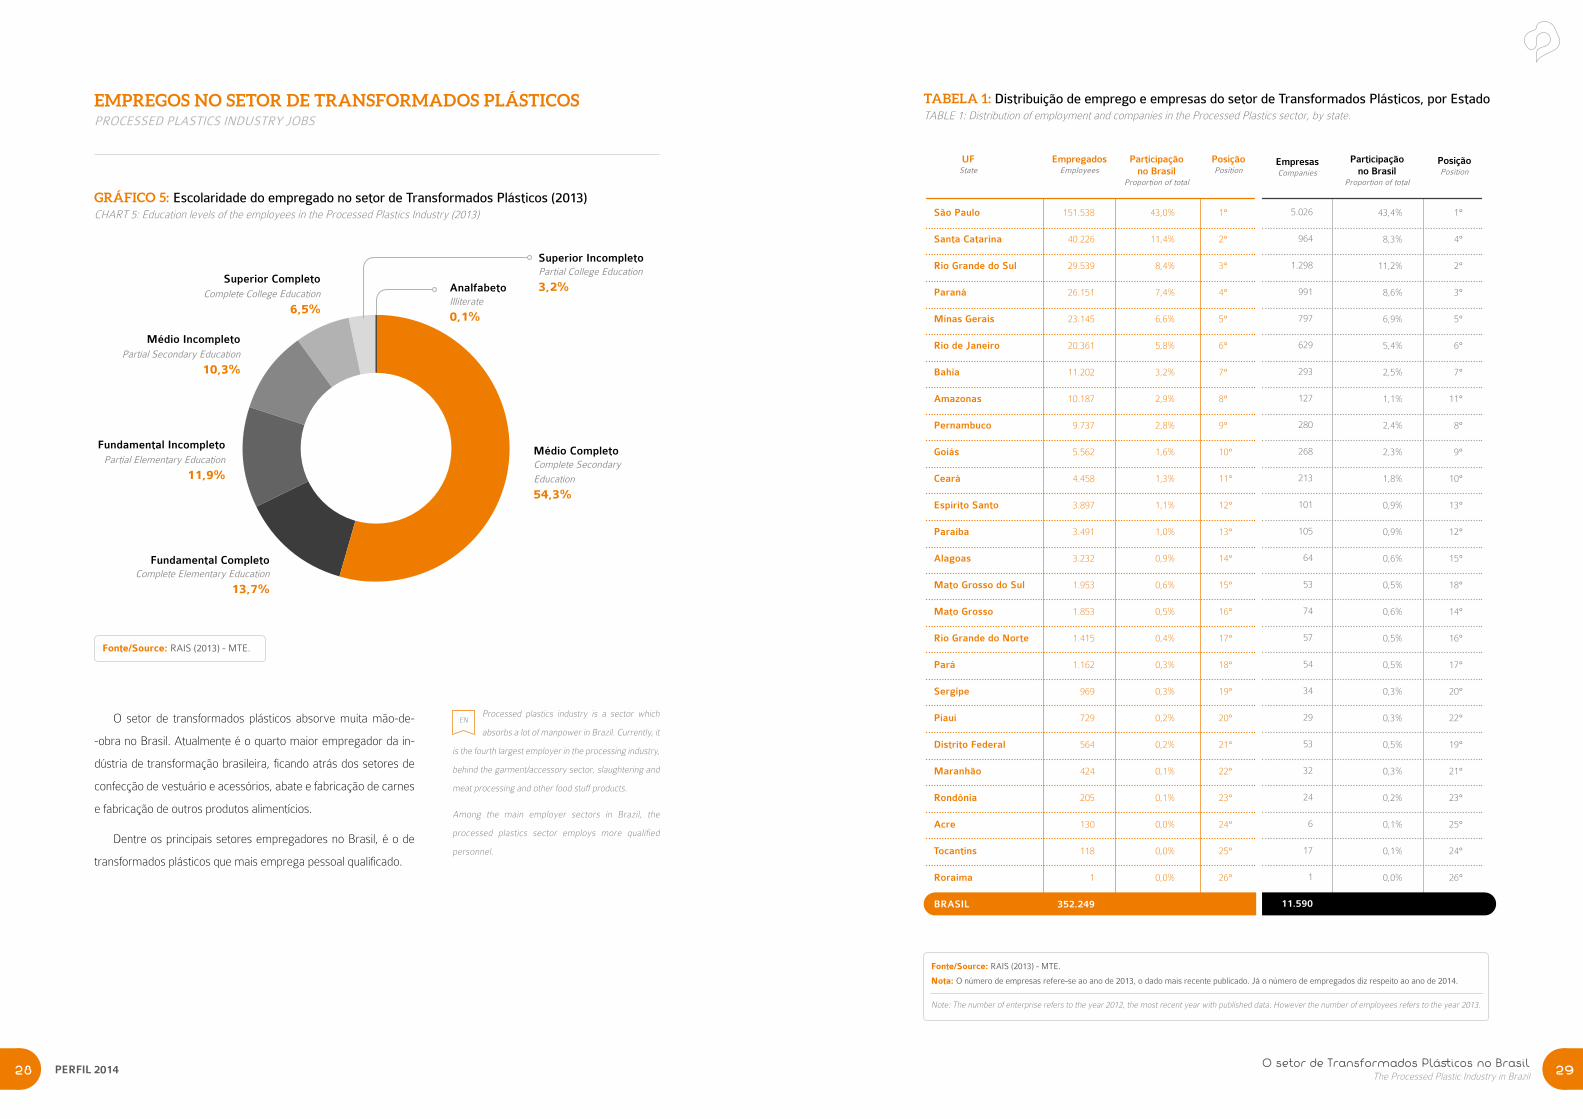
O setor de transformados plásticos absorve muita mão-de-
-obra no Brasil. Atualmente é o quarto maior empregador da in-
dústria de transformação brasileira, ficando atrás dos setores de
confecção de vestuário e acessórios, abate e fabricação de carnes
e fabricação de outros produtos alimentícios.
Dentre os principais setores empregadores no Brasil, é o de
transformados plásticos que mais emprega pessoal qualificado.
Processed plastics industry is a sector which
absorbs a lot of manpower in Brazil. Currently, it
is the fourth largest employer in the processing industry,
behind the garment/accessory sector, slaughtering and
meat processing and other food stuff products.
Among the main employer sectors in Brazil, the
processed plastics sector employs more qualified
personnel.
EMPREGOS NO SETOR DE TRANSFORMADOS PLÁSTICOSPROCESSED PLASTICS INDUSTRY JOBS
GRÁFICO 5: Escolaridade do empregado no setor de Transformados Plásticos (2013)CHART 5: Education levels of the employees in the Processed Plastics Industry (2013)
Fonte/Source: RAIS (2013) - MTE.
EN
AnalfabetoIlliterate
0,1%
Superior IncompletoPartial College Education
3,2%
Médio CompletoComplete Secondary
Education
54,3%
Fundamental CompletoComplete Elementary Education
13,7%
Fundamental IncompletoPartial Elementary Education
11,9%
Médio IncompletoPartial Secondary Education
10,3%
Superior CompletoComplete College Education
6,5%
TABELA 1: Distribuição de emprego e empresas do setor de Transformados Plásticos, por EstadoTABLE 1: Distribution of employment and companies in the Processed Plastics sector, by state.
Participaçãono Brasil
Proportion of total
Empregados Employees
PosiçãoPosition
Participaçãono Brasil
Proportion of total
EmpresasCompanies
PosiçãoPosition
São Paulo
Santa Catarina
Rio Grande do Sul
Paraná
Minas Gerais
Rio de Janeiro
Bahia
Amazonas
Pernambuco
Goiás
Ceará
Espírito Santo
Paraíba
Alagoas
Mato Grosso do Sul
Mato Grosso
Rio Grande do Norte
Pará
Sergipe
Piauí
Distrito Federal
Maranhão
Rondônia
Acre
Tocantins
Roraima
BRASIL
151.538
40.226
29.539
26.151
23.145
20.361
11.202
10.187
9.737
5.562
4.458
3.897
3.491
3.232
1.953
1.853
1.415
1.162
969
729
564
424
205
130
118
1
352.249
43,0%
11,4%
8,4%
7,4%
6,6%
5,8%
3,2%
2,9%
2,8%
1,6%
1,3%
1,1%
1,0%
0,9%
0,6%
0,5%
0,4%
0,3%
0,3%
0,2%
0,2%
0,1%
0,1%
0,0%
0,0%
0,0%
100%
1°
2°
3°
4°
5°
6°
7°
8°
9°
10°
11°
12°
13°
14°
15°
16°
17°
18°
19°
20°
21°
22°
23°
24°
25°
26°
5.026
964
1.298
991
797
629
293
127
280
268
213
101
105
64
53
74
57
54
34
29
53
32
24
6
17
1
11.590
43,4%
8,3%
11,2%
8,6%
6,9%
5,4%
2,5%
1,1%
2,4%
2,3%
1,8%
0,9%
0,9%
0,6%
0,5%
0,6%
0,5%
0,5%
0,3%
0,3%
0,5%
0,3%
0,2%
0,1%
0,1%
0,0%
1°
4°
2°
3°
5°
6°
7°
11°
8°
9°
10°
13°
12°
15°
18°
14°
16°
17°
20°
22°
19°
21°
23°
25°
24°
26°
UFState
Fonte/Source: RAIS (2013) - MTE.
Nota: O número de empresas refere-se ao ano de 2013, o dado mais recente publicado. Já o número de empregados diz respeito ao ano de 2014.
Note: The number of enterprise refers to the year 2012, the most recent year with published data. However the number of employees refers to the year 2013.
Rondônia 205 | 24
LEGENDA:
Roraima1 | 1
Amazonas 10.187 | 127
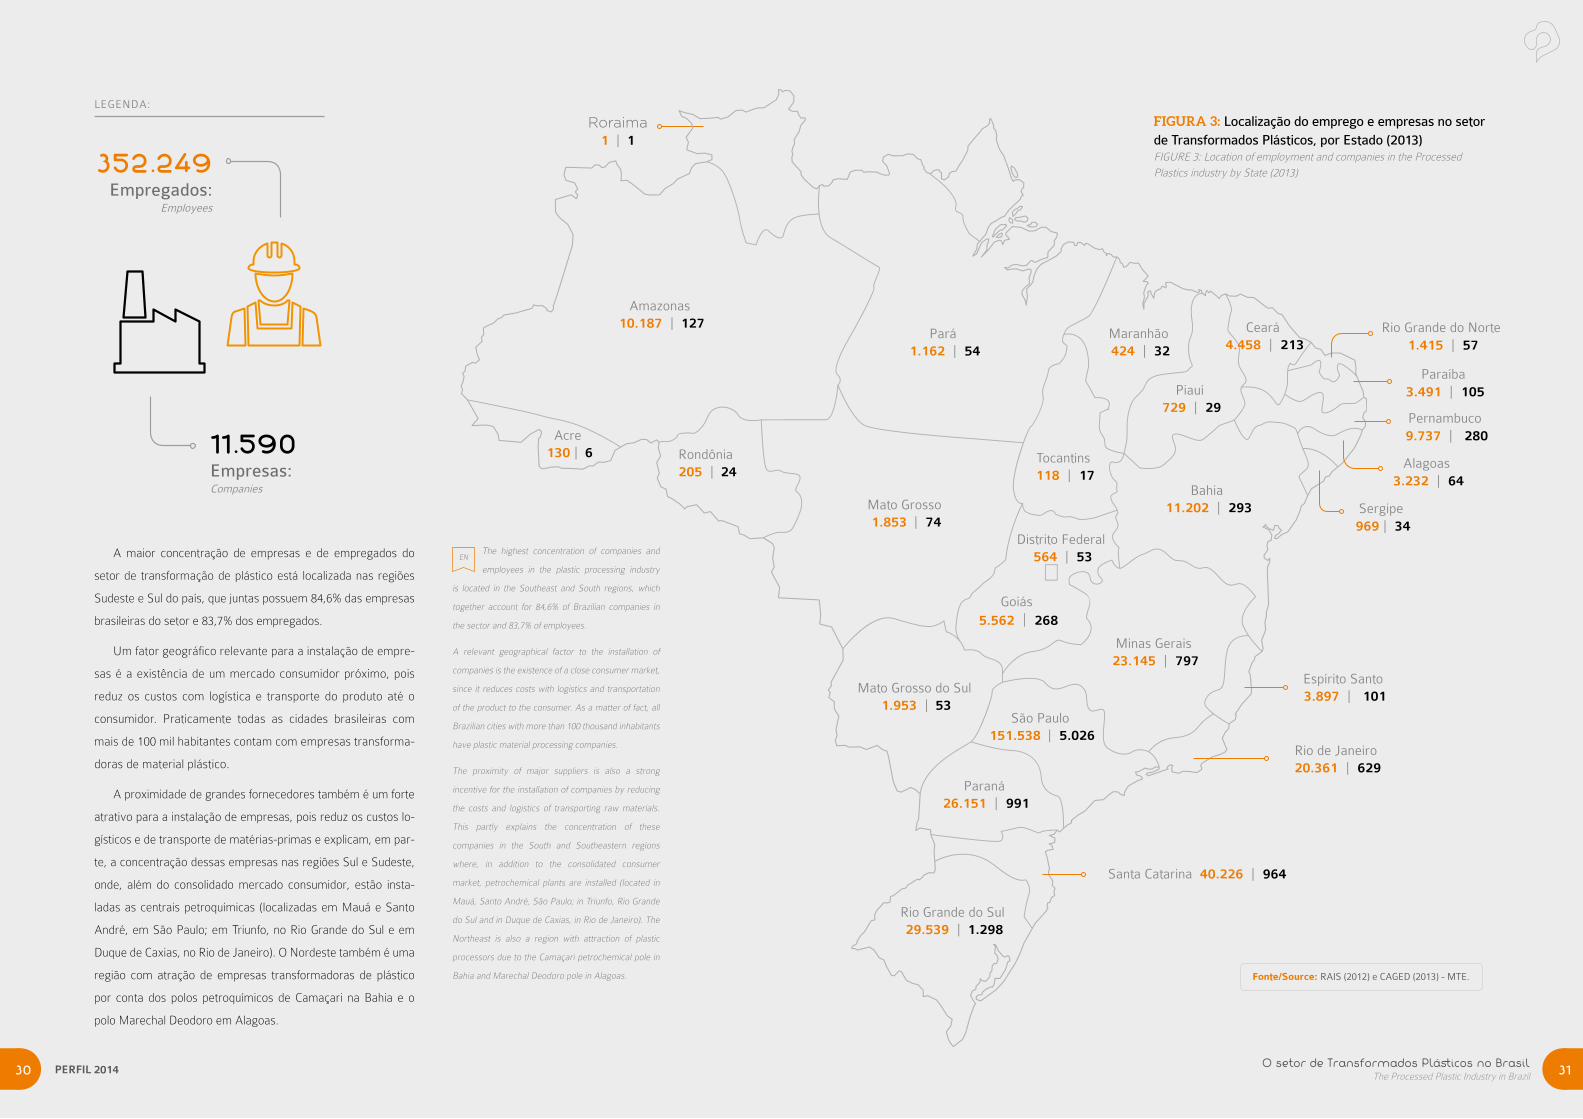
A maior concentração de empresas e de empregados do
setor de transformação de plástico está localizada nas regiões
Sudeste e Sul do país, que juntas possuem 84,6% das empresas
brasileiras do setor e 83,7% dos empregados.
Um fator geográfico relevante para a instalação de empre-
sas é a existência de um mercado consumidor próximo, pois
reduz os custos com logística e transporte do produto até o
consumidor. Praticamente todas as cidades brasileiras com
mais de 100 mil habitantes contam com empresas transforma-
doras de material plástico.
A proximidade de grandes fornecedores também é um forte
atrativo para a instalação de empresas, pois reduz os custos lo-
gísticos e de transporte de matérias-primas e explicam, em par-
te, a concentração dessas empresas nas regiões Sul e Sudeste,
onde, além do consolidado mercado consumidor, estão insta-
ladas as centrais petroquímicas (localizadas em Mauá e Santo
André, em São Paulo; em Triunfo, no Rio Grande do Sul e em
Duque de Caxias, no Rio de Janeiro). O Nordeste também é uma
região com atração de empresas transformadoras de plástico
por conta dos polos petroquímicos de Camaçari na Bahia e o
polo Marechal Deodoro em Alagoas.
The highest concentration of companies and
employees in the plastic processing industry
is located in the Southeast and South regions, which
together account for 84,6% of Brazilian companies in
the sector and 83,7% of employees.
A relevant geographical factor to the installation of
companies is the existence of a close consumer market,
since it reduces costs with logistics and transportation
of the product to the consumer. As a matter of fact, all
Brazilian cities with more than 100 thousand inhabitants
have plastic material processing companies.
The proximity of major suppliers is also a strong
incentive for the installation of companies by reducing
the costs and logistics of transporting raw materials.
This partly explains the concentration of these
companies in the South and Southeastern regions
where, in addition to the consolidated consumer
market, petrochemical plants are installed (located in
Mauá, Santo André, São Paulo; in Triunfo, Rio Grande
do Sul and in Duque de Caxias, in Rio de Janeiro). The
Northeast is also a region with attraction of plastic
processors due to the Camaçari petrochemical pole in
Bahia and Marechal Deodoro pole in Alagoas.
EN
11.590Empresas:Companies
352.249Empregados:
Employees
FIGURA 3: Localização do emprego e empresas no setor de Transformados Plásticos, por Estado (2013)FIGURE 3: Location of employment and companies in the ProcessedPlastics industry by State (2013)
Fonte/Source: RAIS (2012) e CAGED (2013) - MTE.
São Paulo 151.538 | 5.026
Santa Catarina 40.226 | 964
Rio Grande do Sul 29.539 | 1.298
Paraná 26.151 | 991
Minas Gerais 23.145 | 797
Rio de Janeiro 20.361 | 629
Bahia 11.202 | 293
Pernambuco 9.737 | 280
Goiás 5.562 | 268
Espírito Santo 3.897 | 101
Paraíba 3.491 | 105
Alagoas 3.232 | 64
Mato Grosso 1.853 | 74
Mato Grosso do Sul 1.953 | 53
Rio Grande do Norte 1.415 | 57
Pará 1.162 | 54
Sergipe 969 | 34
Piauí 729 | 29
Maranhão 424 | 32
Distrito Federal 564 | 53
Tocantins 118 | 17
Ceará 4.458 | 213
Acre 130 | 6
PERFIL 201430 O setor de Transformados Plásticos no BrasilThe Processed Plastic Industry in Brazil 31
O setor de Transformados Plásticos no BrasilThe Processed Plastic Industry in Brazil 33PERFIL 201432
Construção CivilConstruction
Alimentos e BebidasFood and beverage
Automóveis e autopeçasVehicles and parts
Plástico e BorrachaPlastic and rubber
Papel, celulose e impressãoPulp, paper and printing
Máquinas e equipamentosMachinery and equipment
AgriculturaAgriculture
MóveisFurniture
OutrosOthers
Produtos de metalMetal products
EletrônicosElectronics
FarmacêuticoPharmaceutical
Outros transportesOther transports
Perfumaria, higiene e limpezaPerfumery, toiletry and cosmetics
Instrumentos médicosMedical devices
Textêis e vestuárioTextiles and clothes
CalçadosShoes
EletrodomésticosHousehold appliances
QuímicoChemical
0% 2% 4% 6%
6%
5%
5%
5%
5%
4%
3%
2%
2%
2%
1%
1%
1%
1%
1%
8% 10% 12% 14% 16%
16%
16%
15%
8%
Fonte/Source: Tabela de Recursos e Usos (2010) – IBGE
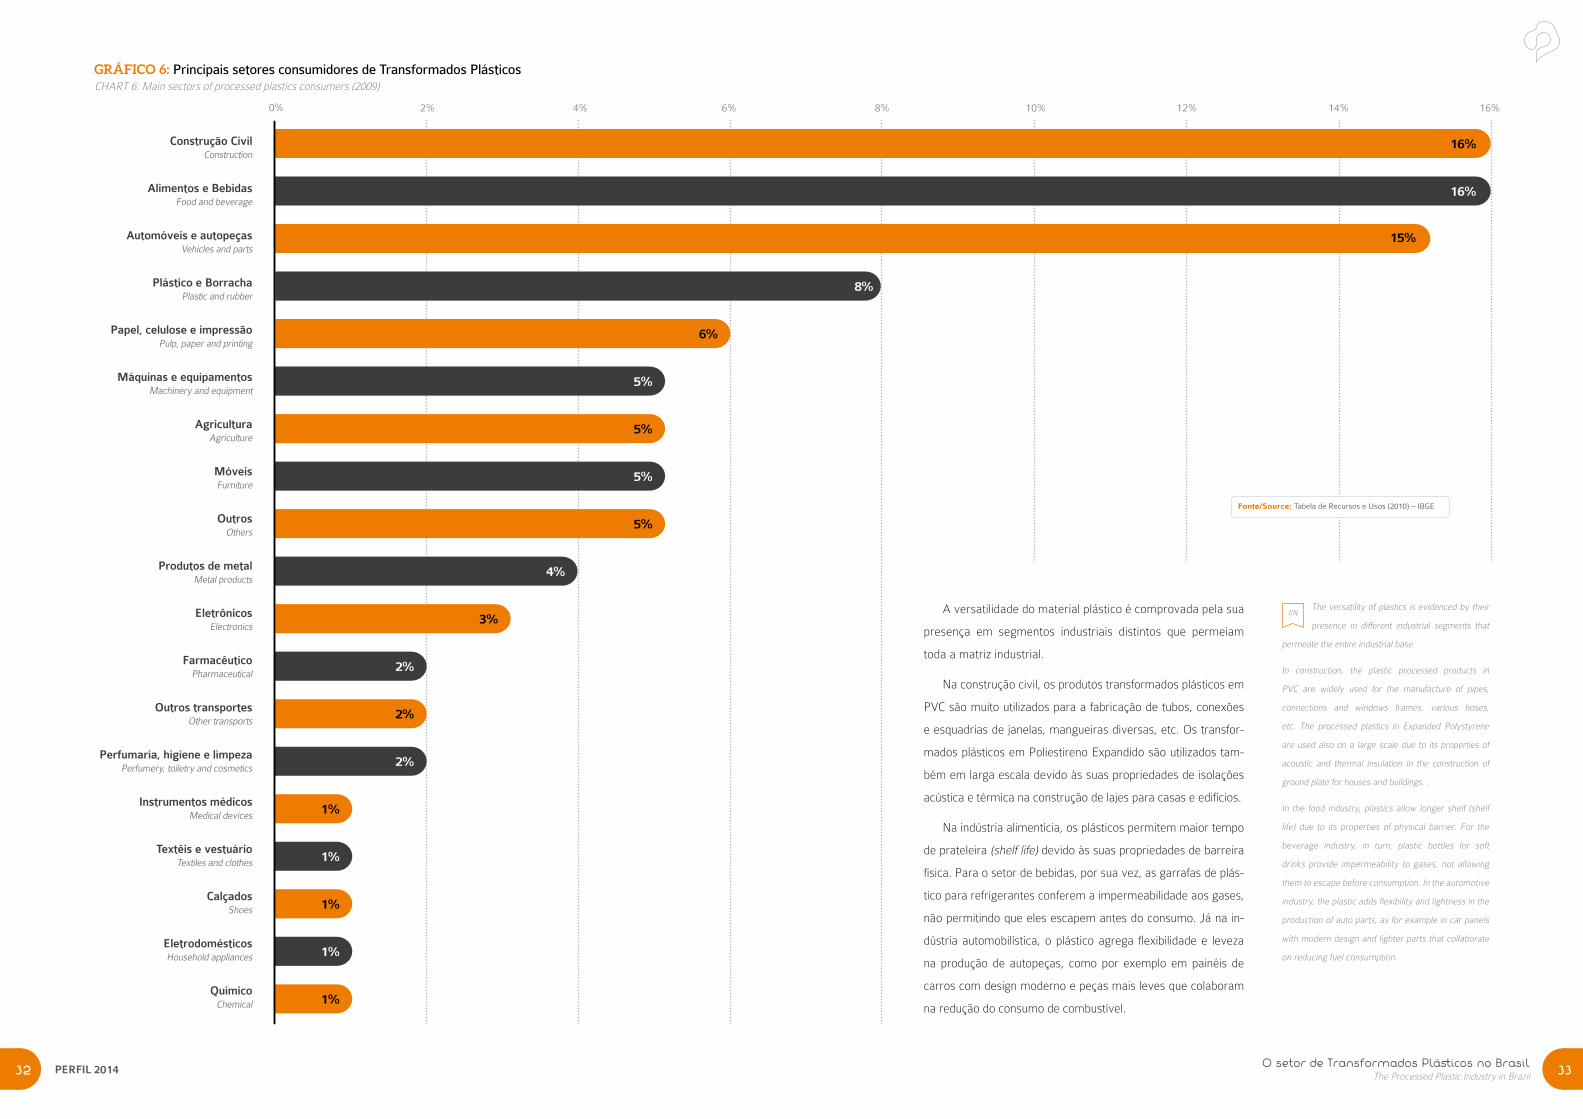
GRÁFICO 6: Principais setores consumidores de Transformados PlásticosCHART 6: Main sectors of processed plastics consumers (2009)
A versatilidade do material plástico é comprovada pela sua
presença em segmentos industriais distintos que permeiam
toda a matriz industrial.
Na construção civil, os produtos transformados plásticos em
PVC são muito utilizados para a fabricação de tubos, conexões
e esquadrias de janelas, mangueiras diversas, etc. Os transfor-
mados plásticos em Poliestireno Expandido são utilizados tam-
bém em larga escala devido às suas propriedades de isolações
acústica e térmica na construção de lajes para casas e edifícios.
Na indústria alimentícia, os plásticos permitem maior tempo
de prateleira (shelf life) devido às suas propriedades de barreira
física. Para o setor de bebidas, por sua vez, as garrafas de plás-
tico para refrigerantes conferem a impermeabilidade aos gases,
não permitindo que eles escapem antes do consumo. Já na in-
dústria automobilística, o plástico agrega flexibilidade e leveza
na produção de autopeças, como por exemplo em painéis de
carros com design moderno e peças mais leves que colaboram
na redução do consumo de combustível.
The versatility of plastics is evidenced by their
presence in different industrial segments that
permeate the entire industrial base.
In construction, the plastic processed products in
PVC are widely used for the manufacture of pipes,
connections and windows frames, various hoses,
etc. The processed plastics in Expanded Polystyrene
are used also on a large scale due to its properties of
acoustic and thermal insulation in the construction of
ground plate for houses and buildings. .
In the food industry, plastics allow longer shelf (shelf
life) due to its properties of physical barrier. For the
beverage industry, in turn, plastic bottles for soft
drinks provide impermeability to gases, not allowing
them to escape before consumption. In the automotive
industry, the plastic adds flexibility and lightness in the
production of auto parts, as for example in car panels
with modern design and lighter parts that collaborate
on reducing fuel consumption.
EN
PERFIL 201434 O setor de Transformados Plásticos no BrasilThe Processed Plastic Industry in Brazil 35
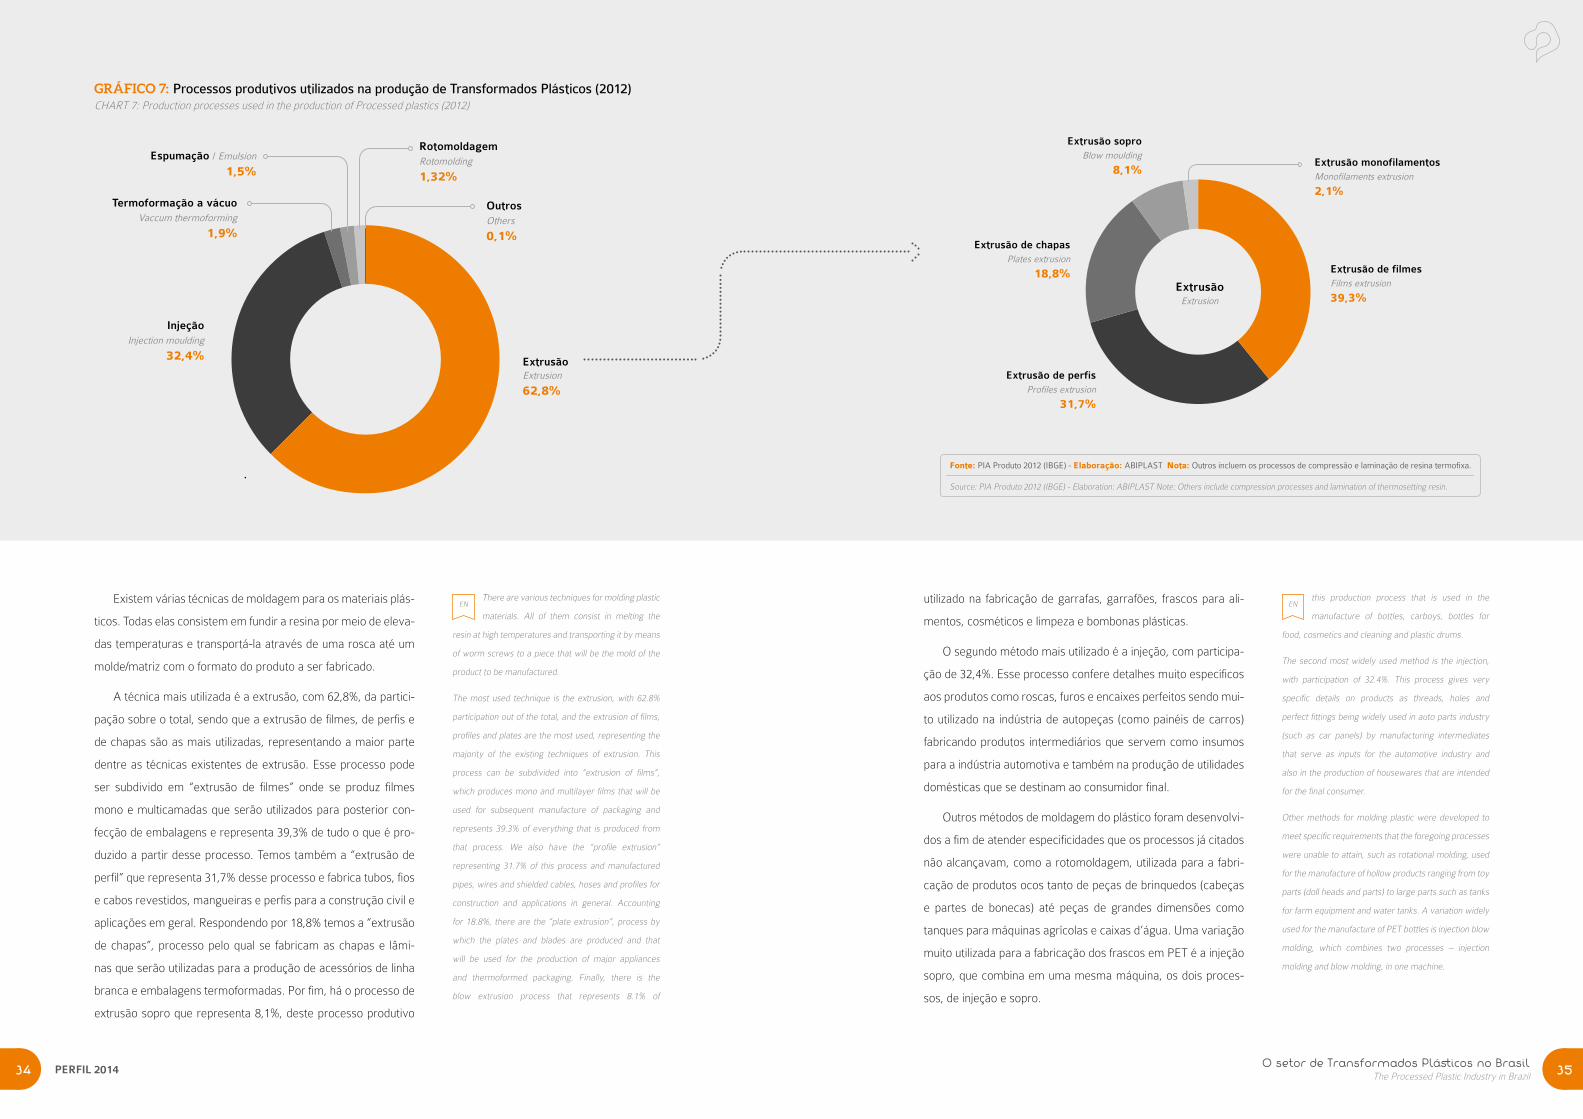
Existem várias técnicas de moldagem para os materiais plás-
ticos. Todas elas consistem em fundir a resina por meio de eleva-
das temperaturas e transportá-la através de uma rosca até um
molde/matriz com o formato do produto a ser fabricado.
A técnica mais utilizada é a extrusão, com 62,8%, da partici-
pação sobre o total, sendo que a extrusão de filmes, de perfis e
de chapas são as mais utilizadas, representando a maior parte
dentre as técnicas existentes de extrusão. Esse processo pode
ser subdivido em “extrusão de filmes” onde se produz filmes
mono e multicamadas que serão utilizados para posterior con-
fecção de embalagens e representa 39,3% de tudo o que é pro-
duzido a partir desse processo. Temos também a “extrusão de
perfil” que representa 31,7% desse processo e fabrica tubos, fios
e cabos revestidos, mangueiras e perfis para a construção civil e
aplicações em geral. Respondendo por 18,8% temos a “extrusão
de chapas”, processo pelo qual se fabricam as chapas e lâmi-
nas que serão utilizadas para a produção de acessórios de linha
branca e embalagens termoformadas. Por fim, há o processo de
extrusão sopro que representa 8,1%, deste processo produtivo
There are various techniques for molding plastic
materials. All of them consist in melting the
resin at high temperatures and transporting it by means
of worm screws to a piece that will be the mold of the
product to be manufactured.
The most used technique is the extrusion, with 62.8%
participation out of the total, and the extrusion of films,
profiles and plates are the most used, representing the
majority of the existing techniques of extrusion. This
process can be subdivided into “extrusion of films”,
which produces mono and multilayer films that will be
used for subsequent manufacture of packaging and
represents 39.3% of everything that is produced from
that process. We also have the “profile extrusion”
representing 31.7% of this process and manufactured
pipes, wires and shielded cables, hoses and profiles for
construction and applications in general. Accounting
for 18.8%, there are the “plate extrusion”, process by
which the plates and blades are produced and that
will be used for the production of major appliances
and thermoformed packaging. Finally, there is the
blow extrusion process that represents 8.1% of
EN
GRÁFICO 7: Processos produtivos utilizados na produção de Transformados Plásticos (2012)CHART 7: Production processes used in the production of Processed plastics (2012)
ExtrusãoExtrusion
62,8%
InjeçãoInjection moulding
32,4%
Termoformação a vácuoVaccum thermoforming
1,9%
Espumação / Emulsion
1,5%
RotomoldagemRotomolding
1,32%
OutrosOthers
0,1%
EN
Extrusão de filmesFilms extrusion
39,3%
Extrusão de perfisProfiles extrusion
31,7%
Extrusão de chapasPlates extrusion
18,8%
Extrusão soproBlow moulding
8,1%Extrusão monofilamentosMonofilaments extrusion
2,1%
ExtrusãoExtrusion
Fonte: PIA Produto 2012 (IBGE) - Elaboração: ABIPLAST Nota: Outros incluem os processos de compressão e laminação de resina termofixa.
Source: PIA Produto 2012 (IBGE) - Elaboration: ABIPLAST Note: Others include compression processes and lamination of thermosetting resin.
utilizado na fabricação de garrafas, garrafões, frascos para ali-
mentos, cosméticos e limpeza e bombonas plásticas.
O segundo método mais utilizado é a injeção, com participa-
ção de 32,4%. Esse processo confere detalhes muito específicos
aos produtos como roscas, furos e encaixes perfeitos sendo mui-
to utilizado na indústria de autopeças (como painéis de carros)
fabricando produtos intermediários que servem como insumos
para a indústria automotiva e também na produção de utilidades
domésticas que se destinam ao consumidor final.
Outros métodos de moldagem do plástico foram desenvolvi-
dos a fim de atender especificidades que os processos já citados
não alcançavam, como a rotomoldagem, utilizada para a fabri-
cação de produtos ocos tanto de peças de brinquedos (cabeças
e partes de bonecas) até peças de grandes dimensões como
tanques para máquinas agrícolas e caixas d’água. Uma variação
muito utilizada para a fabricação dos frascos em PET é a injeção
sopro, que combina em uma mesma máquina, os dois proces-
sos, de injeção e sopro.
this production process that is used in the
manufacture of bottles, carboys, bottles for
food, cosmetics and cleaning and plastic drums.
The second most widely used method is the injection,
with participation of 32.4%. This process gives very
specific details on products as threads, holes and
perfect fittings being widely used in auto parts industry
(such as car panels) by manufacturing intermediates
that serve as inputs for the automotive industry and
also in the production of housewares that are intended
for the final consumer.
Other methods for molding plastic were developed to
meet specific requirements that the foregoing processes
were unable to attain, such as rotational molding, used
for the manufacture of hollow products ranging from toy
parts (doll heads and parts) to large parts such as tanks
for farm equipment and water tanks. A variation widely
used for the manufacture of PET bottles is injection blow
molding, which combines two processes – injection
molding and blow molding, in one machine.
Características da Indústria de Reciclagem de Material Plástico Pós-consumo no BrasilCharacteristics of the Post-consumer Plastic Recycling Industry in Brazil 37PERFIL 201436
Característicasda Indústria de Reciclagem de
Material PlásticoPós-consumo
no Brasil
Characteristics of the
Post-consumer Plastic
Recycling Industry in Brazil
Características da Indústria de Reciclagem de Material Plástico Pós-consumo no BrasilCharacteristics of the Post-consumer Plastic Recycling Industry in Brazil 39
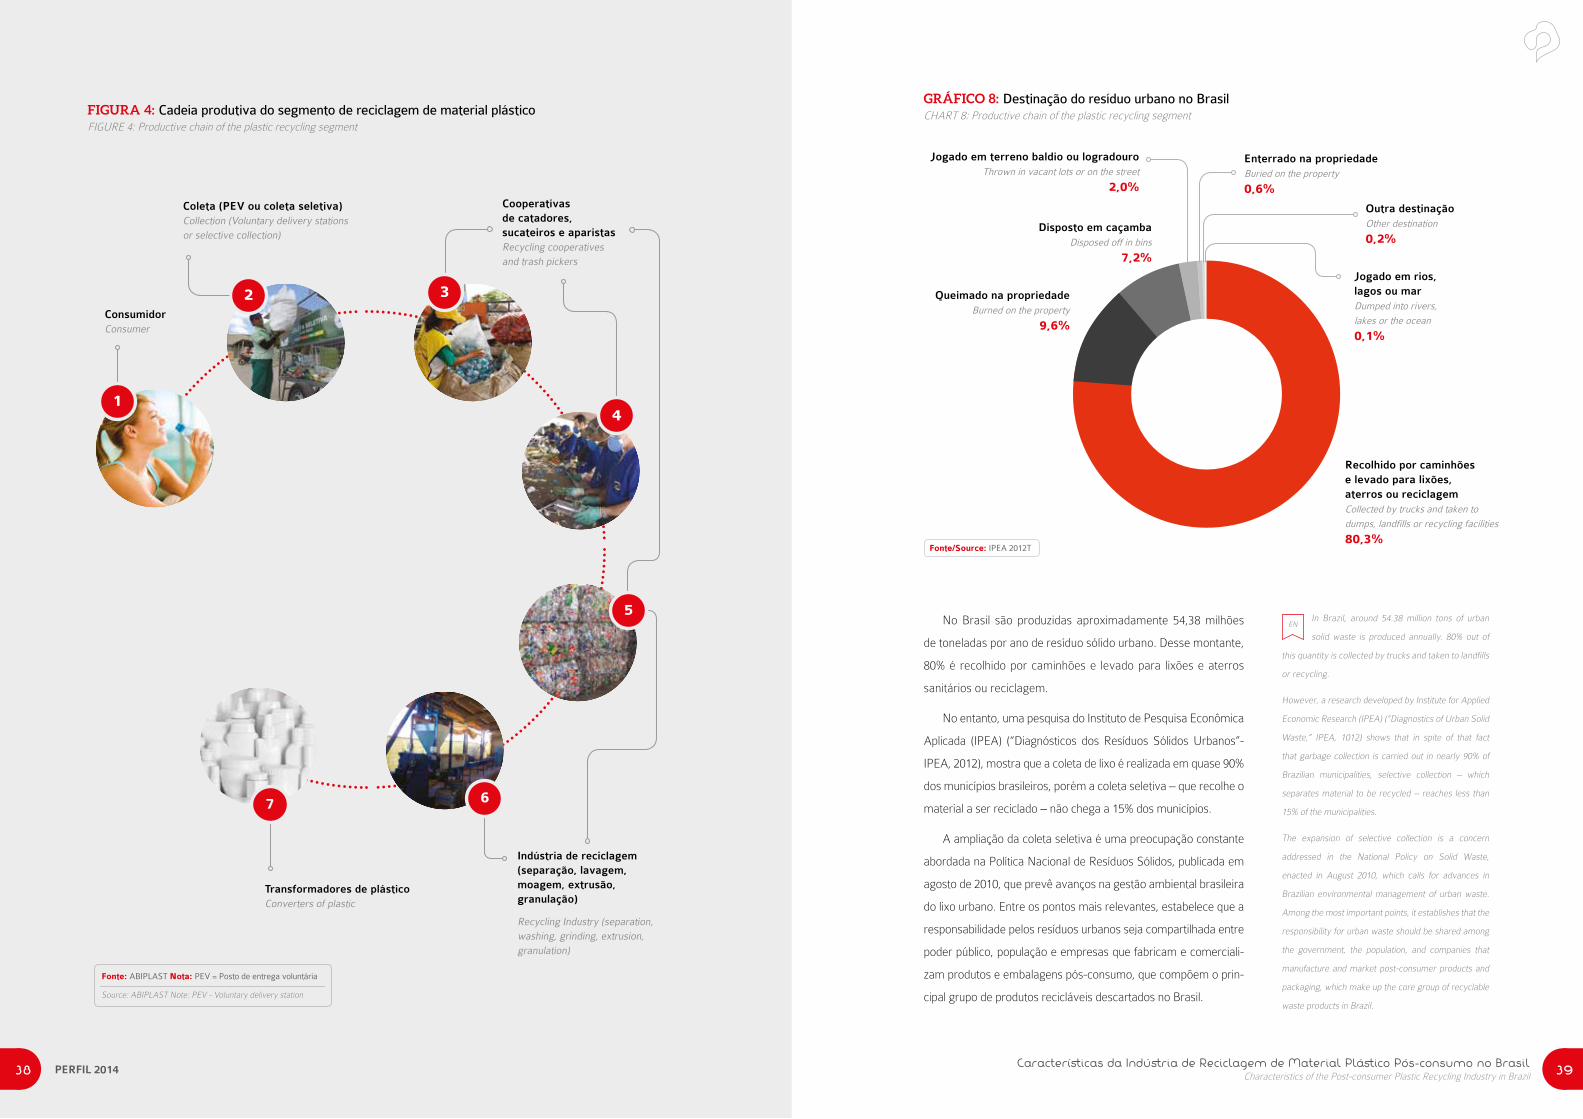
FIGURA 4: Cadeia produtiva do segmento de reciclagem de material plásticoFIGURE 4: Productive chain of the plastic recycling segment
Fonte: ABIPLAST Nota: PEV = Posto de entrega voluntária
Source: ABIPLAST Note: PEV - Voluntary delivery station
ConsumidorConsumer
Coleta (PEV ou coleta seletiva)Collection (Voluntary delivery stations or selective collection)
Cooperativasde catadores,sucateiros e aparistasRecycling cooperativesand trash pickers
Indústria de reciclagem(separação, lavagem, moagem, extrusão, granulação)
Recycling Industry (separation, washing, grinding, extrusion, granulation)
Transformadores de plástico Converters of plastic
2
5
4
67
3
1
No Brasil são produzidas aproximadamente 54,38 milhões
de toneladas por ano de resíduo sólido urbano. Desse montante,
80% é recolhido por caminhões e levado para lixões e aterros
sanitários ou reciclagem.
No entanto, uma pesquisa do Instituto de Pesquisa Econômica
Aplicada (IPEA) (“Diagnósticos dos Resíduos Sólidos Urbanos”-
IPEA, 2012), mostra que a coleta de lixo é realizada em quase 90%
dos municípios brasileiros, porém a coleta seletiva – que recolhe o
material a ser reciclado – não chega a 15% dos municípios.
A ampliação da coleta seletiva é uma preocupação constante
abordada na Política Nacional de Resíduos Sólidos, publicada em
agosto de 2010, que prevê avanços na gestão ambiental brasileira
do lixo urbano. Entre os pontos mais relevantes, estabelece que a
responsabilidade pelos resíduos urbanos seja compartilhada entre
poder público, população e empresas que fabricam e comerciali-
zam produtos e embalagens pós-consumo, que compõem o prin-
cipal grupo de produtos recicláveis descartados no Brasil.
In Brazil, around 54.38 million tons of urban
solid waste is produced annually. 80% out of
this quantity is collected by trucks and taken to landfills
or recycling.
However, a research developed by Institute for Applied
Economic Research (IPEA) (“Diagnostics of Urban Solid
Waste,” IPEA, 1012) shows that in spite of that fact
that garbage collection is carried out in nearly 90% of
Brazilian municipalities, selective collection – which
separates material to be recycled – reaches less than
15% of the municipalities.
The expansion of selective collection is a concern
addressed in the National Policy on Solid Waste,
enacted in August 2010, which calls for advances in
Brazilian environmental management of urban waste.
Among the most important points, it establishes that the
responsibility for urban waste should be shared among
the government, the population, and companies that
manufacture and market post-consumer products and
packaging, which make up the core group of recyclable
waste products in Brazil.
EN
GRÁFICO 8: Destinação do resíduo urbano no BrasilCHART 8: Productive chain of the plastic recycling segment
Recolhido por caminhõese levado para lixões, aterros ou reciclagemCollected by trucks and taken to
dumps, landfills or recycling facilities
80,3%
Queimado na propriedadeBurned on the property
9,6%
Disposto em caçambaDisposed off in bins
7,2%
Jogado em terreno baldio ou logradouroThrown in vacant lots or on the street
2,0%
Jogado em rios,lagos ou marDumped into rivers,
lakes or the ocean
0,1%
Outra destinaçãoOther destination
0,2%
Enterrado na propriedadeBuried on the property
0,6%
Fonte/Source: IPEA 2012T
PERFIL 201438

Características da Indústria de Reciclagem de Material Plástico Pós-consumo no BrasilCharacteristics of the Post-consumer Plastic Recycling Industry in Brazil 41PERFIL 201440
Muitos dos materiais que poderiam ser reciclados no Bra-
sil ainda continuam sendo destinados a aterros e lixões. Deste
volume, o plástico representa 13,5%, e é o principal produto
reciclável que é enterrado ao invés de ter a destinação correta
da reciclagem.
O potencial ambiental e econômico desperdiçado com a des-
tinação inadequada de plástico é em média de R$ 5,08 bilhões
por ano segundo o IPEA (2012).
De acordo com a RAIS 2013, existem no Brasil 1.029 esta-
belecimentos industriais dedicados à recuperação de materiais
plásticos espalhados pelo Brasil, que empregam segundo essa
fonte 9,7 mil pessoas diretamente. A RAIS contabiliza apenas
empregos diretos gerados pelas empresas voltadas especifica-
mente à reciclagem, porém em estudo da ABIPLAST que consi-
dera também os empregos em empresas transformadoras e que
fazem a reciclagem, podemos considerar que aproximadamente
20 mil empregos existem hoje por conta da atividade de recicla-
gem de material plástico.
Many of the materials that could be recycled in
Brazil are still being sent to landfills and dumps.
Plastic represents 13.5% of this volume, and it is the
main recyclable product that is buried instead of having
the proper destination of recycling.
The environmental and economic potential wasted on
improper disposal of plastics is on average BRL 5.08
billion per year, according to the IPEA (2012).
According to RAIS 2013, there are in Brazil 1,029 industrial
establishments dedicated to plastic materials recovery
throughout the country which employ, according to that
source, 9.7 thousand people directly. The RAIS counts
only direct jobs generated by companies specifically
geared to recycling, however in ABIPLAST study that
considers also uses in processors and recycling, we can
consider that approximately 20 000 jobs exist today due
to the plastic material recycling activity.
EN
GRÁFICO 9: Principais materiais descartados no Brasil – em percentualCHART 9: Main materials discarded in Brazil (in percentage)
Fonte/Source: IPEA 2012 IPEA 2012
Matéria orgânicaOrganic matter
51,4%
OutrosOther
16,7%
PlásticoPlastic
13,5%
VidroGlass
2,4%
Papel, papelão e longa-vida
Paper, cardboard
and Tetra Pak
13,1% AçoSteel
2,3%
AlumínioAluminum
0,6%
Do total de empresas recicladoras de material plástico, mais
de 800 são micro e pequenas enquadradas no “Simples Nacio-
nal” e não possuem mais do que 20 empregados cada.
Empresas com um porte mais elevado que atuam especifica-
mente com reciclagem não passam de 30, que empregam acima
de 50 empregados. São apenas 06 empresas dessa atividade
que contam com mais de 100 funcionários.
De acordo com uma pesquisa realizada pela ABIPLAST, esti-
ma-se que são retirados do meio ambiente por ano aproximada-
mente 805 mil toneladas de resíduos pós-consumo, que dão ori-
gem a mais de 725 mil toneladas de materiais plásticos reciclados.
Diversos produtos podem utilizar resina reciclada em sua
composição, de acordo com as normas apontadas pelos órgãos
competentes (como INMETRO, ABNT, ANVISA e outras). Obe-
decendo a legislação, muitas empresas desenvolvem linhas de
produtos com apelo ecológico e optam por utilizar essa resina.
As empresas que fabricam utilidades domésticas para a área de
serviço, são as que mais utilizam a resina reciclada. Os produtos
incluem cabides de roupas, prendedores, vasos, bandejas, bacias
e vassouras, mas também há interesse por parte de produtores
de bens para agropecuária, automotivo, têxtil e construção civil.
Os produtos plásticos são 100% recicláveis e existe uma
Norma Técnica (NBR 13.230) para a identificação dos produtos
plásticos e suas respectivas matérias-primas a fim de facilitar o
processo de reciclagem.
From the total plastic material recycling
companies, more than 800 are micro and small
framed in Simplified Taxation System and do not have
more than 20 employees each.
Approximately only 30 companies are exclusively
engaged in the recycling business and have bigger size
by employing over 50 employees and only 6 companies
have more than 100 employees.
According to a survey by ABIPLAST, it is estimated that
805 thousand tons of post-consumer waste are withdrawn
from the environment, which gave rise to more than 725
thousand tons of recycled plastic materials.
Several products may use recycled resin in its
composition, in accordance with the standards set out
by the competent organs (such as ABNT, ANVISA and
INMETRO among others). In order to accomplish with
the law, many companies develop product lines with
ecological appeal and opt to use this resin. Companies
that manufacture housewares for the service rooms
are those that use most recycled resin. The products
include clothes hangers, fasteners, vases, trays,
bowls and brooms, but also there is interest on the
part of producers of agricultural goods, automotive,
textile and construction.
Plastic products are 100% recyclable and there is
a Technical Rule (NBR 13.230) for identification of
plastic products and their raw materials to facilitate the
recycling process.
EN
PET PEAD PVC PEBD
PP PS OUTROS
HDPE LDPE
OTHERS
FIGURA 5: Identificação e simbologia de plásticos recicláveisFIGURE 5: Identification and symbology of recyclable plastics
Fonte: Norma ABNT NBR 13230. Source: ABNT NBR 13230 Technical Rule.

Resumo da Cadeia Produtiva do Plástico no BrasilSummary of plastic production chain in Brazil 43PERFIL 201442
Importações de resinastermoplásticas:
R$ 4,7 bilhõesImports of thermoplastic
resins: BRL 4.7 billion
Importaçãode resinas
termoplásticas:
R$ 4,7 bilhõesImport of thermoplastic
resins R$ 5.9 billion
Exportações de transformados plásticos:
R$ 3,2 bilhõesExports of processed plastics:
BRL 3.2 billion
Importações de transformados plásticos:
R$ 9,1 bilhõesImports of processed plastics:
BRL 9.1 billion
Principaisresinasconsumidas:Main resins consumed:
PP: 23,3%PP: 23,3%
PVC: 14,9%PVC: 14,9%
PEAD: 13,1%HDPE: 13,1%
PEBD: 9,5%LDPE: 9,5%
PEBDL: 11,4%LLDPE: 11,4%
PET: 7,1%PET: 7,1%
PS: 5,9%PS: 5,9%
EPS: 1,5%EPS: 1,5%
EVA: 1,5%EVA: 1,5%
Plásticos de engenharia: 11,8%Engineering Plastics: 11,8%
Produção de transformados
plásticos:
R$59,9 bilhõesProduction of
processed plastics:
BRL 59.9 billion
Consumoaparente de transformados
plásticos:
R$65,8 bilhõesApparent consumption of
processed plastics:
BRL 65.8 billion
PARCELAIMPORTADA:
14%
Imported share: 14%
Exportações de resinastermoplásticas:
R$ 2,1 bilhõesThermoplastic resins exports:
BRL 2.1 billion
FIGURA 6: RESUMO DA CADEIA PRODUTIVA DO PLÁSTICO NO BRASILFIGURE 6: SUMMARY OF PLASTIC PRODUCTION CHAIN IN BRAZIL
Setores consumidores de artigos plásticos:Consumer sectors of plastic articles:
• Construção civil: 16% Construction: 16%
• Alimentos e bebidas: 16% Food and beverage: 16%
• Automóveis e autopeças: 15% Vehicles and parts: 15%
• Borracha e plástico: 8% Rubber and plastics: 8%
• Papel, celulose e impressão: 6% Pulp, paper and printing: 6%
• Agricultura: 5% Agriculture: 5%
• Outros: 34% Others: 34%
CONSUMOFINAL
Final Consumption
Reciclagem mecânica de material plástico
pós-consumo:
725mil ton
Mechanical recycling of
post-consumer plastic
material: 725 mil ton
RECICLAGEM INDUSTRIAL
Industrial recycling
Fonte/Source: PIA Empresa, PIA Produto, PIM-PF,
Contas nacionais/ IBGE, AliceWeb/ MDIC.
Elaboração/Compiled by: ABIPLAST
Desempenho da Indústria Brasileira de Transformados PlásticosPerformance of Brazilian Processed Plastics Industry 45
Desempenho da IndústriaBrasileira de Transformados Plásticos
Performance of
Brazilian Processed
Plastics Industry
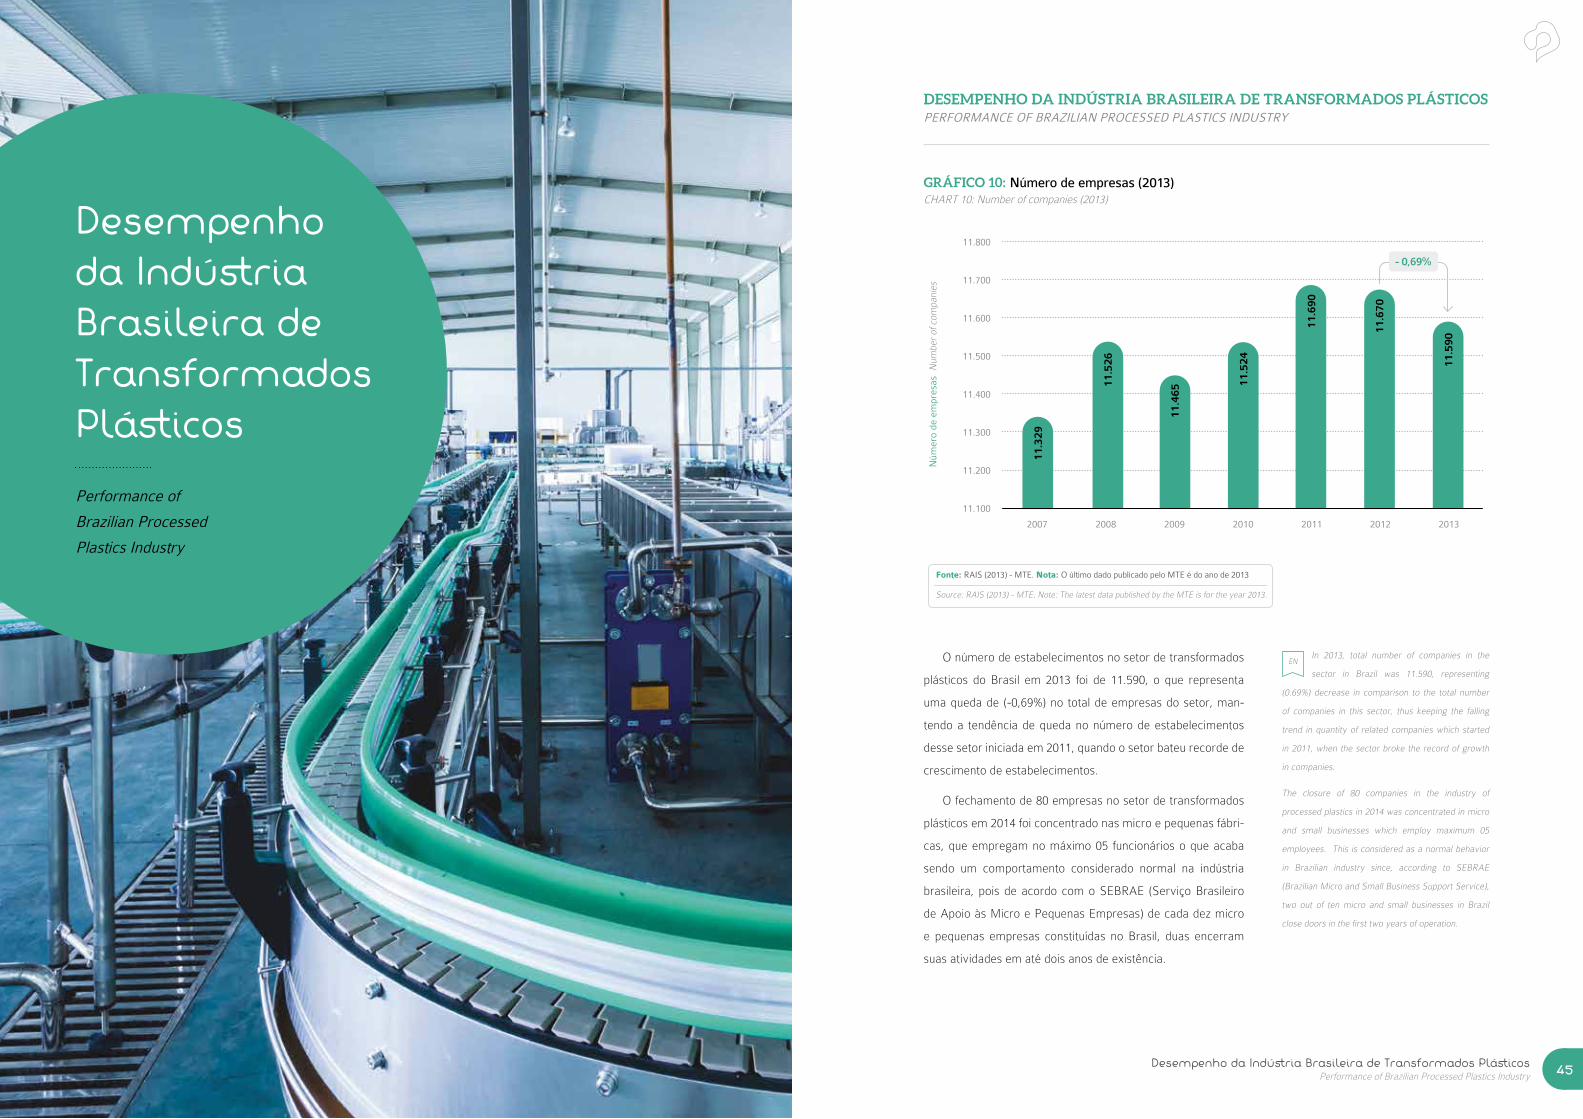
O número de estabelecimentos no setor de transformados
plásticos do Brasil em 2013 foi de 11.590, o que representa
uma queda de (-0,69%) no total de empresas do setor, man-
tendo a tendência de queda no número de estabelecimentos
desse setor iniciada em 2011, quando o setor bateu recorde de
crescimento de estabelecimentos.
O fechamento de 80 empresas no setor de transformados
plásticos em 2014 foi concentrado nas micro e pequenas fábri-
cas, que empregam no máximo 05 funcionários o que acaba
sendo um comportamento considerado normal na indústria
brasileira, pois de acordo com o SEBRAE (Serviço Brasileiro
de Apoio às Micro e Pequenas Empresas) de cada dez micro
e pequenas empresas constituídas no Brasil, duas encerram
suas atividades em até dois anos de existência.
In 2013, total number of companies in the
sector in Brazil was 11.590, representing
(0.69%) decrease in comparison to the total number
of companies in this sector, thus keeping the falling
trend in quantity of related companies which started
in 2011, when the sector broke the record of growth
in companies.
The closure of 80 companies in the industry of
processed plastics in 2014 was concentrated in micro
and small businesses which employ maximum 05
employees. This is considered as a normal behavior
in Brazilian industry since, according to SEBRAE
(Brazilian Micro and Small Business Support Service),
two out of ten micro and small businesses in Brazil
close doors in the first two years of operation.
EN
GRÁFICO 10: Número de empresas (2013)CHART 10: Number of companies (2013)
DESEMPENHO DA INDÚSTRIA BRASILEIRA DE TRANSFORMADOS PLÁSTICOSPERFORMANCE OF BRAZILIAN PROCESSED PLASTICS INDUSTRY
11.800
11.700
11.600
11.500
11.400
11.300
11.200
11.100
2007 20102008 2011 20132009 2012
11.3
29
11.5
26
11.4
65
11.5
24
11.6
90
11.6
70
11.5
90
- 0,69%
Fonte: RAIS (2013) - MTE. Nota: O último dado publicado pelo MTE é do ano de 2013
Source: RAIS (2013) - MTE. Note: The latest data published by the MTE is for the year 2013.
Núm
ero
de e
mpr
esas
Num
ber
of c
ompa
nies
Desempenho da Indústria Brasileira de Transformados PlásticosPerformance of Brazilian Processed Plastics Industry 47PERFIL 201446
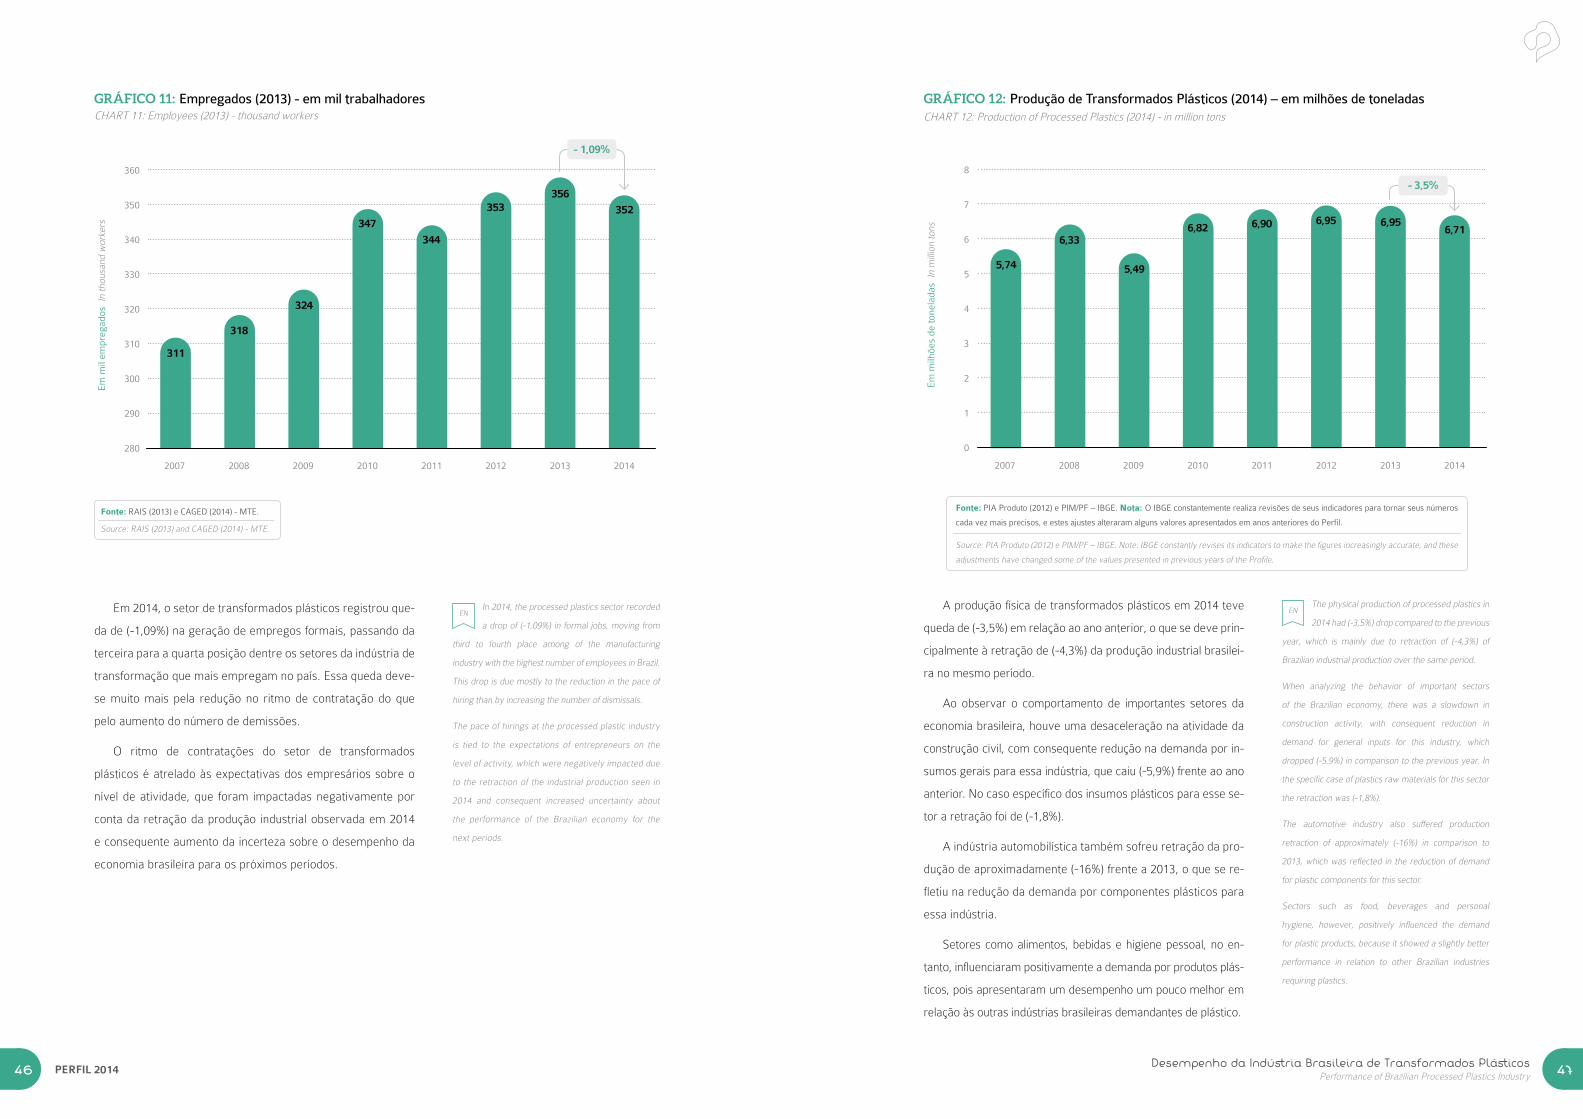
Em 2014, o setor de transformados plásticos registrou que-
da de (-1,09%) na geração de empregos formais, passando da
terceira para a quarta posição dentre os setores da indústria de
transformação que mais empregam no país. Essa queda deve-
se muito mais pela redução no ritmo de contratação do que
pelo aumento do número de demissões.
O ritmo de contratações do setor de transformados
plásticos é atrelado às expectativas dos empresários sobre o
nível de atividade, que foram impactadas negativamente por
conta da retração da produção industrial observada em 2014
e consequente aumento da incerteza sobre o desempenho da
economia brasileira para os próximos períodos.
In 2014, the processed plastics sector recorded
a drop of (-1,09%) in formal jobs, moving from
third to fourth place among of the manufacturing
industry with the highest number of employees in Brazil.
This drop is due mostly to the reduction in the pace of
hiring than by increasing the number of dismissals.
The pace of hirings at the processed plastic industry
is tied to the expectations of entrepreneurs on the
level of activity, which were negatively impacted due
to the retraction of the industrial production seen in
2014 and consequent increased uncertainty about
the performance of the Brazilian economy for the
next periods.
EN
GRÁFICO 11: Empregados (2013) - em mil trabalhadoresCHART 11: Employees (2013) - thousand workers
360
350
340
330
320
310
300
290
280
Em
mil
empr
egad
os I
n th
ousa
nd w
orke
rs
2007 20102008 2011 2013 20142009 2012
311
318
324
347
344
353356
352
Fonte: RAIS (2013) e CAGED (2014) - MTE.
Source: RAIS (2013) and CAGED (2014) - MTE.
A produção física de transformados plásticos em 2014 teve
queda de (-3,5%) em relação ao ano anterior, o que se deve prin-
cipalmente à retração de (-4,3%) da produção industrial brasilei-
ra no mesmo período.
Ao observar o comportamento de importantes setores da
economia brasileira, houve uma desaceleração na atividade da
construção civil, com consequente redução na demanda por in-
sumos gerais para essa indústria, que caiu (-5,9%) frente ao ano
anterior. No caso específico dos insumos plásticos para esse se-
tor a retração foi de (-1,8%).
A indústria automobilística também sofreu retração da pro-
dução de aproximadamente (-16%) frente a 2013, o que se re-
fletiu na redução da demanda por componentes plásticos para
essa indústria.
Setores como alimentos, bebidas e higiene pessoal, no en-
tanto, influenciaram positivamente a demanda por produtos plás-
ticos, pois apresentaram um desempenho um pouco melhor em
relação às outras indústrias brasileiras demandantes de plástico.
The physical production of processed plastics in
2014 had (-3,5%) drop compared to the previous
year, which is mainly due to retraction of (-4,3%) of
Brazilian industrial production over the same period.
When analyzing the behavior of important sectors
of the Brazilian economy, there was a slowdown in
construction activity, with consequent reduction in
demand for general inputs for this industry, which
dropped (-5,9%) in comparison to the previous year. In
the specific case of plastics raw materials for this sector
the retraction was (-1,8%).
The automotive industry also suffered production
retraction of approximately (-16%) in comparison to
2013, which was reflected in the reduction of demand
for plastic components for this sector.
Sectors such as food, beverages and personal
hygiene, however, positively influenced the demand
for plastic products, because it showed a slightly better
performance in relation to other Brazilian industries
requiring plastics.
EN
GRÁFICO 12: Produção de Transformados Plásticos (2014) – em milhões de toneladasCHART 12: Production of Processed Plastics (2014) - in million tons
Em
milh
ões
de to
nela
das
In m
illio
n to
ns
8
7
6
5
4
3
2
1
0
2007 20102008 2011 2013 20142009 2012
5,74
6,33
5,49
6,82 6,90 6,95 6,956,71
Fonte: PIA Produto (2012) e PIM/PF – IBGE. Nota: O IBGE constantemente realiza revisões de seus indicadores para tornar seus números
cada vez mais precisos, e estes ajustes alteraram alguns valores apresentados em anos anteriores do Perfil.
Source: PIA Produto (2012) e PIM/PF – IBGE. Note: IBGE constantly revises its indicators to make the figures increasingly accurate, and these
adjustments have changed some of the values presented in previous years of the Profile.
- 1,09%
- 3,5%
Desempenho da Indústria Brasileira de Transformados PlásticosPerformance of Brazilian Processed Plastics Industry 49PERFIL 201448
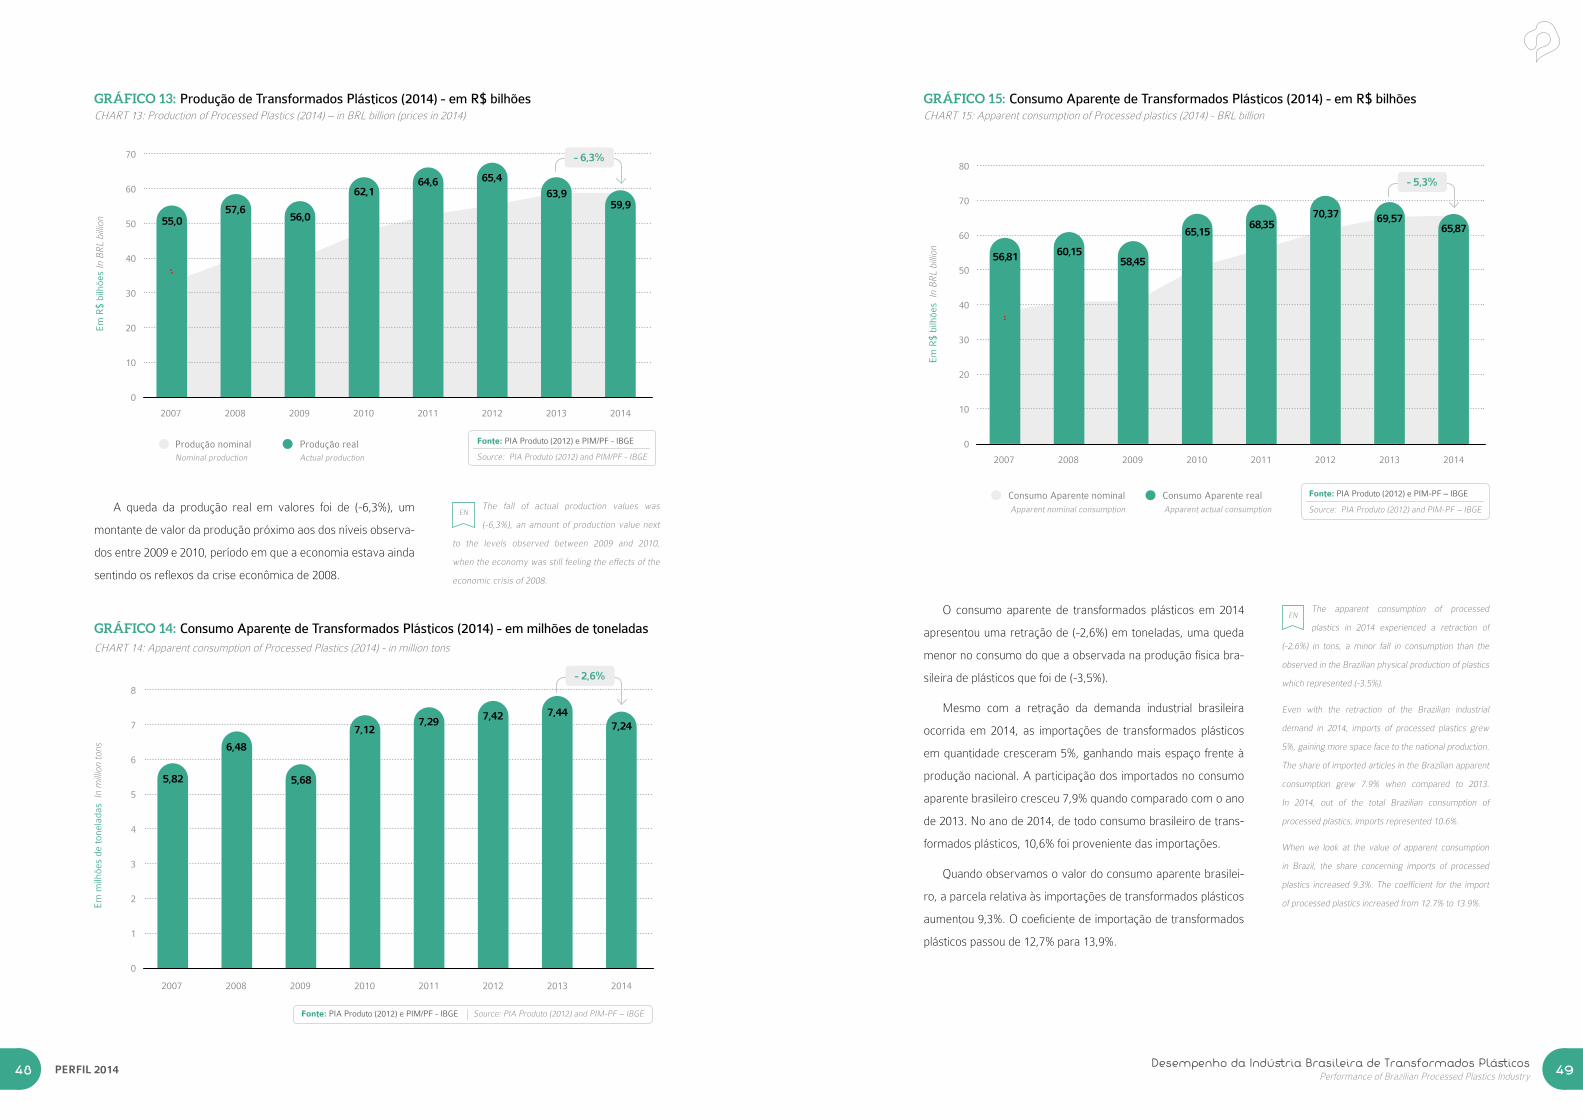
GRÁFICO 13: Produção de Transformados Plásticos (2014) - em R$ bilhõesCHART 13: Production of Processed Plastics (2014) – in BRL billion (prices in 2014)
70
60
50
40
30
20
10
0
Em
R$
bilh
ões
In B
RL
billi
on
2007 20102008 2011 2013 20142009 2012
55,057,6
56,0
62,164,6 65,4
63,959,9
Fonte: PIA Produto (2012) e PIM/PF - IBGE
Source: PIA Produto (2012) and PIM/PF - IBGE
Produção nominalNominal production
Produção realActual production
A queda da produção real em valores foi de (-6,3%), um
montante de valor da produção próximo aos dos níveis observa-
dos entre 2009 e 2010, período em que a economia estava ainda
sentindo os reflexos da crise econômica de 2008.
The fall of actual production values was
(-6,3%), an amount of production value next
to the levels observed between 2009 and 2010,
when the economy was still feeling the effects of the
economic crisis of 2008.
EN
GRÁFICO 14: Consumo Aparente de Transformados Plásticos (2014) - em milhões de toneladasCHART 14: Apparent consumption of Processed Plastics (2014) - in million tons
Em
milh
ões
de to
nela
das
In m
illio
n to
ns
8
7
6
5
4
3
2
1
0
2007 20102008 2011 2013 20142009 2012
5,82
6,48
5,68
7,127,29 7,42 7,44
7,24
Fonte: PIA Produto (2012) e PIM/PF - IBGE Source: PIA Produto (2012) and PIM-PF – IBGE
GRÁFICO 15: Consumo Aparente de Transformados Plásticos (2014) - em R$ bilhõesCHART 15: Apparent consumption of Processed plastics (2014) - BRL billion
Fonte: PIA Produto (2012) e PIM-PF – IBGE
Source: PIA Produto (2012) and PIM-PF – IBGEApparent nominal consumption Apparent actual consumption
80
70
60
50
40
30
20
10
0
Em
R$
bilh
ões
In B
RL
billi
on
2007 20102008 2011 2013 20142009 2012
56,81 60,1558,45
65,1568,35
70,37 69,5765,87
Consumo Aparente nominal Consumo Aparente real
O consumo aparente de transformados plásticos em 2014
apresentou uma retração de (-2,6%) em toneladas, uma queda
menor no consumo do que a observada na produção física bra-
sileira de plásticos que foi de (-3,5%).
Mesmo com a retração da demanda industrial brasileira
ocorrida em 2014, as importações de transformados plásticos
em quantidade cresceram 5%, ganhando mais espaço frente à
produção nacional. A participação dos importados no consumo
aparente brasileiro cresceu 7,9% quando comparado com o ano
de 2013. No ano de 2014, de todo consumo brasileiro de trans-
formados plásticos, 10,6% foi proveniente das importações.
Quando observamos o valor do consumo aparente brasilei-
ro, a parcela relativa às importações de transformados plásticos
aumentou 9,3%. O coeficiente de importação de transformados
plásticos passou de 12,7% para 13,9%.
The apparent consumption of processed
plastics in 2014 experienced a retraction of
(-2,6%) in tons, a minor fall in consumption than the
observed in the Brazilian physical production of plastics
which represented (-3.5%).
Even with the retraction of the Brazilian industrial
demand in 2014, imports of processed plastics grew
5%, gaining more space face to the national production.
The share of imported articles in the Brazilian apparent
consumption grew 7.9% when compared to 2013.
In 2014, out of the total Brazilian consumption of
processed plastics, imports represented 10.6%.
When we look at the value of apparent consumption
in Brazil, the share concerning imports of processed
plastics increased 9.3%. The coefficient for the import
of processed plastics increased from 12.7% to 13.9%.
EN
- 6,3%
- 5,3%
- 2,6%
Desempenho da Indústria Brasileira de Transformados PlásticosPerformance of Brazilian Processed Plastics Industry 51PERFIL 201450
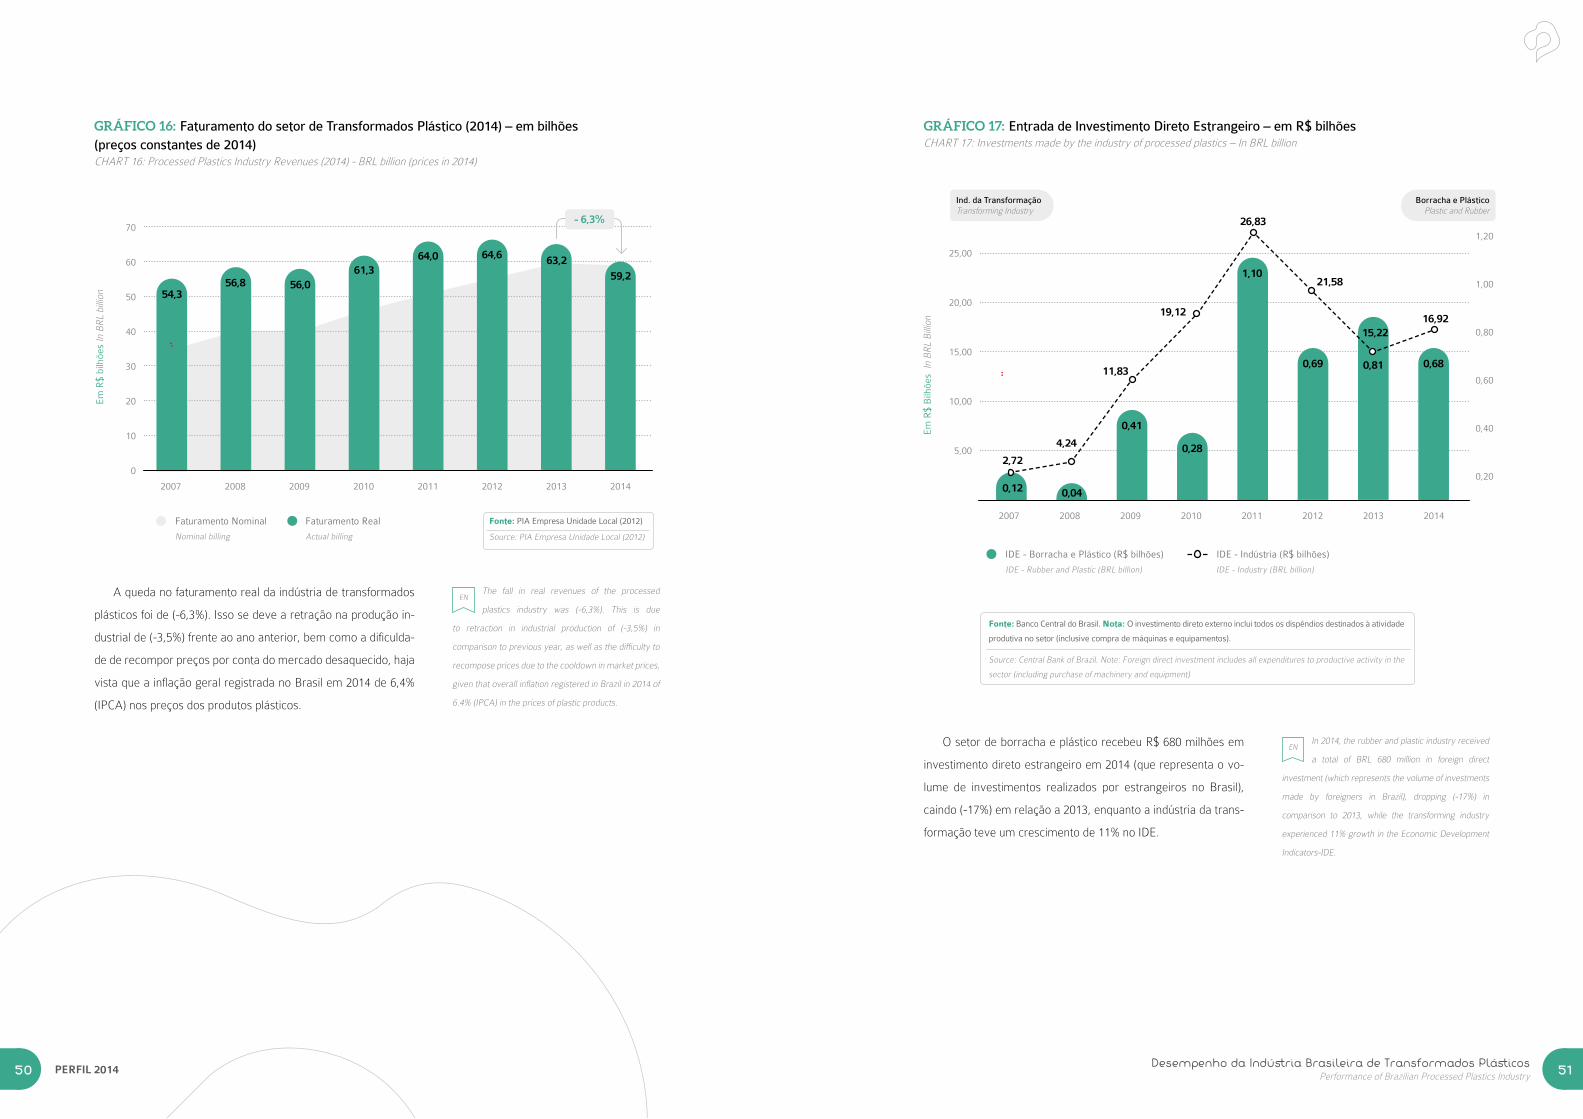
GRÁFICO 16: Faturamento do setor de Transformados Plástico (2014) – em bilhões (preços constantes de 2014)CHART 16: Processed Plastics Industry Revenues (2014) - BRL billion (prices in 2014)
70
60
50
40
30
20
10
0
Em
R$
bilh
ões
In B
RL
billi
on
Em
R$
Bilh
ões
In B
RL
Bill
ion
2007 20102008 2011 2013 20142009 2012
54,356,8 56,0
61,364,0 64,6 63,2
59,2
Fonte: PIA Empresa Unidade Local (2012)
Source: PIA Empresa Unidade Local (2012)
Faturamento Nominal Faturamento Real
A queda no faturamento real da indústria de transformados
plásticos foi de (-6,3%). Isso se deve a retração na produção in-
dustrial de (-3,5%) frente ao ano anterior, bem como a dificulda-
de de recompor preços por conta do mercado desaquecido, haja
vista que a inflação geral registrada no Brasil em 2014 de 6,4%
(IPCA) nos preços dos produtos plásticos.
The fall in real revenues of the processed
plastics industry was (-6,3%). This is due
to retraction in industrial production of (-3,5%) in
comparison to previous year, as well as the difficulty to
recompose prices due to the cooldown in market prices,
given that overall inflation registered in Brazil in 2014 of
6.4% (IPCA) in the prices of plastic products.
EN
Nominal billing Actual billing
GRÁFICO 17: Entrada de Investimento Direto Estrangeiro – em R$ bilhõesCHART 17: Investments made by the industry of processed plastics – In BRL billion
O setor de borracha e plástico recebeu R$ 680 milhões em
investimento direto estrangeiro em 2014 (que representa o vo-
lume de investimentos realizados por estrangeiros no Brasil),
caindo (-17%) em relação a 2013, enquanto a indústria da trans-
formação teve um crescimento de 11% no IDE.
In 2014, the rubber and plastic industry received
a total of BRL 680 million in foreign direct
investment (which represents the volume of investments
made by foreigners in Brazil), dropping (-17%) in
comparison to 2013, while the transforming industry
experienced 11% growth in the Economic Development
Indicators-IDE.
EN
Fonte: Banco Central do Brasil. Nota: O investimento direto externo inclui todos os dispêndios destinados à atividade
produtiva no setor (inclusive compra de máquinas e equipamentos).
Source: Central Bank of Brazil. Note: Foreign direct investment includes all expenditures to productive activity in the
sector (including purchase of machinery and equipment)
0,81
25,00
20,00
15,00
10,00
5,00
1,20
1,00
0,80
0,60
0,40
0,20
2007 20102008 2011 2013 20142009 2012
0,12 0,04
0,41
0,28
1,10
0,69 0,68
IDE - Borracha e Plástico (R$ bilhões) IDE - Indústria (R$ bilhões)
2,72
4,24
11,83
19,12
26,83
21,58
15,22 16,92
Ind. da TransformaçãoTransforming Industry
Borracha e PlásticoPlastic and Rubber
IDE - Rubber and Plastic (BRL billion) IDE - Industry (BRL billion)
- 6,3%
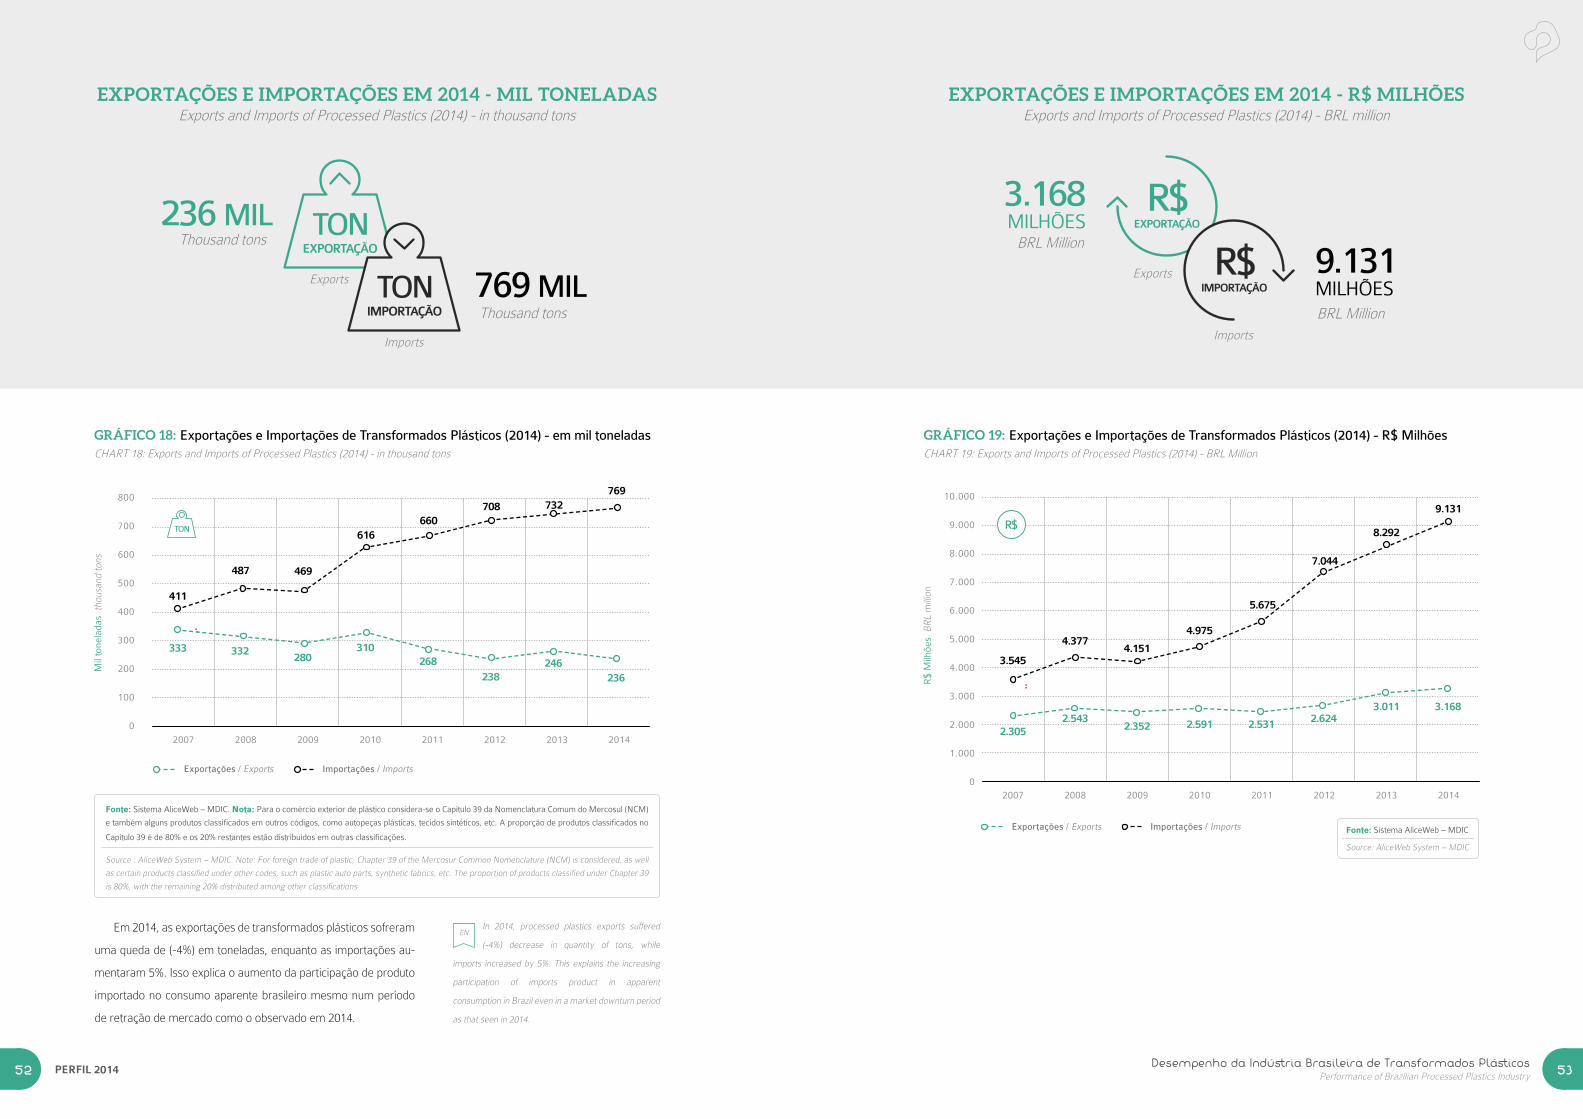
PERFIL 201452 Desempenho da Indústria Brasileira de Transformados PlásticosPerformance of Brazilian Processed Plastics Industry 53
EXPORTAÇÕES E IMPORTAÇÕES EM 2014 - MIL TONELADASExports and Imports of Processed Plastics (2014) - in thousand tons
Thousand tons
Exports Exports
ImportsImports
Thousand tons
EXPORTAÇÃOTON
R$ R$
IMPORTAÇÃO
EXPORTAÇÃO IMPORTAÇÃO
TON
US$ US$EXPORTAÇÃO IMPORTAÇÃO
236 MIL
769 MILEXPORTAÇÃOTON
R$ R$
IMPORTAÇÃO
EXPORTAÇÃO IMPORTAÇÃO
TON
US$ US$EXPORTAÇÃO IMPORTAÇÃO
GRÁFICO 18: Exportações e Importações de Transformados Plásticos (2014) - em mil toneladas CHART 18: Exports and Imports of Processed Plastics (2014) - in thousand tons
Fonte: Sistema AliceWeb – MDIC. Nota: Para o comércio exterior de plástico considera-se o Capítulo 39 da Nomenclatura Comum do Mercosul (NCM)
e também alguns produtos classificados em outros códigos, como autopeças plásticas, tecidos sintéticos, etc. A proporção de produtos classificados no
Capítulo 39 é de 80% e os 20% restantes estão distribuídos em outras classificações.
Source : AliceWeb System – MDIC. Note: For foreign trade of plastic, Chapter 39 of the Mercosur Common Nomenclature (NCM) is considered, as well
as certain products classified under other codes, such as plastic auto parts, synthetic fabrics, etc. The proportion of products classified under Chapter 39
is 80%, with the remaining 20% distributed among other classifications
Mil
tone
lada
s th
ousa
nd to
ns
800
700
600
500
400
300
200
100
0
2007 20102008 2011 2013 20142009 2012
411
487 469
616660
708 732769
333 332280
310268
238246
236
Exportações / Exports Importações / Imports
Em 2014, as exportações de transformados plásticos sofreram
uma queda de (-4%) em toneladas, enquanto as importações au-
mentaram 5%. Isso explica o aumento da participação de produto
importado no consumo aparente brasileiro mesmo num período
de retração de mercado como o observado em 2014.
In 2014, processed plastics exports suffered
(-4%) decrease in quantity of tons, while
imports increased by 5%. This explains the increasing
participation of imports product in apparent
consumption in Brazil even in a market downturn period
as that seen in 2014.
EN
R$
US$
TON
BRL Million
BRL Million
Exportações / Exports Importações / Imports
EXPORTAÇÕES E IMPORTAÇÕES EM 2014 - R$ MILHÕESExports and Imports of Processed Plastics (2014) - BRL million
EXPORTAÇÃOTON
R$ R$
IMPORTAÇÃO
EXPORTAÇÃO IMPORTAÇÃO
TON
US$ US$EXPORTAÇÃO IMPORTAÇÃO
9.131 MILHÕES
3.168MILHÕES
GRÁFICO 19: Exportações e Importações de Transformados Plásticos (2014) - R$ MilhõesCHART 19: Exports and Imports of Processed Plastics (2014) - BRL Million
3.168
9.131
R$
Milh
ões
BR
L m
illio
n
10.000
9.000
8.000
7.000
6.000
5.000
4.000
3.000
2.000
1.000
02007 20102008 2011 2013 20142009 2012
3.545
4.377 4.151
4.975
5.675
7.044
8.292
2.305 2.543 2.591 2.531 2.624
3.011
2.352
Fonte: Sistema AliceWeb – MDIC
Source: AliceWeb System – MDIC
R$
US$
TON
EXPORTAÇÃOTON
R$ R$
IMPORTAÇÃO
EXPORTAÇÃO IMPORTAÇÃO
TON
US$ US$EXPORTAÇÃO IMPORTAÇÃO
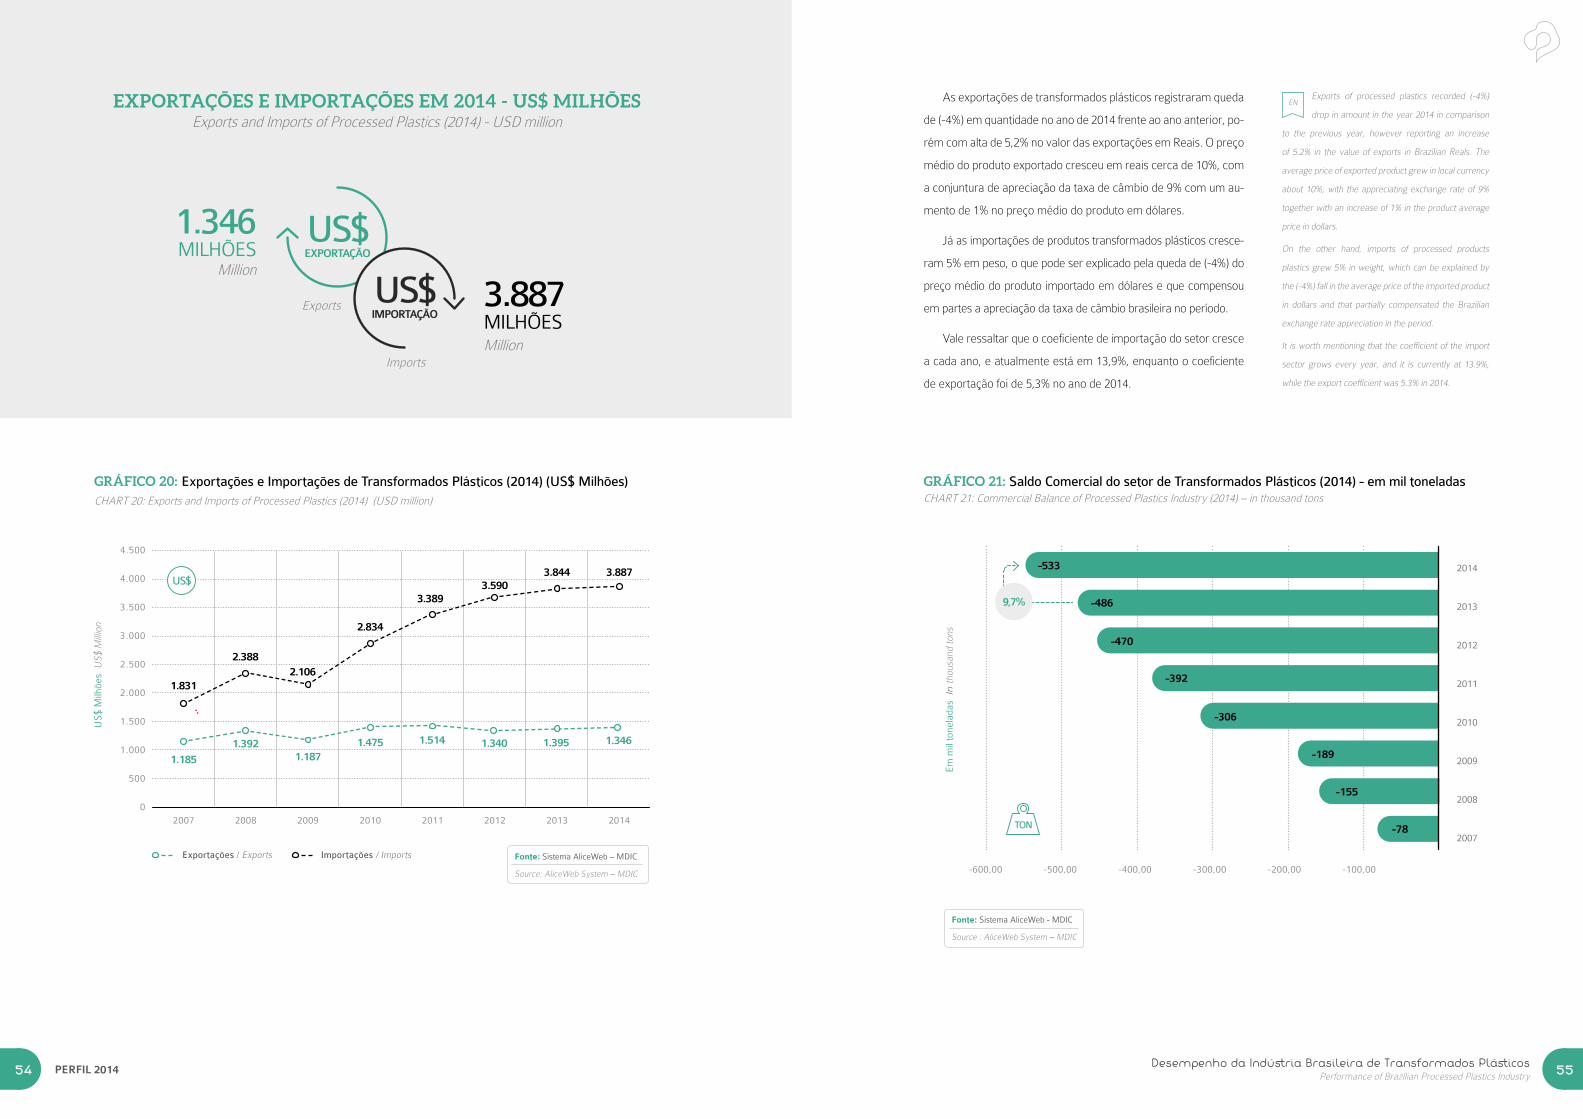
Desempenho da Indústria Brasileira de Transformados PlásticosPerformance of Brazilian Processed Plastics Industry 55PERFIL 201454
EXPORTAÇÕES E IMPORTAÇÕES EM 2014 - US$ MILHÕESExports and Imports of Processed Plastics (2014) - USD million
EXPORTAÇÃOTON
R$ R$
IMPORTAÇÃO
EXPORTAÇÃO IMPORTAÇÃO
TON
US$ US$EXPORTAÇÃO IMPORTAÇÃO
3.887MILHÕES
1.346 MILHÕES
GRÁFICO 20: Exportações e Importações de Transformados Plásticos (2014) (US$ Milhões)CHART 20: Exports and Imports of Processed Plastics (2014) (USD million)
1.831
1.185
R$
US$
TON
1.346
US
$ M
ilhõe
s U
S$
Mill
ion
4.500
4.000
3.500
3.000
2.500
2.000
1.500
1.000
500
02007 20102008 2011 2013 20142009 2012
2.388 2.106
2.834
3.389 3.590
3.844 3.887
1.3921.187
1.475 1.514 1.340 1.395
EXPORTAÇÃOTON
R$ R$
IMPORTAÇÃO
EXPORTAÇÃO IMPORTAÇÃO
TON
US$ US$EXPORTAÇÃO IMPORTAÇÃO
Million
Million
Fonte: Sistema AliceWeb – MDIC
Source: AliceWeb System – MDIC
Exportações / Exports Importações / Imports
ENAs exportações de transformados plásticos registraram queda
de (-4%) em quantidade no ano de 2014 frente ao ano anterior, po-
rém com alta de 5,2% no valor das exportações em Reais. O preço
médio do produto exportado cresceu em reais cerca de 10%, com
a conjuntura de apreciação da taxa de câmbio de 9% com um au-
mento de 1% no preço médio do produto em dólares.
Já as importações de produtos transformados plásticos cresce-
ram 5% em peso, o que pode ser explicado pela queda de (-4%) do
preço médio do produto importado em dólares e que compensou
em partes a apreciação da taxa de câmbio brasileira no período.
Vale ressaltar que o coeficiente de importação do setor cresce
a cada ano, e atualmente está em 13,9%, enquanto o coeficiente
de exportação foi de 5,3% no ano de 2014.
Exports of processed plastics recorded (-4%)
drop in amount in the year 2014 in comparison
to the previous year, however reporting an increase
of 5.2% in the value of exports in Brazilian Reals. The
average price of exported product grew in local currency
about 10%, with the appreciating exchange rate of 9%
together with an increase of 1% in the product average
price in dollars.
On the other hand, imports of processed products
plastics grew 5% in weight, which can be explained by
the (-4%) fall in the average price of the imported product
in dollars and that partially compensated the Brazilian
exchange rate appreciation in the period.
It is worth mentioning that the coefficient of the import
sector grows every year, and it is currently at 13.9%,
while the export coefficient was 5.3% in 2014.
GRÁFICO 21: Saldo Comercial do setor de Transformados Plásticos (2014) - em mil toneladasCHART 21: Commercial Balance of Processed Plastics Industry (2014) – in thousand tons
R$
US$
TON
-600,00 -300,00-500,00 -200,00-400,00 -100,00
2014
2013
2012
2011
2010
2009
2008
2007
Em
mil
tone
lada
s In
thou
sand
tons
-533
-486
-470
-392
-306
-189
-155
-78
9,7%
Fonte: Sistema AliceWeb - MDIC
Source : AliceWeb System – MDIC
Exports
Imports
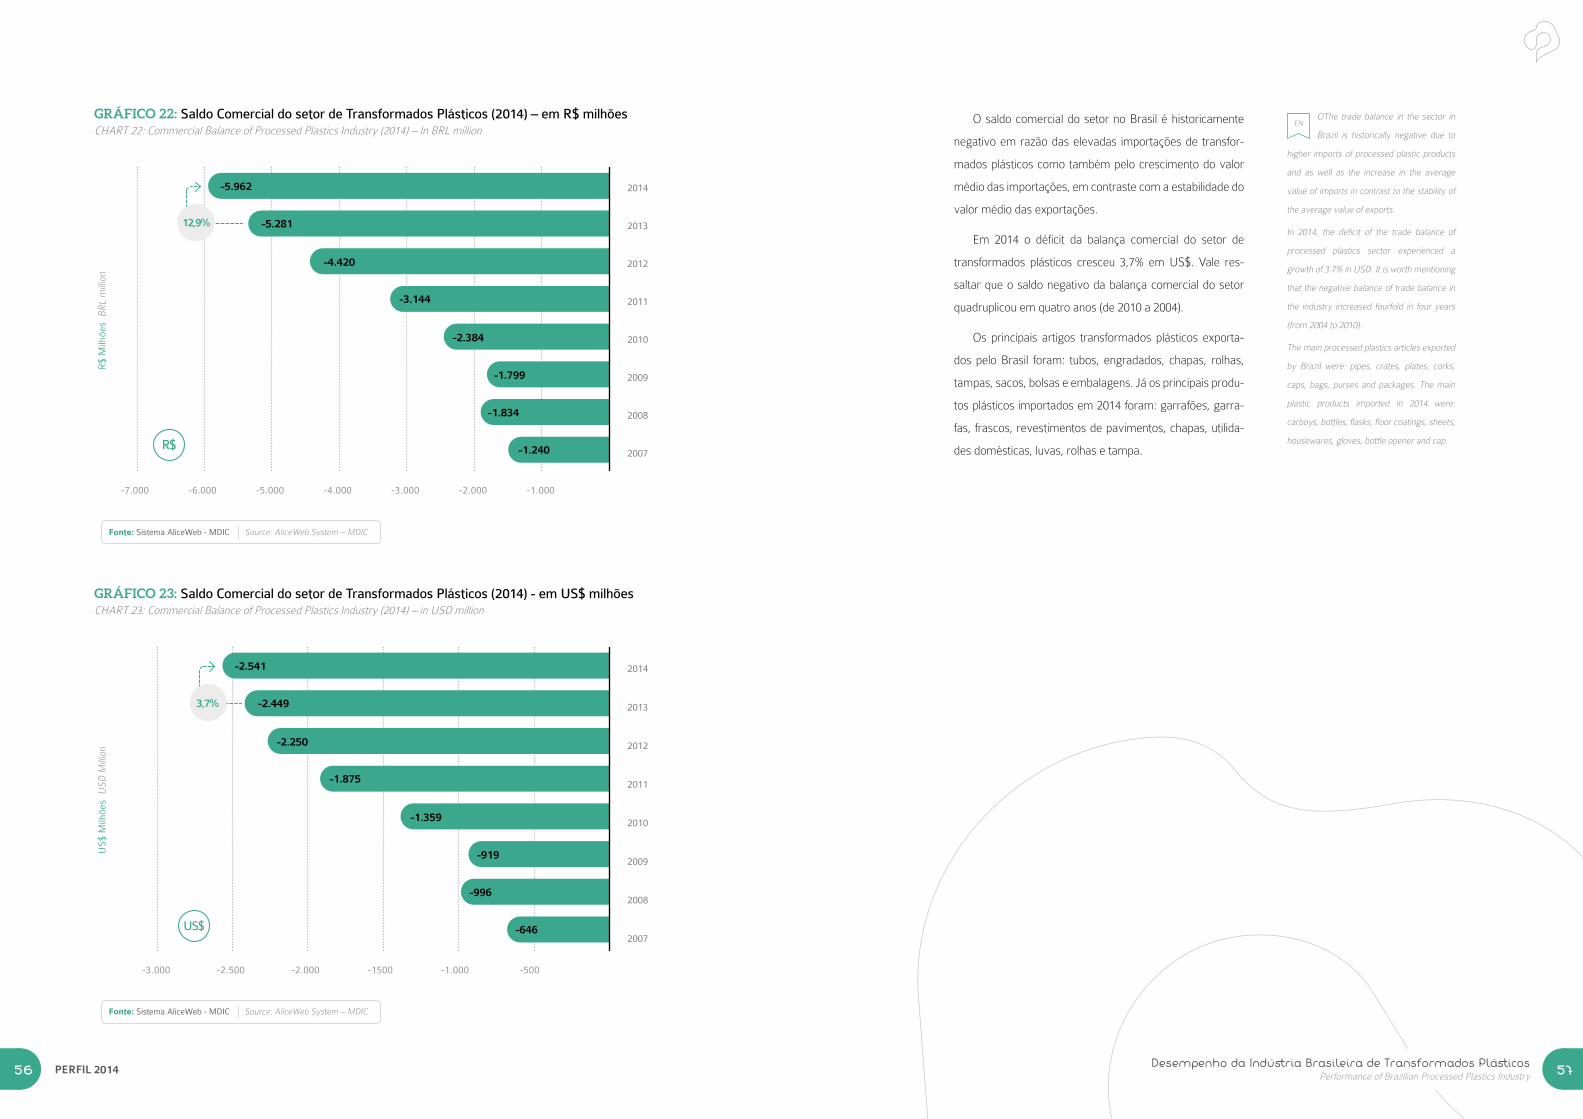
PERFIL 201456
-6.000-7.000 -3.000-5.000 -2.000-4.000 -1.000
GRÁFICO 22: Saldo Comercial do setor de Transformados Plásticos (2014) – em R$ milhõesCHART 22: Commercial Balance of Processed Plastics Industry (2014) – In BRL million
2014
2013
2012
2011
2010
2009
2008
2007
R$
Milh
ões
BR
L m
illio
n
-5.962
-5.281
-4.420
-3.144
-2.384
-1.799
-1.834
-1.240R$
US$
TON
Fonte: Sistema AliceWeb - MDIC Source: AliceWeb System – MDIC
-3.000 -1500-2.500 -1.000-2.000 -500
GRÁFICO 23: Saldo Comercial do setor de Transformados Plásticos (2014) - em US$ milhõesCHART 23: Commercial Balance of Processed Plastics Industry (2014) – in USD million
2014
2013
2012
2011
2010
2009
2008
2007
US
$ M
ilhõe
s U
SD
Mill
ion
-2.541
-2.449
-2.250
-1.875
-1.359
-919
-996
-646
R$
US$
TON
Fonte: Sistema AliceWeb - MDIC Source: AliceWeb System – MDIC
O saldo comercial do setor no Brasil é historicamente
negativo em razão das elevadas importações de transfor-
mados plásticos como também pelo crescimento do valor
médio das importações, em contraste com a estabilidade do
valor médio das exportações.
Em 2014 o déficit da balança comercial do setor de
transformados plásticos cresceu 3,7% em US$. Vale res-
saltar que o saldo negativo da balança comercial do setor
quadruplicou em quatro anos (de 2010 a 2004).
Os principais artigos transformados plásticos exporta-
dos pelo Brasil foram: tubos, engradados, chapas, rolhas,
tampas, sacos, bolsas e embalagens. Já os principais produ-
tos plásticos importados em 2014 foram: garrafões, garra-
fas, frascos, revestimentos de pavimentos, chapas, utilida-
des domésticas, luvas, rolhas e tampa.
OThe trade balance in the sector in
Brazil is historically negative due to
higher imports of processed plastic products
and as well as the increase in the average
value of imports in contrast to the stability of
the average value of exports.
In 2014, the deficit of the trade balance of
processed plastics sector experienced a
growth of 3.7% in USD. It is worth mentioning
that the negative balance of trade balance in
the industry increased fourfold in four years
(from 2004 to 2010).
The main processed plastics articles exported
by Brazil were: pipes, crates, plates, corks,
caps, bags, purses and packages. The main
plastic products imported in 2014 were:
carboys, bottles, flasks, floor coatings, sheets,
housewares, gloves, bottle opener and cap.
EN
12,9%
3,7%
Desempenho da Indústria Brasileira de Transformados PlásticosPerformance of Brazilian Processed Plastics Industry 57
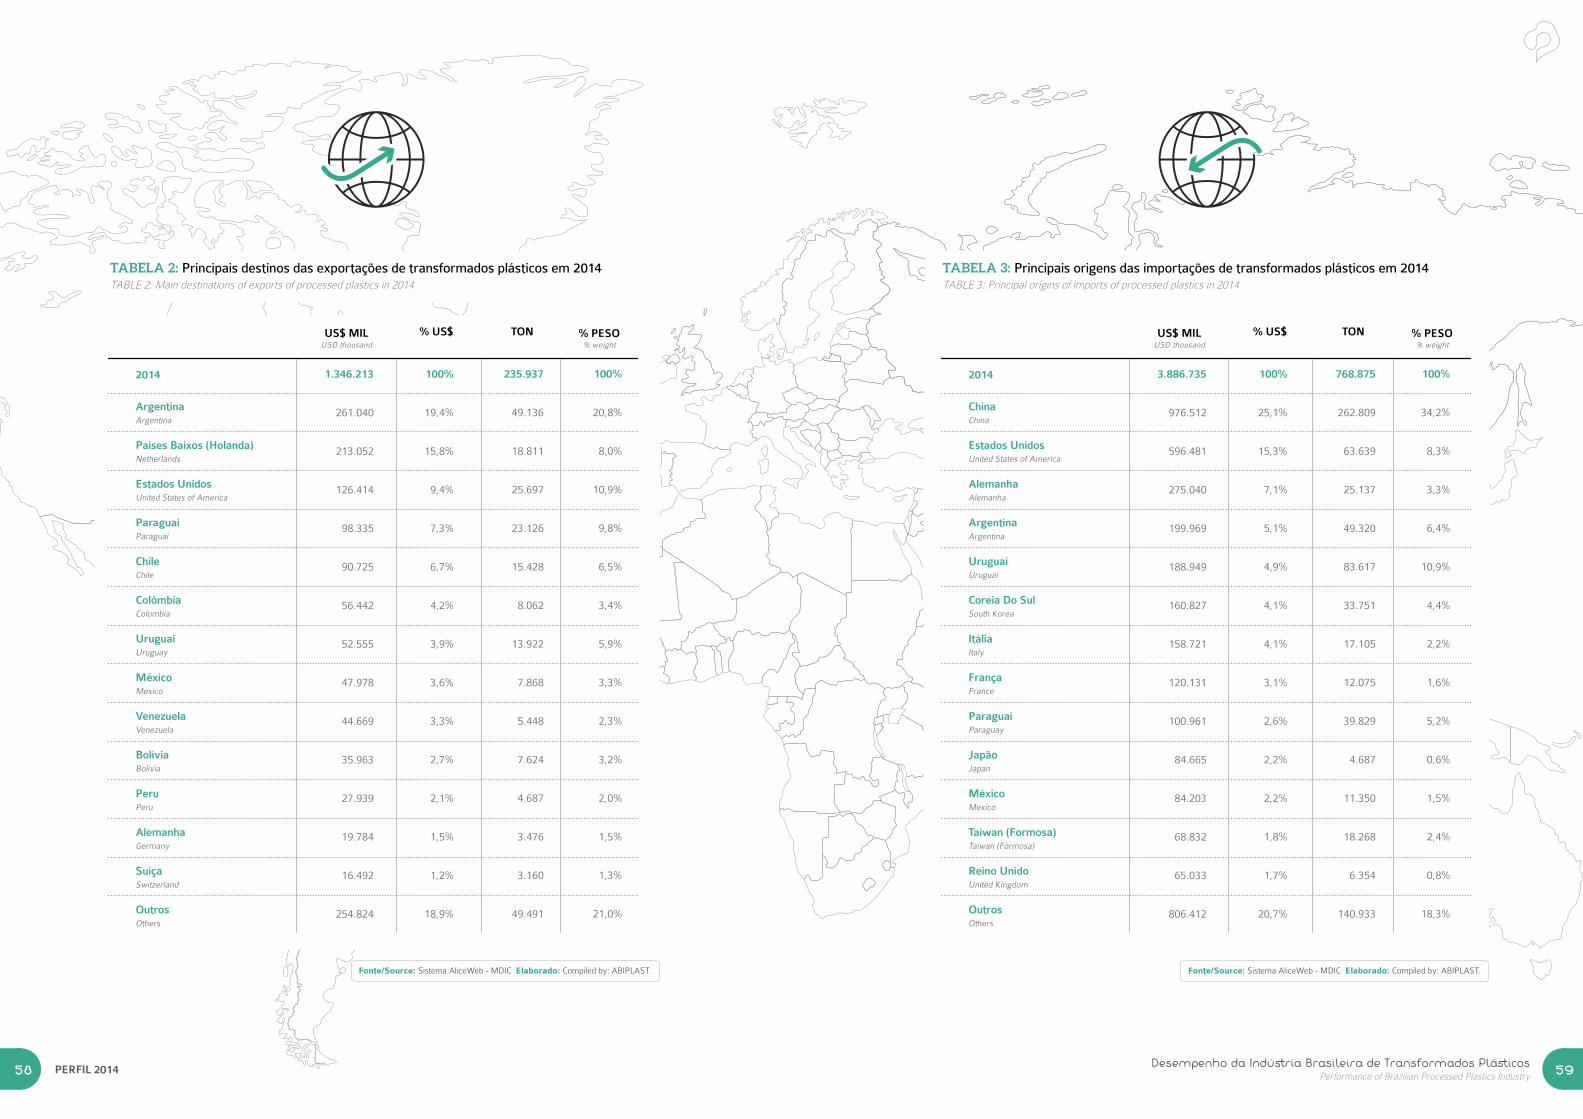
Desempenho da Indústria Brasileira de Transformados PlásticosPerformance of Brazilian Processed Plastics Industry 59PERFIL 201458
Fonte/Source: Sistema AliceWeb - MDIC Elaborado: Compiled by: ABIPLAST.
1.346.213
261.040
213.052
126.414
98.335
90.725
56.442
52.555
47.978
44.669
35.963
27.939
19.784
16.492
254.824
100%
19,4%
15,8%
9,4%
7,3%
6,7%
4,2%
3,9%
3,6%
3,3%
2,7%
2,1%
1,5%
1,2%
18,9%
235.937
49.136
18.811
25.697
23.126
15.428
8.062
13.922
7.868
5.448
7.624
4.687
3.476
3.160
49.491
100%
20,8%
8,0%
10,9%
9,8%
6,5%
3,4%
5,9%
3,3%
2,3%
3,2%
2,0%
1,5%
1,3%
21,0%
US$ MILUSD thousand
% US$ TON % PESO% weight
2014
ArgentinaArgentina
Países Baixos (Holanda)Netherlands
Estados UnidosUnited States of America
ParaguaiParaguai
ChileChile
ColômbiaColombia
UruguaiUruguay
MéxicoMexico
VenezuelaVenezuela
BolíviaBolivia
PeruPeru
AlemanhaGermany
SuíçaSwitzerland
OutrosOthers
TABELA 2: Principais destinos das exportações de transformados plásticos em 2014TABLE 2: Main destinations of exports of processed plastics in 2014
3.886.735
976.512
596.481
275.040
199.969
188.949
160.827
158.721
120.131
100.961
84.665
84.203
68.832
65.033
806.412
100%
25,1%
15,3%
7,1%
5,1%
4,9%
4,1%
4,1%
3,1%
2,6%
2,2%
2,2%
1,8%
1,7%
20,7%
768.875
262.809
63.639
25.137
49.320
83.617
33.751
17.105
12.075
39.829
4.687
11.350
18.268
6.354
140.933
100%
34,2%
8,3%
3,3%
6,4%
10,9%
4,4%
2,2%
1,6%
5,2%
0,6%
1,5%
2,4%
0,8%
18,3%
US$ MILUSD thousand
% US$ TON % PESO% weight
2014
ChinaChina
Estados UnidosUnited States of America
AlemanhaAlemanha
ArgentinaArgentina
UruguaiUruguai
Coreia Do SulSouth Korea
ItáliaItaly
FrançaFrance
ParaguaiParaguay
JapãoJapan
MéxicoMexico
Taiwan (Formosa)Taiwan (Formosa)
Reino UnidoUnited Kingdom
OutrosOthers
TABELA 3: Principais origens das importações de transformados plásticos em 2014TABLE 3: Principal origins of imports of processed plastics in 2014
Fonte/Source: Sistema AliceWeb - MDIC Elaborado: Compiled by: ABIPLAST.
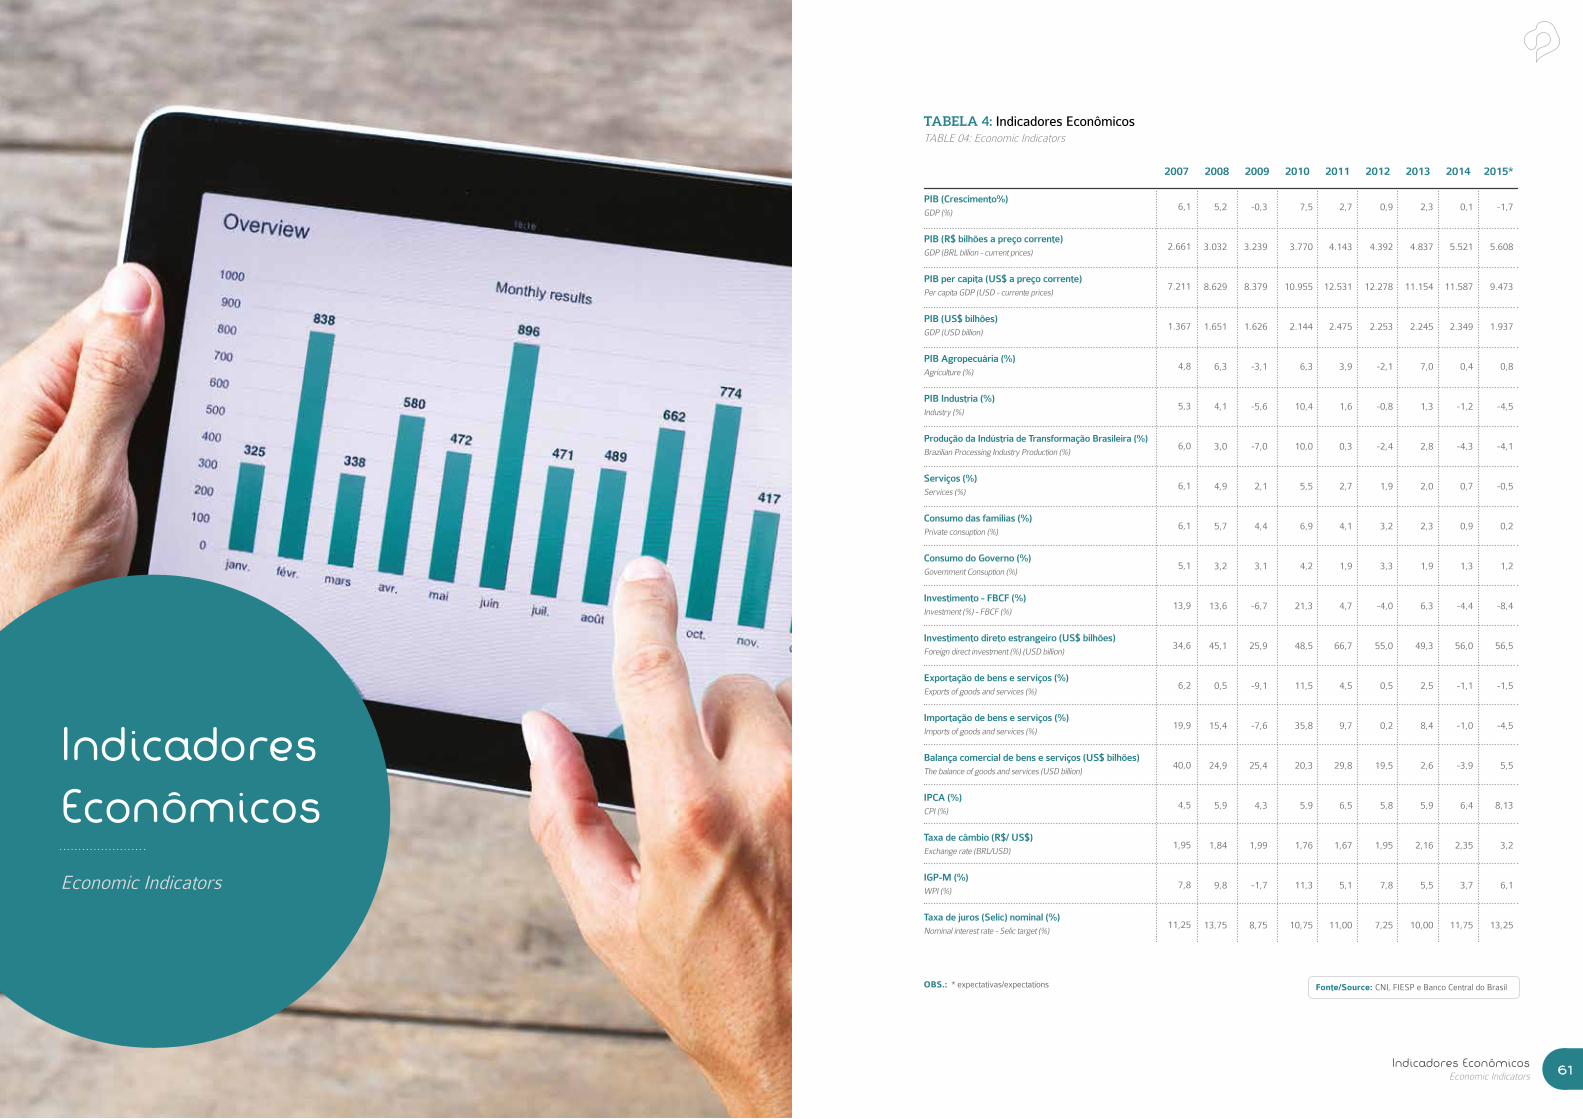
PERFIL 2014 Indicadores EconômicosEconomic Indicators 6160
IndicadoresEconômicosEconomic Indicators
PIB (Crescimento%)GDP (%)
PIB (R$ bilhões a preço corrente)GDP (BRL billion - current prices)
PIB per capita (US$ a preço corrente)Per capita GDP (USD - currente prices)
PIB (US$ bilhões)GDP (USD billion)
PIB Agropecuária (%)Agriculture (%)
PIB Industria (%)Industry (%)
Produção da Indústria de Transformação Brasileira (%)Brazilian Processing Industry Production (%)
Serviços (%)Services (%)
Consumo das famílias (%)Private consuption (%)
Consumo do Governo (%)Government Consuption (%)
Investimento - FBCF (%)Investment (%) - FBCF (%)
Investimento direto estrangeiro (US$ bilhões)Foreign direct investment (%) (USD billion)
Exportação de bens e serviços (%)Exports of goods and services (%)
Importação de bens e serviços (%)Imports of goods and services (%)
Balança comercial de bens e serviços (US$ bilhões)The balance of goods and services (USD billion)
IPCA (%)CPI (%)
Taxa de câmbio (R$/ US$)Exchange rate (BRL/USD)
IGP-M (%)WPI (%)
Taxa de juros (Selic) nominal (%)Nominal interest rate - Selic target (%)
6,1
2.661
7.211
1.367
4,8
5,3
6,0
6,1
6,1
5,1
13,9
34,6
6,2
19,9
40,0
4,5
1,95
7,8
11,25
5,2
3.032
8.629
1.651
6,3
4,1
3,0
4,9
5,7
3,2
13,6
45,1
0,5
15,4
24,9
5,9
1,84
9,8
13,75
-0,3
3.239
8.379
1.626
-3,1
-5,6
-7,0
2,1
4,4
3,1
-6,7
25,9
-9,1
-7,6
25,4
4,3
1,99
-1,7
8,75
7,5
3.770
10.955
2.144
6,3
10,4
10,0
5,5
6,9
4,2
21,3
48,5
11,5
35,8
20,3
5,9
1,76
11,3
10,75
2,7
4.143
12.531
2.475
3,9
1,6
0,3
2,7
4,1
1,9
4,7
66,7
4,5
9,7
29,8
6,5
1,67
5,1
11,00
0,9
4.392
12.278
2.253
-2,1
-0,8
-2,4
1,9
3,2
3,3
-4,0
55,0
0,5
0,2
19,5
5,8
1,95
7,8
7,25
2,3
4.837
11.154
2.245
7,0
1,3
2,8
2,0
2,3
1,9
6,3
49,3
2,5
8,4
2,6
5,9
2,16
5,5
10,00
0,1
5.521
11.587
2.349
0,4
-1,2
-4,3
0,7
0,9
1,3
-4,4
56,0
-1,1
-1,0
-3,9
6,4
2,35
3,7
11,75
-1,7
5.608
9.473
1.937
0,8
-4,5
-4,1
-0,5
0,2
1,2
-8,4
56,5
-1,5
-4,5
5,5
8,13
3,2
6,1
13,25
2007 2008 2009 2010 2011 2012 2013 2014 2015*
Fonte/Source: CNI, FIESP e Banco Central do BrasilOBS.: * expectativas/expectations
TABELA 4: Indicadores EconômicosTABLE 04: Economic Indicators
Entidades e Sindicatos AssociadosAffiliated Entities and Unions 63
Entidadese Sindicatos Associados
Affiliated Entities
and Unions
ASSOCIADAS
ABIEF – Associação Brasileira da Indústria de Embalagens Plásticas Flexíveis
Av. Paulista , 2439 – 8º andar - Cerqueira César
01311-936 – São Paulo- SP
Tel: (11) 3032-4092 – Fax:(11) 3032-2021
Site. www.abief.com.br // E-mail: [email protected]
Presidente: Herman Brian Elias de Moura
ABRAPLA - Associação Brasileira Indústria de Laminados Plásticos e Espumas Flexíveis
Av. Valdemar de Carlos Pereira, 133 - sala 01 - Vila Matilde
03533-000 - São Paulo - SP
Tel: (11) 98161-6173
Site: www.abrapla.com // E-mail: [email protected]
Presidente: Toshio Nakabayashi
ABR - Associação Brasileira da Rotomoldagem
Av. Francisco Monteiro, 1220
09406-300 Ribeirão Pires - SP
Tel.: (11) 4823-6200
Site: www.abr-rotomoldagem.com.br // E-mail: [email protected]
Presidente: Américo Del Corto Júnior
INSTITUTOS
INP- Instituto Nacional do Plástico
Av. Chedid Jafet, 222 Bloco C – 4º andar
04551-065 – São Paulo- SP
Tel: (11) 2148-4757 – Fax( 11) 2148-4757
Site: www.inp.org.br // E-mail: [email protected]
Presidente : José Ricardo Roriz Coelho
ASSOCIAÇÕES DO SETOR PLÁSTICOAffiliated entities of plastic industry
PERFIL 2014 Entidades e Sindicatos AssociadosAffiliated Entities and Unions 6564
SINDICATOS ESTADUAIS DO SETOR PLÁSTICOState Unions of the plastic industry
ALAGOAS (AL)
SINPLAST/AL - Sindicato das Indústrias de Plásticos e Tintas do Estado de Alagoas
Av. Fernandes Lima, 385 - 5º andar
57055-902 - Maceió-AL
Tel.: (82) 2121-6985 - Fax.: (82) 2121-3011
Site: www.sindicatodaindustria.com.br/sindiplastal // E-mail:[email protected]
Presidente: Gilvan Severiano Leite
AMAZONAS (AM)
SIMPLAST - Sindicato das Indústrias de Material Plástico de Manaus
Av. Fábio Lucena , 1460 – Cj 31 de março - Japiim II
69076-800 – Manaus – AM
Tel: (92) 3237-3817
Site: www.sindicatodaindustria.com.br/simplastam // E-mail:[email protected] ou [email protected]
Presidente: Celso Zildes
BAHIA (BA)
SINDIPLASBA - Sindicato da Indústria de Material Plástico do Estado da Bahia
Av. Santos Dumont S/N - Shopping Estrada do Côco , 4º andar, sala 435
42700-000 – Salvador -BA
Tel: (71) 3379-8066 Fax: (71) 3342-2161
Site: www.sindiplasba.org.br // E-mail: [email protected]
Presidente: Luiz Antonio de Oliveira
ESPÍRITO SANTO (ES)
SINDIPLASTES – Sindicato da Indústria de Material Plástico do Espírito Santo
Av. Nossa Senhora da Penha, 2053, 3º andar - Santa Lúcia
29056-913 - Vitória – ES
Tel: (27) 3334-5922 Fax:(27) 3325-1833
Site: www.sindiplastes.org.br // E-mail: [email protected]
Presidente : Neviton Helmer Gasparini
GOIÁS (GO)
SIMPLAGO- Sindicato das Indústrias de Material Plástico no Estado de Goiás
Av. Anhanguera , 5440 – 4º andar – Sala 402
74043-010 – Goiânia – GO
Tel: (62) 3224-5405 Fax: (62) 3224-5405
Site: sindicatodaindustria.com.br/simplago // E-mail: [email protected]
Presidente: Olympio José Abrão
MINAS GERAIS (MG)
SIMPLAST - Sindicato da Indústria do Material do Plástico do Estado de Minas Gerais
Av.Contorno, 4480 – 15º andar – cj 1504/1505
30110-028 - Belo Horizonte – MG
Tel: (31) 3223-2948 Fax: (31) 3223- 0430
Site: wwww.simplast.com.br // E-mail: [email protected]
Presidente: Sabrina Rodrigues de Carvalho
PARAÍBA (PB)
SINDIPLAST/PB - Sindicato da Indústria de Material Plástico e Resinas Sintéticas do Estado da Paraíba
Av. Assis Chateaubriand, 919
58414-060 – Campina Grande – PB
Tel: (83) 3331-5566 / (83) 2101-5322 / (83) 8754-6318
Site: www.sindicatodaindustria.com.br/sindiplastpb // E-mail: [email protected]
Presidente: Péricles Felinto de Araújo
Contatos para assuntos gerais: Alexandre Menezes
PARANÁ (PR)
SIMPEP - Sindicato da Indústria de Material Plástico no Estado do Paraná
R. João Negrão, 731 – 3º andar- conjunto 301
80010-200 – Curitiba – PR
Tel: (41) 3224-9163 Fax: (41) 3222-4551
Site: www.simpep.com.br // E-mail: [email protected]
Presidente: Denise Dybas Dias
SIMPLAS NP- Sindicato da Indústria de Material Plástico do Norte do Paraná
R. Pernambuco, 390 – 12º andar - sala 1208
86020-913 - Londrina -PR
Tel: (43) 3337-1390 fax : (43) 3337-1390
Site: wwww.simplasnp.com.br // E-mail: [email protected]
Presidente: Sueli de Souza Baptisaco
PERNAMBUCO (PE)
SIMPEPE - Sindicato da Indústria de Material Plástico do Estado de Pernambuco
R. Cruz Cabuga , 767 – 5º andar
50040-000 Recife- PE
Tel: (81) 3412-8527 Fax: (81) 3412- 8405
Site: www.sindicatodaindustria.com.br/simpepe // E-mail: [email protected]
Presidente : Walter Câmara
PERFIL 2014 Entidades e Sindicatos AssociadosAffiliated Entities and Unions 6766
RIO DE JANEIRO (RJ)
SIMPERJ - Sindicato da Indústria de Material Plástico do Estado do Rio de Janeiro
R. Santa Luzia, 776 – Sala 203 - Centro
20030-040 – Rio de Janeiro – RJ
Tel: (21) 2220-9726 Fax: (21) 2220-9726
Site: www.simperj.org.br // E-mail: [email protected]
Presidente: José da Rocha Pinto
RIO GRANDE DO NORTE (RN)
SINDIPLAST/RN - Sindicato da Indústria de Material e Laminados Plásticos do Estado do Rio Grande do Norte
Av. Senador Duarte Filho, 2.860 - 1º andar - Lagoa Nova
59075-900 - Natal/RN
Tel.: (84) 3204-6332 / (84) 3272-2220 / (84) 9982-0830
E-mail: [email protected] // [email protected]
Presidente: Maria da Conceição Rebouças Duarte Tavares
RIO GRANDE DO SUL (RS)
SIMPLÁS - Sindicato das Indústrias de Materiais Plásticos do Nordeste Gaúcho
R. Ítalo Victor Bersani , 1134
95050-520 – Caxias do Sul – RS
Tel: (54) 3228-2422 Fax: (54) 3228-2090
Site: www.simplas.com.br // E-mail: [email protected]
Presidente: Jaime Lorandi
SINPLAST - Sindicato das Indústrias de Material Plástico no Estado do Rio Grande do Sul
Av. Assis Brasil, 8787 – Sarandi
91140-001- Porto Alegre- RS
Tel: (51) 3364-4503 Fax: (51) 3364-4503
Site: www.sinplast.org.br // E-mail: [email protected]
Presidente: Edilson Luiz Deitos
SIMPLAVI - Sindicato das Indústrias de Material Plástico do Vale dos Vinhedos
Alameda Fenavinho, 481 - Fenavinho
95700-000 - Bento Gonçalves/RS
Tel.: (54) 3454-5734
E-mail: [email protected] // [email protected]
Presidente: Ivânio Ângelo Arioli
SANTA CATARINA (SC)
SIAPB – Sindicato das Indústrias de Artefatos Plásticos e Brinquedos de Blumenau
Rua Frei Estanislau Schaette, 111 - Sala 07
89037-001- Blumenau – SC
Tel: (47) 3329-1855 Fax: (47) 3329-0535
Site: www.siapb.com.br // E-mail: [email protected]
Presidente: Rubens Giese
SIMPESC – Sindicato da Indústria de Material Plástico no Estado de Santa Catarina
R. Abdon Batista , 121 - 13º andar – cj 1301/1302
89201-010 – Joinville – SC
Tel: (47) 3433-2351 Fax: (47) 3433- 5749
Site: www.simpesc.org.br // E-mail: [email protected]
Presidente: Albano Schmidt
SINDESC - Sindicato das Indústrias dos Descartáveis Plásticos do Estado de Santa Catarina
R. Desembargador Pedro Silva, 540 - 7º andar- sala 702
88802-300 – Criciuma- SC
Tel.: (48) 3433-7420 - Fax.: (48) 3433-9083
E-mail:[email protected]
Presidente: Anselmo Freitas
SINPLASC - Sindicato das Indústrias Plásticas do Sul Catarinense
R. Ernesto Biachini Góes, 91 - Próspera - Edifício Centro Empresarial de Criciúma
88815-030- Criciúma – SC
Tel: (48) 3461-0933 // (41) 3461-0902
Site: sinplasccriciuma.com.br // E-mail: [email protected]
Presidente:Reginaldo José Cechinel
SINDIPLASC - Sindicato das Indústrias do Material Plástico e Artefato de Borracha do Oeste Catarinense
Av. Getúlio Vargas, 150 - N - Centro
89801-000 - Chapecó/SC
Tel: (49) 3328-9700
Site: www.sindiplasc.com.br // E-mail: [email protected]
Presidente: Djalma Velho de Azevedo
SÃO PAULO (SP)
SINDIPLAST - Sindicato da Indústria de Material Plástico, Transformação e Reciclagem
de Material Plástico do Estado de São Paulo
Av. Paulista, 2.439 - 8º andar - Cerqueira César
01311-936 São Paulo - SP
Tel: (11) 3060-9688 Fax: (11) 3060-9686
Site: www.sindiplast.org.br // E-mail: [email protected]
Presidente: José Ricardo Roriz Coelho
69PERFIL 201468
Abip
last
201
0 / 2
015 Presidente José Ricardo Roriz Coelho
President
1ª Vice-Presidente Alberto GeronimiVice-President
1º Secretário Rogério ManiSecretary
2º Secretário Aurélio de PaulaSecretary
1º Tesoureiro Tsutomu Nakabayashi Secretary
Conselheiro Hagop GuerekmezianCounselor Alfredo Schmitt
Miguel Rosário
Suplente Eli KatanAlternate Dirceu Galléas
Sérgio Wajsbrot
Ricardo Vívolo
Conselheiro Marcelo Coccoza FelipeCounselor Ioannis Panagiotis Bethanis
Ricardo Hajaj
Diretor Peter Reiter
Director Mario Schilckman
Valter Biaggi Bombonato
Diretor Davide BottonDirector Sérgio Rogério de Castro Filho
Nabil Hanna
Reginaldo Melão
Diretor Superintendente Paulo Henrique Rangel TeixeiraSuperintendent-Director
Equipe Técnica Antonio Orlando Kumagai JuniorTechnical team Gabriela Silva
Júlio César da Silva Ferreira
Marcos Ferreira do Nascimento
Natalia Mielczarek
Paula Pariz
Simone Carvalho Levorato Fraga
Suzete Martucci Gabos Naal
Tathiane Perego da Silveira
Estagiários Queli Fernandes CostaInterns Cinthia Kariny Moreira
Apoio Eliane Pereira da SilvaSupport Paulo Sercundes da Silva
Teresinha Vera Torres
Consultores Eduardo Berkovitz
Consultants Francisco Salazar
Gilmar do Amaral
CONSELHO DEADMINISTRAÇÃO Board of Directors
CONSELHO FISCAL
Fiscal council
DIRETORIA PLENA Full Executive Board
EQUIPETeam
Anotações:
PERFIL 201470
Anotações:
Elaboração:
Av. Paulista, 2439 | 8° andar | 01311-936
São Paulo | SP | Brasil | 55 11 3060.9688
www.abiplast.org.br | [email protected]
facebook.com/abiplast | twitter.com/abiplast_abi
PERFIL
Indústria Brasileira
de Transformação
de Material Plástico
Brazilian Plastic Processed Industry