Embed Size (px)
Citation preview

Supporting Information file
Title: Nature of rational collective decision-makings by simple yes/no decision units.
Authors: Eisuke Hasegawa1*, Nobuaki Mizumoto2, Kazuya Kobayashi2†, Shigeto Dobata2, Jin Yoshimura3,4,5, Saori Watanabe1,
Yuuka Murakami6, Kenji Matsuura2
1 Laboratory of Animal Ecology, Department of Ecology and Systematics, Graduate School of Agriculture, Hokkaido University.
Sapporo 060-8589, Japan.
2 Laboratory of Insect Ecology, Graduate School of Agriculture, Kyoto University, Kyoto 606-8502, Japan.
3 Graduate School of Science and Technology and Department of Mathematical and Systems Engineering, Shizuoka University,
3-5-1 Johoku, Naka-ku, Hamamatsu 432-8561, Japan.
4 Marine Biosystems Research Center, Chiba University, Uchiura, Kamogawa, Chiba 299-5502, Japan.
5 Department of Environmental and Forest Biology, State University of New York College of Environmental Science and
Forestry, Syracuse, NY13210 USA.
6 Graduate School of Medicine, Department of Neuropharmacology, Hokkaido University. Sapporo 060-8638, Japan.
† Present Address: Hokkaido Forest Research Station, Field Science Education and Research Center, Kyoto University. 553
Tawa, Shibecha-cho, Kawakami-gun, Hokkaido 088-2339, Japan.
*Correspondence author:Eisuke HasegawaLaboratory of Animal Ecology, Department of Ecology and Systematics, Graduate School of Agriculture, Hokkaido University.
Sapporo 060-8589, Japan.e-mail:[email protected]: +81-11-706-3690
Fax:+81-11-706-2495

Figure S1Simulation results with additional factors for collective choice among multiple options (n = 10). The simulated condition is the same with Figure 2a. (a) The effect of assessment error on the proportion of correct choice. The assessment error ε was incorporated by adding small noise sampled from normal distribution (με = 0, σε = 0.1). (b) The effect of additional rule implemented to solve the problem of deadlock, that is, a collective decision maker cannot choose one since more than one options acquired the same largest number of "yes." Here we considered a random choice from these options with the same largest number of "yes.” Note that the overall proportion of correct choice was improved.

# Simulation codes:
# Nature of collective decision-making by simple yes/no decision units.# Eisuke Hasegawa*, Nobuaki Mizumoto, Kazuya Kobayashi, Shigeto Dobata, Jin Yoshimura, Saori Watanabe, Yuuka Murakami, Kenji Matsuura.# * Corresponding authors: Eisuke Hasegawa ([email protected])# Source code for R (version. 3.1.2)
### notations# obj.value : values of options# Thresholds : thresholds of units# n.units : the number of units allocated to a single option (n)# n.option : the number of options (m)# myu.units = μh : mean of the distribution of thresholds# sigma.units = σh : standard deviation of the distribution of thresholds# myu.option = μx : mean of the distribution of values# sigma.option = σx : standard deviation of the distribution of values# param : number of partition in the range of focused parameters# repeat.num : the number of replication for a single parameter set# sig.m = σm : standard deviation of the numbers of units allocated to a single option# answer : count the number of units that show "yes" response for each the option# Quorum = quorum(Q) :
### Basic model using Majority rulemultchoice <- function(n.units, n.option, myu.units, sigma.units, myu.option, sigma.option){ obj.value <- rnorm(n.option, myu.option, sigma.option) # set the quality values of options from normal distribution (n, mean, sigma) obj.value <- obj.value[order(obj.value)] # reordered Thresholds <- matrix(rnorm(n.units * n.option, myu.units, sigma.units), ncol=n.units) # set the response thresholds of units answer <- apply((Thresholds < obj.value),1,sum) # count the number of units that show "yes" response for each the option return(as.numeric(sum(answer[1:(n.option-1)] < answer[n.option]) == (n.option -1))) # judge whether the decision maker chooses the optimal option (success: 1, fail: 0) #we define the success as the optimal option get the largest number of "yes" response (see model section)}
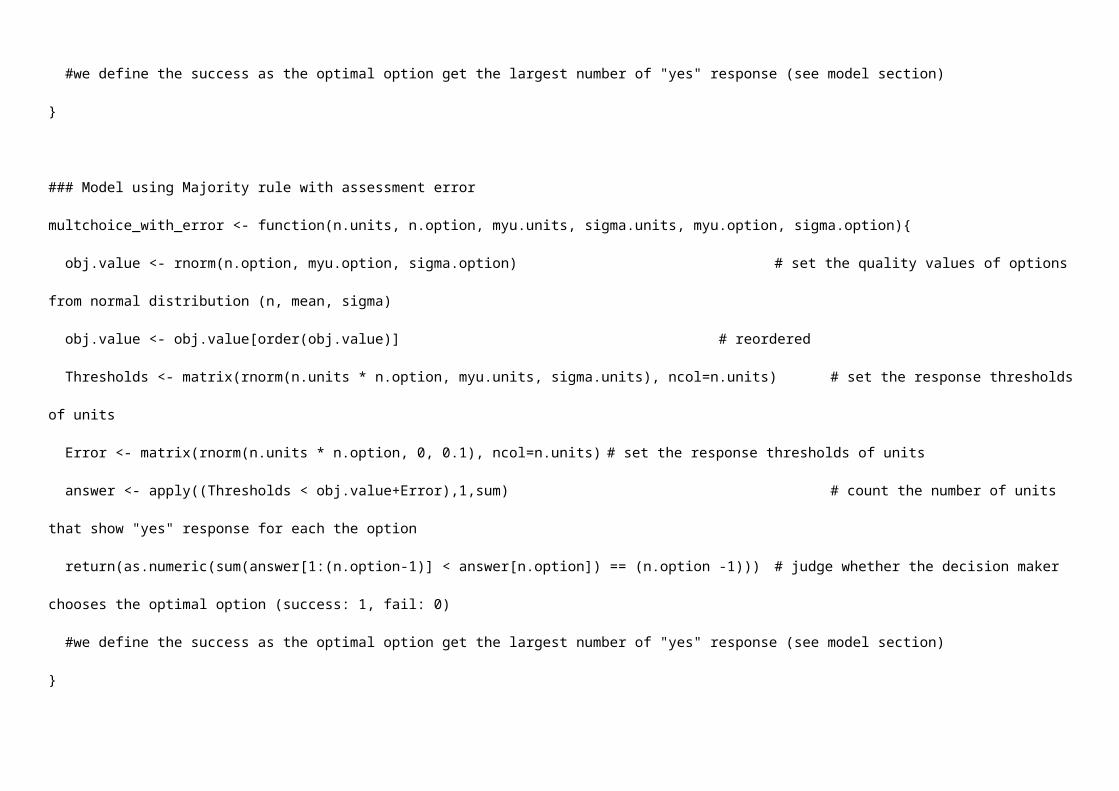
### Model using Majority rule with assessment errormultchoice_with_error <- function(n.units, n.option, myu.units, sigma.units, myu.option, sigma.option){

obj.value <- rnorm(n.option, myu.option, sigma.option) # set the quality values of options from normal distribution (n, mean, sigma) obj.value <- obj.value[order(obj.value)] # reordered Thresholds <- matrix(rnorm(n.units * n.option, myu.units, sigma.units), ncol=n.units) # set the response thresholds of units Error <- matrix(rnorm(n.units * n.option, 0, 0.1), ncol=n.units) # set the response thresholds of units answer <- apply((Thresholds < obj.value+Error),1,sum) # count the number of units that show "yes" response for each the option return(as.numeric(sum(answer[1:(n.option-1)] < answer[n.option]) == (n.option -1))) # judge whether the decision maker chooses the optimal option (success: 1, fail: 0) #we define the success as the optimal option get the largest number of "yes" response (see model section)}
### Model using Majority rule with random choicemultchoice_with_random <- function(n.units, n.option, myu.units, sigma.units, myu.option, sigma.option){ obj.value <- rnorm(n.option, myu.option, sigma.option) # set the quality values of options from normal distribution (n, mean, sigma) obj.value <- obj.value[order(obj.value)] # reordered Thresholds <- matrix(rnorm(n.units * n.option, myu.units, sigma.units), ncol=n.units) # set the response thresholds of units answer <- apply((Thresholds < obj.value),1,sum) # count the number of units that show "yes" response for each the option return(as.numeric(sample(c(1,rep(0,sum(answer[n.option] <= answer[1:(n.option-1)]))),1))) # judge whether the decision maker chooses the optimal option (success: 1, fail: 0) #if more than one option gained the largest number of yes, one is choisen randomly.}
## example.1: investigate the effect of threshold distribution (μh and σh) on the rate of correct choiceparam <- 101repeat.num <- 10000n.units <- 100n.option <- 10myurange<- seq(-4,4,length.out=param) # μh = 0~4sigmarange <- seq(0,1,length.out=param) # σh = 0~1
res <- matrix(0, ncol = param, nrow = param) # storage of the results
for(k in 1:param){ for(j in 1:param){ for(i in 1:repeat.num){ res[j,k] <- multchoice(n.units, n.option, myurange[k], sigmarange[j], 0, 1) + res[j,k] } }
}
## example.1.1: investigate the effect of threshold distribution (μh and σh) on the rate of correct choice (with assessment error)param <- 101repeat.num <- 10000n.units <- 100n.option <- 10myurange<- seq(-4,4,length.out=param) # μh = 0~4sigmarange <- seq(0,1,length.out=param) # σh = 0~1
res <- matrix(0, ncol = param, nrow = param) # storage of the results
for(k in 1:param){ for(j in 1:param){ for(i in 1:repeat.num){ res[j,k] <- multchoice_with_error(n.units, n.option, myurange[k], sigmarange[j], 0, 1) + res[j,k] } }}
## example.1.2: investigate the effect of threshold distribution (μh and σh) on the rate of correct choice (with random choice)param <- 101repeat.num <- 10000n.units <- 100n.option <- 10myurange<- seq(-4,4,length.out=param) # μh = 0~4sigmarange <- seq(0,1,length.out=param) # σh = 0~1
res <- matrix(0, ncol = param, nrow = param) # storage of the results
for(k in 1:param){ for(j in 1:param){

for(i in 1:repeat.num){ res[j,k] <- multchoice_with_random(n.units, n.option, myurange[k], sigmarange[j], 0, 1) + res[j,k] } }}
## example.2: the simulations with a variance in the number of units allocated to a single optionparam <- 1001repeat.num <- 10000n.units <- 100sig.m <- seq(1,30,length.out=param)
res <- matrix(0, ncol = 4, nrow = param)
for(k in 1:4){ n.option <- c(2,5,10,20)[k] answer <- rep(0, n.option) for(j in 1:param){ for(i in 1:repeat.num){ obj.value <- rnorm(n.option, 0, 1) # set the quality values of options from normal distribution (n, mean:0, sigma:1) obj.value <- obj.value[order(obj.value)] # arranged in order of increasing A <- ceiling(rnorm(n.option, n.units, sig.m[j])) # creat the number of units allocated each option by rounding up the random value for(h in 1:n.option){ if(A[h]<0){ A[h]<-0; } Thresholds <- rnorm(A[h], 0, 1) # set response thresholds of the units allocated the option h answer[h] <- sum(Thresholds < obj.value[h]) } res[j,k] <- as.numeric(sum(answer[1:(n.option-1)] < answer[n.option]) == (n.option-1)) + res[j,k] } }}

### quorum decision (modified from example.2)param <- 100repeat.num <- 10000n.units <- 100n.option <- 10 # fixedsig.m <- c(0,30) # check two extreme conditions
Quorum <- seq(1,100,length.out=param)
res <- matrix(0, ncol = 2, nrow = param) # storage of the number of correct choiceresn <- matrix(0, ncol = 2, nrow = param) # storage of the number of wrong choice
for(k in 1:2){ for(j in 1:param){ for(i in 1:repeat.num){ required.num.units <- rep(0,n.option) obj.value <- rnorm(n.option, 0, 1) obj.value <- obj.value[order(obj.value)] A <- ceiling(rnorm(n.option, n.units, sig.m[k])) for(h in 1:n.option){ if(A[h]<0){ A[h]<-0; } Thresholds <- rnorm(A[h], 0, 1) # set response thresholds of the units allocated the option h answer <- 0 while(answer < Quorum[j]){ if (required.num.units[h] == A[h]) break # don't excess the quorum for the option h by the allocated units if(obj.value[h] > Thresholds[required.num.units[h]+1]){ answer <- answer+1 } required.num.units[h] <- required.num.units[h]+1 # count the number of requared units to excess the quorum for the option h }

} if(sum(required.num.units[1:n.option] != A[1:n.option]) == 0){ # all options don't excess the quorum resn[j,k] <- 1 + resn[j,k] }else{ res[j,k] <- as.numeric(sum(required.num.units[1:(n.option-1)] > required.num.units[n.option]) == (n.option -1)) + res[j,k] } } }}
### decoy effectrepeat.num <- 10000n.units <- 100myu.units <- 0sigma.units <- 1threshold1 <- rep(0,n.units)threshold2 <- rep(0,n.units)obj.value1 <- c(0.2, 0, 0.2) ## A, B, DAobj.value2 <- c(0, 0.2, -0.2) ## A, B, DA
res <- rep(0,repeat.num)
## Majority Decisionres.without.decoy <- rep(0,repeat.num)res.with.decoy <- rep(0,repeat.num)
# without decoyfor(i in 1:repeat.num){ threshold1 <- matrix(rnorm(n.units*2, myu.units, sigma.units), ncol=2) threshold2 <- matrix(rnorm(n.units*2, myu.units, sigma.units), ncol=2) answer <- apply((threshold1 < rep(obj.value1[1:2],each=n.units) & threshold2 < rep(obj.value2[1:2],each=n.units)),2,sum) if(sum(answer == max(answer)) > 1){next()} res.without.decoy[i] <- seq(1,2,1)[answer == max(answer)]}

# with decoyfor(i in 1:repeat.num){ threshold1 <- matrix(rnorm(n.units*3, myu.units, sigma.units), ncol=3) threshold2 <- matrix(rnorm(n.units*3, myu.units, sigma.units), ncol=3) answer <- apply((threshold1 < rep(obj.value1,each=n.units) & threshold2 < rep(obj.value2,each=n.units)),2,sum) if(sum(answer == max(answer)) > 1){next()} res.with.decoy[i] <- seq(1,3,1)[answer == max(answer)]}
## Quorum Desicionquorum <- n.units * 0.6
# without decoyfor(i in 1:repeat.num){ answer <- rep(0,2) threshold1 <- matrix(rnorm(m*2, myu.units, sigma.units), ncol=2) threshold2 <- matrix(rnorm(m*2, myu.units, sigma.units), ncol=2) answers <- ((threshold1 < rep(obj.value1[1:2],each=m) & threshold2 < rep(obj.value2[1:2],each=m))) for(j in 1:K){ answer <- answer + as.numeric(answers[j,]) if(max(answer)>quorum){break()} } if(sum(answer == max(answer)) > 1){next()} res.without.decoy[i] <- seq(1,2,1)[answer == max(answer)]}
# with decoyfor(i in 1:repeat.num){ answer <- rep(0,3) threshold1 <- matrix(rnorm(n.units*3, myu.units, sigma.units), ncol=3) threshold2 <- matrix(rnorm(n.units*3, myu.units, sigma.units), ncol=3) answers <- ((threshold1 < rep(obj.value1,each=n.units) & threshold2 < rep(obj.value2,each=n.units))) for(j in 1:K){ answer <- answer + as.numeric(answers[j,])

if(max(answer)>quorum){break()} } if(sum(answer == max(answer)) > 1){next()} res.with.decoy[i] <- seq(1,3,1)[answer == max(answer)]}
## individual with decoyN = 100000 # number of iterationsthresholds_x <- rnorm(N,0,1)thresholds_y <- rnorm(N,0,1)accept_xA <- rep(NA, N)accept_yA <- rep(NA, N)accept_A <- rep(NA, N)accept_xB <- rep(NA, N)accept_yB <- rep(NA, N)accept_B <- rep(NA, N)accept_xDA <- rep(NA, N)accept_yDA <- rep(NA, N)accept_DA <- rep(NA, N)choice_binary <- rep(NA, N)choice_ternary <- rep(NA, N)
##binary choice (w/o decoy)for (i in 1:N){ if (thresholds_x[i] < 0.2){ accept_xA[i] <- 1 }else{ accept_xA[i] <- 0 }}
for (i in 1:N){ if (thresholds_y[i] < 0){ accept_yA[i] <- 1 }else{ accept_yA[i] <- 0

}}
for (i in 1:N){ if (thresholds_x[i] < 0){ accept_xB[i] <- 1 }else{ accept_xB[i] <- 0 }}
for (i in 1:N){ if (thresholds_y[i] < 0.2){ accept_yB[i] <- 1 }else{ accept_yB[i] <- 0 }}
for (i in 1:N){ if (accept_xA[i] == 1 && accept_yA[i] == 1){ accept_A[i] <- 1 }else{ accept_A[i] <- 0 }}
for (i in 1:N){ if (accept_xB[i] == 1 && accept_yB[i] == 1){ accept_B[i] <- 1 }else{ accept_B[i] <- 0 }}

choice_listAB <- c("A", "B")for (i in 1:N){ if (accept_A[i] == 1 && accept_B[i] == 1) {choice_binary[i] <- sample(choice_listAB,1)} else if (accept_A[i] == 1 && accept_B[i] == 0) {choice_binary[i] <- "A"} else if (accept_A[i] == 0 && accept_B[i] == 1) {choice_binary[i] <- "B"} else {choice_binary[i] <- "No choice"}}
##ternary choice (w/ decoy)for (i in 1:N){ if (thresholds_x[i] < 0.2) {accept_xDA[i] <- 1} else {accept_xDA[i] <- 0}}for (i in 1:N){ if (thresholds_y[i] < -0.2) {accept_yDA[i] <- 1} else {accept_yDA[i] <- 0}}
for (i in 1:N){ if (accept_xDA[i] == 1 && accept_yDA[i] == 1) {accept_DA[i] <- 1} else {accept_DA[i] <- 0}}

choice_listAB_DA <- c("A", "B", "DA")choice_listA_DA <- c("A", "DA")choice_listB_DA <- c("B", "DA")
for (i in 1:N){ if (accept_A[i] == 1 && accept_B[i] == 1 && accept_DA[i] == 1) {choice_ternary[i] <- sample(choice_listAB_DA,1)} if (accept_A[i] == 0 && accept_B[i] == 0 && accept_DA[i] == 0) {choice_ternary[i] <- "No choice"} if (accept_A[i] == 1 && accept_B[i] == 0 && accept_DA[i] == 0) {choice_ternary[i] <- "A"} if (accept_A[i] == 0 && accept_B[i] == 1 && accept_DA[i] == 0) {choice_ternary[i] <- "B"} if (accept_A[i] == 0 && accept_B[i] == 0 && accept_DA[i] == 1) {choice_ternary[i] <- "DA/Error"} if (accept_A[i] == 1 && accept_B[i] == 1 && accept_DA[i] == 0) {choice_ternary[i] <- sample(choice_listAB,1)} if (accept_A[i] == 1 && accept_B[i] == 0 && accept_DA[i] == 1) {choice_ternary[i] <- sample(choice_listA_DA,1)} if (accept_A[i] == 0 && accept_B[i] == 1 && accept_DA[i] == 1) {choice_ternary[i] <- sample(choice_listB_DA,1)}}
CombinedTable <- data.frame(thresholds_x, thresholds_y, accept_xA, accept_yA, accept_A, accept_xB, accept_yB, accept_B, choice_binary, choice_ternary) # make a table which has all the outcomes.Tbinary <- table(factor(choice_binary, levels = c("A","B"))) # ignore "No choice"cases; if you want to include it, simply add "No choice" in the levelsTternary <- table(factor(choice_ternary, levels = c("A","B", "DA"))) # ignore "nochoice" casespar(mfrow=c(1,2), pin=c(3,3))barplot(Tbinary, main = "binary", ylim=c(0,18000))barplot(Tternary, main = "ternary", ylim=c(0,18000))