Embed Size (px)
Citation preview

Instructions for use
Title Localization and subcellular distribution of prolyl oligopeptidase in the mouse placenta.
Author(s) Matsubara, Shin; Takahashi, Takayuki; Kimura, Atsushi P
Citation Journal of molecular histology, 42(3): 251-264
Issue Date 2011-06
Doc URL http://hdl.handle.net/2115/46898
Type article (author version)
File Information Matsubara-JMH-2.pdf
Hokkaido University Collection of Scholarly and Academic Papers : HUSCAP

1
2
3
4
5
6
7
8
9
10
11
12
13
Localization and subcellular distribution of prolyl oligopeptidase in the mouse placenta.
Shin Matsubaraa, Takayuki Takahashia,b, and Atsushi P. Kimuraa,b,*
aGraduate School of Life Science, Hokkaido University, Sapporo 060-0810, Japan
bDepartment of Biological Sciences, Faculty of Science, Hokkaido University, Sapporo 060-0810, Japan
*Corresponding author: Atsushi P. Kimura, Department of Biological Sciences, Faculty of Science,
Hokkaido University, Sapporo 060-0810, Japan. Phone and Fax: 81-11-706-4452. E-mail:
Disclosure summary: The authors certify that they have nothing to disclose.
1

1
2
3
4
5
6
7
8
9
10
11
12
13
14
15
16
17
18
19
20
21
Abstract
Prolyl oligopeptidase (POP) is a serine endopeptidase which selectively digests a -Pro-X- peptide bond.
Our previous study showed that POP mRNA was strongly expressed in the spongiotrophoblast of the
mouse placenta at E17.5, suggesting its importance in development. To gain more insight into POP’s role
during gestation, we investigated its expression using different developmental stages of placenta. As a
result of in situ hybridization, we found that localization of POP mRNA changed at E12.5. POP mRNA
was strongly expressed in the spongiotrophoblast and labyrinth at E10.5 and E11.5 but thereafter only in
the spongiotrophoblast. Immunohistochemistry revealed that POP was present in the parietal trophoblast
giant cell, the spongiotrophoblast cell, and the labyrinth at E11.5 but the strong expression in the labyrinth
was maintained only in the canal-associated and sinusoidal trophoblast giant cells at E16.5 and E18.5. To
determine subcellular distribution of the POP protein, we fractionated the placental extract into
cytoplasmic, membrane, and nuclear subfractions. By Western blot analysis, POP was detected in the
cytoplasmic and membrane fractions but not in the nuclear fraction at E11.5 and E16.5. Interestingly, the
cytoplasmic POP exhibited higher enzymatic activity than the membrane-associated type. These data
suggest that the cytoplasmic and membrane-associated POP have distinct roles in different types of
placental cells.
Key words: prolyl oligopeptidase, localization, placenta, spongiotrophoblast, trophoblast giant cell,
subcellular distribution
2

1
2
3
4
5
6
7
Abbreviations: ANOVA, analysis of variance; C-TGC, canal-associated TGC; E, embryonic day; MCA,
4-methylcoumaryl-7-amide; DTT, dithiothreitol; αMSH, α-melanocyte stimulating hormone; PAGE,
polyacrylamide gel electrophoresis; PBS, phosphate-buffered saline; POP, prolyl oligopeptidase; P-TGC,
parietal TGC; PVDF, polyvinylidene difluoride; SD, standard deviation; SDS, sodium dodecyl sulfate;
S-TGC, sinusoidal TGC; SpA-TGC, spiral artery-associated TGC; TGC, trophoblast giant cell; PBST,
PBS containing 0.1% Tween 20
3

1
2
3
4
5
6
7
8
9
10
11
12
13
14
15
16
17
18
19
20
21
22
23
24
25
Introduction
Prolyl oligopeptidase (POP, E.C.3.4.21.26, prolyl endopeptidase, post proline cleaving enzyme; gene
symbol Prep) is a serine endopeptidase which hydrolyzes a peptide bond at carboxyl side of an internal
proline residue (Wilk, 1983). POP has an ancient origin and is distributed in various species from bacteria
to mammals (Garcia-Horsman et al., 2007), and in higher organisms most tissues express it at different
levels (Myöhänen et al., 2009). Because of its peculiar activity and wide distribution, the physiological
role of POP has received intense interest since its discovery in 1971 (Walter et al.). The most studied
tissue is the brain because POP has been reported to be related to learning and memory and may be a
cause of some neurodegenerative diseases such as bipolar disorder and Alzheimer disease
(Garcia-Horsman et al., 2007; Myöhänen et al., 2009; Williams, 2004). With regard to this, POP-deficient
mice exhibited a defect in growth cone dynamics of neurons (Di Daniel et al., 2009). In pituitary, POP has
been shown to process α-melanocyte stimulating hormone (αMSH) and affect obesity (Perroud et al.,
2009; Warden et al., 2009). POP has also been suggested to be involved in cell proliferation and
differentiation in murine Swiss 3T3 cells (Ishino et al., 1998) and Sarcophaga peregrina (flesh fly)
(Ohtsuki et al., 1994, 1997), but its physiological function still needs to be explored.
Another important issue about POP is the subcellular localization. POP had been thought to be a
cytosolic protein, but a membrane-bound form was recently purified from porcine brain and characterized
(Tenorio-Laranga et al., 2008). Other results have suggested the existence of a secreted form (Kimura et
al., 1998, 2002; Soeda et al., 1984; Takahashi et al., 1996), and in mammalian cultured cells and some
mouse peripheral tissues, POP was also localized to the nucleus (Ishino et al., 1998; Myöhänen et al.,
2008c). Therefore, POP is now thought to be present in various forms although it is encoded by a single
gene (Kimura et al., 1999; Kimura and Takahashi, 2000). This is consistent with a recent report indicating
that POP was associated with the cytoplasm, nucleus, and membrane in the cerebellar granule cell culture
(Moreno-Baylach et al., 2008). However, it is still unclear whether the nuclear and membrane-associated
4

1
2
3
4
5
6
7
8
9
10
11
12
13
14
15
16
17
18
19
20
21
22
23
24
25
POP is commonly present in many tissues of many species.
The nuclear POP is often linked to development and differentiation. The POP enzymatic activity or
its mRNA expression have been reported to be high at early developmental stages of the rat brain (Kato et
al., 1980; Fuse et al., 1990; Yamanaka et al., 1999; Agirregoitia et al., 2003, 2010), pituitary (Agirregoitia
et al., 2003), and liver (Matsubara et al., 1998) as well as of the mouse testis (Kimura et al., 2002).
Because these stages are when cells proliferate and differentiate in each tissue, POP is presumed to be
involved in cell cycle regulation and the nuclear POP is believed to be responsible for this role. In fact, a
very recent report showed that POP was localized to the nucleus only early in the brain development
(Hannula et al., 2010). Although there is no conclusive evidence for the nuclear POP controlling the cell
cycle, it is widely accepted that POP plays some important roles in development and differentiation.
Consistent with this, we observed a relatively high level of POP mRNA expression in the mouse embryo
during early gestation (Matsubara et al., 2010).
The placenta plays a critical role in fetal development by forming an interface between the maternal
and fetal circulation. The developed mouse placenta is mainly composed of three layers: the outer
maternal decidua, middle junctional zone, and innermost labyrinth layer. The maternal decidua contains
decidual cells, which originate from the uterus, and maternal vasculature to transport blood to the fetus.
The labyrinth layer includes highly branched maternal and fetal vasculatures composed of several distinct
cell types for efficient exchange of nutrients and gases. Separating these two, the junctional zone
consisting of the spongiotrophoblast and glycogen trophoblast cell supports the labyrinth structurally and
functionally by producing many angiogenic and tissue remodeling factors (Rossant and Cross, 2001). In
addition, the mouse placenta includes four subtypes of trophoblast giant cells (TGCs) that play important
roles in the maintenance of pregnancy by secreting many hormones and paracrine factors (Hu and Cross,
2010; Simmons et al., 2007). Parietal TGC (P-TGC) positions between the maternal decidua and
junctional zone, and spiral artery-associated TGC (SpA-TGC) lines maternal spiral arteries in the decidua.
Canal-associated TGC (C-TGC) and sinusoidal TGC (S-TGC) are found in the labyrinth. Many genes are
5

1
2
3
4
5
6
7
8
9
10
11
12
13
14
15
16
17
18
19
20
21
22
23
24
25
thought to be involved in the regulation of placental functions (Watson and Cross, 2005) but the
molecular mechanisms are still poorly understood.
In the mouse, POP mRNA is highly expressed in the ovary and placenta (Matsubara et al., 2010),
suggesting its importance in reproduction and development. As an initial step toward understanding the
physiological function of POP in development, here we investigated its expression and localization in
different developmental stages of placenta. We found that the localization of POP mRNA and protein
changed at embryonic day (E)12.5. POP was strongly expressed in P-TGCs, spongiotrophoblast cells, and
the labyrinth layer before E12.5, but only C-TGCs and S-TGCs maintained the strong expression in the
labyrinth after that. We also assessed the subcellular distribution of POP in the placenta and found that
POP was localized in the cytoplasm and membrane but not in the nucleus. These results suggest that the
distinct forms of POP contribute to different placental functions.
Materials and methods
Animals and tissue preparation
C57/BL6 and BDF1 (C57/BL6 × DBA2 F1) mice were obtained from CLEA Japan Inc. (Tokyo,
Japan) and maintained under standard conditions, with free access to food and water, and a 14-h
light/10-h dark cycle. Tissues were collected as previously described (Matsubara et al., 2010). All the
placentas were isolated with the maternal decidua. The experimental procedures used in this study were
approved by the Institutional Animal Use and Care Committee at Hokkaido University.
Detection of RNA
6
1
2
3
4
5
6
7
8
9
10
11
12
13
14
15
16
17
18
19
20
21
22
23
24
25
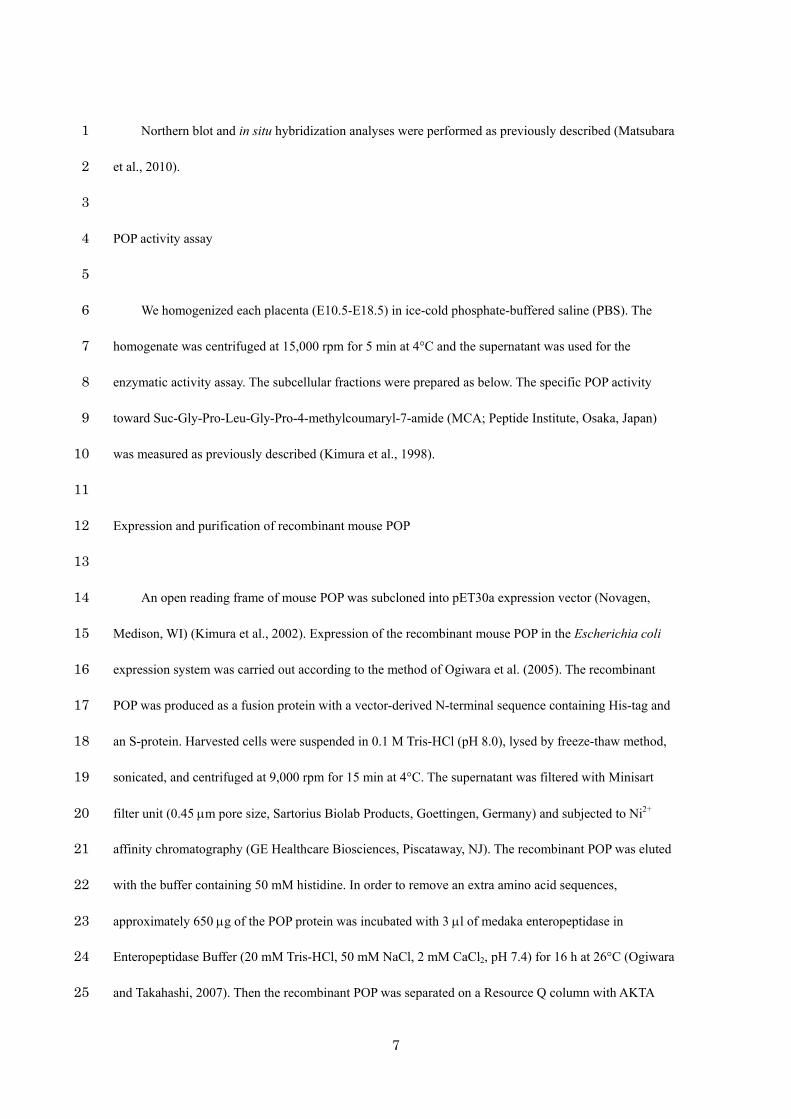
Northern blot and in situ hybridization analyses were performed as previously described (Matsubara
et al., 2010).
POP activity assay
We homogenized each placenta (E10.5-E18.5) in ice-cold phosphate-buffered saline (PBS). The
homogenate was centrifuged at 15,000 rpm for 5 min at 4°C and the supernatant was used for the
enzymatic activity assay. The subcellular fractions were prepared as below. The specific POP activity
toward Suc-Gly-Pro-Leu-Gly-Pro-4-methylcoumaryl-7-amide (MCA; Peptide Institute, Osaka, Japan)
was measured as previously described (Kimura et al., 1998).
Expression and purification of recombinant mouse POP
An open reading frame of mouse POP was subcloned into pET30a expression vector (Novagen,
Medison, WI) (Kimura et al., 2002). Expression of the recombinant mouse POP in the Escherichia coli
expression system was carried out according to the method of Ogiwara et al. (2005). The recombinant
POP was produced as a fusion protein with a vector-derived N-terminal sequence containing His-tag and
an S-protein. Harvested cells were suspended in 0.1 M Tris-HCl (pH 8.0), lysed by freeze-thaw method,
sonicated, and centrifuged at 9,000 rpm for 15 min at 4°C. The supernatant was filtered with Minisart
filter unit (0.45 µm pore size, Sartorius Biolab Products, Goettingen, Germany) and subjected to Ni2+
affinity chromatography (GE Healthcare Biosciences, Piscataway, NJ). The recombinant POP was eluted
with the buffer containing 50 mM histidine. In order to remove an extra amino acid sequences,
approximately 650 µg of the POP protein was incubated with 3 µl of medaka enteropeptidase in
Enteropeptidase Buffer (20 mM Tris-HCl, 50 mM NaCl, 2 mM CaCl2, pH 7.4) for 16 h at 26°C (Ogiwara
and Takahashi, 2007). Then the recombinant POP was separated on a Resource Q column with AKTA
7
Purifier (GE Healthcare Biosciences) in 50 mM Tris-HCl (pH 8.0) and fractions with high POP activity
were collected. After the removal of the extra peptide using the Ni
1
2
3
4
5
6
7
8
9
10
11
12
13
14
15
16
17
18
19
20
21
22
23
24
25
2+ sepharose column, the recombinant
POP was further purified by Mono Q column with AKTA Purifier (GE Healthcare Biosciences) in 50 mM
Tris-HCl (pH 8.0). We confirmed a single band of the recombinant POP by sodium dodecyl
sulfate-polyacrylamide gel electrophoresis (SDS-PAGE) and Coomassie Brilliant Blue staining. To
exchange the buffer at each step, we used VIVASPIN 20 centrifugal concentrator (10,000 MWCO, PES,
Sartorius Biolab Products).
Generation and purification of polyclonal anti-POP antibody
We obtained approximately 3.5 mg purified recombinant POP protein from about 20 litters of the
bacterial culture. Two hundred micrograms of the protein were injected into a chicken every two weeks
and the antiserum was checked by Western blot analysis at 5 and 10 weeks after the first injection.
Specific anti-POP antibody was purified from the serum by the method using Western blot. We injected
the antigen into three chickens (C1, C2, C3) and the antiserum from the C1 chicken was used in this study.
Excess amount of the recombinant POP was separated by SDS-PAGE and blotted to the polyvinylidene
difluoride membrane (PVDF, Millipore, Bedford, MA). After the position of the POP signal was
confirmed by staining the 1 cm side of the membrane, the band including POP was cut out from the
remaining membrane. Blocking was conducted as below and the membrane was incubated for overnight
at 4°C with 500 µl antiserum combined with the same volume of PBS containing 0.1% Tween 20 (PBST).
The membrane was washed with PBST for 10 min three times and incubated with 10 ml of Elution Buffer
(0.1 M Glycine-HCl, 0.5 M NaCl, pH 2.4) for 20 min with shaking. The eluted antibody was neutralized
by adding 2 ml of 2 M Tris-HCl (pH 8.0). The buffer was exchanged to PBS and the antibody was
concentrated to 200 µl by using VIVASPIN 20 (Sartorius Biolab Products). The antibody was mixed with
the same volume of glycerol and stored at -20°C until use. The antibody concentration was determined
8
1
2
3
4
5
6
7
8
9
10
11
12
13
14
15
16
17
18
19
20
21
22
23
24
25
with BCA Protein Assay Reagent Kit (Pierce, Rockford, IL).
Western blot analysis
Twenty micrograms of each sample was electrophoresed on an 8% SDS-PAGE gel and blotted to a
PVDF membrane (Millipore). After blocking with Block Ace (Dainippon Seiyaku) and normal rabbit
serum (1:250 dilution with PBST) for 1 h each at room temperature, the membrane was incubated with
the antibody for 1 h at room temperature. The antibodies used in this study were the purified anti-POP
antibody (10 µg/ml at a final concentration), anti-β-actin monoclonal antibody (1:1000 dilution, Sigma, St
Louis, MO), anti-histone H3 antibody (1:100 dilution) (Kimura et al., 2008), and anti-connexin 43
antibody (1:500 dilution, Transduction Laboratories, Lexington, KY). The antibodies for POP were
diluted with ExactaCruzTM E Dilution Buffer (Santa Cruz Biotechnology, Santa Cruz, CA), and for
β-actin, histone H3, and connexin-43 with PBST. The membrane was further incubated for 1 h at room
temperature with the secondary antibody, goat anti-chicken IgY antibody (1:10000 dilution, Jackson
ImmunoResearch, West Grove, PA) for POP and anti-mouse IgG antibody (1:5000 dilution, GE
healthcare) for the other antibodies. The signals were detected using an Immobilon Western
Chemiluminescent HRP Substrate (Millipore) according to the manufacture’s instruction. To confirm the
specificity of the generated antibody, we conducted the same experiment by using the POP antibody
preincubated with the purified recombinant POP.
Immunohistochemistry
Placentas were fixed at 4°C for overnight in Bouin’s solution, embedded in paraffin, and sectioned at
6 µm. The sections were dewaxed in xylene for 10 min and rehydrated in serial ethanol solution and
running tap water. The slides were boiled using a microwave oven in 10 mM citric acid buffer (pH 6.0)
9

1
2
3
4
5
6
7
8
9
10
11
12
13
14
15
16
17
18
19
20
21
22
23
24
25
for 5-10 min and cooled for 15 min at room temperature. Endogenous peroxidase activity was quenched
by incubating the slides with 2.25% hydrogen peroxide for 15 min. After being washed with running tap
water and PBS for 5 min each, the slides were blocked as in Western blot. The sections were incubated
with the prurified anti-POP antibody (40 µg/ml at a final concentration) for 12 h at room temperature and
washed with PBS for 5 min three times. After being incubated with the secondary anti-chicken IgY
antibody (1:500 dilution) for 3 h at room temperature and washed with PBS, the signals were developed
using AEC Peroxidase Substrate kit (Vector Labolatories, Inc., Burlingam, CA) for 20-30 min. For
negative controls, slides were incubated without the primary antibody or with the POP antibody
preincubated with the purified recombinant POP at that step. After the signal was developed, the sections
were counterstained with Carazzi’s hematoxylin for 5min.
Preparation of subcellular fractions
To obtain subcellular fractions from the placenta, we applied two different methods. The first one
was to separate the cytoplasmic and membrane subfractions from the nuclear subfraction. We
homogenized the placenta at E10.5 and E15.5 in 1 ml of ice-cold Sucrose Buffer I (0.32 M sucrose, 3 mM
CaCl2, 2 mM magnesium acetate, 0.1 mM EDTA, 10 mM Tris-HCl, 1 mM dithiothreitol (DTT), 0.5 mM
phenylmethylsulfonyl fluoride, 0.5% NP-40, pH 8.0) and the homogenates were centrifuged at 3,000 rpm
for 5 min at 4°C. The supernatant contained cytoplasmic and membrane-associated proteins and the
precipitate was the nucleus. We collected the supernatant by adding 220 µl of 5× Extraction Buffer (0.15
M HEPES-KOH, 0.7 M KCl, 15 mM MgCl2, pH 7.9) and centrifuging it at 12,000 rpm for 15 min at 4°C
(designated as ‘C+M’). The nucleus was suspended in 1 ml of Sucrose Buffer I lacking NP-40 and
centrifuged at 3,000 rpm for 5 min at 4°C. The precipitates were resuspended in 200 µl of Low-Salt
Buffer (20 mM HEPES-KOH, 25% Glycerol, 1.5 mM MgCl2, 20 mM KCl, 0.2 mM EDTA, 0.5 mM DTT,
pH 7.9), and the same volume of High-Salt Buffer (20 mM HEPES-KOH, 25% Glycerol, 1.5 mM MgCl2,
10

1
2
3
4
5
6
7
8
9
10
11
12
13
14
15
16
17
18
19
20
21
22
23
24
25
0.8 M KCl, 0.2 mM EDTA, 0.5 mM DTT, pH 7.9) was mixed with the nucleus by adding 50 µl four times.
The total volume of 400 µl including the nuclear protein were incubated for 20 min at 4°C with gentle
rotation and then 800 µl of Diluent (25 mM HEPES, 0.1 mM EDTA, 0.5 mM DTT, pH 7.6) were added.
After centrifugation at 15,000 rpm for 15 min at 4°C, the supernatants were collected (designated as ‘N’).
The second procedure was to prepare the cytoplasmic, membrane, and nuclear subfractions
separately. The experiment was performed as described by others with slight modifications (Ogiwara and
Takahashi, 2007). We homogenized the placenta at E11.5 and E16.5 in 1 ml of ice cold buffer A (10 mM
Tris-HCl, 10 mM MgCl2, 10 mM KCl, 1 µM DTT, pH 7.5) containing 1× proteinase inhibitor cocktail
(Roche Molecular Biochemicals, Mannheim, Germany) and centrifuged the homogenate at 1,600 × g for
8 min at 4°C. The precipitate was treated as in the first method and the obtained extract was designated as
the nuclear subfraction (N). The supernatant was further centrifuged at 100,000 × g at 4°C for 30 min and
the resulting supernatant was the cytoplasmic subfraction (C). The precipitate was washed with 1.5 ml of
0.1 M Tris-HCl (pH 8.0), centrifuged again at 100,000 × g at 4°C for 30 min, and suspended in 0.1 M
Tris-HCl (pH 8.0) (M). All samples were sonicated using a Tomy Ultrasonic Disrupter UD-201 (Tomy,
Tokyo,Japan) with 20% output for 5 s 3 times.
Statistical analysis
Results were expressed as the average ± standard deviation (SD) of at least three independent
experiments and analyzed by Student’s t test or one-way analysis of variance (ANOVA) followed by
Tukey’s post hoc test using JSTAT statistical software (version 12.6 for Windows, Masato Sato, Japan).
Differences were considered statistically significant at P<0.05.
Results
11
1
2
3
4
5
6
7
8
9
10
11
12
13
14
15
16
17
18
19
20
21
22
23
24
25
Tissue distribution of POP mRNA and its localization in the placenta.
We previously showed that the ovary and placenta expressed a higher level of POP mRNA than the
liver, testis, and uterus (Matsubara et al., 2010). We extended this analysis to 16 mouse tissues and
performed a Northern blot analysis. Although the lung RNA seemed to be degraded, the result indicated
that the ovary and placenta expressed the highest level of POP mRNA in the tissues (Fig. 1). We then
investigated the localization of POP mRNA in the placenta at E10.5-E18.5. Consistent with our previous
result of the E17.5 placenta (Matsubara et al., 2010), POP mRNA was strongly expressed in the
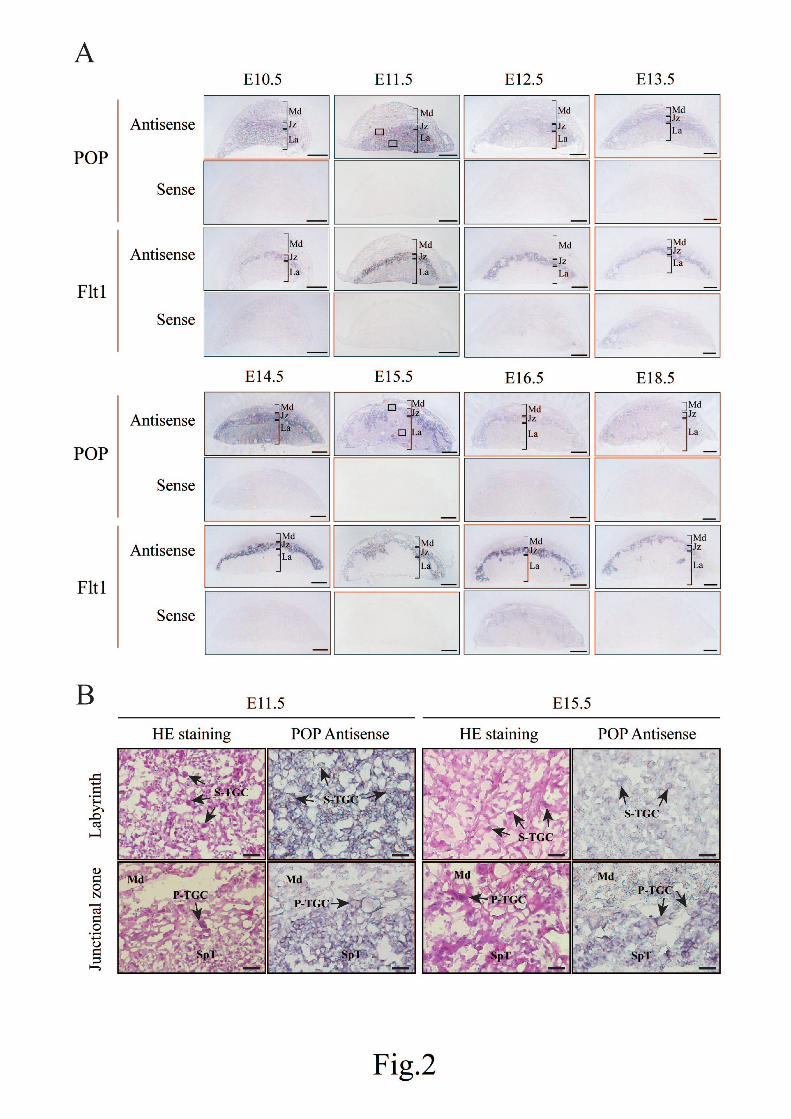
spongiotrophoblast at E12.5-E18.5 (Fig. 2A). However, in the E10.5 and E11.5 placenta, a strong signal
was detected in both the spongiotrophoblast and the labyrinth layer (Fig. 2A). Higher magnification
images of the E11.5 and E15.5 placenta, which represent the two types of staining patterns, suggested that
S-TGC was the only cell type that maintained the POP mRNA expression in the labyrinth at E15.5 (Fig.
2B). We could also identify P-TGC in the junctional zone which was stained at both E11.5 and E15.5 and
the decidual cell was weakly stained in both the placentas (Fig. 2B). Flt1 was used as a marker of the
spongiotrophoblast in the neighboring section (Hitz et al., 2005). No positive signal was obtained in the
sections hybridized with POP and Flt1 sense probes (Fig. 2A). Sections stained with hematoxylin and
eosin were provided to show the morphology of each region of the placenta (Fig. 2B). The data indicated
that the mouse placenta expressed a high level of POP mRNA and its localization changed at E12.5.
Placental POP activity and protein amount during gestation.
We next examined the expression of POP protein in the placenta by measuring the enzymatic
activity and performing Western blot analysis (Fig. 3). We prepared soluble extracts from E10.5-E18.5
placentas and measured the POP activity toward an MCA substrate Suc-Gly-Pro-Leu-Gly-Pro-MCA since
12

1
2
3
4
5
6
7
8
9
10
11
12
13
14
15
16
17
18
19
20
21
22
23
24
25
POP is the only known enzyme that can digest this substrate. The result showed that the activity gradually
increased about 2-fold between E10.5 and E14.5 and the high level of activity was kept until E18.5 (Fig.
3A). For Western blot analysis, we generated and purified the POP antibody as described in materials and
methods. We first used the extracts of the brain and E18.5 placenta for the analysis and detected a single
band at 72 kDa (Fig. 3B, left). To confirm the specificity of the 72-kDa band, we conducted the same
experiment by using the POP antibody preincubated with the recombinant POP and this resulted in
disappearance of the band (Fig. 3B, right). The data indicates that the POP antibody we generated
specifically recognizes the POP protein. We then assessed the POP protein expression in E10.5-E18.5
placentas by using β-actin as a loading control and found that it was present at a constant level during this
period (Fig. 3C, D). This is in agreement with the profile of the POP mRNA level, which was also
constant during the same period (Matsubara et al., 2010), but is not consistent with the POP activity (Fig.
3A).
Localization of POP protein in the placenta.
To identify the cell type expressing POP protein, we next conducted the immunohistochemisty using
E11.5, E16.5, and E18.5 placentas. We chose the E11.5 and E16.5 placenta as representative stages of the
two expression patterns of POP mRNA (Fig. 2) and the E18.5 placenta as a fully mature stage. The strong
POP signal was detected in the junctional zone and the labyrinth layer in the E11.5 placenta but the signal
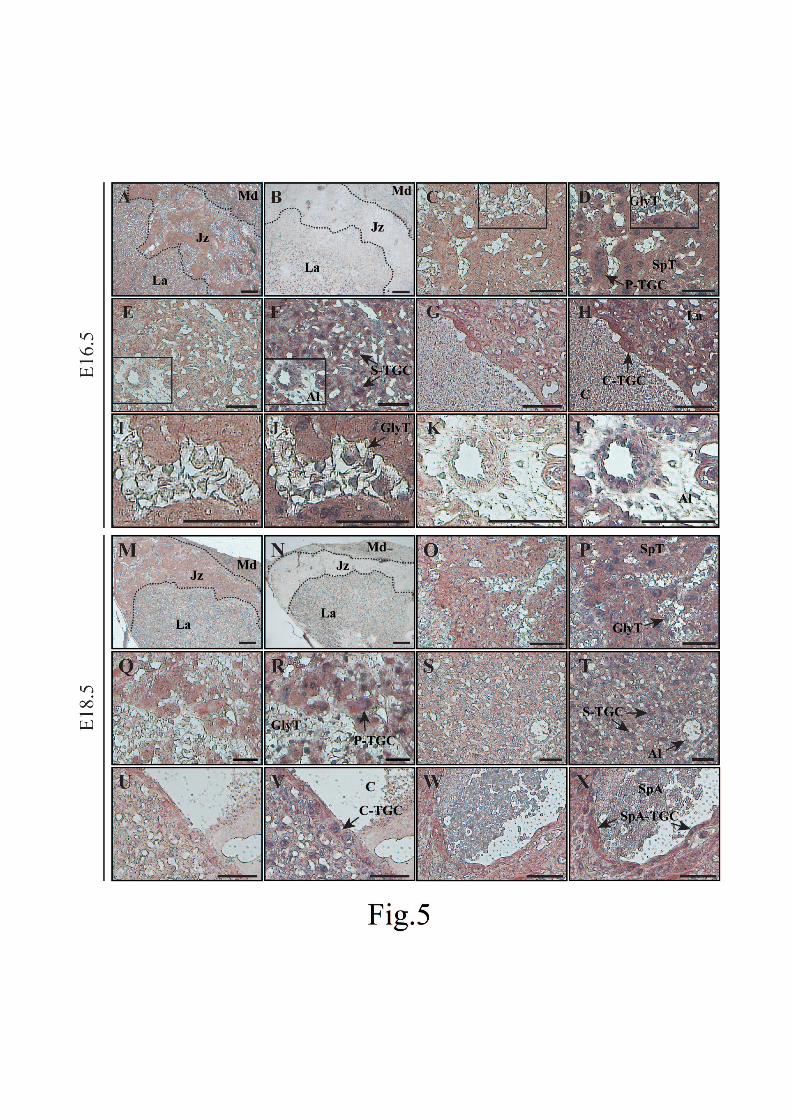
in the labyrinth dramatically decreased at E16.5 and E18.5 (Figs. 4A, 5A, M). Higher magnification of
figures showed that all P-TGCs and spongiotrophoblast cells strongly expressed POP protein at the three
stages (Figs. 4C, D, 5C, D, O-R). Glycogen trophoblast cells, which appear after E12.5 (Simmons and
Cross, 2005), were very weakly stained in the E16.5 or E18.5 placentas (Fig. 5I, J, Q, R). The labyrinth
layer contains several types of cells such as syncytiotrophoblast cells, the fetal vascular endothelium, and
the allantois as well as S-TGCs and C-TGCs. In the E11.5 placenta, most labyrinthine cells showed a
13

1
2
3
4
5
6
7
8
9
10
11
12
13
14
15
16
17
18
19
20
21
22
23
24
25
positive POP signal and the only exception was the allantois (Fig. 4E, F). By contrast, we observed a
strong POP signal almost exclusively in S-TGCs and C-TGCs in the labyrinth at E16.5 and E18.5 (Fig.
5E-H, S-V). The allantois was negative for POP immunoreactivity at these two stages, too (Fig. 5K, L, S,
T). In the E18.5 placenta, we could also identify SpA-TGCs, which were stained (Fig. 5W, X). The
maternal decidua showed weak POP immunoreactivity at all the stages examined (Figs. 4A, 5A, M). No
signal was observed in any placental cells on the control sections treated without the POP antibody (data
not shown) or with the POP antibody preincubated with the purified recombinant POP (Figs. 4B, 5B, N).
The results of our immunohistochemistry are summarized in Table 1. These data suggest that POP protein
is strongly expressed in the S-TGC, P-TGC, the spongiotrophoblast cell, and most cells of the labyrinth
layer before E12.5 and in the spongiotrophoblast and four subtypes of TGCs after that. Interestingly, the
signal seemed to be localized in the cytoplasm of all the POP-positive cells at all the stages examined.
Subcellular distribution of placental POP.
The immunohistochemistry suggested that POP protein was localized in the cytoplasm of all the
POP-expressing placental cells. However, we could not tell whether the POP protein is associated with
membrane or not. Therefore, we fractionated the placental extract into cytoplasmic, membrane, and
nuclear subfractions. We applied two different methods to the fractionation. In the first method, we
separated the combined cytoplasmic and membrane extract (C+M) from the nuclear extract (N) to
confirm that POP was not localized to the nucleus. We checked the POP activity of each fraction and
found that the C+M fraction had high POP activity in both the E10.5 and E15.5 placentas, whereas no
significant activity was detected in the N fraction (Fig. 6A). Western blot analysis demonstrated that POP
protein exists only in the C+M fraction (Fig. 6B). The results indicated that the placental POP protein was
not localized to the nucleus.
We next separated the cytoplasmic, membrane, and nuclear subfractions by using the second method.
14

1
2
3
4
5
6
7
8
9
10
11
12
13
14
15
16
17
18
19
20
21
22
23
24
25
As a result of the enzymatic activity assay, the cytoplasmic extract showed much higher POP activity than
the other two fractions in both E11.5 and E16.5 placentas (Fig. 6C). Interestingly, the membrane
subfraction still showed higher POP activity than the nuclear extract, although the difference was not
statistically significant. By Western blot analysis, we observed a POP signal in both the cytoplasmic and
membrane fractions but not in the nuclear fraction (Fig. 6D). Antibodies against histone H3 and
connexin-43 were used as markers of the nucleus and plasma membrane respectively and the results
confirmed that our fractionation was successful (Fig. 6D). To compare the POP activity in the cytoplasm
and membrane, we repeated Western blot analysis three times and quantified each signal by using the
Image J software to normalize the POP band intensity to β-actin. As a result, the amounts of cytoplasmic
POP in E11.5 and E16.5 placentas were 2.3- and 3.3-fold higher, respectively, than in the
membrane-associated POP (Fig. 6D). Because the activities of the cytoplasmic extracts in E11.5 and
E16.5 placentas were 15.3- and 12.7-fold higher, respectively, than in the membrane fractions (Fig. 6C),
the activity of the cytoplasmic POP was probably higher than that of the membrane-associated POP.
These results indicated that placental POP was localized in the cytoplasm and membrane, and that the
membrane type seemed to have lower enzymatic activity.
Discussion
Tissue distribution of POP.
We first assessed the POP mRNA expression in 16 mouse tissues and found that the ovary and
placenta expressed relatively high levels of POP mRNA (Fig. 1). This appears to be inconsistent with
several studies reporting that the brain contained higher POP activity than other tissues (Fuse et al., 1990;
Hersh 1981; Irazusta et al., 2002). However, the studies did not include the ovary and placenta for the
15

1
2
3
4
5
6
7
8
9
10
11
12
13
14
15
16
17
18
19
20
21
22
23
24
25
assay and one report indicated that the ovary contained higher POP activity than the brain in the mouse
(Ohta et al., 1992). In addition, many reports have suggested that POP enzymatic activity is not
necessarily consistent with its mRNA level and protein amount (Bellemère et al., 2004; Garcia-Horsman
et al., 2007; Irazusta et al., 2001; Myöhänen et al., 2007, 2008a,b), possibly due to post-transcriptional or
post-translational modifications or the existence of endogenous POP inhibitors (Salers, 1994; Soeda et al.,
1985). Thus, what we can say from the current study is that at least in the mouse, POP mRNA is
expressed at higher levels in the ovary and placenta than the brain.
Our result also uncovered the species difference of the POP mRNA distribution. The human POP
mRNA was reported to be expressed at the highest level in the skeletal muscle but at low levels in the
ovary and placenta (Goossens et al., 1997; Shirasawa et al., 1994). In the rat, the brain expressed a
relatively high level of POP mRNA although the study included neither the ovary nor the placenta
(Kimura and Takahashi, 2000). Porcine POP mRNA was expressed at much higher levels in the heart and
muscle than the ovary (Rennex et al., 1991). These indicate that the tissue expressing POP mRNA at a
high level is different between species and suggest that POP may have different roles in various species.
Molecular mass of POP.
We generated the new POP antibody which detected a 72-kDa band as the mouse POP protein (Fig.
3B, D). The mammalian POP protein consists of 710 amino acids with a calculated molecular mass of
80.7 kDa and indeed the POP antibody generated by another group detected rat and human POP at 80 kDa
(Myöhänen et al., 2007). However, POP protein purified from many mammalian tissues has been reported
to be 65-80 kDa (Welches et al., 1993), suggesting that the molecular mass of POP might be different
between species or tissue types. Alternatively, some post-translational modifications might affect the
electromobility or even the difference of marker proteins might result in the difference of the calculated
molecular mass. In any case, because we could confirm the specificity of the detected band by
16

1
2
3
4
5
6
7
8
9
10
11
12
13
14
15
16
17
18
19
20
21
22
23
24
25
preincubation of the antibody with the purified POP, we concluded that the antibody specifically
recognized the mouse POP protein at 72 kDa in our hands.
Localization of POP in the mouse placenta.
We investigated the localization of POP mRNA and protein in the developing mouse placenta. Using
immunohistochemistry, we determined many cell types by morphology, but using in situ hybridization,
we could not do so because the cell morphology seemed to be modified in our cryosections, for unknown
reasons. While we observed strong POP immunoreactivity in spongiotrophoblast cells and four subtypes
of TGCs at E16.5 and E18.5 and in other labyrinthine cells besides those at E11.5 (Figs. 4, 5), we could
only identify the spongiotrophoblast, P-TGC, and S-TGC by in situ hybridization (Fig. 2). Nevertheless,
the two data sets of the POP mRNA and protein localization are similar in that 1) spongiotrophoblast cells
and P-TGCs were strongly stained at all the stages examined, 2) in the labyrinth, most cells were strongly
stained before E12.5 but only TGCs were thereafter, and 3) the decidual cell was weakly stained at all the
stages. These indicate that the localization of POP mRNA and protein was generally consistent with each
other. It is assumed that POP is strongly expressed in the spongiotrophoblast cell and all subtypes of
TGCs at E10.5-E18.5 while in the labyrinth most cells express POP at E10.5 and E11.5 but the strong
expression is maintained only in the S-TGC and C-TGC after that.
An interesting finding was that POP localization changed at E12.5 in the placenta. POP was
presumably down-regulated in the labyrinthine cells other than TGCs such as syncytiotrophoblast and
fetal vascular endothelial cells. This suggests that POP in these cells have distinct roles from POP in other
cells and is involved in some events taking place around E10-E12. For example, POP might degrade some
peptides that are present only around these stages. It might also be related to differentiation of some
placental cells including the syncytiotrophoblast (Rossant and Cross, 2001) or play some role in the
establishment of fetal-maternal connection (Adamson et al., 2002). In contrast, POP in the
17

1
2
3
4
5
6
7
8
9
10
11
12
13
14
15
16
17
18
19
20
21
22
23
24
25
spongiotrophoblast and TGCs might be involved in the secretion of hormones and growth factors because
POP was suggested to control protein secretion in human glioma cells (Schulz et al., 2005). Alternatively,
POP might participate in the processing of hormones and growth factors that the spongiotrophoblast and
TGCs secrete. Considering that the overall POP activity increased during the placental development (Fig.
3A), more POP activity might be required in the spongiotrophoblast and TGCs at later gestation.
To reveal the physiological role of POP in mouse development, the identification of physiological
substrates is of great importance. The only peptide proven to be an in vivo substrate of POP is α-MSH in
the mouse pituitary (Perroud et al., 2009) and it is actually known to be present in the placenta (Krieger,
1982). In addition, some proline-containing bioactive peptides in the placenta, such as substance P,
angiotensin II, and oxytocin, could be substrates of POP (Gimpl et al., 2001; Marzioni et al., 2005;
Walther et al., 2008). Taking into account that POP is the only enzyme capable of hydrolyzing a peptide
containing proline residues, it should be indispensable for its processing or degradation. However,
POP-deficient mice reported by two groups seem to be normal in terms of reproduction and development
(Di Daniel et al., 2009; Warden et al., 2009), indicating that the accumulation of proline-containing
peptides was not toxic to murine cells. This suggests that POP may not be very important for normal
reproduction and development and it may instead play an essential role in disease prevention or stress
response. More detailed analyses of the knockout mice or other strategies will be required to reveal the
POP’s role in reproduction and development.
Subcellular distribution of POP.
We have also assessed subcellular localization of POP and found that POP was associated with the
cytoplasm and membrane in the placenta. This was based on the observation that there was no
POP-immunoreactivity in the nuclei of any placental cells (Fig. 4, 5), and that no POP protein signals and
no enzymatic activities were detected in the placental nuclear fractions prepared by two different methods
18

1
2
3
4
5
6
7
8
9
10
11
12
13
14
15
16
17
18
19
20
21
22
23
24
25
(Fig. 6). Although we can not completely rule out the possibility that a few placental cells contain the
nuclear POP or many placental cells contain a very low level of POP in the nuclei, the results indicate that
POP is predominantly localized to the cytoplasm and membrane in the mouse placenta.
Several immunohistochemical studies reported the subcellular distribution of POP and showed that
in addition to the cytoplasm, POP was localized to the membrane of neurons and to the nucleus in some
cultured cells and peripheral tissues (Myöhänen et al., 2008c; Schulz et al., 2005). More detailed studies
reported that POP was associated with microtubules in the perinuclear cytoplasm in glioma cells (Schulz
et al., 2005) and was attached to rough endoplasmic reticulum and Golgi apparatus in the rat brain
(Myöhänen et al., 2008b). These data indicate that the subcellular distribution of POP is different among
tissues and cells and suggest that POP has distinct roles in various tissues and cells.
It is notable that POP is not localized to the nucleus in the developing mouse placenta because the
nuclear POP is thought to be involved in the regulation of cell proliferation and differentiation. This role
of POP was first suggested by the finding that a specific POP inhibitor, ZTTA, inhibited DNA synthesis in
the cultured cells of flesh fly and mouse and POP was localized to the nuclei in the cells (Ishino et al.,
1998; Ohtsuki et al., 1997). Some of the recent studies also support this function by showing that POP
was localized to the nucleus in proliferating or differentiating cells (Hannula et al., 2010;
Moreno-Baylach et al., 2008). However, no particular mechanisms have yet been suggested, so it may
also be possible that the cytoplasmic and membrane-associated POP could participate in cell cycle
regulation. In fact, many proteins controlling the cell cycle are known to be localized to the cytoplasm
although the proteins involved in DNA synthesis are usually localized to the nucleus (Besson et al., 2008;
Kahl and Means, 2003; Sclafani and Holzen, 2007; Wilkinson and Millar, 2000). In case of the mouse
placenta, the cytoplasmic POP may play some role in cell cycle regulation, for example, by processing or
interacting with other proteins involved in the cell cycle. Alternatively, the mouse placental POP may not
even be involved in cell proliferation and have other roles.
19

1
2
3
4
5
6
7
8
9
10
11
12
13
14
15
16
17
18
19
20
21
22
23
24
25
Enzymatic activity of cytoplasmic and membrane-associated POP.
It is interesting that the cytoplasmic POP had a higher enzymatic activity than the
membrane-associated form, which is consistent with previous reports (Agirregoitia et al., 2003; Irazusta
et al., 2002; Tenorio-Laranga et al., 2008). The cytoplasmic POP was found in every placental cell by
immunohistochemistry, suggesting that it has a common function to many cells. The involvement in
intracellular protein degradation is one possibility. In this case, high POP activity is probably necessary
because there are many proline-containing peptides inside the cell and POP is the only enzyme to degrade
them. In contrast, the membrane-associated POP may have different roles. In our current protocol, the
membrane fraction could contain not only the plasma membrane but also other membranes such as the
endoplasmic reticulum and Golgi apparatus, so it could function in either intracellular or extracellular
environment. Considering that a previous study found POP localized to intracellular membranes rather
than the plasma membrane in neurons (Myöhänen et al., 2008b), and that we did not observe any strong
POP immunoreactivity in the plasma membrane, the membrane form of POP is more likely to function
inside the cell. Because intracellular POP has been reported to interact with other proteins and be able to
function without its peptidase activity (Di Daniel et al., 2009; Schulz et al., 2005), the placental
membrane POP may work irrespective of its enzymatic activity. If the membrane POP works
extracellularly, it could directly contact maternal blood in some TGCs and might process or digest
bioactive peptides in the blood. The lower POP activity in the membrane fraction might be a result of the
existence of various types of membrane POP possessing different activities. Further analysis will be
required for revealing the functions of the two forms of POP in different placental cells.
In conclusion, this work analyzed the temporal and spatial POP expression in the mouse placenta.
We determined the cell type expressing POP and found that the localization of POP becomes restricted to
the spongiotrophoblast cells and TGCs throughout placental development. We also found that the
20

1
2
3
4
5
6
7
8
9
10
11
12
13
14
15
16
17
18
19
20
21
22
23
24
25
placental POP was associated with the cytoplasm and membrane. These results suggest that the distinct
forms of POP have different roles in various placental cells.
Acknowledgements
We thank Dr. Hiroshi Kimura (Osaka University) for kindly gifting the antibody for histone H3. We also
thank Dr. Katsueki Ogiwara (Hokkaido University) for helpful technical advice and critical reading of the
manuscript. S.M. is a recipient of SUNBOR scholarship from SUNTORY Institute for Bioorganic
Research, Japan. This work was supported by Grants-in-aid for Scientific Research 19770048 and
21770068 (A.P.K.) from the Ministry of Education, Culture, Sports, Science and Technology, Japan.
References
Adamson SL, Lu Y, Whiteley KJ, Holmyard D, Hemberger M, Pfarrer C, Cross JC (2002) Interactions
between trophoblast cells and the maternal and fetal circulation in the mouse placenta. Dev Biol
250:358-373
Agirregoitia N, Bizet P, Agirregoitia E, Boutelet I, Peralta L, Vaudry H, Jégou S (2010) Prolyl
endopeptidase mRNA expression in the central nervous system during rat development. J Chem
Neuroanat 40:53-62
Agirregoitia N, Irazusta A, Ruiz F, Irazusta J, Gil J (2003) Ontogeny of soluble and particulate prolyl
endopeptidase activity in several areas of the rat brain and in the pituitary gland. Dev Neurosci
25:316-323
Bellemère G, Vaudry H, Mounien L, Boutelet I, Jégou S (2004) Localization of the mRNA encoding
21

1
2
3
4
5
6
7
8
9
10
11
12
13
14
15
16
17
18
19
20
21
22
23
24
25
prolyl endopeptidase in the rat brain and pituitary. J Comp Neurol 471:128-143
Besson A, Dowdy SF, Roberts JM (2008) CDK inhibitors: cell cycle regulators and beyond. Dev Cell
14:159-169
Di Daniel E, Glover CP, Grot E, Chan MK, Sanderson TH, White JH, Ellis CL, Gallagher KT, Uney J,
Thomas J, Maycox PR, Mudge AW (2009) Prolyl oligopeptidase binds to GAP-43 and functions
without its peptidase activity. Mol Cell Neurosci 41:373-382
Fuse Y, Polk DH, Lam RW, Reviczky AL, Fisher DA (1990) Distribution and ontogeny of
thyrotropin-releasing hormone degrading enzymes in rats. Am J Physiol 259:E787-791
Garcia-Horsman JA, Männistö PT, Venäläinen JI (2007) On the role of prolyl oligopeptidase in health
and disease. Neuropeptides 41:1-24
Gimpl G, Fahrenholz F (2001) The oxytocin receptor system: structure, function, and regulation. Physiol
Rev 81:629-683
Goossens F, Vanhoof G, De Meester I, Augustyns K, Borloo M, Tourwe D, Haemers A, Scharpé S
(1997) Development and evaluation of peptide-based prolyl oligopeptidase inhibitors--introduction of
N-benzyloxycarbonyl-prolyl-3-fluoropyrrolidine as a lead in inhibitor design. Eur J Biochem
250:177-183
Hannula MJ, Männistö PT, Myöhänen TT (2010) Sequential expression, activity and nuclear localization
of prolyl oligopeptidase protein in the developing rat brain. Dev Neurosci 33:38-47
Hersh LB (1981) Immunological, physical, and chemical evidence for the identity of brain and kidney
post-proline cleaving-enzyme. J Neurochem 37:172-178
Hitz C, Vogt-Weisenhorn D, Ruiz P, Wurst W, Floss T (2005) Progressive loss of the spongiotrophoblast
layer of Birc6/Bruce mutants results in embryonic lethality. Genesis 42:91-103
Hu D, Cross JC (2010) Development and function of trophoblast giant cells in the rodent placenta. Int J
Dev Biol 54:341-354
Irazusta J, Larrinaga G, González-Maeso J, Gil J, Meana JJ, Casis L (2002) Distribution of prolyl
22

1
2
3
4
5
6
7
8
9
10
11
12
13
14
15
16
17
18
19
20
21
22
23
24
25
endopeptidase activities in rat and human brain. Neurochem Int 40:337-345
Irazusta J, Silveira PF, Gil J, Varona A, Casis L (2001) Effects of hydrosaline treatments on prolyl
endopeptidase activity in rat tissues. Regul Pept 101:141-147
Ishino T, Ohtsuki S, Homma K, Natori S (1998) cDNA cloning of mouse prolyl endopeptidase and its
involvement in DNA synthesis by Swiss 3T3 cells. J Biochem 123:540-545
Kato T, Nakano T, Kojima K, Nagatsu T, Sakakibara S (1980) Changes in prolyl endopeptidase during
maturation of rat brain and hydrolysis of substance P by the purified enzyme. J Neurochem
35:527-535
Kahl CR, Means AR (2003) Regulation of cell cycle progression by calcium/calmodulin-dependent
pathways. Endocr Rev 24:719-736
Kimura A, Matsui H, Takahashi T (2002) Expression and localization of prolyl oligopeptidase in mouse
testis and its possible involvement in sperm motility. Zool Sci 19:93-102
Kimura A, Ohnishi J, Okimura H, Hamabata T, Takahashi T (1998) Localization of prolyl endopeptidase
mRNA in small growing follicles of porcine ovary. Mol Reprod Dev 50:121-127
Kimura A, Takahashi (2000) cDNA cloning of rat prolyl oligopeptidase and its expression in the ovary
during the estrous cycle. J Exp Zool 286:656-665
Kimura A, Yoshida I, Takagi N, Takahashi T (1999) Structure and localization of the mouse prolyl
oligopeptidase gene. J Biol Chem 274:24047-24053
Kimura H, Hayashi-Takanaka Y, Goto Y, Takizawa N, Nozaki N (2008) The organization of histone H3
modifications as revealed by a panel of specific monoclonal antibodies. Cell Struct Funct 33:61-73
Krieger DT (1982) Placenta as a source of 'brain' and 'pituitary' hormones. Biol Reprod 26:55-71
Marzioni D, Fiore G, Giordano A, Nabissi M, Florio P, Verdenelli F, Petraglia F, Castellucci M (2005)
Placental expression of substance P and vasoactive intestinal peptide: evidence for a local effect on
hormone release. J Clin Endocrinol Metab 90:2378-2383
Matsubara S, Takahashi T, Kimura AP (2010) Epigenetic patterns at the mouse prolyl oligopeptidase
23

1
2
3
4
5
6
7
8
9
10
11
12
13
14
15
16
17
18
19
20
21
22
23
24
25
gene locus suggest the CpG island in the gene body to be a novel regulator for gene expression. Gene
465:17-29
Matsubara Y, Ono T, Tsubuki S, Irie S, Kawashima S (1998) Transient up-regulation of a prolyl
endopeptidase activity in the microsomal fraction of rat liver during postnatal development. Eur J
Biochem 252:178-183
Moreno-Baylach MJ, Felipo V, Männistö PT, García-Horsman JA (2008) Expression and traffic of
cellular prolyl oligopeptidase are regulated during cerebellar granule cell differentiation, maturation,
and aging. Neuroscience 156:580-585
Myöhänen TT, Venäläinen JI, Tupala E, Garcia-Horsman JA, Miettinen R, Männistö PT (2007)
Distribution of immunoreactive prolyl oligopeptidase in human and rat brain. Neurochem Res
32:1365-1374
Myöhänen TT, Venäläinen JI, Garcia-Horsman JA, Männistö PT (2008a) Spatial association of prolyl
oligopeptidase, inositol 1, 4, 5-triphosphate type 1 receptor, substance P and its neurokinin-1 receptor
in the rat brain: an immunohistochemical colocalization study. Neuroscience 153:1177-1189
Myöhänen TT, Venäläinen JI, Garcia-Horsman JA, Piltonen M, Männistö PT (2008b) Cellular and
subcellular distribution of rat brain prolyl oligopeptidase and its association with specific neuronal
neurotransmitters. J Comp Neurol 507:1694-1708
Myöhänen TT, Venäläinen JI, García-Horsman JA, Piltonen M, Männistö PT (2008c) Distribution of
prolyl oligopeptidase in the mouse whole-body sections and peripheral tissues. Histochem Cell Biol
130:993-1003
Myöhänen TT, García-Horsman JA, Tenorio-Laranga J, Männistö PT (2009) Issues about the
physiological functions of prolyl oligopeptidase based on its discordant spatial association with
substrates and inconsistencies among mRNA, protein levels, and enzymatic activity. J Histochem
Cytochem 57:831-848
Ohta N, Takahashi T, Mori T, Park MK, Kawashima S, Takahashi K, Kobayashi H (1992) Hormonal
24

1
2
3
4
5
6
7
8
9
10
11
12
13
14
15
16
17
18
19
20
21
22
23
24
25
modulation of prolyl endopeptidase and dipeptidyl peptidase IV activities in the mouse uterus and
ovary. Acta Endocrinol (Copenh) 127:262-266
Ogiwara K, Takano N, Shinohara M, Murakami M, Takahashi T (2005) Gelatinase A and membrane-type
matrix metalloproteinases 1and 2 are responsible for follicle rupture during ovulation in the medaka.
Proc Natl Acad Sci USA 102:8442-8447
Ogiwara K, Takahashi T (2007) Specificity of the medaka enteropeptidase serine protease and its
usefulness as a biotechnological tool for fusion-protein cleavage. Proc Natl Acad Sci USA
104:7021-7026
Ohtsuki S, Homma K, Kurata S, Komano H, Natori S (1997) Nuclear localization and involvement in
DNA synthesis of Sarcophaga prolyl endopeptidase. J Biochem 121:1176-1181
Ohtsuki S, Homma K, Kurata S, Komano H, Natori S (1994) A prolyl endopeptidase of Sarcophaga
peregrina (flesh fly): its purification and suggestion for its participation in the differentiation of the
imaginal discs. J Biochem 115:449-453
Perroud B, Alvarado RJ, Espinal GM, Morado AR, Phinney BS, Warden CH (2009) In vivo multiplex
quantitative analysis of 3 forms of alpha melanocyte stimulating hormone in pituitary of prolyl
endopeptidase deficient mice. Mol Brain 2:14
Rennex D, Hemmings BA, Hofsteenge J, Stone SR (1991) cDNA cloning of porcine brain prolyl
endopeptidase and identification of the active-site seryl residue. Biochemistry 30:2195-2203
Rossant J, Cross JC (2001) Placental development: lessons from mouse mutants. Nat Rev Genet
2:538-548
Salers P (1994) Evidence for the presence of prolyl oligopeptidase and its endogenous inhibitor in
neonatal rat pancreatic beta-cells. Regul Pept 50:235-245
Schulz I, Zeitschel U, Rudolph T, Ruiz-Carrillo D, Rahfeld JU, Gerhartz B, Bigl V, Demuth HU, Rossner
S (2005) Subcellular localization suggests novel functions for prolyl endopeptidase in protein
secretion. J Neurochem 94:970-979
25

1
2
3
4
5
6
7
8
9
10
11
12
13
14
15
16
17
18
19
20
21
22
23
24
25
Sclafani RA, Holzen TM (2007) Cell cycle regulation of DNA replication. Annu Rev Genet 41:237-280
Shirasawa Y, Osawa T, Hirashima A (1994) Molecular cloning and characterization of prolyl
endopeptidase from human T cells. J Biochem 115:724-729
Simmons DG, Cross JC (2005) Determinants of trophoblast lineage and cell subtype specification in the
mouse placenta. Dev Biol 284:12-24
Simmons DG, Fortier AL, Cross JC (2007) Diverse subtypes and developmental origins of trophoblast
giant cells in the mouse placenta. Dev Biol 304:567-578
Soeda S, Ohyama M, Yamakawa N, Shimeno H, Nagamatsu A (1984) Two molecular species of proline
endopeptidase in human plasma: isolation and characterization. Chem Pharm Bull 32:4061-4069
Soeda S, Yamakawa N, Ohyama M, Shimeno H, Nagamatsu A (1985) An inhibitor of proline
endopeptidase: purification from rat brain and characterization. Chem Pharm Bull (Tokyo)
33:24445-24451
Takahashi T, Athauda SBP, Mori T, Kawashima S, Matsushima M, Ichinose M, Miki K, Takahashi K
(1996) Prolyl endopeptidase from the follicular fluid of porcine ovary: Comparison with the liver
enzyme. Biomed Res 17:435-442
Tenorio-Laranga J, Venäläinen JI, Männistö PT, Garcia-Horsman JA (2008) Characterization of
membrane-bound prolyl endopeptidase from brain. FEBS J 275:4415-4427
Walter R, Shlank H, Glass JD, Schwartz IL, Kerenyi TD (1971) Leucylglycinamide released from
oxytocin by human uterine enzyme. Science 173:827-829
Walther T, Jank A, Heringer-Walther S, Horn LC, Stepan H (2008) Angiotensin II type 1 receptor has
impact on murine placentation. Placenta 29:905-909
Warden CH, Fisler JS, Espinal G, Graham J, Havel PJ, Perroud B (2009) Maternal influence of prolyl
endopeptidase on fat mass of adult progeny. Int J Obes (Lond) 33:1013-1022
Watson ED, Cross JC (2005) Development of structures and transport functions in the mouse placenta.
Physiology (Bethesda) 20:180-193
26

1
2
3
4
5
6
7
8
9
10
11
12
13
14
15
16
17
18
19
20
21
22
23
24
25
Welches WR, Brosnihan KB, Ferrario CM (1993) A comparison of the properties and enzymatic
activities of three angiotensin processing enzymes: angiotensin converting enzyme, prolyl
endopeptidase and neutral endopeptidase 24.11. Life Sci 52:1461-1480
Wilkinson MG, Millar JB (2000) Control of the eukaryotic cell cycle by MAP kinase signaling pathways.
FASEB J 14:2147-2157
Wilk S (1983) Prolyl endopeptidase. Life Sci 33:2149-2157
Williams RSB (2004) Prolyl oligopeptidase and bipolar disorder. Clin Neurosci Res 4:233-242
Yamanaka C, Lebrethon MC, Vandersmissen E, Gerard A, Purnelle G, Lemaitre M, Wilk S, Bourguignon
JP (1999) Early prepubertal ontogeny of pulsatile gonadotropin-releasing hormone (GnRH) secretion:
I. Inhibitory autofeedback control through prolyl endopeptidase degradation of GnRH. Endocrinology
140:4609-4615
Figure Legends
Fig. 1. Northern blot analysis of POP in various mouse tissues. Total RNA was prepared from the
indicated 16 mouse tissues and twenty micrograms of the RNA was electrophoresed and blotted to a
nylon membrane. The blot was hybridized with a 32P-labeled mouse POP cDNA probe and the signals
were detected by autoradiography. The electrophoretic image of 28S and 18S ribosomal RNAs showed
that a similar amount of total RNA was used among these tissues.
Fig. 2. Localization of POP mRNA in the mouse placenta. (A) Placentas were collected from pregnant
mice on the indicated embryonic days. Four continuous sections (10 µm) were prepared for each placenta
and hybridized with digoxigenin-labeled sense or antisense probes for POP or Flt1. The signals were
detected by an alkaline phosphatase reaction with the nitroblue tetrazolium/5-bromo-4-chloro-3-indolyl
27

1
2
3
4
5
6
7
8
9
10
11
12
13
14
15
16
17
18
19
20
21
22
23
24
25
phosphate substrate. The Flt1 probe was used as a marker gene for the spongiotrophoblast cell. Probes
used are indicated on the left of the images. High POP mRNA expression was observed in the
spongiotrophoblast of the junctional zone and the labyrinth layer at E10.5 and E11.5 and only in the
spongiotrophoblast thereafter. Note that the POP signal is not very strong in some sections due to the
difference of the staining time. The scale bar represents 1 mm. Jz, junctional zone; La, labyrinth; Md,
maternal decidua. (B) Enlarged images of the boxed regions of E11.5 and E15.5 placentas in A are shown
at right. Each image represents the labyrinth and the junctional zone, respectively. To show the
morphology of each placental region, images with hematoxylin and eosin staining (HE staining) are also
provided at left. While most cells were stained in the labyrinth at E11.5, only S-TGC was positive in the
E15.5 placenta. P-TGC, spongiotrophoblast cells, and decidual cells were positive for the POP mRNA
signal at both stages. The scale bar represnts 50 µm. Md, maternal decidua; P-TGC, parietal-trophoblast
giant cell; SpT, spongiotrophoblast; S-TGC, sinusoidal-trophoblast giant cell.
Fig. 3. POP protein expression in the mouse placenta. (A) Placental POP activity during gestation.
Soluble tissue extracts from placentas (E10.5-E18.5) were prepared and specific POP activity toward
Sac-Gly-Pro-Leu-Gly-Pro-MCA was measured. The enzymatic reaction was performed at 37°C for 20
min. The activity was expressed as the amount of AMC released per minute per mg protein under the
condition. The data are shown as the average ± SD from six independent experiments with three tissues
and analyzed by one-way ANOVA followed by Tukey’s post hoc test. n=6; F=14.59; **, P<0.01
compared to E10.5. (B) Confirmation of the specificity of the POP antibody generated in this study.
Western blot analysis was conducted with soluble extracts of the mouse placenta (E18.5) and brain as
well as the purified recombinant POP (rPOP) containing 52 extra amino acids (+ 52 a.a.). The samples
were separated by SDS-PAGE with an 8% gel and blotted to a PVDF membrane. After the blocking with
Block Ace and normal rabbit serum sequentially, the membrane was incubated with the purified anti-POP
antibody (3 lanes at left). The membranes were then incubated with horseradish peroxidase conjugated
28

1
2
3
4
5
6
7
8
9
10
11
12
13
14
15
16
17
18
19
20
21
22
23
24
25
secondary antibody and the signals were developed using an Immobilon Western Chemiluminescent HRP
Substrate. The experiment was also performed by using the POP antibody preincubated with the rPOP and
this resulted in the complete elimination of the POP band (Pre-absorbed, 3 lanes at right). β-actin was
used as an internal control. Positions of molecular marker bands are indicated at left. (C, D) Western blot
analysis of POP in various stages of mouse placentas. Western blot was conducted as in B using soluble
placental extracts (E10.5-E18.5). We repeated the experiment three times, measured the intensity of each
band using the Image J program, and normalized the POP signal to β-actin. The resulting graph is shown
in C and a representative Western result is indicated in D. The data are shown as the average ± SD and
analyzed by one-way ANOVA followed by Tukey’s post hoc test. n=3; F=0.36.
Fig. 4. Immunohistochemistry of POP in the E11.5 placenta. The placenta was fixed in Bouin’s solution,
embedded in paraffin, and sectioned at 6 µm. The slides were dewaxed, boiled in 10 mM citric acid buffer,
and treated with 2.25% H2O2. After the blocking with Block Ace followed by normal rabbit serum, the
slides were incubated with the purified anti-POP polyclonal antibody and then with HRP conjugated
secondary antibody. The signals were developed using AEC Peroxidase Substrate kit. POP
immunoreactivity is indicated by red color. Images before (A, C, F) and after counter staining with
Carazzi’s hematoxylin (D, F) are shown. Three layers are outlined by dashed lines in A. Panels A and B
are pictures with low magnification and B represents a control section treated with the primary antibody,
which was preincubated with the recombinant POP protein, showing no positive signals. Magnified
images of the junctional zone and maternal decidua (C, D) and the labyrinth layer (E, F) are indicated.
The scale bar represents 200 µm in A and B and 50 µm in the other pictures. Al, allantois; Jz, junctional
zone; La, labyrinth; Md, maternal decidua; P-TGC, parietal TGC; SpT, spongiotrophoblast cell; S-TGC,
sinusoidal TGC.
Fig. 5. Immunohistochemistry of POP in the E16.5 (A-L) and E18.5 placentas (M-X).
29

1
2
3
4
5
6
7
8
9
10
11
12
13
14
15
16
17
18
19
20
21
22
23
24
25
Immunohistochemistry was performed as in Fig. 4. POP immunoreactivity is indicated by red color.
Images before (A, C, E, G, I, K, M, O, Q, S, U, W) and after counter staining with Carazzi’s hematoxylin
(D, F, H, J, L, P, R, T, V, X) are shown. Three layers are outlined by dashed lines in A, B, M, and N and
these panels are pictures with low magnification. B and N indicate control sections treated with the
primary antibody, which was preincubated with the recombinant POP protein, showing no positive signals.
Magnified images of the junctional zone (C, D, O-R) and the labyrinth layer (E-H, S-V) are indicated. In
the E16.5 placenta, the glycogen trophoblast cell and the allantois are further enlarged in I-L. In the E18.5
placenta, we could also identify SpA-TGC (W, X). The scale bar represents 200 µm in A, E, I, and M and
50 µm in the other pictures. Al, allantois; C, canal lumen; C-TGC, canal-associated TGC; GlyT, glycogen
trophoblast cell; Jz, junctional zone; La, labyrinth; Md, maternal decidua; P-TGC, parietal TGC; SpA,
spiral artery lumen; SpA-TGC; spiral artery-associated TGC; S-TGC, sinusoidal TGC; SpT,
spongiotrophoblast cell.
Fig. 6. Subcellular distribution of POP in the mouse placenta. (A) The cytoplasmic and membrane
subfraction (C+M) were separated from the nucleus (N) using E10.5 and E15.5 placentas. Specific POP
activity of each fraction was measured as in Fig. 3A but the enzymatic reaction was performed for 60 min.
The data are shown as the average ± SD from six independent experiments with three tissues and
analyzed by Student's t test. n=6; **, P < 0.01 compared with N fraction of each stage of placenta. (B)
Western blot analysis was performed as in Fig. 3B using the C+M and N fractions prepared in A. (C) The
extracts from E11.5 and E16.5 placentas were fractionated into cytoplasmic (C), membrane (M), and
nuclear (N) subfractions. The enzymatic activity assay was conducted as in A. The enzyme activity assay
was conducted independently six times with three tissues. The data were analyzed by one-way ANOVA
followed by Tukey’s post hoc test. n=6; F=113.12 and 454.72 in the E11.5 and E16.5 placenta,
respectively; **, P < 0.01 compared with N fraction of each placenta. (D) Western blot analysis was
repeated three times and a representative result is shown. The intensity of each band was measured by
30

1
2
3
4
5
6
7
8
using Image J program and the POP signal was normalized to β-actin and indicated as a graph. The
antibodies against histone H3 and connexin-43 were used as markers of the nucleus and plasma
membrane, respectively. A non-specific band was somehow detected just below the connexin-43 band in
the E11.5 placenta. The data are shown as the average ± SD from three independent experiments with two
tissues and analyzed by one-way ANOVA followed by Tukey’s post hoc test. n=3; F=9.07 and 14.48 in
the E11.5 and E16.5 placenta, respectively; *, P<0.05 and **, P<0.01 compared with N fraction of each
placenta.
31

Table 1 POP expression summary of the immunohistochemistry.
E11.5 E16.5 E18.5
maternal decidua decidual cell ++ ++ ++ SpA-TGC ND ND +++ P-TGC +++ +++ +++ junctional zone spongiotrophoblast cell +++ +++ +++ glycogen trophoblast cell * + + labyrinth layer S-TGC +++ +++ +++ C-TGC ND +++ +++ allantois - - - other cells +++ +/-** +/-**
*, Glycogen trophoblast cells are not present in E11.5 placenta. **, Most cells are negative, but some cells may have weak POP-immunoreactivity. SpA-TGC, spiral artery-associated TGC; P-TGC, parietal TGC; S-TGC, sinusoidal TGC; C-TGC, canal-associated TGC; ND, not determined

POP
18S rRNA
28S rRNA
Brain
Epid
idym
isHe
art
Kidn
eyLi
ver
Lung
Ovar
yOv
iduc
tPi
tuita
ryPl
acen
taPr
ostat
eSk
. Mus
cleSm
. Int
estin
eSp
leen
Testi
sUt
erus
Fig.1

66
97116
200(kDa)
45
66
45
97116
200(kDa)
(72 kDa)
(80 kDa)
(72 kDa)
β-actin
POP
E10.5
E11.5
E12.5
E13.5
E14.5
E15.5
E16.5
E17.5
E18.5
E10.5
E11.5
E12.5
E13.5
E14.5
E15.5
E16.5
E17.5
E18.5
E18.5
Plac
enta
Brain
rPOP
+ 52
a.a.
rPOP
+ 52
a.a.
E18.5
Plac
enta
Brain
POPrPOP
β-actin
Rel
ativ
e Ex
pres
sion
(PO
P/β-
actin
)
00.20.40.60.81.01.21.4
A C
DB
0
2
4
6
8
10
12
(nm
ol/m
in/m
g pr
otei
n)R
elat
ive
POP
Act
ivity
E10.5
E11.5
E12.5
E13.5
E14.5
E15.5
E16.5
E17.5
E18.5
Pre-absorbed
Fig.3
**


C
DE10.5 E15.5
A B
POP
Fig.6E11.5 E16.5
0123456789
C M N C M N
Rel
ativ
e PO
P A
ctiv
ity(n
mol
/min
/mg
prot
ein)
Rel
ativ
e PO
P A
ctiv
ity(n
mol
/min
/mg
prot
ein)
0123456789
E10.5 E15.5C+M C+MN N
C+M N C+M N**
**
****
E11.5 E16.5
Rel
ativ
e Ex
pres
sion
(PO
P/β-
actin
)
POP
β-actin
Histone H3
Connexin-43
00.20.40.60.81.01.2
C M N C M N
***