Embed Size (px)
Citation preview

1Angel and Shreiner: Interactive Computer Graphics 6E © Addison-Wesley 2012
What is Computer Graphics?
靜宜大學 資訊工程系蔡奇偉 副教授2012 - 2014

2Angel and Shreiner: Interactive Computer Graphics 6E © Addison-Wesley 2012
Objectives
• In this lecture, we explore what computer graphics is about and survey some application areas
•We start with a historical introduction

3Angel and Shreiner: Interactive Computer Graphics 6E © Addison-Wesley 2012
Computer Graphics
•Computer graphics deals with all aspects of creating images with a computer
Hardware
Software
Applications

4Angel and Shreiner: Interactive Computer Graphics 6E © Addison-Wesley 2012
Example
•Where did this image come from?
•What hardware/software did we need to produce it?

5Angel and Shreiner: Interactive Computer Graphics 6E © Addison-Wesley 2012
Preliminary Answer
•Application: The object is an artist’s rendition of the sun for an animation to be shown in a domed environment (planetarium)
•Software: Maya for modeling and rendering but Maya is built on top of OpenGL
•Hardware: PC with graphics card for modeling and rendering

Applications of CG
•Display Information Business Charts, Medical Images (CT, MRI,
PET), Scientific Visualization
•Design CAD/CAM, VLSI
•Simulation•Animation•User Interface
6Angel and Shreiner: Interactive Computer Graphics 6E © Addison-Wesley 2012
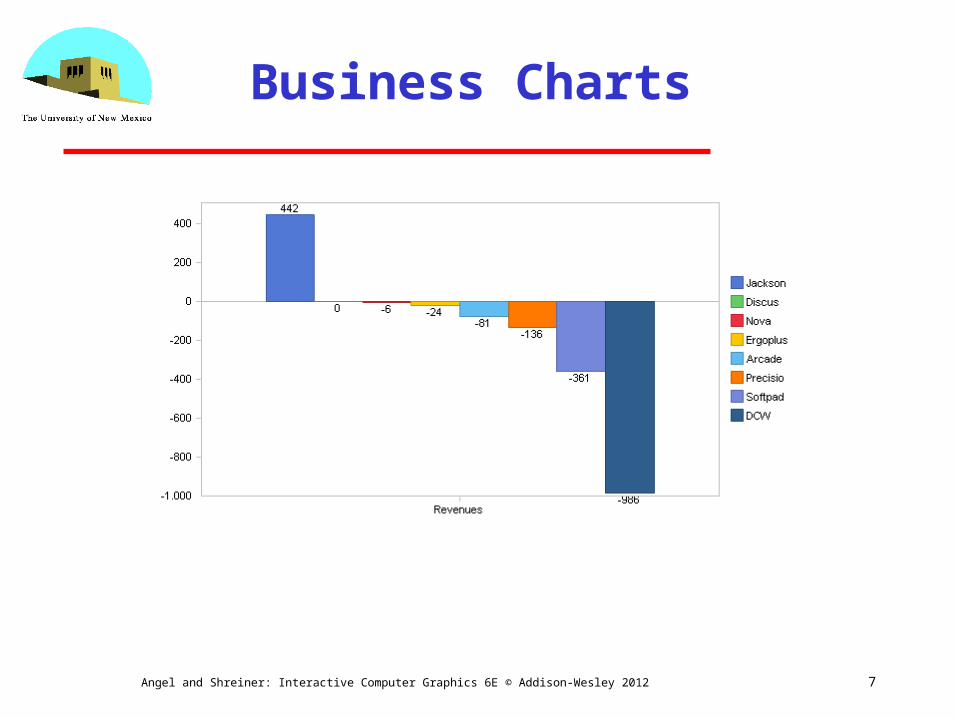
Business Charts
7Angel and Shreiner: Interactive Computer Graphics 6E © Addison-Wesley 2012

Business Charts
8Angel and Shreiner: Interactive Computer Graphics 6E © Addison-Wesley 2012

Medical Images
9Angel and Shreiner: Interactive Computer Graphics 6E © Addison-Wesley 2012

Medical Images
10Angel and Shreiner: Interactive Computer Graphics 6E © Addison-Wesley 2012
A brain MRI representation

11Angel and Shreiner: Interactive Computer Graphics 6E © Addison-Wesley 2012
In the high-resolution x-ray computed tomography (CT) images on the bottom, denser areas, such as bone, are brighter. In the fused view in the top three panels, the positron emission tomography (PET) image is overlaid, where hotter colors represent increased metabolic activity. Increased metabolism in the heart wall and brain are clearly visible. Also visible below the brain (middle PET image) is a focus of increased activity from a thyroid cancer. The combined anatomical and metabolic information was important for the planning of the successful surgery for the patient.

12Angel and Shreiner: Interactive Computer Graphics 6E © Addison-Wesley 2012

Scientific Visualization
13Angel and Shreiner: Interactive Computer Graphics 6E © Addison-Wesley 2012
A scientific visualization of an extremely large simulation of a Rayleigh–Taylor instability caused by two mixing fluids.

Scientific Visualization
14Angel and Shreiner: Interactive Computer Graphics 6E © Addison-Wesley 2012
Using visualization techniques, the overall 3D four-helix bundle structure of the molecule is represented as a ribbon model. The 3D image of this molecule helps researchers better understand it and its interaction with other molecules.

Scientific Visualization
15Angel and Shreiner: Interactive Computer Graphics 6E © Addison-Wesley 2012
Solar system image of the main asteroid belt and the Trojan asteroids.
Scientific visualization of Fluid Flow: Surface waves in water.

Design
16Angel and Shreiner: Interactive Computer Graphics 6E © Addison-Wesley 2012

Design
17Angel and Shreiner: Interactive Computer Graphics 6E © Addison-Wesley 2012

Design
18Angel and Shreiner: Interactive Computer Graphics 6E © Addison-Wesley 2012

Flight Simulator
19Angel and Shreiner: Interactive Computer Graphics 6E © Addison-Wesley 2012
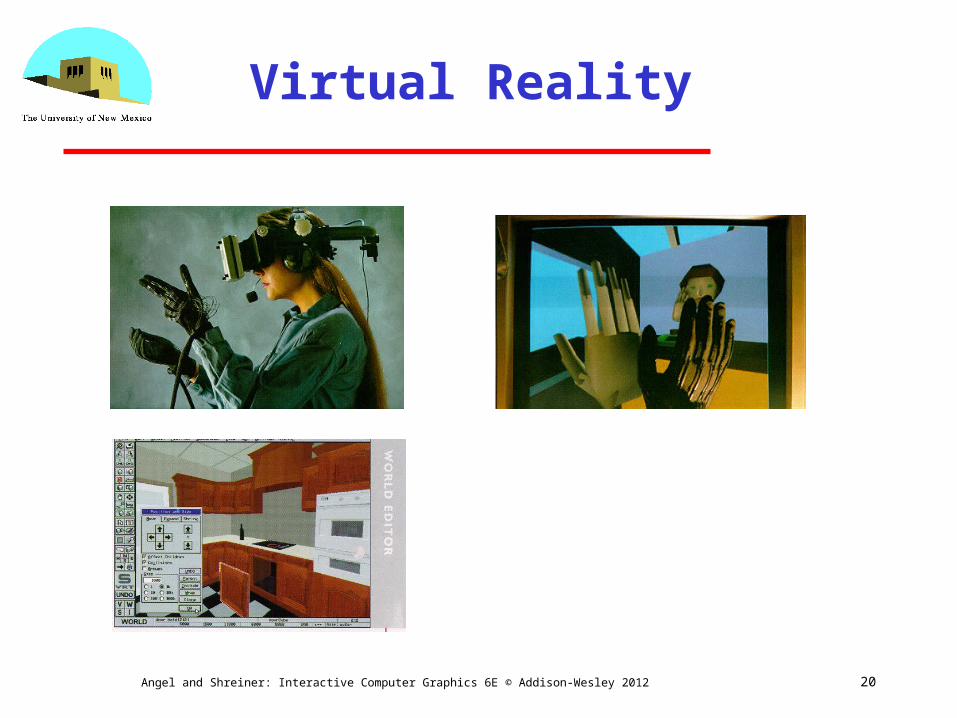
Virtual Reality
20Angel and Shreiner: Interactive Computer Graphics 6E © Addison-Wesley 2012

Virtual Reality
21Angel and Shreiner: Interactive Computer Graphics 6E © Addison-Wesley 2012
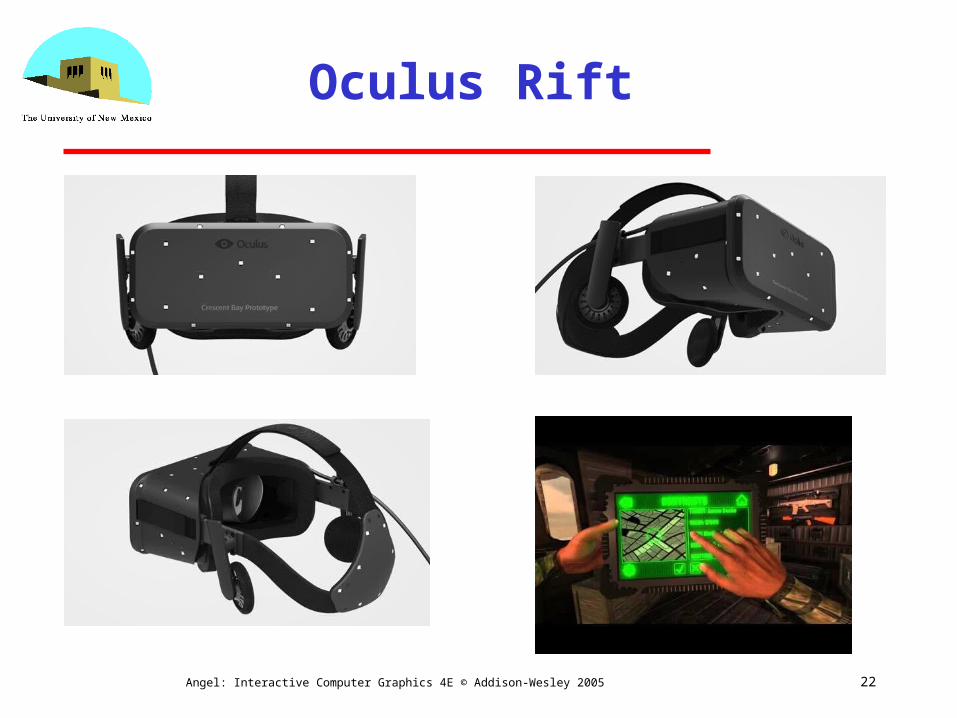
Oculus Rift
22Angel: Interactive Computer Graphics 4E © Addison-Wesley 2005

Samsung Gear VR
23Angel: Interactive Computer Graphics 4E © Addison-Wesley 2005

Sony VR
24Angel: Interactive Computer Graphics 4E © Addison-Wesley 2005

Animations
25Angel and Shreiner: Interactive Computer Graphics 6E © Addison-Wesley 2012

Graphical User Interface (GUI)
26Angel and Shreiner: Interactive Computer Graphics 6E © Addison-Wesley 2012
In computing, a graphical user interface (GUI, commonly pronounced gooey) is a type of user interface that allows users to interact with electronic devices with images rather than text commands. GUIs can be used in computers, hand-held devices such as MP3 players, portable media players or gaming devices, household appliances and office equipment. A GUI represents the information and actions available to a user through graphical icons and visual indicators such as secondary notation, as opposed to text-based interfaces, typed command labels or text navigation. The actions are usually performed through direct manipulation of the graphical elements.

27Angel and Shreiner: Interactive Computer Graphics 6E © Addison-Wesley 2012
Basic Graphics System
Input devicesOutput device
Image formed in frame buffer

CRT
28Angel and Shreiner: Interactive Computer Graphics 6E © Addison-Wesley 2012
Can be used either as a line-drawing device (calligraphic) or to display contents of frame buffer (raster mode)

Mask
29Angel and Shreiner: Interactive Computer Graphics 6E © Addison-Wesley 2012

Flat Panel Display
30Angel and Shreiner: Interactive Computer Graphics 6E © Addison-Wesley 2012

31Angel and Shreiner: Interactive Computer Graphics 6E © Addison-Wesley 2012
Computer Graphics: 1950-1960
•Computer graphics goes back to the earliest days of computing
Strip charts
Pen plotters
Simple displays using A/D converters to go from computer to calligraphic CRT
•Cost of refresh for CRT too high Computers slow, expensive, unreliable

32Angel and Shreiner: Interactive Computer Graphics 6E © Addison-Wesley 2012
Computer Graphics: 1960-1970
•Wireframe graphics Draw only lines
•Sketchpad•Display Processors•Storage tube
wireframe representationof sun object

33Angel and Shreiner: Interactive Computer Graphics 6E © Addison-Wesley 2012
Sketchpad
• Ivan Sutherland’s PhD thesis at MIT Recognized the potential of man-machine
interaction
Loop• Display something• User moves light pen• Computer generates new display
Sutherland also created many of the now common algorithms for computer graphics

34Angel and Shreiner: Interactive Computer Graphics 6E © Addison-Wesley 2012
Display Processor
• Rather than have the host computer try to refresh display use a special purpose computer called a display processor (DPU)
• Graphics stored in display list (display file) on display processor
• Host compiles display list and sends to DPU

35Angel and Shreiner: Interactive Computer Graphics 6E © Addison-Wesley 2012
Direct View Storage Tube
•Created by Tektronix Did not require constant refresh
Standard interface to computers• Allowed for standard software• Plot3D in Fortran
Relatively inexpensive• Opened door to use of computer graphics for CAD
community

36Angel and Shreiner: Interactive Computer Graphics 6E © Addison-Wesley 2012
Computer Graphics: 1970-1980
•Raster Graphics•Beginning of graphics standards
IFIPS (International Federation of Information Processing Societies)• GKS: European effort
– Becomes ISO 2D standard• Core: North American effort
– 3D but fails to become ISO standard
•Workstations and PCs

37Angel and Shreiner: Interactive Computer Graphics 6E © Addison-Wesley 2012
Raster Graphics
• Image produced as an array (the raster) of picture elements (pixels) in the frame buffer

38Angel and Shreiner: Interactive Computer Graphics 6E © Addison-Wesley 2012
Raster Graphics
•Allows us to go from lines and wire frame images to filled polygons

39Angel and Shreiner: Interactive Computer Graphics 6E © Addison-Wesley 2012
PCs and Workstations
•Although we no longer make the distinction between workstations and PCs, historically they evolved from different roots
Early workstations characterized by• Networked connection: client-server model• High-level of interactivity
Early PCs included frame buffer as part of user memory
• Easy to change contents and create images

40Angel and Shreiner: Interactive Computer Graphics 6E © Addison-Wesley 2012
Computer Graphics: 1980-1990
Realism comes to computer graphics
smooth shading environment mapping
bump mapping

41Angel and Shreiner: Interactive Computer Graphics 6E © Addison-Wesley 2012
Computer Graphics: 1980-1990
•Special purpose hardware Silicon Graphics geometry engine
• VLSI implementation of graphics pipeline
• Industry-based standards PHIGS
RenderMan
•Networked graphics: X Window System•Human-Computer Interface (HCI)

42Angel and Shreiner: Interactive Computer Graphics 6E © Addison-Wesley 2012
Computer Graphics: 1990-2000
•OpenGL API•Completely computer-generated feature-length movies (Toy Story) are successful
•New hardware capabilities Texture mapping
Blending
Accumulation, stencil buffers
43Angel and Shreiner: Interactive Computer Graphics 6E © Addison-Wesley 2012
Computer Graphics: 2000-
•Photorealism•Graphics cards for PCs dominate market
Nvidia, ATI
•Game boxes and game players determine direction of market
•Computer graphics routine in movie industry: Maya, Lightwave
•Programmable pipelines