Embed Size (px)
Citation preview

1
based on
Federal Highway Administration Capability Maturity Model Workshops
Transportation Systems Management and Operations (TSM&O)
Performance Measurement Dimension
Challenges and Opportunities from a State DOT Perspective
Subrat MahapatraMaryland State Highway Administration
2
Presentation Focus
“why you implemented performance measures in the first place and what you get out of them…”
as it relates to Maryland TSM&O/ Mobility/ Reliability Improvement efforts

3
TSM&O at SHA
• Existing Business Processes at SHA have stable TSM&O components built-in at all levels across the agency
• SHA Recipient of FHWA SHRP2 L06 Implementation Assistance to “Organize for Reliability” – opportunity to review and refocus priorities
• CMM workshops facilitated TSM&O related conversations internally and externally. Outcome of the L06 project will be a SHA TSM&O Strategic/ Implementation Plan

4
TSM&O Performance Measurement Action Items
• Develop TSM&O data business plan• Develop and implement a travel time reliability
monitoring program• Develop modeling plan and tools for supporting TSM&O
analysis• Other related initiatives (e.g., WZPMA, Freight Fluidity)
Level 1 — Performed 2 — Managed 3 — Integrated 4 — Optimized
Criteria Some outputs measured and reported—but not utilized
Output data used regularly for after-action debriefings and improvements; data easily available and dashboarded
Outcome measures identified (networks, modes, impacts) and routinely utilized for objective-based program improvements
Performance measures reported internally for utilization and externally for accountability and program justification
SHA Self Evaluation in the Performance Measurement Dimension
5
TSM&O Key Opportunity Areas
• TSM&O as a program (similar to SHSP)• Integrated freeways and arterial systems M&O• Arterials Ops is the next big opportunity area• Freight consideration and multi-modal aspects• Performance Metrics that considers ICM, ramp
metering and other strategies• Performance metrics that compares traditional
projects with TSM&O projects• Risk/ Uncertainty analysis tools
6
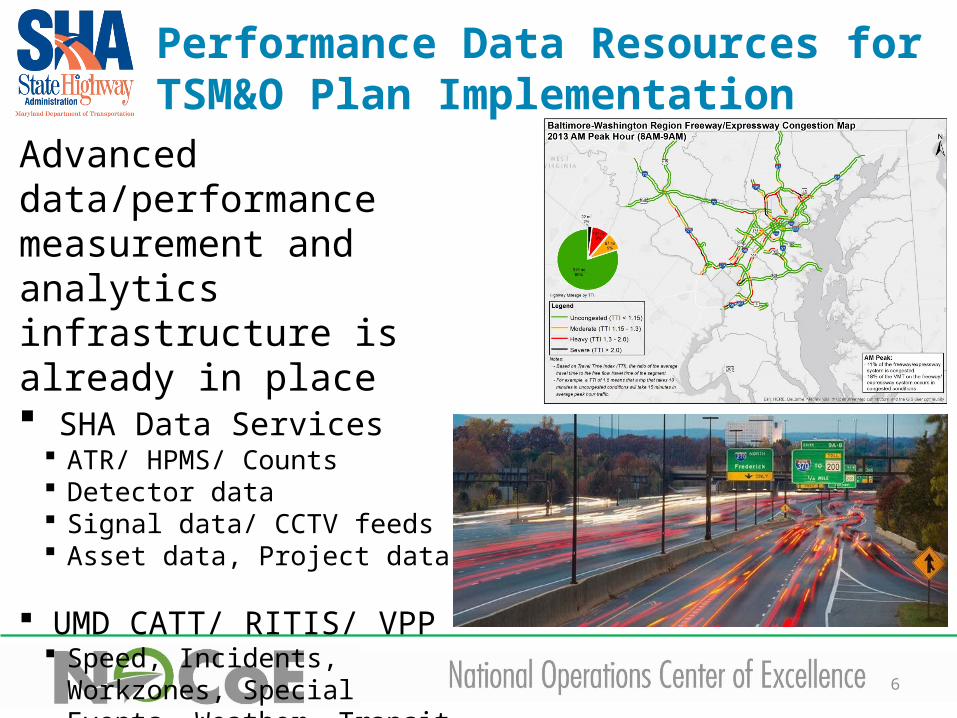
Performance Data Resources for TSM&O Plan Implementation
Advanced data/performance measurement and analytics infrastructure is already in place SHA Data Services
ATR/ HPMS/ Counts Detector data Signal data/ CCTV feeds Asset data, Project data
UMD CATT/ RITIS/ VPP Speed, Incidents, Workzones,
Special Events, Weather, Transit etc.

7
Freeway and Arterial Performance Measures

8
TSM&O at SHA – Outcome Focused
SHA Policies, Programs and Projects focus on Annual User Cost Savings
Outcome driven decisions – e.g CHART expansion to 24/7 operations

9
TSM&O at SHA – Outcome Focused
CHART Operations• Incident Management
– Annual User Cost Savings– Average Incident Duration
• Traveler Information Systems– # of CHART Controllable Cameras– # of Maryland 511 Calls Received
• Work zone Management• Winter Weather Operations• Special Event Management• TIM Training

10
Improving Reliability on Maryland Highways
SHAs FOUR-STEP APPROACH
CAUSES OF UNRELIABILITY Poorly Timed Traffic Signals
Inclement Weather Crashes
Fluctuations in Demand Work Zones
SHA developed a Reliability Roadmap in Summer 2014
Phased Approach to develop a comprehensive program that improves reliability of our system
SHRP2 Projects (L38, L06, R11) help advance Roadmap task activities.

11
Communicating Performance thru DashboardsSHA Mobility Dashboard
• Web-based Solution • Performance Based Approach• Increase Transparency

12
Communicating Performance thru DashboardsRITIS Work zone Dashboard
13
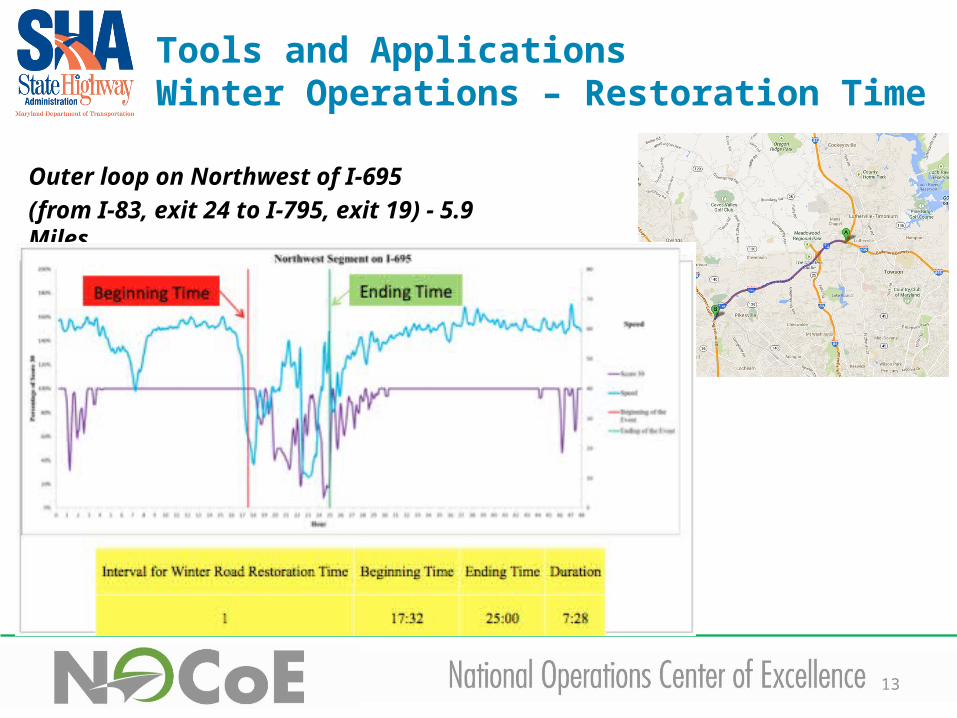
Tools and ApplicationsWinter Operations – Restoration Time
Outer loop on Northwest of I-695 (from I-83, exit 24 to I-795, exit 19) - 5.9 Miles

14
Before/ After Performance MeasurementInterCounty Connector Case Study
Uncongested42%
Light29%
Moderate24%
Severe5%
2012
Uncongested20%
Light31%
Moderate41%
Severe8%
2010
PM Peak Hour (5:00-6:00 pm)
Before After
Use of probe speed data to understand the congestion and reliability of the transportation network.
15
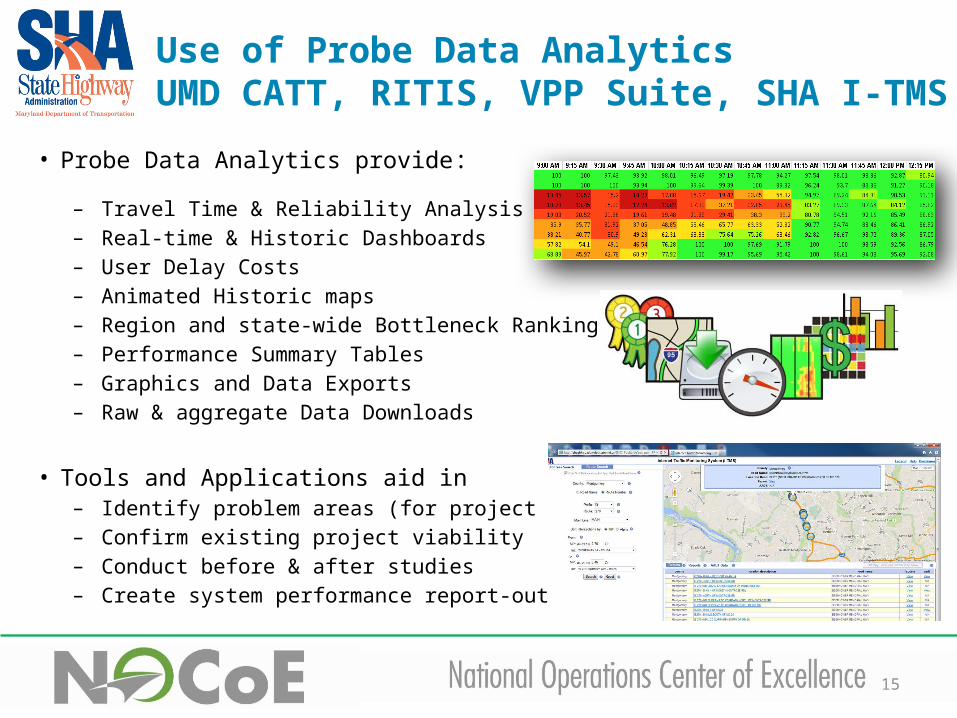
Use of Probe Data Analytics UMD CATT, RITIS, VPP Suite, SHA I-TMS
• Probe Data Analytics provide:
– Travel Time & Reliability Analysis– Real-time & Historic Dashboards– User Delay Costs– Animated Historic maps– Region and state-wide Bottleneck Ranking– Performance Summary Tables– Graphics and Data Exports– Raw & aggregate Data Downloads
• Tools and Applications aid in– Identify problem areas (for project development)– Confirm existing project viability– Conduct before & after studies– Create system performance report-outs, and more

16
Forecasting/ Evaluating Performance thru’Advanced Modeling Tools
SHA is developing multi-resolution and time-dependent travel demand models for integrated planning and operations
KEY FEATURESo Data Hubo Multi-resolution networko Statewide Model/ DTAo Corridor/ Sub-area AgBM/ DTAo ABM/ DTA Integration

17
Inp
ut
& O
utp
ut
Mea
sure
s
Next StepsPerformance Measurement to Management
Bu
sin
ess
Pro
cess
es
Reliable Datasets
Data Business Plan
Sys
tem
s an
d
Tech
no
log
y
Outcome based Performance Management
for TSM&O
Analytical Engines
Contact Information:
Subrat MahapatraOffice of Planning and Preliminary Engineering Maryland State Highway AdministrationPhone: 410-545-5649E-mail: [email protected]


![JUSTIFICACIÓN NECESIDAD MODELO DE MEJORA DE PROCESOS DE ...pegasus.javeriana.edu.co/~CIS1030IS04/documents/Rigor_Entregable 2... · CMMI (Capability Maturity Model Integration) [11];](https://img.pdfslide.tips/doc/110x75/5ba3d1d509d3f2a9218c2831/justificacion-necesidad-modelo-de-mejora-de-procesos-de-cis1030is04documentsrigorentregable.jpg)