Embed Size (px)
Citation preview


## April
1. Housing market ・・・・・・ P3
(1). Listing volume
1. REINS registered properties ・・・・・・ P4
2. REINS inventory ・・・・・・ P4
(2). Contracts concluded
1. REINS contracts concluded ・・・・・・ P5
2. Registered transfer of titles due to purchase and sale ・・・・・・ P5
(3). Price trends
1. REINS contract unit price, Unit price per sqm ・・・・・・ P6
2. Officially published land prices ・・・・・・ P7
3. JREI home price indices ・・・・・・ P8
4. Property price indices ・・・・・・ P9
(4). New home market
1. Condominiums for sale in Greater Tokyo area ・・・・・・ P10
・・・・・・ P10
3. Average price of condominiums in Greater Tokyo area ・・・・・・ P11
4. New home construction starts ・・・・・・ P11
(5). Mortgage interest rates ・・・・・・ P12
・・・・・・ P13
(1). Office leasing
1. Vacancy rates of office buildings in central 5 wards of Tokyo ・・・・・・ P14
2. Rents of office buildings in central 5wards of Tokyo ・・・・・・ P14
(2). Construction
1. Value of construction orders received ・・・・・・ P15
2. Construction materials price index, Construction cost deflator ・・・・・・ P15
(3). Investment
1. TSE REIT index ・・・・・・ P16
List of sources ・・・・・・ P17
P2
2. Office building and new construction markets
2. Contract conclusion rate and inventory of condominiums in Greater Tokyo area
Table of Contents

Trend Monthly
April 2017 edition
* JREI:Japan Real Estate Institute
* JHFA:Japan Housing Finance Agency
P3
1. Housing market
As of Results
REINS information content Registered properties March 25,955Year-on-year
change0.4%
Unsold inventory March 74,094Year-on-year
change0.0%
REINS contracts concluded Condominiums March 3,719Year-on-year
change3.59%
Land/Detached Houses March 1,900Year-on-year
change4.74%
Total (units) March 5,619Year-on-year
change3.98%
February 46,817Year-on-year
change0.75%
REINS average contract price Condominiums (10,000 yen) March 3,145Month-on-month
change△ 0.22%
Detached houses (10,000 yen) March 3,063Month-on-month
change△ 0.65%
Land (10,000 yen) March 2,859Month-on-month
change4.73%
REINS contracts concluded Condominiums (10,000 yen/sqm) March 49.3Month-on-month
change△ 0.02%
Unit price sqm Land (10,000 yen/sqm) March 19.7Month-on-month
change4.46%
January 88.1Month-on-month
change0.59%
December 128.0Month-on-month
change△ 1.27%
Officially published land prices Residential land January, 2017 - Year-on-year 0.70%
Commercial land January, 2017 - Year-on-year 3.10%
New home construction starts Nationwide (dwellings) February 70,912Year-on-year
change△ 2.63%
Condominiums in Greater Tokyo area Condominiums supplied (units) March 3,408Year-on-year
change26.55%
Contract conclusion rate March 66.2%Year-on-year
change△ 1.40pt
Inventory (units) March 6,749Month-on-month
change2.35%
Unsold inventory after completion (units) March 3,320Month-on-month
change13.43%
Average price (10,000 yen) March 5,588Month-on-month
change△ 3.54%
Average sqm unit price (10,000 yen/sqm) March 79.0Month-on-month
change△ 7.28%
as of April 1 2.475%Month-on-month
change0.00pt
as of April 1 3.250%Month-on-month
change0.25pt
as of April 1 1.290%Month-on-month
change△ 0.06pt
as of April 1 0.95%Month-on-month
change0.00pt
as of December 19, 2008 0.30%Month-on-month
change0.00pt
New
hom
e m
ark
et
Mort
gage inte
rest
rate
s
Bank variable interest rate (%) (Sumitomo Mitsui Banking Corporation)
Bank (10-year) fixed rate (%) (Sumitomo Mitsui Banking Corporation)
JHFA standard interest rate(%) *
Long-term prime rate (%)
Official discount rate (%)
Price t
rends
Summary Year-on-year, Month-on-month change
Lis
ting
volu
me
Registered transfer of titles due to purchase and sale (Nationwide)
JREI home price indices *
(December 1, 2000 = 100)(Greater Tokyo area)
Property price indices(Residential)
(2010 average = 100)(Nationwide)
Contr
acts
conclu
ded
* Minus 1% or lower Higher than minus 1% to under 1% 1% or higher
Minus 0.01pt or lower Higher than minus 0.01pt to under 0.01pt 0.01pt or higher

Trend Monthly Trend Monthly
April 2017 edition April 2017 edition
(Unit: units) (Unit: %)
*Sales of new homes and condo.’s are excluded.
*Land: Sales of land within a range of 100 to 200 sqm are counted.
(Unit: units) (Unit: %)
*Sales of new homes and condo.’s are excluded.
*Land: Sales of land within a range of 100 to 200 sqm are counted.
(1). Listing volume; 2. REINS inventory
P4
(1). Listing volume; 1. REINS registered properties
68,307 74,059 74,094
△20%
△10%
0%
10%
20%
0
10,000
20,000
30,000
40,000
50,000
60,000
70,000
80,000
90,000
3 4 5 6 7 8 9 10 11 12 1 2 3 4 5 6 7 8 9 10 11 12 1 2 3
FY2014 FY2015 FY2016
Unsold properties(LHS) Year-on-year change(RHS)
25,414 25,858 25,955
△15%
△10%
△5%
0%
5%
10%
15%
0
5,000
10,000
15,000
20,000
25,000
30,000
3 4 5 6 7 8 9 10 11 12 1 2 3 4 5 6 7 8 9 10 11 12 1 2 3
FY2014 FY2015 FY2016
Registered properties(LHS) Year-on-year change(RHS)

Trend Monthly Trend Monthly
April 2017 edition April 2017 edition
(Unit: units) (Unit: %)
*Sales of new homes and condo.’s are excluded.
*Land: Sales of land within a range of 100 to 200 sqm are counted.
(Unit: units) (Unit: %)
(2). Contracts concluded; 2.Registered transfer of titles due to purchase and sale (Nationwide)
P5
(2). Contracts concluded; 1. REINS contracts concluded
3,728 3,590 3,719
1,692
1,814
1,900
△20%
△10%
0%
10%
20%
30%
40%
0
1,000
2,000
3,000
4,000
5,000
6,000
3 4 5 6 7 8 9 10 11 12 1 2 3 4 5 6 7 8 9 10 11 12 1 2 3
FY2014 FY2015 FY2016
Condominiums Land and detached houses
Year-on year change/Condominiums Year-on-year change/Land and detached houses
Year-on year/Total
42,226
46,468 46,817
△10%
△5%
0%
5%
10%
15%
20%
0
10,000
20,000
30,000
40,000
50,000
60,000
70,000
2 3 4 5 6 7 8 9 10 11 12 1 2 3 4 5 6 7 8 9 10 11 12 1 2
FY2014 FY2015 FY2016
Registered transfer of title(LHS) Year-on-year change(RHS)

Trend Monthly Trend Monthly
April 2017 edition April 2017 edition
(Unit: 10,000 yen) (Unit: 10,000 yen/sqm)
*Sales of new homes and condo.’s are excluded.
*Land: Sales of land within a range of 100 to 200 sqm are counted.
(3). Price trends; 1. REINS contract unit price, Unit price per sqm
P6
①3,063
①3,027 ①3,063 ②2,923
②3,056 ②3,145
③2,784 ③2,941 ③2,859
45.3 47.8
49.3
19.5 20.4 19.7 15
20
25
30
35
40
45
50
55
1,500
2,000
2,500
3,000
3,500
4,000
4,500
3 4 5 6 7 8 9 10 11 12 1 2 3 4 5 6 7 8 9 10 11 12 1 2 3
FY2014 FY2015 FY2016
①Contract price (detached houses)(LHS) ②Contract price (condominiums)(LHS)
③Contract price (land)(LHS) Unit price/sqm (condominiums)(RHS)
Unit price/sqm (land)(RHS)

Trend Monthly Trend Monthly
April 2017 edition April 2017 edition
(Unit: 10,000 yen/sqm) (Unit: %)
■Changes over the last five years.
(3). Price trends; 2. Officially published land prices (Greater Tokyo area)
*Officially published land prices are the prices of standardized values published late March annually by the Land
Appraisal Committee of the Ministry of Land, Infrastructure, Transport and Tourism in accordance with the Public
Notice of Land Prices Act. The Land Appraisal Committee determines and publishes normal prices based on appraisals
by real estate appraisers and others of benchmark locations selected across the nation as of January 1 each year.
P7
△40
△20
0
20
40
60
80
1986 1988 1990 1992 1994 1996 1998 2000 2002 2004 2006 2008 2010 2012 2014 2016
Residential land Commercial land
0.7
3.1
△6
△4
△2
0
2
4
Jan. '13 Jan. '14 Jan. '15 Jan. '16 Jan. '17
Residential land Commercial land

Trend Monthly Trend Monthly
April 2017 edition April 2017 edition
(January 2000 = 100)
※Total:Average of Greater Tokyo area(Tokyo・Kanagawa・Chiba・Saitama)
(January 2000 = 100)
※Total:Average of Greater Tokyo area(Tokyo・Kanagawa・Chiba・Saitama)
(3). Price trends; 3. JREI home price indices
P8
■Changes over the last two years.
0
20
40
60
80
100
120
140
160
1995/4 1997/4 1999/4 2001/4 2003/4 2005/4 2007/4 2009/4 2011/4 2013/4 2015/4
Greater Total Tokyo
83.8
87.6 88.1
91.0
96.3 96.0
60
70
80
90
100
1 2 3 4 5 6 7 8 9 10 11 12 1 2 3 4 5 6 7 8 9 10 11 12 1
FY2014 FY2015 FY2016
Greater Total Tokyo
Tokyo
Greater Total

Trend Monthly Trend Monthly
April 2017 edition April 2017 edition
(January 2000 = 100) (2010 average = 100)
※South Kanto area:Tokyo・Kanagawa・Chiba・Saitama
※Nagoya:Aichi・Gifu・Mie
※Kyoto-Osaka-Kobe area:Osaka・Hyogo・Kyoto
(January 2000 = 100) (2010 average = 100)
(3). Price trends; 4. Real estate price index(mansion)(Hokkaido・Tohoku・Chugoku・Kyushu)
(3). Price trends; 4. Real estate price index(mansion)(South Kanto area・Nagoya・Kyoto-Osaka-Kobe area)
P9
*Real estate prices indexed monthly, classified nationally, by block and by metropolitan area based on price data of almost
300,000 dwelling and condominium transactions conducted over 12 months.
*Real estate prices indexed monthly, classified nationally, by block and by metropolitan area based on price data of almost
300,000 dwelling and condominium transactions conducted over 12 months.
90.0
100.0
110.0
120.0
130.0
140.0
12 1 2 3 4 5 6 7 8 9 10 11 12 1 2 3 4 5 6 7 8 9 10 11 12
FY2014 FY2015 FY2016
South Kanto area Nagoya area Kyoto-Osaka-Kobe area
80.0
100.0
120.0
140.0
160.0
180.0
200.0
12 1 2 3 4 5 6 7 8 9 10 11 12 1 2 3 4 5 6 7 8 9 10 11 12
FY2014 FY2015 FY2016
Hokkaido area Tohoku area Chugoku area Kyushu-Okinawa area

Trend Monthly Trend Monthly
April 2017 edition April 2017 edition
(2010 average = 100) (Unit: units)
(2010 average = 100) (Unit: units) (Unit: %)
(4). New home market; 2. Contract conclusion rate and inventory of condominiums in Greater Tokyo area
(4). New home market; 1. Condominium sales in Greater Tokyo area
P10
4,457
2,693
3,408
0
1,000
2,000
3,000
4,000
5,000
6,000
7,000
8,000
9,000
10,000
3 4 5 6 7 8 9 10 11 12 1 2 3 4 5 6 7 8 9 10 11 12 1 2 3
FY2014 FY2015 FY2016
5,218 6,039 6,749
2,040
3,168 3,320
79.6%
67.6% 66.2%
0%
10%
20%
30%
40%
50%
60%
70%
80%
90%
100%
0
1,000
2,000
3,000
4,000
5,000
6,000
7,000
8,000
9,000
10,000
3 4 5 6 7 8 9 10 11 12 1 2 3 4 5 6 7 8 9 10 11 12 1 2 3
FY2014 FY2015 FY2016
Total inventory(LHS) Unsold inventory after completion(LHS) Contract conclusion rate (RHS)

Trend Monthly Trend Monthly
April 2017 edition April 2017 edition
(Unit: units) (Unit: 10,000 yen) (Unit: 10,000 yen/sqm)
(Unit: units)
(4). New home market; 3. Average price of condominiums in Greater Tokyo area
P11
(4). New home market; 4. Transition of new housing construction work starting(Countrywide・Tokyo area)
67,552 72,831 70,912
27,114 26,811
25,170
0
10,000
20,000
30,000
40,000
50,000
60,000
70,000
80,000
90,000
100,000
2 3 4 5 6 7 8 9 10 11 12 1 2 3 4 5 6 7 8 9 10 11 12 1 2
FY2014 FY2015 FY2016
Countrywide Tokyo area
5,186
5,638 5,588
73.6
80.2 79.0
40
50
60
70
80
90
100
110
3,000
3,500
4,000
4,500
5,000
5,500
6,000
6,500
7,000
3 4 5 6 7 8 9 10 11 12 1 2 3 4 5 6 7 8 9 10 11 12 1 2 3
FY2014 FY2015 FY2016
Average price(LHS) Unit price/sqm(RHS)

Trend Monthly Trend Monthly
April 2017 edition April 2017 edition
(Unit: 10,000 yen/sqm) (Unit: %)
*Bank interest rates:Those by Sumitomo Mitsui Banking Corporation are shown here. as of April 1, 2017
*Rate as of 1st of each month
(Unit: units)
(5). Mortgage interest rates
P12
3.25
1.29
2.475
0.95
0.3 0.0
1.0
2.0
3.0
4.0
5.0
6.0
4 5 6 7 8 9 10 11 12 1 2 3 4 5 6 7 8 9 10 11 12 1 2 3 4
FY2015 FY2016 FY2017
①Bank/10 year fixed ②JHFA ③Bank/Variable
④Long-term prime rate ⑤Official discount rate
⑤
④
③
②
①
Trend Monthly Trend Monthly
April 2017 edition April 2017 edition
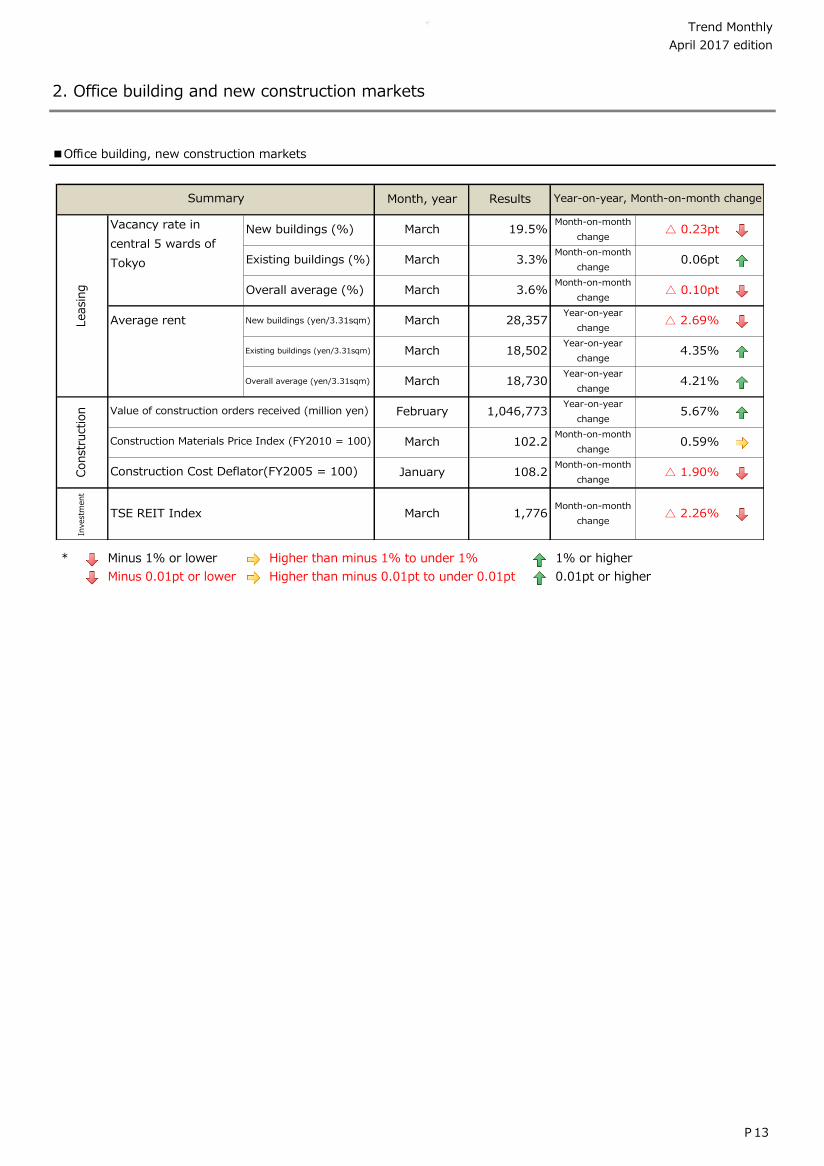
■Office building, new construction markets
2. Office building and new construction markets
P13
Month, year Results
New buildings (%) March 19.5%Month-on-month
change△ 0.23pt
Existing buildings (%) March 3.3%Month-on-month
change0.06pt
Overall average (%) March 3.6%Month-on-month
change△ 0.10pt
Average rent New buildings (yen/3.31sqm) March 28,357Year-on-year
change△ 2.69%
Existing buildings (yen/3.31sqm) March 18,502Year-on-year
change4.35%
Overall average (yen/3.31sqm) March 18,730Year-on-year
change4.21%
February 1,046,773Year-on-year
change5.67%
March 102.2Month-on-month
change0.59%
January 108.2Month-on-month
change△ 1.90%
Invest
ment
TSE REIT Index March 1,776Month-on-month
change△ 2.26%
Summary Year-on-year, Month-on-month change
Leasi
ng
Const
ruct
ion
Vacancy rate in
central 5 wards of
Tokyo
Value of construction orders received (million yen)
Construction Materials Price Index (FY2010 = 100)
Construction Cost Deflator(FY2005 = 100)
* Minus 1% or lower Higher than minus 1% to under 1% 1% or higher
Minus 0.01pt or lower Higher than minus 0.01pt to under 0.01pt 0.01pt or higher

Trend Monthly Trend Monthly
April 2017 edition April 2017 edition
(Unit: %)
*New buildings: Buildings completed less than one year ago.
(Unit: yen/3.31sqm per month)
(1). Office leasing; 2.Rents in central 5 wards of Tokyo
(1). Office leasing; 1. Vacancy rate in central 5 wards of Tokyo
*Survey subject: Large rental office buildings with standard floor space exceeding 331sqm in Tokyo business district
(Chiyoda ward, Chuo ward, Minato ward, Shinjuku ward, and Shibuya ward)
P14
*Survey subject: Same as above.
*New buildings:Same as above.
30.4%
29.4%
19.5%
4.7% 3.8% 3.3%
5.3% 4.3% 3.6%
0%
5%
10%
15%
20%
25%
30%
35%
40%
45%
3 4 5 6 7 8 9 10 11 12 1 2 3 4 5 6 7 8 9 10 11 12 1 2 3
FY2014 FY2015 FY2016
Vacancy rate/new buildings (%) Vacancy rate/existing buildings (%) Vacancy rate/average (%)
26,160 29,142 28,357
16,944 17,730 18,502
17,195 17,973 18,730
0
5,000
10,000
15,000
20,000
25,000
30,000
35,000
3 4 5 6 7 8 9 10 11 12 1 2 3 4 5 6 7 8 9 10 11 12 1 2 3
FY2014 FY2015 FY2016
Average rent/new buildings Average rent/existing buildings Average rent/average (yen/3.31sqm)

Trend Monthly Trend Monthly
April 2017 edition April 2017 edition
(Unit: million yen) (Unit: %)
(Unit: yen/3.31sqm per month) (Construction Materials Price Index: FY2010 average = 100)
(Construction Cost Deflator: FY2005 average = 100)
(2). Construction; 1. Value of construction orders received
*Value of construction orders received: Total value of orders received by Japan's 50 largest construction companies.
Both private sector construction and public works projects by national and local governments are included.
P15
(2). Construction; 2. Construction Materials Price Index, Construction Cost Deflator
*Construction Cost Deflator: An index prepared by the Ministry of Land, Infrastructure, Transport and Tourism to convert
nominal construction cost into real construction cost. This is also used as a construction cost index.
104.6
99.3 102.2
109.4 107.8
108.2
90
95
100
105
110
115
120
1 2 3 4 5 6 7 8 9 10 11 12 1 2 3 4 5 6 7 8 9 10 11 12 1 2 3
FY2014 FY2015 FY2016
Construction Materials Price Index (Tokyo) Construction Cost Deflator
1,130,574
990,637 1,046,773
△50%
△30%
△10%
10%
30%
50%
70%
90%
110%
2 3 4 5 6 7 8 9 10 11 12 1 2 3 4 5 6 7 8 9 10 11 12 1 2
FY2014 FY2015 FY2016
0
500,000
1,000,000
1,500,000
2,000,000
2,500,000
Construction orders received(LHS) Year-on-year change(RHS)

Trend Monthly Trend Monthly
April 2017 edition April 2017 edition
(TSE REIT Index: End of March 2003 = 1,000; Topix: Jan. 4, 1968 = 100) (Nikkei Stock Price Average values: yen)
(Construction Materials Price Index: FY2010 average = 100)
(Construction Cost Deflator: FY2005 average = 100)
(3). Investment; 1. TSE REIT Index (reference data: Topix, Nikkei Stock Price Average)
P16
1,865 1,896 1,776
5,000
7,000
9,000
11,000
13,000
15,000
17,000
19,000
21,000
23,000
500
700
900
1,100
1,300
1,500
1,700
1,900
2,100
3 4 5 6 7 8 9 10 11 12 1 2 3 4 5 6 7 8 9 10 11 12 1 2 3
FY2014 FY2015 FY2016
TSE REIT Index Topix Nikkei Stock Price Average

Trend Monthly Trend Monthly
April 2017 edition April 2017 edition
(Nikkei Stock Price Average values: yen)
:
: Registration Statistics by Ministry of Justice
Officially published land prices :
Property Price Index (Residential) :
JREI Home Price Index : Japan Real Estate Institute
Mortgage interest rates :
: Real Estate Economic Institute Co., Ltd.
New home construction starts of dwellings :
Office vacancy rates/rents : Office Building Market Current Report by Miki Shoji Co., Ltd.
Value of construction orders received :
Construction Materials Price Index : Economic Research Association
Construction Cost Deflator :
TSE REIT Index : Tokyo Stock Exchange, Inc.
Various financial institutions. Sumitomo Mitsui Banking
Corporation for Bank interest rates
Land General Information Library by Ministry of Land,
Infrastructure, Transport and Tourism
Land General Information Library by Ministry of Land,
Infrastructure, Transport and Tourism
Land General Information Library by Ministry of Land,
Infrastructure, Transport and Tourism
"Market Watch" by Real Estate Information Network for East
Japan
Registered transfer of titles due to purchase and sale
List of sources
REINS registered properties, Stocks, Contracts
concluded, Average contract price
Land General Information Library by Ministry of Land,
Infrastructure, Transport and Tourism
Land General Information Library by Ministry of Land,
Infrastructure, Transport and Tourism
Condominium sales, Price, Contracts conclusion rate, Stocks
P17