Embed Size (px)
Citation preview
The Feasibility Study and Implementation Support for Cavite-Laguna East-West National Road Project Transport and Environmental Surveys
Appendix 2.1
1
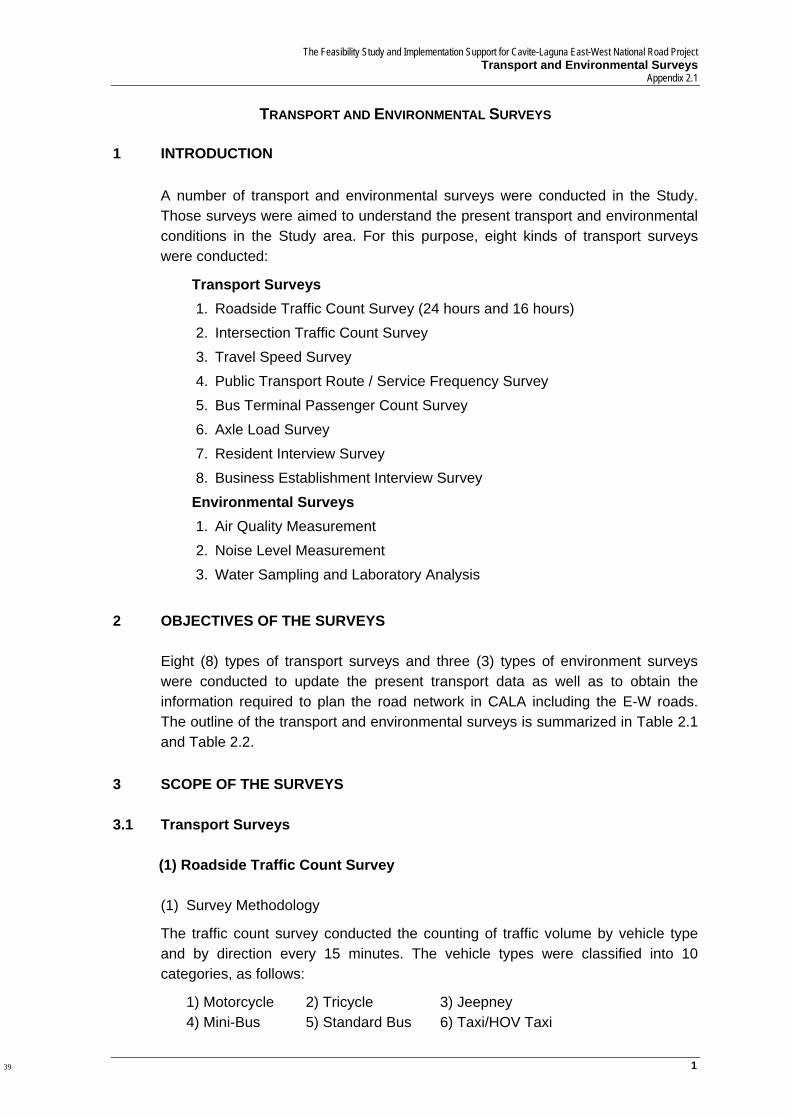
TRANSPORT AND ENVIRONMENTAL SURVEYS 1 INTRODUCTION
A number of transport and environmental surveys were conducted in the Study. Those surveys were aimed to understand the present transport and environmental conditions in the Study area. For this purpose, eight kinds of transport surveys were conducted:
2 OBJECTIVES OF THE SURVEYS
Eight (8) types of transport surveys and three (3) types of environment surveys were conducted to update the present transport data as well as to obtain the information required to plan the road network in CALA including the E-W roads. The outline of the transport and environmental surveys is summarized in Table 2.1 and Table 2.2.
3 SCOPE OF THE SURVEYS 3.1 Transport Surveys
(1) Roadside Traffic Count Survey
(1) Survey Methodology
The traffic count survey conducted the counting of traffic volume by vehicle type and by direction every 15 minutes. The vehicle types were classified into 10 categories, as follows:
1) Motorcycle 2) Tricycle 3) Jeepney 4) Mini-Bus 5) Standard Bus 6) Taxi/HOV Taxi
Transport Surveys 1. Roadside Traffic Count Survey (24 hours and 16 hours) 2. Intersection Traffic Count Survey 3. Travel Speed Survey 4. Public Transport Route / Service Frequency Survey 5. Bus Terminal Passenger Count Survey 6. Axle Load Survey 7. Resident Interview Survey 8. Business Establishment Interview Survey
Environmental Surveys 1. Air Quality Measurement 2. Noise Level Measurement 3. Water Sampling and Laboratory Analysis
39

The Feasibility Study and Implementation Support for the Cavite-Laguna East-West National Road Project Transport and Environmental Surveys Appendix 2.1
2
7) Car/Jeep 8) Utility Vehicle 9) Truck/Trailer 10) Others (Pedicab, Bicycle etc.)
Table 2.1 Outline of Transport Surveys
Survey Objectives Method Coverage
1. Roadside Traffic Count Survey (24 hours and 16 hours)
• Determine current trend of main road traffic
• Use for calibration of transport demand forecasting model
• Count all traffic by vehicle type (10 types) and by direction (every 15 minutes)
• 19 stations (6 stations for 24 hours and 13 stations for 16 hours)
• 2 days
2. Intersection Traffic Count Survey
• Determine current traffic condition at major intersections,
• Obtain basic data for study of traffic control measurement and facility improvement
• Count traffic volume by vehicle type (10 types) and direction (every 15 minutes)
• Conduct field survey of intersection form
• 11 stations • 2 days
3. Travel Speed Survey
• Determine current road service level (speed, etc.) and
• Grasp the traffic congestion bottleneck
• Record passing time and cause of delay at the checkpoints (intersection, stop, etc.) set by floating car method (Use GPS).
• 7 routes • 3 time periods (morning,
noon, evening) • 3 times, with the same
period and direction • Car, bus, jeepney, and
truck (truck only along Aguinaldo Highway and Governor’s Drive)
4. Public Transport Route / Service Frequency Survey
• Determine current service level of public transport (bus, jeepney) running around the major road around the study area
• Prepare route lists (including distance, origin/destination point, passing point, number of operators, number of registered vehicles) using official documents and field surveys
• Count frequency of service by route at terminals
• Frequency Count :18 hours (1 day)
5. Bus Terminal Passenger Count Survey
• Obtain data necessary in the formulation of road facility development plan by identifying the current number of passengers at the major bus or jeepney terminals
• Count the number of passengers by route at the bus/ jeepney terminal
• 14 hours (1 day)
6. Axle Load Survey • Measure axle load of passing vehicles around the study area
• Measure distribution of axle load of passing vehicles by axle load measurement device (select among survey station of roadside traffic count survey)
• 2 stations • 24 hours • 10% of total number of
heavy vehicles that passed
7. Resident Interview Survey
• Understand residents’ socioeconomic conditions, preference for road development and resettlement destination within the study area
• Conduct home visit survey by surveyors
• 2,000 samples • 18 LGUs, 50-200 samples
per LGU
8. Business Establishment Interview Survey
• Identify preference and option of business operators (factory, etc.) towards economic activities and road development
• Conduct business establishments visit survey by surveyors
• 500 samples • 18 LGUs, 10-50 samples
per LGU
40
The Feasibility Study and Implementation Support for Cavite-Laguna East-West National Road Project Transport and Environmental Surveys
Appendix 2.1
3
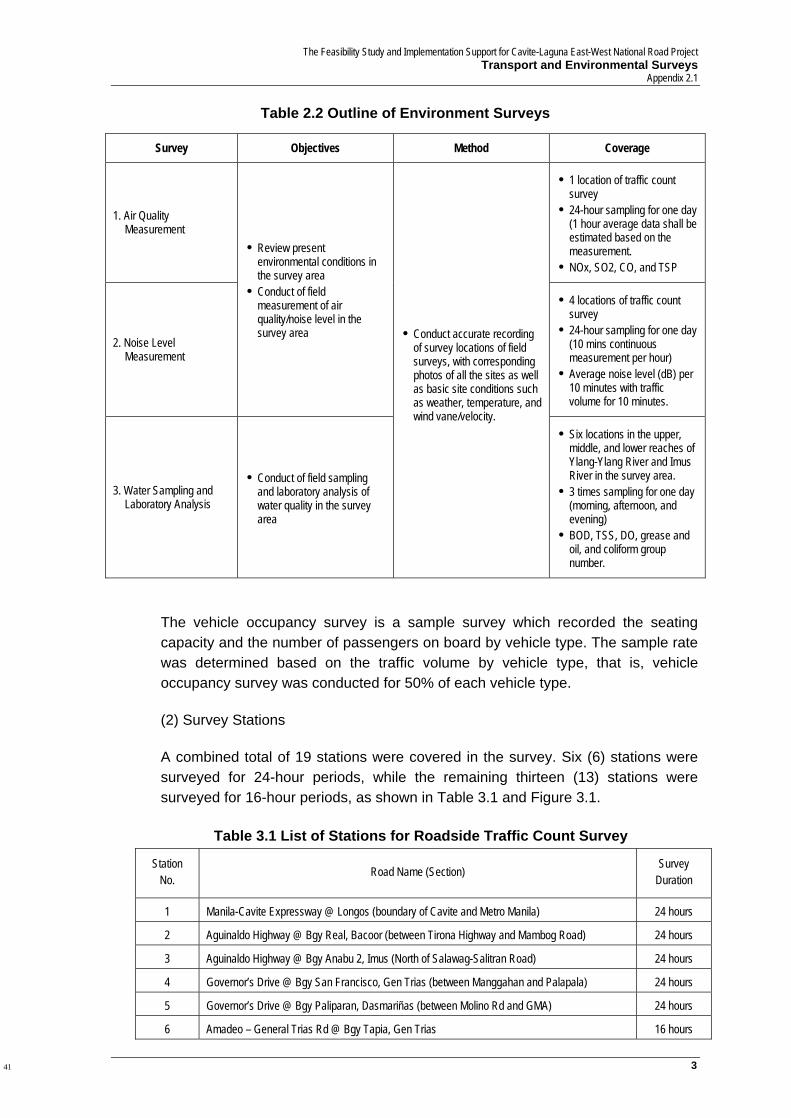
Table 2.2 Outline of Environment Surveys
Survey Objectives Method Coverage
1. Air Quality Measurement
• 1 location of traffic count survey
• 24-hour sampling for one day (1 hour average data shall be estimated based on the measurement.
• NOx, SO2, CO, and TSP
2. Noise Level Measurement
• Review present environmental conditions in the survey area
• Conduct of field measurement of air quality/noise level in the survey area
• 4 locations of traffic count survey
• 24-hour sampling for one day (10 mins continuous measurement per hour)
• Average noise level (dB) per 10 minutes with traffic volume for 10 minutes.
3. Water Sampling and Laboratory Analysis
• Conduct of field sampling and laboratory analysis of water quality in the survey area
• Conduct accurate recording of survey locations of field surveys, with corresponding photos of all the sites as well as basic site conditions such as weather, temperature, and wind vane/velocity.
• Six locations in the upper, middle, and lower reaches of Ylang-Ylang River and Imus River in the survey area.
• 3 times sampling for one day (morning, afternoon, and evening)
• BOD, TSS, DO, grease and oil, and coliform group number.
The vehicle occupancy survey is a sample survey which recorded the seating capacity and the number of passengers on board by vehicle type. The sample rate was determined based on the traffic volume by vehicle type, that is, vehicle occupancy survey was conducted for 50% of each vehicle type. (2) Survey Stations
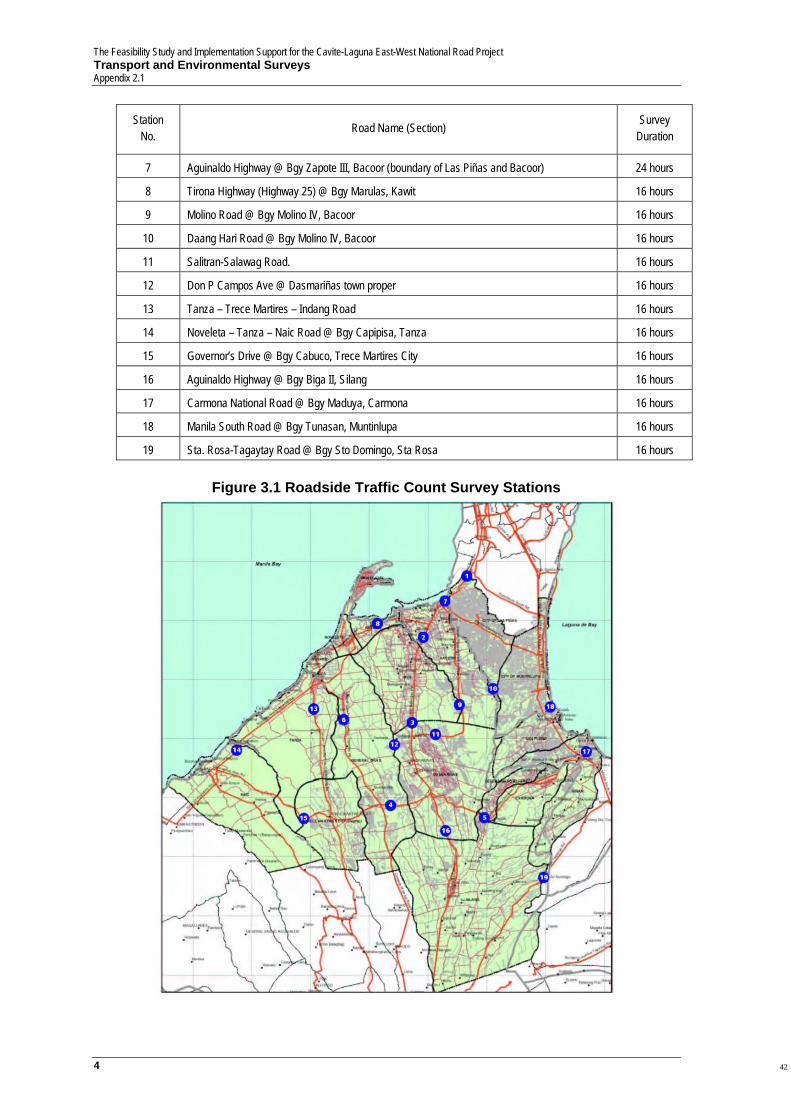
A combined total of 19 stations were covered in the survey. Six (6) stations were surveyed for 24-hour periods, while the remaining thirteen (13) stations were surveyed for 16-hour periods, as shown in Table 3.1 and Figure 3.1.
Table 3.1 List of Stations for Roadside Traffic Count Survey
Station No. Road Name (Section) Survey
Duration
1 Manila-Cavite Expressway @ Longos (boundary of Cavite and Metro Manila) 24 hours
2 Aguinaldo Highway @ Bgy Real, Bacoor (between Tirona Highway and Mambog Road) 24 hours
3 Aguinaldo Highway @ Bgy Anabu 2, Imus (North of Salawag-Salitran Road) 24 hours
4 Governor’s Drive @ Bgy San Francisco, Gen Trias (between Manggahan and Palapala) 24 hours
5 Governor’s Drive @ Bgy Paliparan, Dasmariñas (between Molino Rd and GMA) 24 hours
6 Amadeo – General Trias Rd @ Bgy Tapia, Gen Trias 16 hours
41
The Feasibility Study and Implementation Support for the Cavite-Laguna East-West National Road Project Transport and Environmental Surveys Appendix 2.1
4
Station No. Road Name (Section) Survey
Duration
7 Aguinaldo Highway @ Bgy Zapote III, Bacoor (boundary of Las Piñas and Bacoor) 24 hours
8 Tirona Highway (Highway 25) @ Bgy Marulas, Kawit 16 hours
9 Molino Road @ Bgy Molino IV, Bacoor 16 hours
10 Daang Hari Road @ Bgy Molino IV, Bacoor 16 hours
11 Salitran-Salawag Road. 16 hours
12 Don P Campos Ave @ Dasmariñas town proper 16 hours
13 Tanza – Trece Martires – Indang Road 16 hours
14 Noveleta – Tanza – Naic Road @ Bgy Capipisa, Tanza 16 hours
15 Governor’s Drive @ Bgy Cabuco, Trece Martires City 16 hours
16 Aguinaldo Highway @ Bgy Biga II, Silang 16 hours
17 Carmona National Road @ Bgy Maduya, Carmona 16 hours
18 Manila South Road @ Bgy Tunasan, Muntinlupa 16 hours
19 Sta. Rosa-Tagaytay Road @ Bgy Sto Domingo, Sta Rosa 16 hours
Figure 3.1 Roadside Traffic Count Survey Stations
42
The Feasibility Study and Implementation Support for Cavite-Laguna East-West National Road Project Transport and Environmental Surveys
Appendix 2.1
5
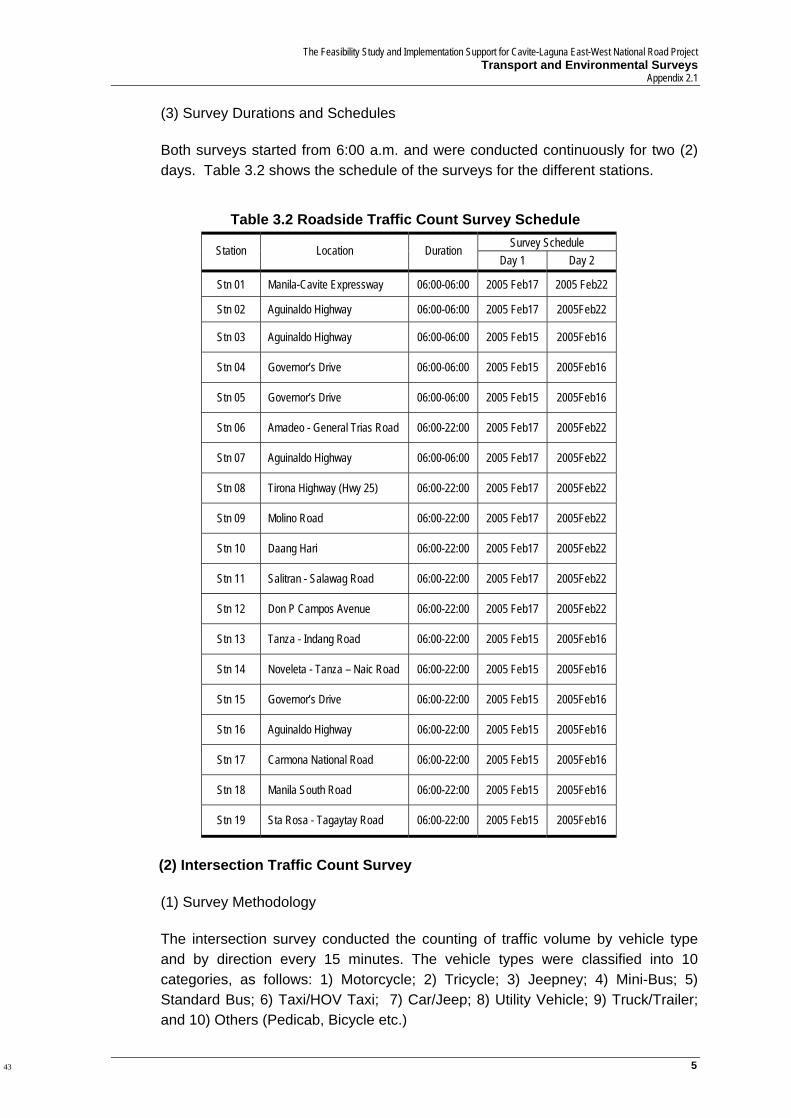
(3) Survey Durations and Schedules
Both surveys started from 6:00 a.m. and were conducted continuously for two (2) days. Table 3.2 shows the schedule of the surveys for the different stations.
Table 3.2 Roadside Traffic Count Survey Schedule
Survey Schedule Station Location Duration Day 1 Day 2
Stn 01 Manila-Cavite Expressway 06:00-06:00 2005 Feb17 2005 Feb22
Stn 02 Aguinaldo Highway 06:00-06:00 2005 Feb17 2005Feb22
Stn 03 Aguinaldo Highway 06:00-06:00 2005 Feb15 2005Feb16
Stn 04 Governor’s Drive 06:00-06:00 2005 Feb15 2005Feb16
Stn 05 Governor’s Drive 06:00-06:00 2005 Feb15 2005Feb16
Stn 06 Amadeo - General Trias Road 06:00-22:00 2005 Feb17 2005Feb22
Stn 07 Aguinaldo Highway 06:00-06:00 2005 Feb17 2005Feb22
Stn 08 Tirona Highway (Hwy 25) 06:00-22:00 2005 Feb17 2005Feb22
Stn 09 Molino Road 06:00-22:00 2005 Feb17 2005Feb22
Stn 10 Daang Hari 06:00-22:00 2005 Feb17 2005Feb22
Stn 11 Salitran - Salawag Road 06:00-22:00 2005 Feb17 2005Feb22
Stn 12 Don P Campos Avenue 06:00-22:00 2005 Feb17 2005Feb22
Stn 13 Tanza - Indang Road 06:00-22:00 2005 Feb15 2005Feb16
Stn 14 Noveleta - Tanza – Naic Road 06:00-22:00 2005 Feb15 2005Feb16
Stn 15 Governor’s Drive 06:00-22:00 2005 Feb15 2005Feb16
Stn 16 Aguinaldo Highway 06:00-22:00 2005 Feb15 2005Feb16
Stn 17 Carmona National Road 06:00-22:00 2005 Feb15 2005Feb16
Stn 18 Manila South Road 06:00-22:00 2005 Feb15 2005Feb16
Stn 19 Sta Rosa - Tagaytay Road 06:00-22:00 2005 Feb15 2005Feb16
(2) Intersection Traffic Count Survey
(1) Survey Methodology
The intersection survey conducted the counting of traffic volume by vehicle type and by direction every 15 minutes. The vehicle types were classified into 10 categories, as follows: 1) Motorcycle; 2) Tricycle; 3) Jeepney; 4) Mini-Bus; 5) Standard Bus; 6) Taxi/HOV Taxi; 7) Car/Jeep; 8) Utility Vehicle; 9) Truck/Trailer; and 10) Others (Pedicab, Bicycle etc.)
43
The Feasibility Study and Implementation Support for the Cavite-Laguna East-West National Road Project Transport and Environmental Surveys Appendix 2.1
6
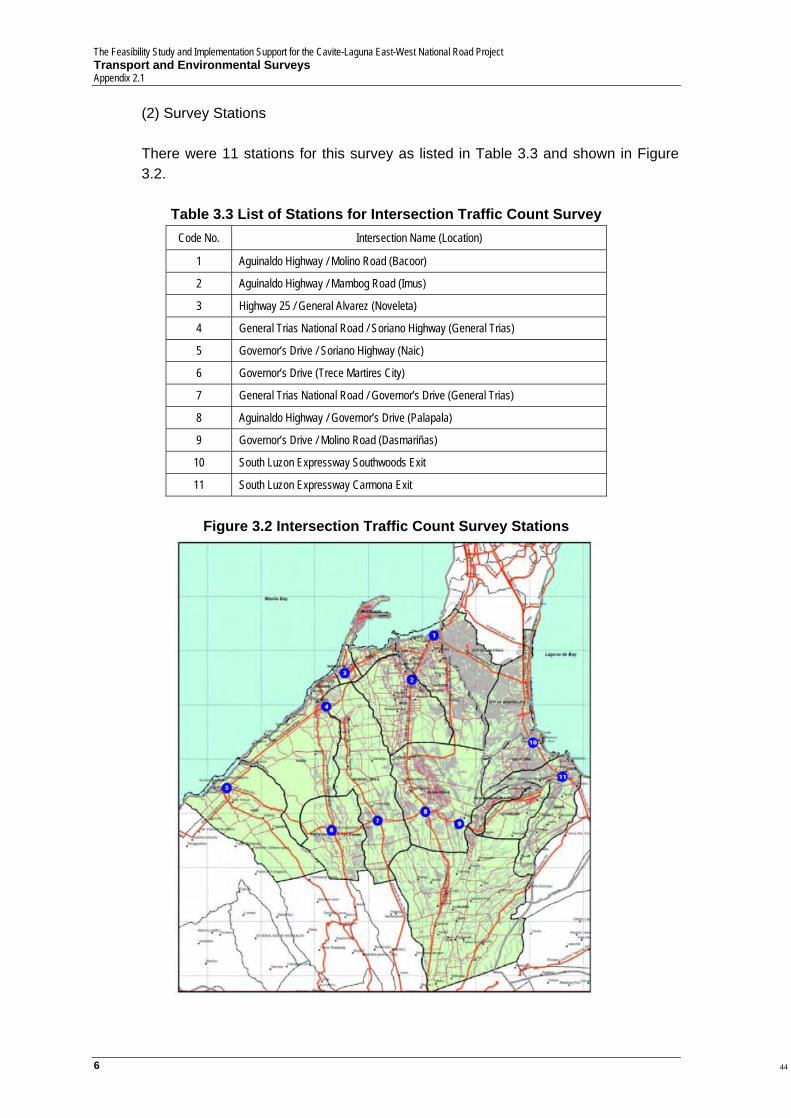
(2) Survey Stations
There were 11 stations for this survey as listed in Table 3.3 and shown in Figure 3.2.
Table 3.3 List of Stations for Intersection Traffic Count Survey
Code No. Intersection Name (Location)
1 Aguinaldo Highway / Molino Road (Bacoor)
2 Aguinaldo Highway / Mambog Road (Imus)
3 Highway 25 / General Alvarez (Noveleta)
4 General Trias National Road / Soriano Highway (General Trias)
5 Governor’s Drive / Soriano Highway (Naic)
6 Governor’s Drive (Trece Martires City)
7 General Trias National Road / Governor’s Drive (General Trias)
8 Aguinaldo Highway / Governor’s Drive (Palapala)
9 Governor’s Drive / Molino Road (Dasmariñas)
10 South Luzon Expressway Southwoods Exit
11 South Luzon Expressway Carmona Exit
Figure 3.2 Intersection Traffic Count Survey Stations
44
The Feasibility Study and Implementation Support for Cavite-Laguna East-West National Road Project Transport and Environmental Surveys
Appendix 2.1
7
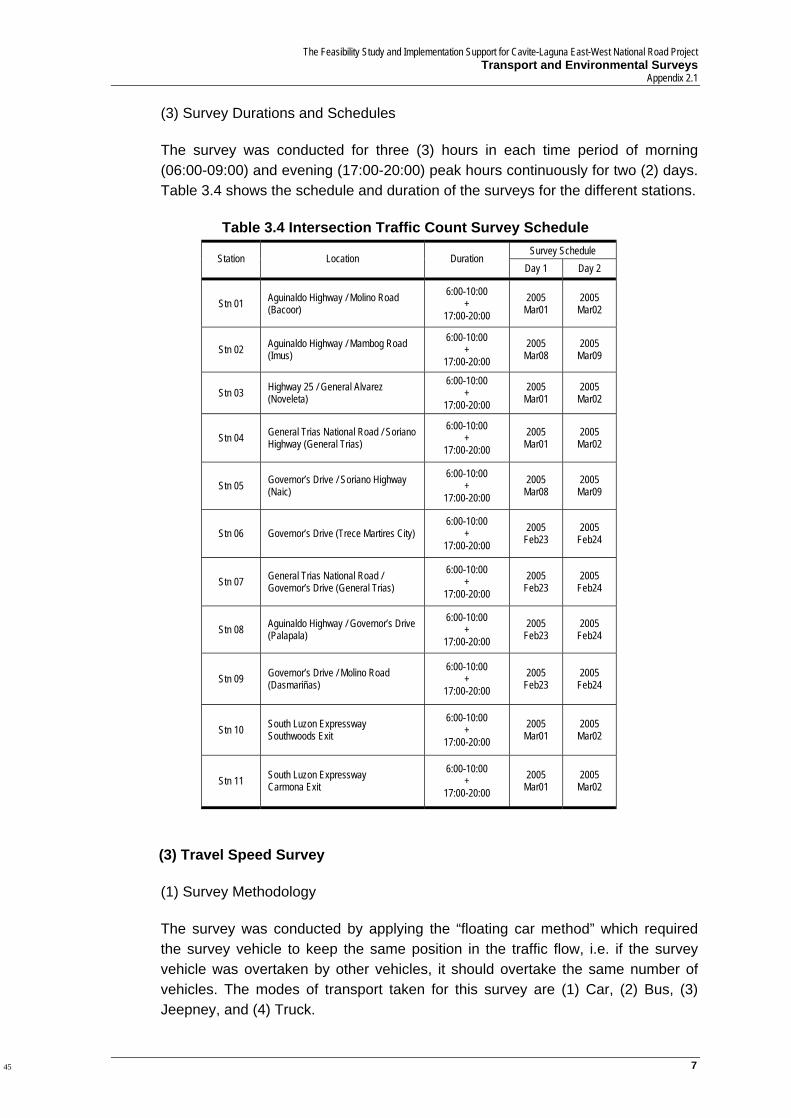
(3) Survey Durations and Schedules
The survey was conducted for three (3) hours in each time period of morning (06:00-09:00) and evening (17:00-20:00) peak hours continuously for two (2) days. Table 3.4 shows the schedule and duration of the surveys for the different stations.
Table 3.4 Intersection Traffic Count Survey Schedule Survey Schedule
Station Location Duration Day 1 Day 2
Stn 01 Aguinaldo Highway / Molino Road (Bacoor)
6:00-10:00 +
17:00-20:00 2005
Mar01 2005
Mar02
Stn 02 Aguinaldo Highway / Mambog Road (Imus)
6:00-10:00 +
17:00-20:00 2005
Mar08 2005
Mar09
Stn 03 Highway 25 / General Alvarez (Noveleta)
6:00-10:00 +
17:00-20:00 2005
Mar01 2005
Mar02
Stn 04 General Trias National Road / Soriano Highway (General Trias)
6:00-10:00 +
17:00-20:00 2005
Mar01 2005
Mar02
Stn 05 Governor’s Drive / Soriano Highway (Naic)
6:00-10:00 +
17:00-20:00 2005
Mar08 2005
Mar09
Stn 06 Governor’s Drive (Trece Martires City) 6:00-10:00
+ 17:00-20:00
2005 Feb23
2005 Feb24
Stn 07 General Trias National Road / Governor’s Drive (General Trias)
6:00-10:00 +
17:00-20:00 2005
Feb23 2005
Feb24
Stn 08 Aguinaldo Highway / Governor’s Drive (Palapala)
6:00-10:00 +
17:00-20:00 2005
Feb23 2005
Feb24
Stn 09 Governor’s Drive / Molino Road (Dasmariñas)
6:00-10:00 +
17:00-20:00 2005
Feb23 2005
Feb24
Stn 10 South Luzon Expressway Southwoods Exit
6:00-10:00 +
17:00-20:00 2005
Mar01 2005
Mar02
Stn 11 South Luzon Expressway Carmona Exit
6:00-10:00 +
17:00-20:00 2005
Mar01 2005
Mar02
(3) Travel Speed Survey
(1) Survey Methodology
The survey was conducted by applying the “floating car method” which required the survey vehicle to keep the same position in the traffic flow, i.e. if the survey vehicle was overtaken by other vehicles, it should overtake the same number of vehicles. The modes of transport taken for this survey are (1) Car, (2) Bus, (3) Jeepney, and (4) Truck.
45
The Feasibility Study and Implementation Support for the Cavite-Laguna East-West National Road Project Transport and Environmental Surveys Appendix 2.1
8
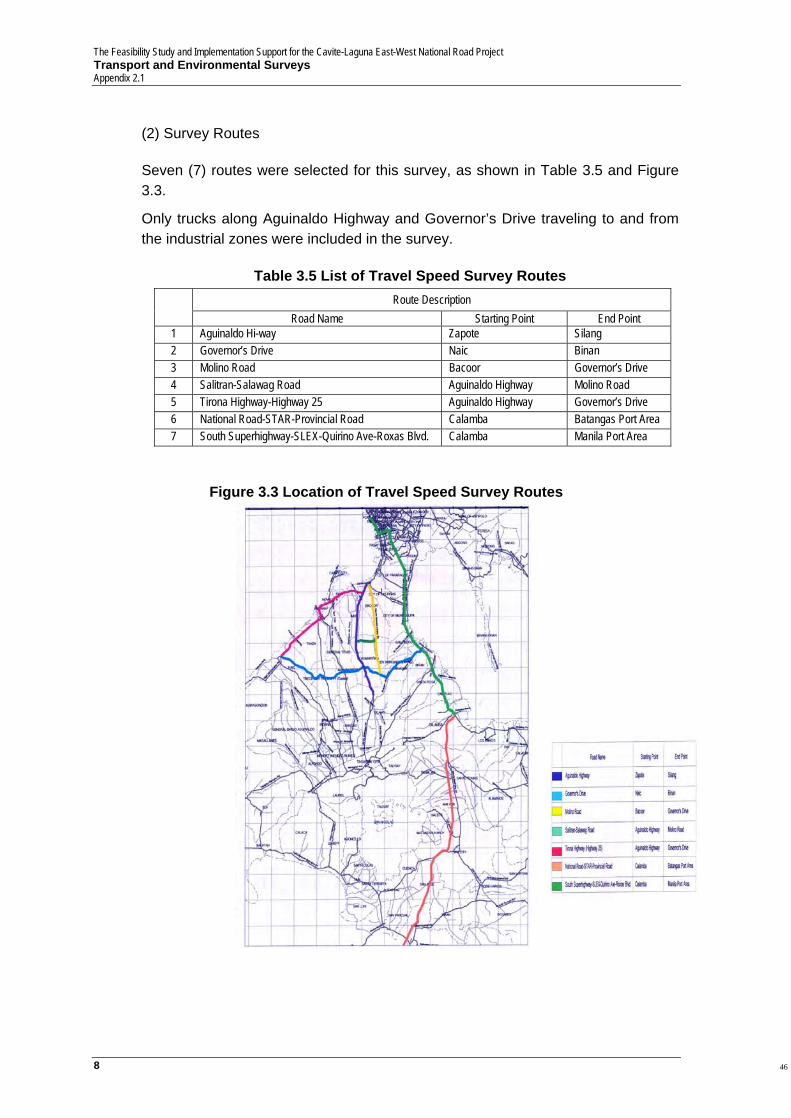
(2) Survey Routes
Seven (7) routes were selected for this survey, as shown in Table 3.5 and Figure 3.3.
Only trucks along Aguinaldo Highway and Governor’s Drive traveling to and from the industrial zones were included in the survey.
Table 3.5 List of Travel Speed Survey Routes
Route Description Road Name Starting Point End Point
1 Aguinaldo Hi-way Zapote Silang 2 Governor’s Drive Naic Binan 3 Molino Road Bacoor Governor’s Drive 4 Salitran-Salawag Road Aguinaldo Highway Molino Road 5 Tirona Highway-Highway 25 Aguinaldo Highway Governor’s Drive 6 National Road-STAR-Provincial Road Calamba Batangas Port Area 7 South Superhighway-SLEX-Quirino Ave-Roxas Blvd. Calamba Manila Port Area
Figure 3.3 Location of Travel Speed Survey Routes
46
The Feasibility Study and Implementation Support for Cavite-Laguna East-West National Road Project Transport and Environmental Surveys
Appendix 2.1
9
(3) Survey Durations
The survey was continuously conducted on 8-9 March 2005. Three samples (round trips) were taken for each of the selected routes in each three-time periods of (i) morning peak hours (06:00-09:00), (ii) inter-peak hours (12:00-15:00) and (iii) evening peak hours (17:00-20:00).
(4) Public Transport Route / Service Frequency Survey
(1) Survey Methodology
The survey was divided into two types: (i) preparation of route lists of bus and jeepney with route description, route length, number of operating vehicles, etc. and (ii) service frequency survey for major routes of public transportation. The first task collected the information of registered routes from DOTC/LTFRB and then prepared a list of routes for survey. The second task counted the actual service frequency of the selected major routes at the terminal. In this survey, vehicle type and occupancy was also examined.
Terminal facilities were examined based on observation and collected secondary data/information.
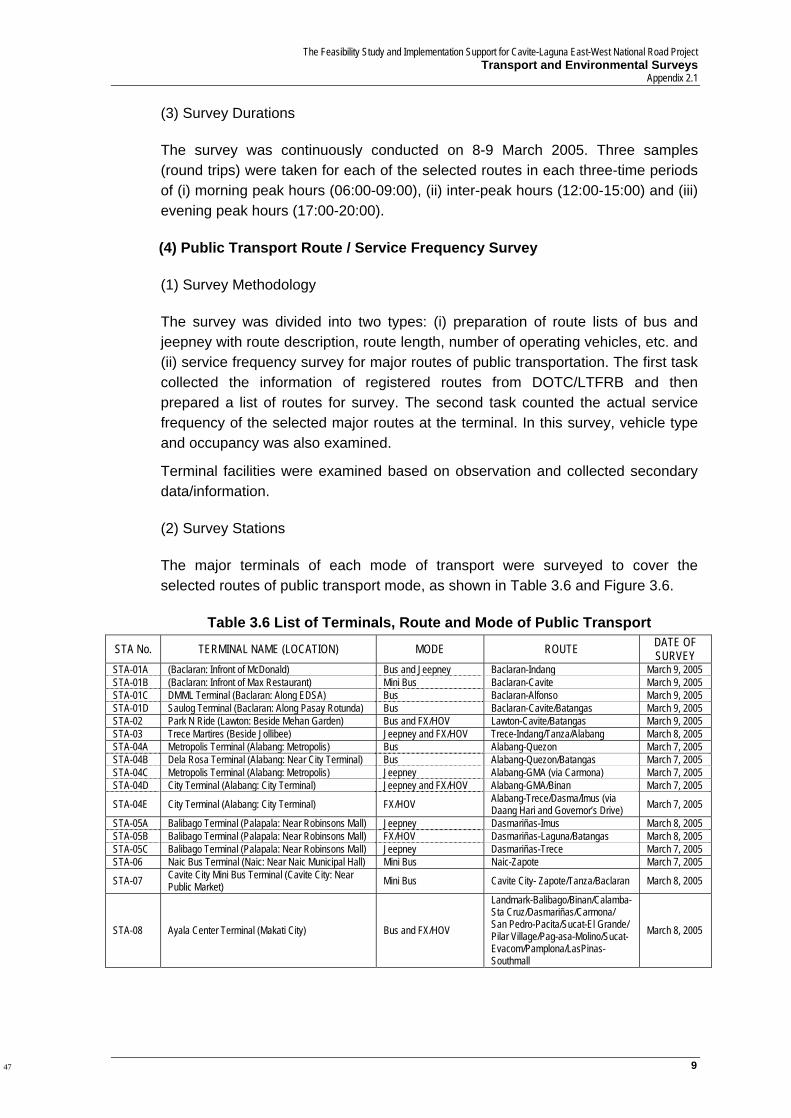
(2) Survey Stations
The major terminals of each mode of transport were surveyed to cover the selected routes of public transport mode, as shown in Table 3.6 and Figure 3.6.
Table 3.6 List of Terminals, Route and Mode of Public Transport
STA No. TERMINAL NAME (LOCATION) MODE ROUTE DATE OF SURVEY
STA-01A (Baclaran: Infront of McDonald) Bus and Jeepney Baclaran-Indang March 9, 2005 STA-01B (Baclaran: Infront of Max Restaurant) Mini Bus Baclaran-Cavite March 9, 2005 STA-01C DMML Terminal (Baclaran: Along EDSA) Bus Baclaran-Alfonso March 9, 2005 STA-01D Saulog Terminal (Baclaran: Along Pasay Rotunda) Bus Baclaran-Cavite/Batangas March 9, 2005 STA-02 Park N Ride (Lawton: Beside Mehan Garden) Bus and FX/HOV Lawton-Cavite/Batangas March 9, 2005 STA-03 Trece Martires (Beside Jollibee) Jeepney and FX/HOV Trece-Indang/Tanza/Alabang March 8, 2005 STA-04A Metropolis Terminal (Alabang: Metropolis) Bus Alabang-Quezon March 7, 2005 STA-04B Dela Rosa Terminal (Alabang: Near City Terminal) Bus Alabang-Quezon/Batangas March 7, 2005 STA-04C Metropolis Terminal (Alabang: Metropolis) Jeepney Alabang-GMA (via Carmona) March 7, 2005 STA-04D City Terminal (Alabang: City Terminal) Jeepney and FX/HOV Alabang-GMA/Binan March 7, 2005
STA-04E City Terminal (Alabang: City Terminal) FX/HOV Alabang-Trece/Dasma/Imus (via Daang Hari and Governor’s Drive) March 7, 2005
STA-05A Balibago Terminal (Palapala: Near Robinsons Mall) Jeepney Dasmariñas-Imus March 8, 2005 STA-05B Balibago Terminal (Palapala: Near Robinsons Mall) FX/HOV Dasmariñas-Laguna/Batangas March 8, 2005 STA-05C Balibago Terminal (Palapala: Near Robinsons Mall) Jeepney Dasmariñas-Trece March 7, 2005 STA-06 Naic Bus Terminal (Naic: Near Naic Municipal Hall) Mini Bus Naic-Zapote March 7, 2005
STA-07 Cavite City Mini Bus Terminal (Cavite City: Near Public Market) Mini Bus Cavite City- Zapote/Tanza/Baclaran March 8, 2005
STA-08 Ayala Center Terminal (Makati City) Bus and FX/HOV
Landmark-Balibago/Binan/Calamba- Sta Cruz/Dasmariñas/Carmona/ San Pedro-Pacita/Sucat-El Grande/ Pilar Village/Pag-asa-Molino/Sucat-Evacom/Pamplona/LasPinas-Southmall
March 8, 2005
47
The Feasibility Study and Implementation Support for the Cavite-Laguna East-West National Road Project Transport and Environmental Surveys Appendix 2.1
10
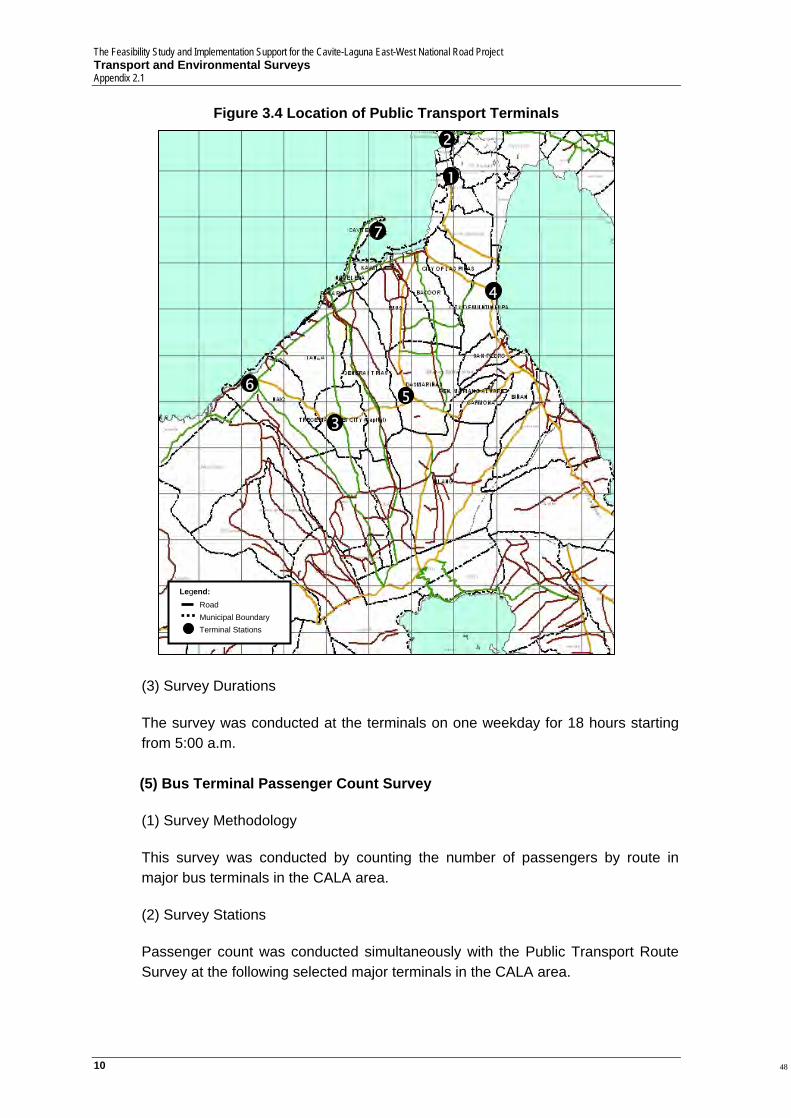
Figure 3.4 Location of Public Transport Terminals
(3) Survey Durations
The survey was conducted at the terminals on one weekday for 18 hours starting from 5:00 a.m. (5) Bus Terminal Passenger Count Survey
(1) Survey Methodology
This survey was conducted by counting the number of passengers by route in major bus terminals in the CALA area.
(2) Survey Stations
Passenger count was conducted simultaneously with the Public Transport Route Survey at the following selected major terminals in the CALA area.
1
2
3
4
56
7
Legend: Road Municipal Boundary Terminal Stations
48
The Feasibility Study and Implementation Support for Cavite-Laguna East-West National Road Project Transport and Environmental Surveys
Appendix 2.1
11
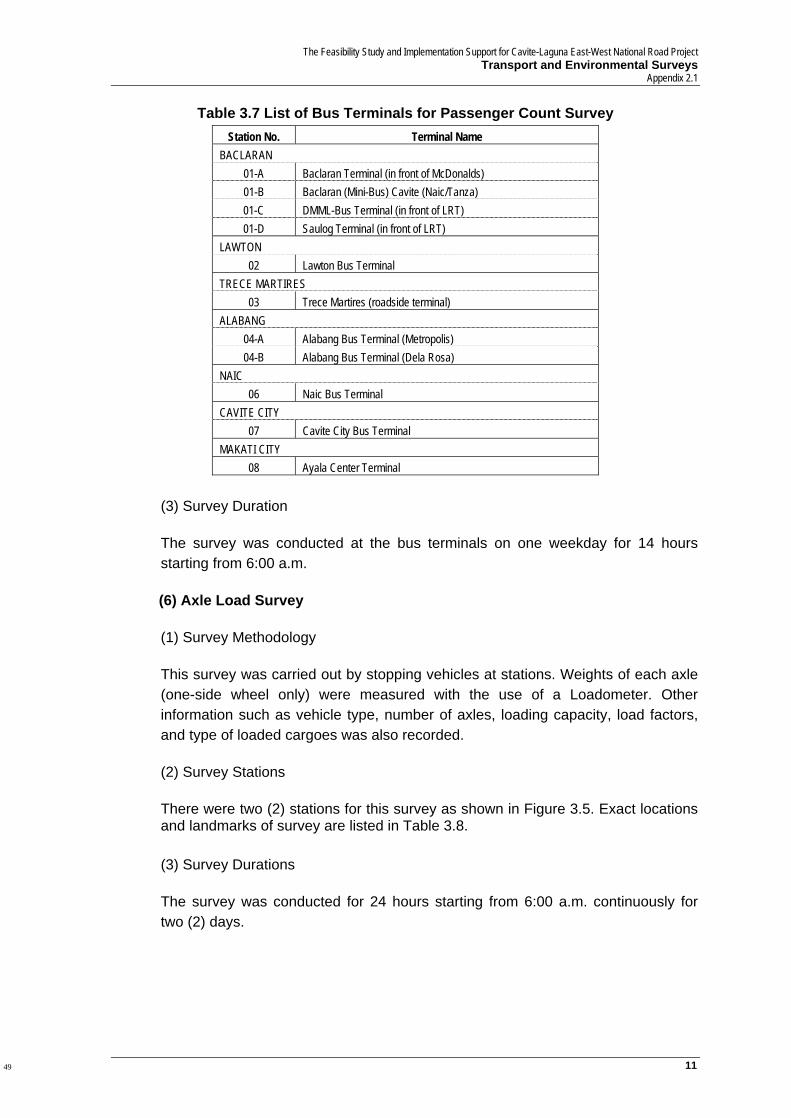
Table 3.7 List of Bus Terminals for Passenger Count Survey Station No. Terminal Name
BACLARAN 01-A Baclaran Terminal (in front of McDonalds) 01-B Baclaran (Mini-Bus) Cavite (Naic/Tanza) 01-C DMML-Bus Terminal (in front of LRT) 01-D Saulog Terminal (in front of LRT)
LAWTON 02 Lawton Bus Terminal
TRECE MARTIRES 03 Trece Martires (roadside terminal)
ALABANG 04-A Alabang Bus Terminal (Metropolis) 04-B Alabang Bus Terminal (Dela Rosa)
NAIC 06 Naic Bus Terminal
CAVITE CITY 07 Cavite City Bus Terminal
MAKATI CITY 08 Ayala Center Terminal
(3) Survey Duration
The survey was conducted at the bus terminals on one weekday for 14 hours starting from 6:00 a.m.
(6) Axle Load Survey
(1) Survey Methodology
This survey was carried out by stopping vehicles at stations. Weights of each axle (one-side wheel only) were measured with the use of a Loadometer. Other information such as vehicle type, number of axles, loading capacity, load factors, and type of loaded cargoes was also recorded.
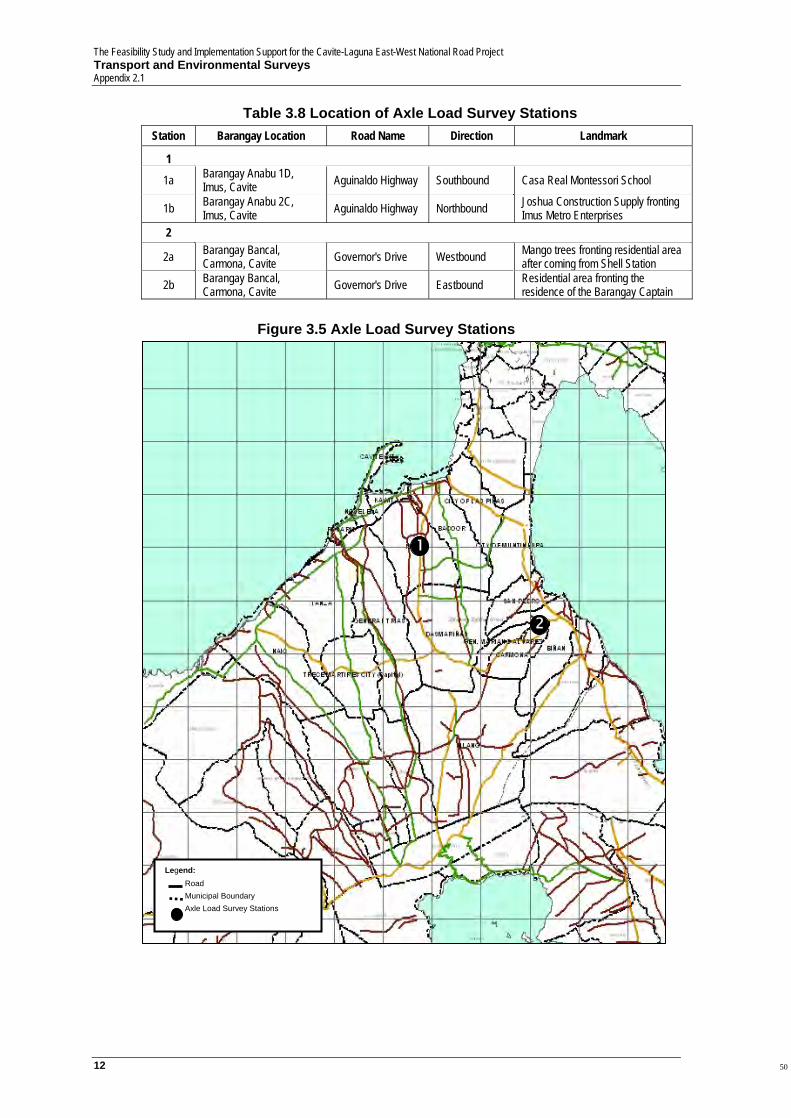
(2) Survey Stations
There were two (2) stations for this survey as shown in Figure 3.5. Exact locations and landmarks of survey are listed in Table 3.8. (3) Survey Durations
The survey was conducted for 24 hours starting from 6:00 a.m. continuously for two (2) days.
49
The Feasibility Study and Implementation Support for the Cavite-Laguna East-West National Road Project Transport and Environmental Surveys Appendix 2.1
12
Table 3.8 Location of Axle Load Survey Stations Station Barangay Location Road Name Direction Landmark
1
1a Barangay Anabu 1D, Imus, Cavite Aguinaldo Highway Southbound Casa Real Montessori School
1b Barangay Anabu 2C, Imus, Cavite Aguinaldo Highway Northbound Joshua Construction Supply fronting
Imus Metro Enterprises 2
2a Barangay Bancal, Carmona, Cavite Governor's Drive Westbound Mango trees fronting residential area
after coming from Shell Station
2b Barangay Bancal, Carmona, Cavite Governor's Drive Eastbound Residential area fronting the
residence of the Barangay Captain
Figure 3.5 Axle Load Survey Stations
1
2
4
Legend: Road Municipal Boundary Axle Load Survey Stations
50
The Feasibility Study and Implementation Support for Cavite-Laguna East-West National Road Project Transport and Environmental Surveys
Appendix 2.1
13
(7) Resident Interview Survey
(1) Survey Methodology
Interviewers visited and conducted interviews to the targeted residents and families/households based on the questionnaire form prepared by the JICA Study Team. Socioeconomic conditions, preference for road development and resettlement destination within the study area were identified in the survey.
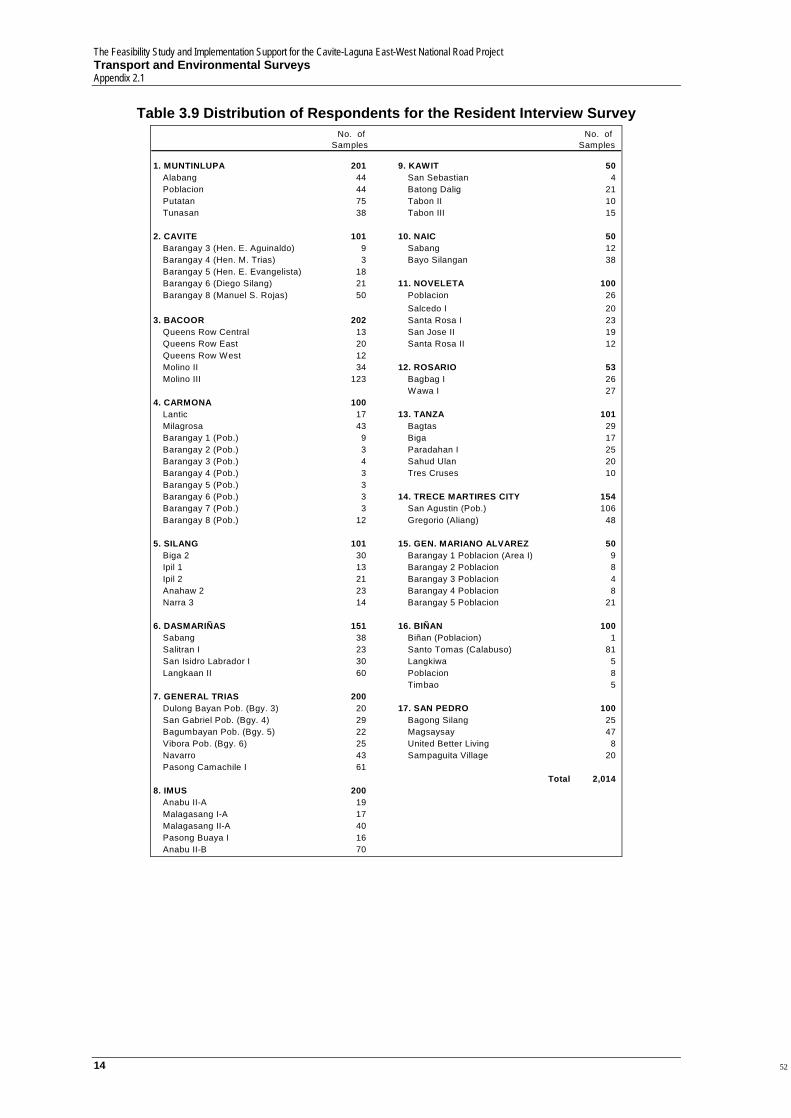
(2) Coverage of the Survey
A total of 2,014 respondents were interviewed during home visits in the 18 cities/municipalities (50-200 samples per LGU) as shown in Table 3.9.
(8) Business Establishment Survey
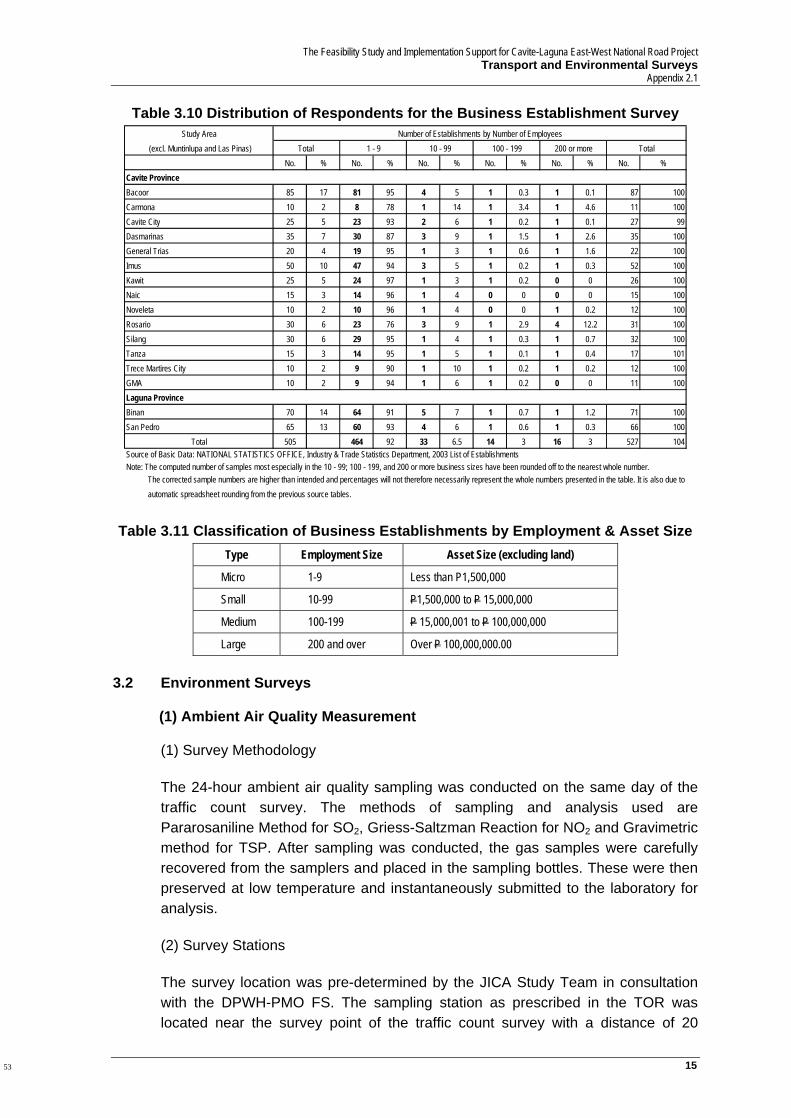
(1) Survey Methodology Interviewers visited the selected business operators in the area and conducted an interview with the appropriate person, such as the operating and/or financial managers, based on the questionnaire form prepared by JICA Study Team. Preferences and options towards economic activities and road development were identified in the survey. (2) Coverage of the Survey As shown in Table 3.10, a total of 505 respondents were interviewed during visits to the various business enterprises in the 18 cities/municipalities, with the total number of respondents distributed along the following major roads:
• Governor’s Drive (Carmona-GMA-Silang-Dasmariñas-Gen. Trias-Trece Martires-Tanza)
• Aguinaldo Highway (Bacoor-Imus-Dasmariñas-Silang)
• Manila-Cavite Road (Bacoor-Kawit-Noveleta-Rosario)
• Zapote-Salawag-Salitran Road (Bacoor-Dasmariñas)
• Noveleta-Naic-Tagaytay Road (Naic) Classification of business establishments are shown in Table 3.11.
51
The Feasibility Study and Implementation Support for the Cavite-Laguna East-West National Road Project Transport and Environmental Surveys Appendix 2.1
14
Table 3.9 Distribution of Respondents for the Resident Interview Survey No. of
Samples No. of
Samples
1. MUNTINLUPA 201 9. KAWIT 50 Alabang 44 San Sebastian 4 Poblacion 44 Batong Dalig 21 Putatan 75 Tabon II 10 Tunasan 38 Tabon III 15
2. CAVITE 101 10. NAIC 50 Barangay 3 (Hen. E. Aguinaldo) 9 Sabang 12 Barangay 4 (Hen. M. Trias) 3 Bayo Silangan 38 Barangay 5 (Hen. E. Evangelista) 18 Barangay 6 (Diego Silang) 21 11. NOVELETA 100 Barangay 8 (Manuel S. Rojas) 50 Poblacion 26
Salcedo I 20 3. BACOOR 202 Santa Rosa I 23
Queens Row Central 13 San Jose II 19 Queens Row East 20 Santa Rosa II 12 Queens Row West 12 Molino II 34 12. ROSARIO 53 Molino III 123 Bagbag I 26
Wawa I 27 4. CARMONA 100
Lantic 17 13. TANZA 101 Milagrosa 43 Bagtas 29 Barangay 1 (Pob.) 9 Biga 17 Barangay 2 (Pob.) 3 Paradahan I 25 Barangay 3 (Pob.) 4 Sahud Ulan 20 Barangay 4 (Pob.) 3 Tres Cruses 10 Barangay 5 (Pob.) 3 Barangay 6 (Pob.) 3 14. TRECE MARTIRES CITY 154 Barangay 7 (Pob.) 3 San Agustin (Pob.) 106 Barangay 8 (Pob.) 12 Gregorio (Aliang) 48
5. SILANG 101 15. GEN. MARIANO ALVAREZ 50 Biga 2 30 Barangay 1 Poblacion (Area I) 9 Ipil 1 13 Barangay 2 Poblacion 8 Ipil 2 21 Barangay 3 Poblacion 4 Anahaw 2 23 Barangay 4 Poblacion 8 Narra 3 14 Barangay 5 Poblacion 21
6. DASMARIÑAS 151 16. BIÑAN 100 Sabang 38 Biñan (Poblacion) 1 Salitran I 23 Santo Tomas (Calabuso) 81 San Isidro Labrador I 30 Langkiwa 5 Langkaan II 60 Poblacion 8
Timbao 5 7. GENERAL TRIAS 200
Dulong Bayan Pob. (Bgy. 3) 20 17. SAN PEDRO 100 San Gabriel Pob. (Bgy. 4) 29 Bagong Silang 25 Bagumbayan Pob. (Bgy. 5) 22 Magsaysay 47 Vibora Pob. (Bgy. 6) 25 United Better Living 8 Navarro 43 Sampaguita Village 20 Pasong Camachile I 61
Total 2,014 8. IMUS 200
Anabu II-A 19 Malagasang I-A 17 Malagasang II-A 40 Pasong Buaya I 16 Anabu II-B 70
52
The Feasibility Study and Implementation Support for Cavite-Laguna East-West National Road Project Transport and Environmental Surveys
Appendix 2.1
15
Table 3.10 Distribution of Respondents for the Business Establishment Survey Study Area
(excl. Muntinlupa and Las Pinas)No. % No. % No. % No. % No. % No. %
Bacoor 85 17 81 95 4 5 1 0.3 1 0.1 87 100Carmona 10 2 8 78 1 14 1 3.4 1 4.6 11 100Cavite City 25 5 23 93 2 6 1 0.2 1 0.1 27 99Dasmarinas 35 7 30 87 3 9 1 1.5 1 2.6 35 100General Trias 20 4 19 95 1 3 1 0.6 1 1.6 22 100Imus 50 10 47 94 3 5 1 0.2 1 0.3 52 100Kawit 25 5 24 97 1 3 1 0.2 0 0 26 100Naic 15 3 14 96 1 4 0 0 0 0 15 100Noveleta 10 2 10 96 1 4 0 0 1 0.2 12 100Rosario 30 6 23 76 3 9 1 2.9 4 12.2 31 100Silang 30 6 29 95 1 4 1 0.3 1 0.7 32 100Tanza 15 3 14 95 1 5 1 0.1 1 0.4 17 101Trece Martires City 10 2 9 90 1 10 1 0.2 1 0.2 12 100GMA 10 2 9 94 1 6 1 0.2 0 0 11 100
Binan 70 14 64 91 5 7 1 0.7 1 1.2 71 100San Pedro 65 13 60 93 4 6 1 0.6 1 0.3 66 100
Total 505 464 92 33 6.5 14 3 16 3 527 104Source of Basic Data: NATIONAL STATISTICS OFFICE, Industry & Trade Statistics Department, 2003 List of EstablishmentsNote: The computed number of samples most especially in the 10 - 99; 100 - 199, and 200 or more business sizes have been rounded off to the nearest whole number.
The corrected sample numbers are higher than intended and percentages will not therefore necessarily represent the whole numbers presented in the table. It is also due to automatic spreadsheet rounding from the previous source tables.
Cavite Province
Laguna Province
TotalNumber of Establishments by Number of Employees
1 - 9 10 - 99 100 - 199 200 or moreTotal
Table 3.11 Classification of Business Establishments by Employment & Asset Size Type Employment Size Asset Size (excluding land)
Micro 1-9 Less than P1,500,000
Small 10-99 P1,500,000 to P 15,000,000
Medium 100-199 P 15,000,001 to P 100,000,000
Large 200 and over Over P 100,000,000.00
3.2 Environment Surveys
(1) Ambient Air Quality Measurement (1) Survey Methodology The 24-hour ambient air quality sampling was conducted on the same day of the traffic count survey. The methods of sampling and analysis used are Pararosaniline Method for SO2, Griess-Saltzman Reaction for NO2 and Gravimetric method for TSP. After sampling was conducted, the gas samples were carefully recovered from the samplers and placed in the sampling bottles. These were then preserved at low temperature and instantaneously submitted to the laboratory for analysis. (2) Survey Stations The survey location was pre-determined by the JICA Study Team in consultation with the DPWH-PMO FS. The sampling station as prescribed in the TOR was located near the survey point of the traffic count survey with a distance of 20
53

The Feasibility Study and Implementation Support for the Cavite-Laguna East-West National Road Project Transport and Environmental Surveys Appendix 2.1
16
meters away from the existing main road (Governor’s Drive), designated as Survey Point No. 5 as shown in Figure 3.6.
(3) Survey Durations A 24-hour sampling was conducted for one day, and one (1) hour average data was then estimated based on the measurement.
Figure 3.6 Ambient Air Quality Measurement Survey Point
(2) Noise Level Measurement (1) Survey Methodology The 24-hour noise level measurements were conducted on the same day of the traffic count surveys and consisted of 10-minute continuous measurements per hour. Noise monitoring was conducted at different locations continuously for twenty four hours monitoring. Recording the lowest and highest noise levels at each four compass directions for a period of ten (10) minutes every hour was conducted. The logarithmic average of these noise levels gives the equivalent noise level (Leq). (2) Survey Stations The survey locations were pre-determined by the JICA Study Team in consultation with the DPWH-PMO FS. The sampling stations were located along Governor’s
54
The Feasibility Study and Implementation Support for Cavite-Laguna East-West National Road Project Transport and Environmental Surveys
Appendix 2.1
17
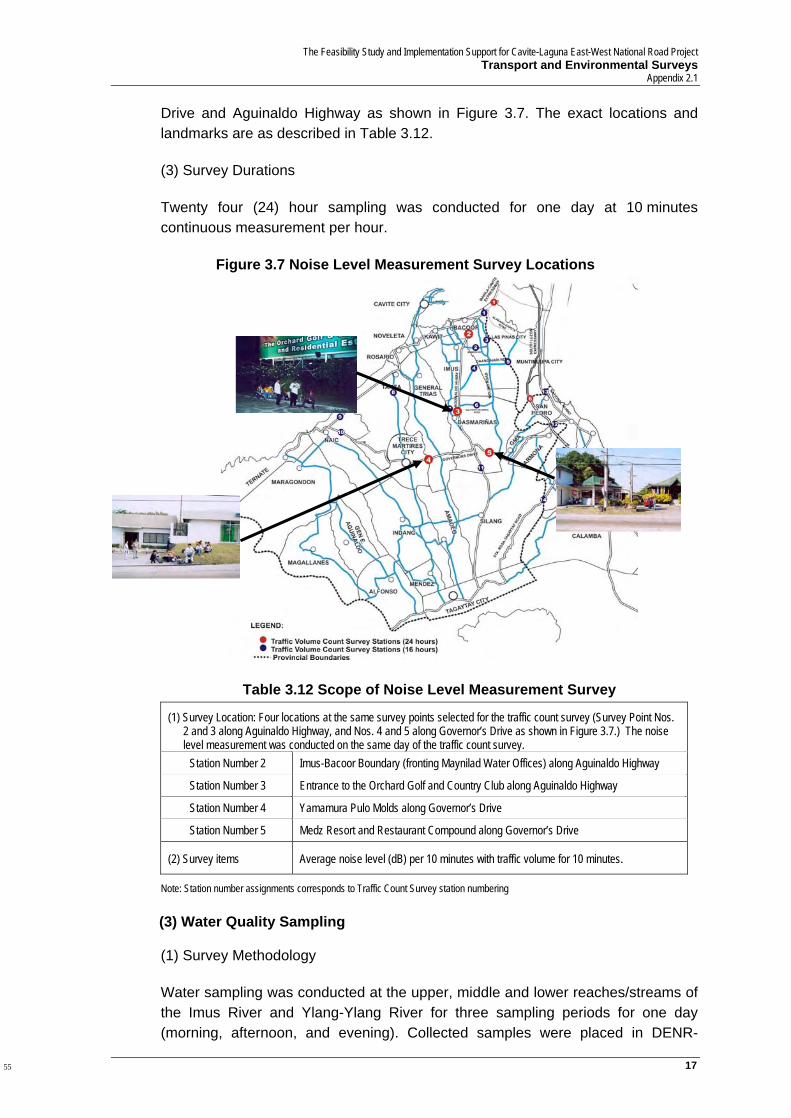
Drive and Aguinaldo Highway as shown in Figure 3.7. The exact locations and landmarks are as described in Table 3.12.
(3) Survey Durations Twenty four (24) hour sampling was conducted for one day at 10 minutes continuous measurement per hour.
Figure 3.7 Noise Level Measurement Survey Locations
Table 3.12 Scope of Noise Level Measurement Survey
(1) Survey Location: Four locations at the same survey points selected for the traffic count survey (Survey Point Nos. 2 and 3 along Aguinaldo Highway, and Nos. 4 and 5 along Governor’s Drive as shown in Figure 3.7.) The noise level measurement was conducted on the same day of the traffic count survey.
Station Number 2 Imus-Bacoor Boundary (fronting Maynilad Water Offices) along Aguinaldo Highway
Station Number 3 Entrance to the Orchard Golf and Country Club along Aguinaldo Highway
Station Number 4 Yamamura Pulo Molds along Governor’s Drive
Station Number 5 Medz Resort and Restaurant Compound along Governor’s Drive
(2) Survey items Average noise level (dB) per 10 minutes with traffic volume for 10 minutes.
Note: Station number assignments corresponds to Traffic Count Survey station numbering (3) Water Quality Sampling (1) Survey Methodology Water sampling was conducted at the upper, middle and lower reaches/streams of the Imus River and Ylang-Ylang River for three sampling periods for one day (morning, afternoon, and evening). Collected samples were placed in DENR-
55
The Feasibility Study and Implementation Support for the Cavite-Laguna East-West National Road Project Transport and Environmental Surveys Appendix 2.1
18
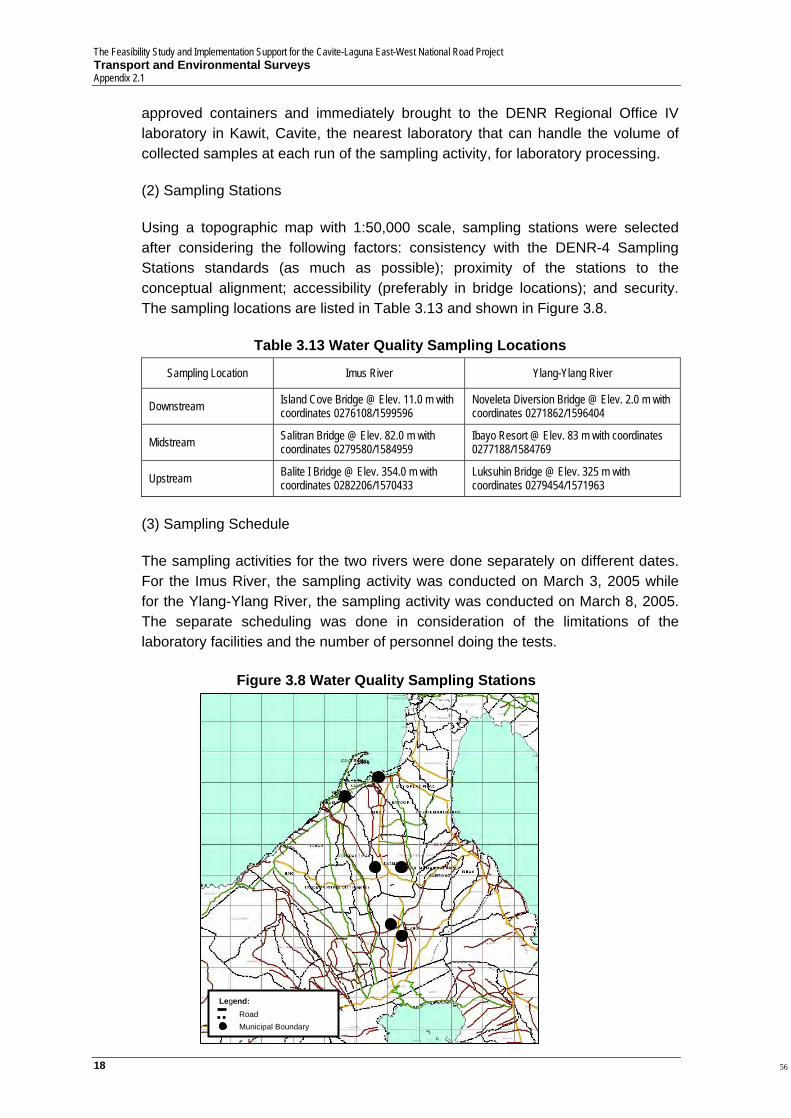
approved containers and immediately brought to the DENR Regional Office IV laboratory in Kawit, Cavite, the nearest laboratory that can handle the volume of collected samples at each run of the sampling activity, for laboratory processing. (2) Sampling Stations Using a topographic map with 1:50,000 scale, sampling stations were selected after considering the following factors: consistency with the DENR-4 Sampling Stations standards (as much as possible); proximity of the stations to the conceptual alignment; accessibility (preferably in bridge locations); and security. The sampling locations are listed in Table 3.13 and shown in Figure 3.8.
Table 3.13 Water Quality Sampling Locations
Sampling Location Imus River Ylang-Ylang River
Downstream Island Cove Bridge @ Elev. 11.0 m with coordinates 0276108/1599596
Noveleta Diversion Bridge @ Elev. 2.0 m with coordinates 0271862/1596404
Midstream Salitran Bridge @ Elev. 82.0 m with coordinates 0279580/1584959
Ibayo Resort @ Elev. 83 m with coordinates 0277188/1584769
Upstream Balite I Bridge @ Elev. 354.0 m with coordinates 0282206/1570433
Luksuhin Bridge @ Elev. 325 m with coordinates 0279454/1571963
(3) Sampling Schedule The sampling activities for the two rivers were done separately on different dates. For the Imus River, the sampling activity was conducted on March 3, 2005 while for the Ylang-Ylang River, the sampling activity was conducted on March 8, 2005. The separate scheduling was done in consideration of the limitations of the laboratory facilities and the number of personnel doing the tests.
Figure 3.8 Water Quality Sampling Stations
Legend: Road Municipal Boundary
56
The Feasibility Study and Implementation Support for Cavite-Laguna East-West National Road Project Transport and Environmental Surveys
Appendix 2.1
19
4 SURVEY RESULTS
In this section, a summary of outputs and results of the transport and environmental surveys are presented, with more specific survey results and outputs presented in the respective component survey reports.
4.1 Roadside Vehicle Counts
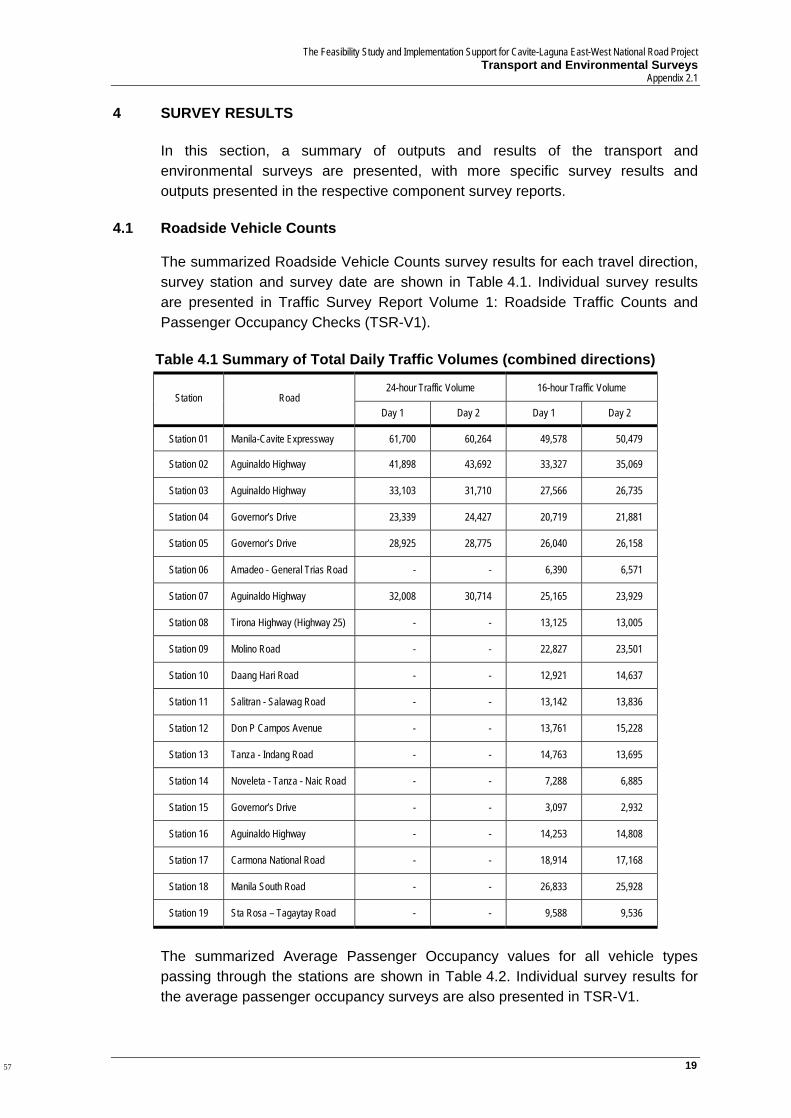
The summarized Roadside Vehicle Counts survey results for each travel direction, survey station and survey date are shown in Table 4.1. Individual survey results are presented in Traffic Survey Report Volume 1: Roadside Traffic Counts and Passenger Occupancy Checks (TSR-V1).
Table 4.1 Summary of Total Daily Traffic Volumes (combined directions)
24-hour Traffic Volume 16-hour Traffic Volume Station Road
Day 1 Day 2 Day 1 Day 2
Station 01 Manila-Cavite Expressway 61,700 60,264 49,578 50,479
Station 02 Aguinaldo Highway 41,898 43,692 33,327 35,069
Station 03 Aguinaldo Highway 33,103 31,710 27,566 26,735
Station 04 Governor’s Drive 23,339 24,427 20,719 21,881
Station 05 Governor’s Drive 28,925 28,775 26,040 26,158
Station 06 Amadeo - General Trias Road - - 6,390 6,571
Station 07 Aguinaldo Highway 32,008 30,714 25,165 23,929
Station 08 Tirona Highway (Highway 25) - - 13,125 13,005
Station 09 Molino Road - - 22,827 23,501
Station 10 Daang Hari Road - - 12,921 14,637
Station 11 Salitran - Salawag Road - - 13,142 13,836
Station 12 Don P Campos Avenue - - 13,761 15,228
Station 13 Tanza - Indang Road - - 14,763 13,695
Station 14 Noveleta - Tanza - Naic Road - - 7,288 6,885
Station 15 Governor’s Drive - - 3,097 2,932
Station 16 Aguinaldo Highway - - 14,253 14,808
Station 17 Carmona National Road - - 18,914 17,168
Station 18 Manila South Road - - 26,833 25,928
Station 19 Sta Rosa – Tagaytay Road - - 9,588 9,536
The summarized Average Passenger Occupancy values for all vehicle types passing through the stations are shown in Table 4.2. Individual survey results for the average passenger occupancy surveys are also presented in TSR-V1.
57
The Feasibility Study and Implementation Support for the Cavite-Laguna East-West National Road Project Transport and Environmental Surveys Appendix 2.1
20
Table 4.2 Summary of Average Daily (16-hour) Passenger Occupancy
First Survey Day Second Survey Day Station Road
Direction 1 Direction 2 Direction 1 Direction 2
Station 01 Manila-Cavite Expressway 8.69 7.54 8.99 6.07
Station 02 Aguinaldo Highway 5.84 5.40 5.61 5.54
Station 03 Aguinaldo Highway 7.02 5.64 6.63 5.46
Station 04 Governor’s Drive 4.82 4.17 5.94 4.16
Station 05 Governor’s Drive 3.83 4.23 4.12 3.28
Station 06 Amadeo - General Trias Road 2.83 2.38 2.85 2.62
Station 07 Aguinaldo Highway 4.50 4.71 4.32 4.15
Station 08 Tirona Highway (Highway 25) 6.50 5.99 6.57 6.40
Station 09 Molino Road 2.73 3.93 3.72 2.47
Station 10 Daang Hari Road 1.60 1.51 1.89 1.69
Station 11 Salitran - Salawag Road 2.25 3.05 2.21 2.61
Station 12 Don P Campos Avenue 3.12 3.88 3.12 4.48
Station 13 Tanza - Indang Road 3.13 3.48 3.00 3.24
Station 14 Noveleta - Tanza - Naic Road 5.05 4.79 5.09 4.93
Station 15 Governor’s Drive 3.21 3.54 3.49 3.39
Station 16 Aguinaldo Highway 4.51 6.75 3.93 6.31
Station 17 Carmona National Road 5.67 4.53 6.47 4.61
Station 18 Manila South Road 5.12 6.80 7.05 7.91
Station 19 Sta Rosa – Tagaytay Road 4.27 3.83 3.83 3.45
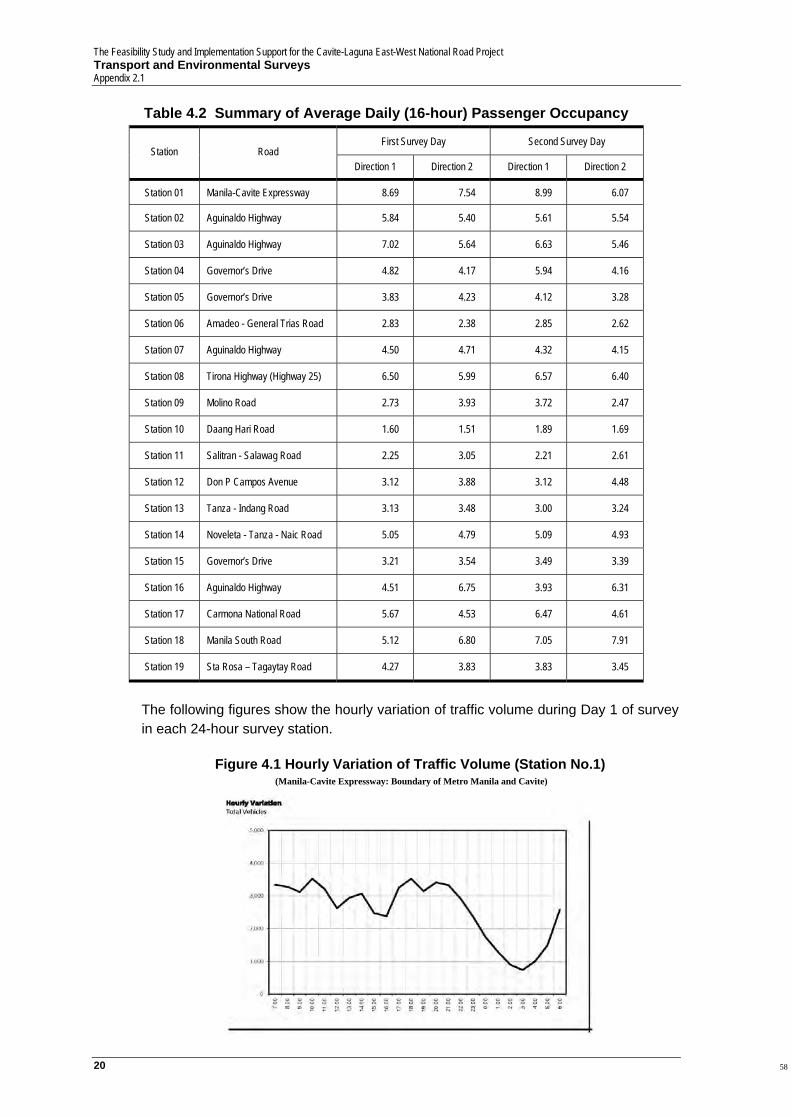
The following figures show the hourly variation of traffic volume during Day 1 of survey in each 24-hour survey station.
Figure 4.1 Hourly Variation of Traffic Volume (Station No.1)
(Manila-Cavite Expressway: Boundary of Metro Manila and Cavite)
58
The Feasibility Study and Implementation Support for Cavite-Laguna East-West National Road Project Transport and Environmental Surveys
Appendix 2.1
21
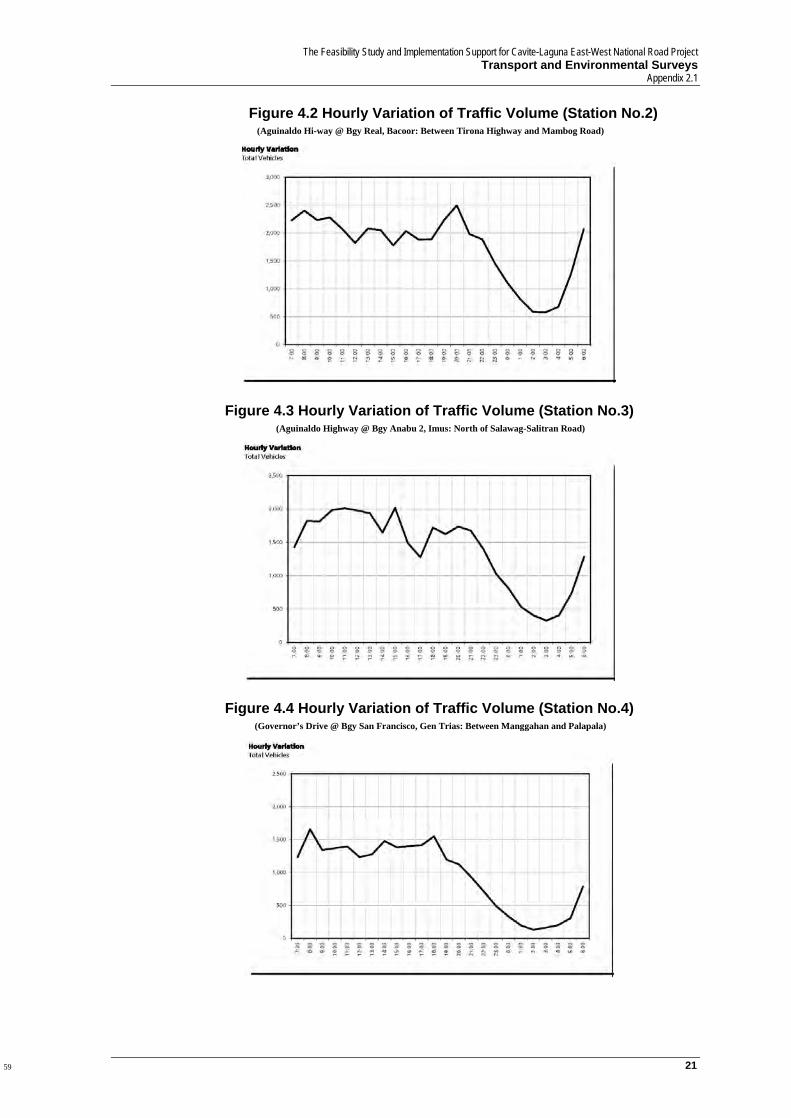
Figure 4.2 Hourly Variation of Traffic Volume (Station No.2) (Aguinaldo Hi-way @ Bgy Real, Bacoor: Between Tirona Highway and Mambog Road)
Figure 4.3 Hourly Variation of Traffic Volume (Station No.3) (Aguinaldo Highway @ Bgy Anabu 2, Imus: North of Salawag-Salitran Road)
Figure 4.4 Hourly Variation of Traffic Volume (Station No.4) (Governor’s Drive @ Bgy San Francisco, Gen Trias: Between Manggahan and Palapala)
59

The Feasibility Study and Implementation Support for the Cavite-Laguna East-West National Road Project Transport and Environmental Surveys Appendix 2.1
22
Figure 4.5 Hourly Variation of Traffic Volume (Station No.5)
(Governor’s Drive @ Bgy Paliparan, Dasmarinas: Between Molino Rd and GMA)
Figure 4.6 Hourly Variation of Traffic Volume (Station No.7) (Aguinaldo Hi-way @ Bgy Zapote III, Bacoor: Boundary of Las Pinas and Bacoor)
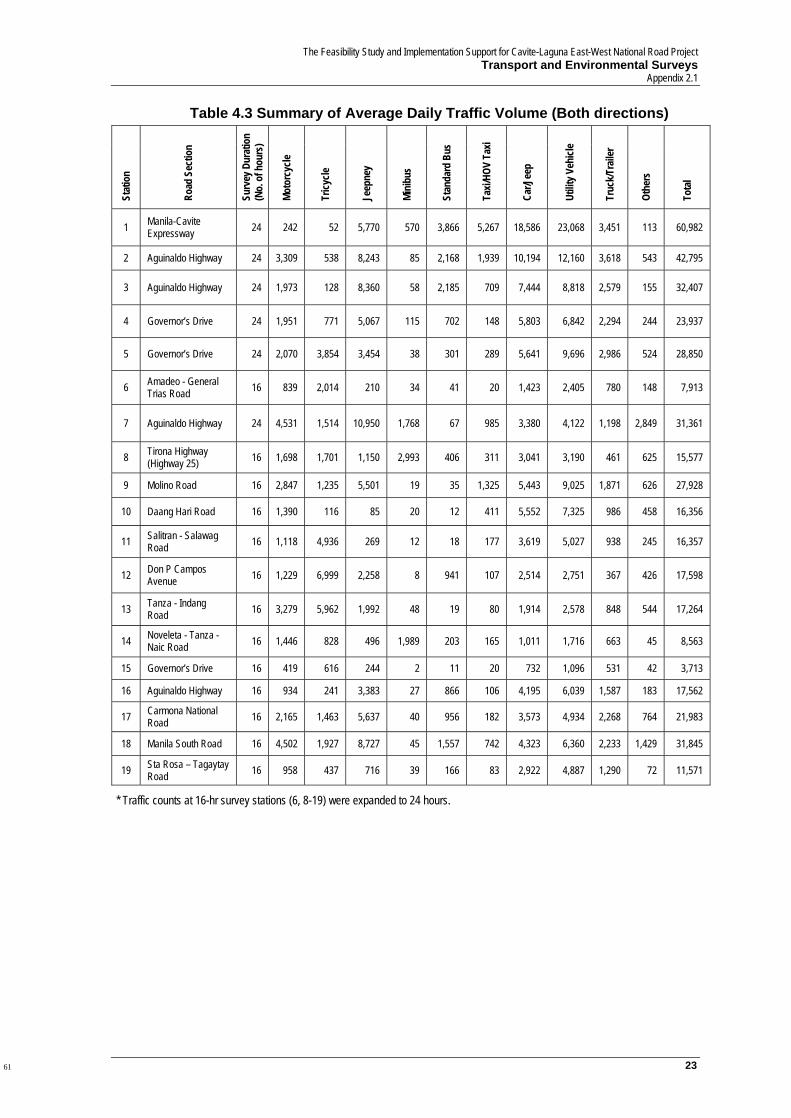
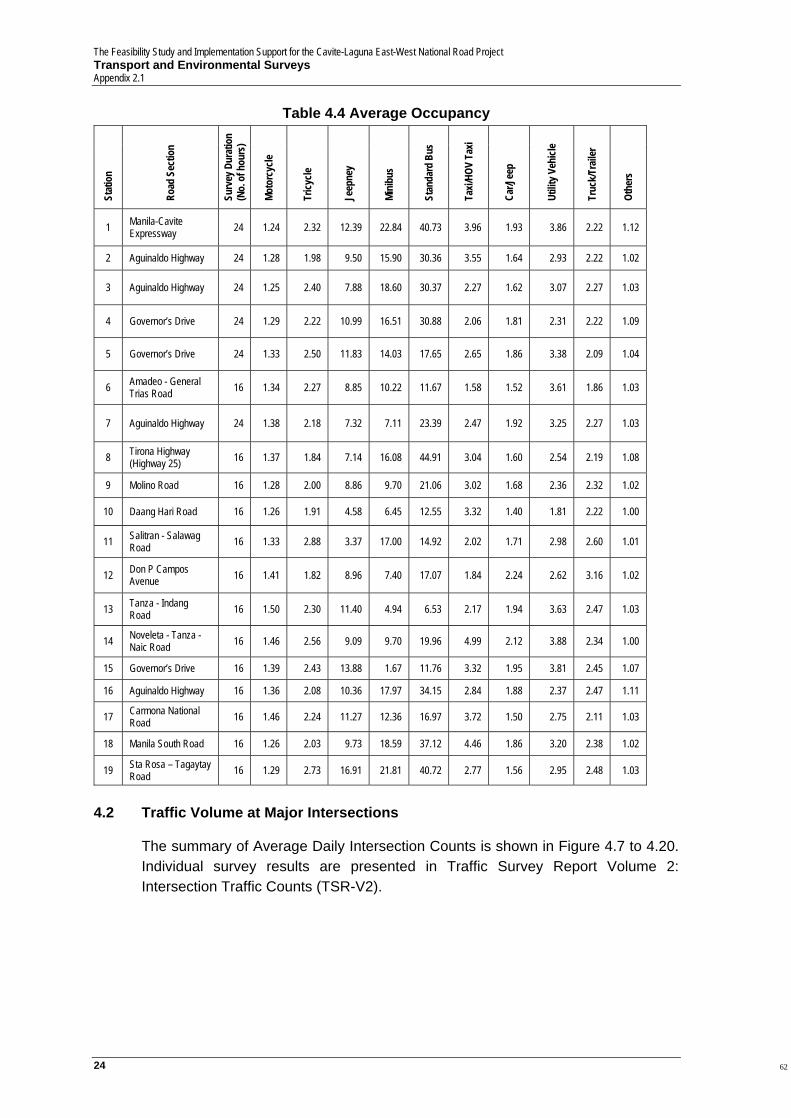
A summary of the Average Daily Traffic Volume and Average Occupancy are shown in Table 4.3 and Table 4.4, respectively. Appendix 1 of this report presents the detailed average daily traffic volume per survey hour as well as average daily passenger car unit and person trips.
60
The Feasibility Study and Implementation Support for Cavite-Laguna East-West National Road Project Transport and Environmental Surveys
Appendix 2.1
23
Table 4.3 Summary of Average Daily Traffic Volume (Both directions) St
atio
n
Road
Sec
tion
Surv
ey D
urat
ion
(No.
of h
ours
)
Moto
rcyc
le
Tricy
cle
Jeep
ney
Mini
bus
Stan
dard
Bus
Taxi/
HOV
Taxi
Car/J
eep
Utilit
y Veh
icle
Truc
k/Tra
iler
Othe
rs
Tota
l
1 Manila-Cavite Expressway 24 242 52 5,770 570 3,866 5,267 18,586 23,068 3,451 113 60,982
2 Aguinaldo Highway 24 3,309 538 8,243 85 2,168 1,939 10,194 12,160 3,618 543 42,795
3 Aguinaldo Highway 24 1,973 128 8,360 58 2,185 709 7,444 8,818 2,579 155 32,407
4 Governor’s Drive 24 1,951 771 5,067 115 702 148 5,803 6,842 2,294 244 23,937
5 Governor’s Drive 24 2,070 3,854 3,454 38 301 289 5,641 9,696 2,986 524 28,850
6 Amadeo - General Trias Road 16 839 2,014 210 34 41 20 1,423 2,405 780 148 7,913
7 Aguinaldo Highway 24 4,531 1,514 10,950 1,768 67 985 3,380 4,122 1,198 2,849 31,361
8 Tirona Highway (Highway 25) 16 1,698 1,701 1,150 2,993 406 311 3,041 3,190 461 625 15,577
9 Molino Road 16 2,847 1,235 5,501 19 35 1,325 5,443 9,025 1,871 626 27,928
10 Daang Hari Road 16 1,390 116 85 20 12 411 5,552 7,325 986 458 16,356
11 Salitran - Salawag Road 16 1,118 4,936 269 12 18 177 3,619 5,027 938 245 16,357
12 Don P Campos Avenue 16 1,229 6,999 2,258 8 941 107 2,514 2,751 367 426 17,598
13 Tanza - Indang Road 16 3,279 5,962 1,992 48 19 80 1,914 2,578 848 544 17,264
14 Noveleta - Tanza - Naic Road 16 1,446 828 496 1,989 203 165 1,011 1,716 663 45 8,563
15 Governor’s Drive 16 419 616 244 2 11 20 732 1,096 531 42 3,713
16 Aguinaldo Highway 16 934 241 3,383 27 866 106 4,195 6,039 1,587 183 17,562
17 Carmona National Road 16 2,165 1,463 5,637 40 956 182 3,573 4,934 2,268 764 21,983
18 Manila South Road 16 4,502 1,927 8,727 45 1,557 742 4,323 6,360 2,233 1,429 31,845
19 Sta Rosa – Tagaytay Road 16 958 437 716 39 166 83 2,922 4,887 1,290 72 11,571
* Traffic counts at 16-hr survey stations (6, 8-19) were expanded to 24 hours.
61
The Feasibility Study and Implementation Support for the Cavite-Laguna East-West National Road Project Transport and Environmental Surveys Appendix 2.1
24
Table 4.4 Average Occupancy St
atio
n
Road
Sec
tion
Surv
ey D
urat
ion
(No.
of h
ours
)
Moto
rcyc
le
Tricy
cle
Jeep
ney
Mini
bus
Stan
dard
Bus
Taxi/
HOV
Taxi
Car/J
eep
Utilit
y Veh
icle
Truc
k/Tra
iler
Othe
rs
1 Manila-Cavite Expressway 24 1.24 2.32 12.39 22.84 40.73 3.96 1.93 3.86 2.22 1.12
2 Aguinaldo Highway 24 1.28 1.98 9.50 15.90 30.36 3.55 1.64 2.93 2.22 1.02
3 Aguinaldo Highway 24 1.25 2.40 7.88 18.60 30.37 2.27 1.62 3.07 2.27 1.03
4 Governor’s Drive 24 1.29 2.22 10.99 16.51 30.88 2.06 1.81 2.31 2.22 1.09
5 Governor’s Drive 24 1.33 2.50 11.83 14.03 17.65 2.65 1.86 3.38 2.09 1.04
6 Amadeo - General Trias Road 16 1.34 2.27 8.85 10.22 11.67 1.58 1.52 3.61 1.86 1.03
7 Aguinaldo Highway 24 1.38 2.18 7.32 7.11 23.39 2.47 1.92 3.25 2.27 1.03
8 Tirona Highway (Highway 25) 16 1.37 1.84 7.14 16.08 44.91 3.04 1.60 2.54 2.19 1.08
9 Molino Road 16 1.28 2.00 8.86 9.70 21.06 3.02 1.68 2.36 2.32 1.02
10 Daang Hari Road 16 1.26 1.91 4.58 6.45 12.55 3.32 1.40 1.81 2.22 1.00
11 Salitran - Salawag Road 16 1.33 2.88 3.37 17.00 14.92 2.02 1.71 2.98 2.60 1.01
12 Don P Campos Avenue 16 1.41 1.82 8.96 7.40 17.07 1.84 2.24 2.62 3.16 1.02
13 Tanza - Indang Road 16 1.50 2.30 11.40 4.94 6.53 2.17 1.94 3.63 2.47 1.03
14 Noveleta - Tanza - Naic Road 16 1.46 2.56 9.09 9.70 19.96 4.99 2.12 3.88 2.34 1.00
15 Governor’s Drive 16 1.39 2.43 13.88 1.67 11.76 3.32 1.95 3.81 2.45 1.07
16 Aguinaldo Highway 16 1.36 2.08 10.36 17.97 34.15 2.84 1.88 2.37 2.47 1.11
17 Carmona National Road 16 1.46 2.24 11.27 12.36 16.97 3.72 1.50 2.75 2.11 1.03
18 Manila South Road 16 1.26 2.03 9.73 18.59 37.12 4.46 1.86 3.20 2.38 1.02
19 Sta Rosa – Tagaytay Road 16 1.29 2.73 16.91 21.81 40.72 2.77 1.56 2.95 2.48 1.03
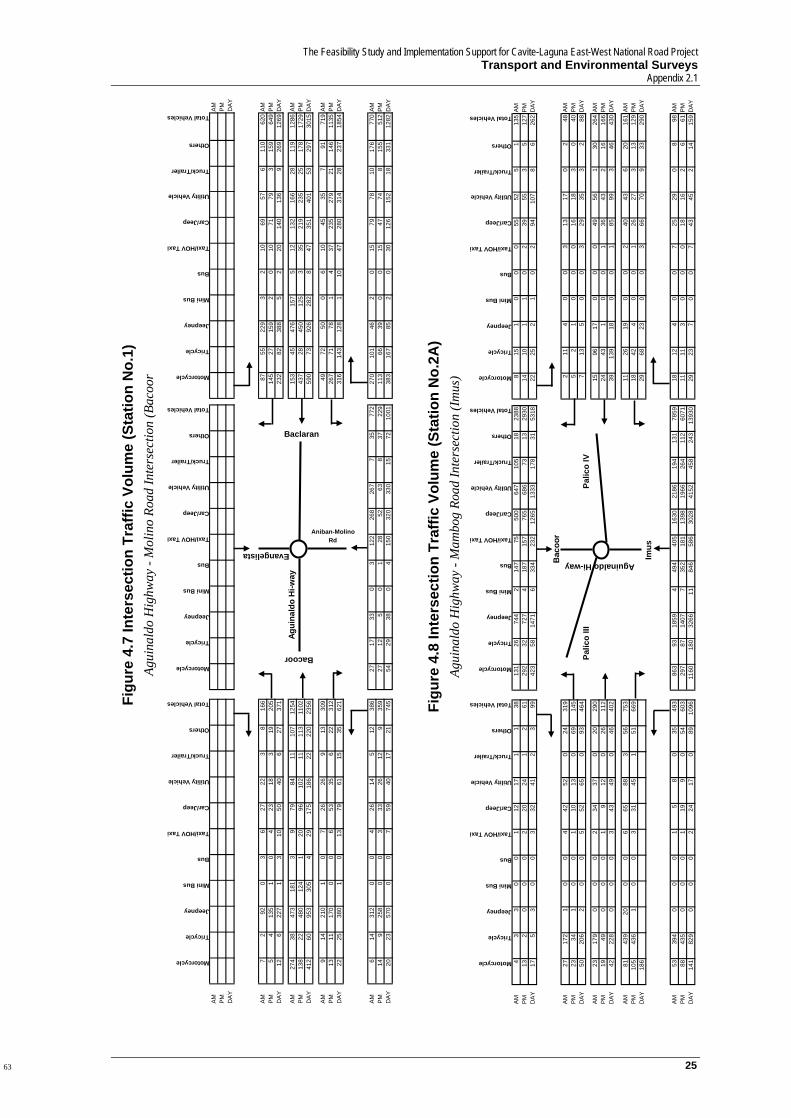
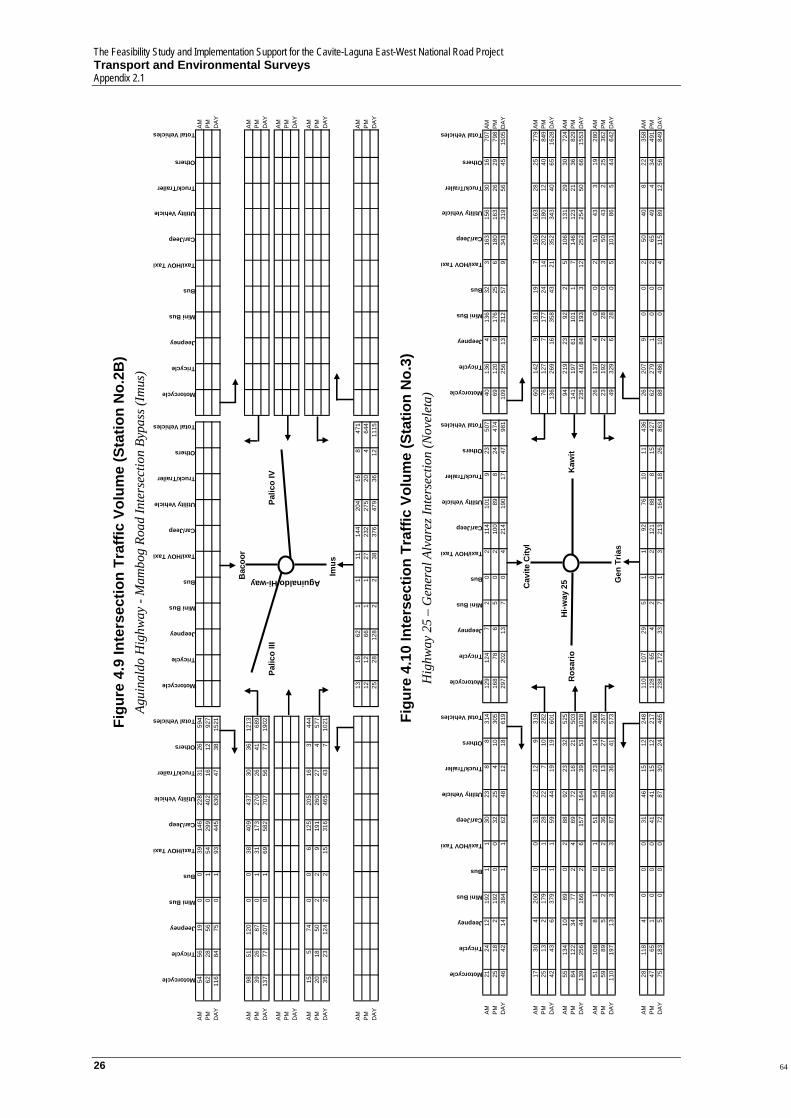
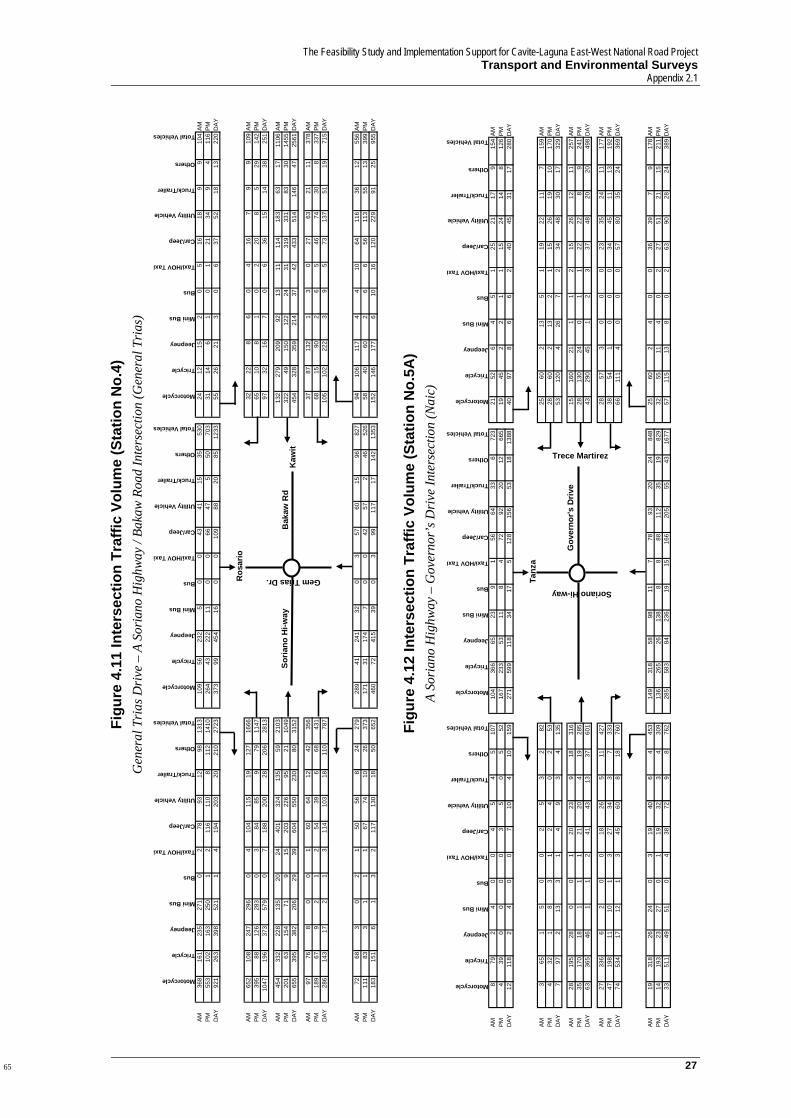
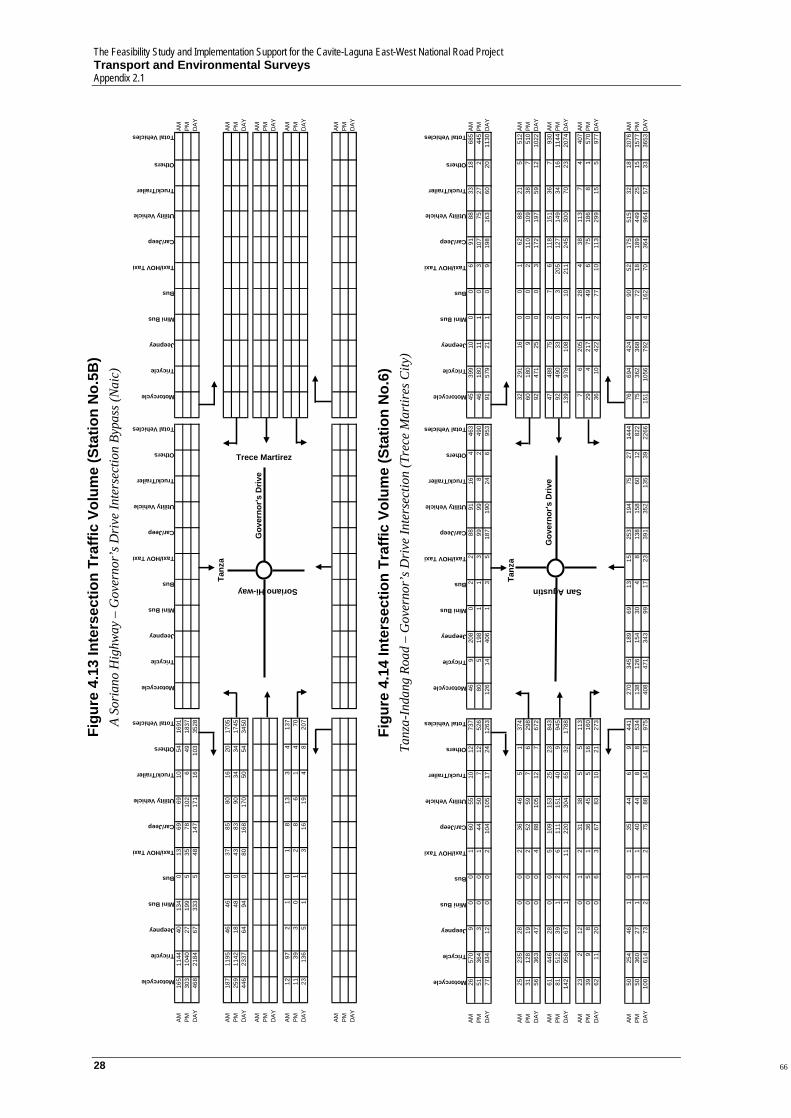
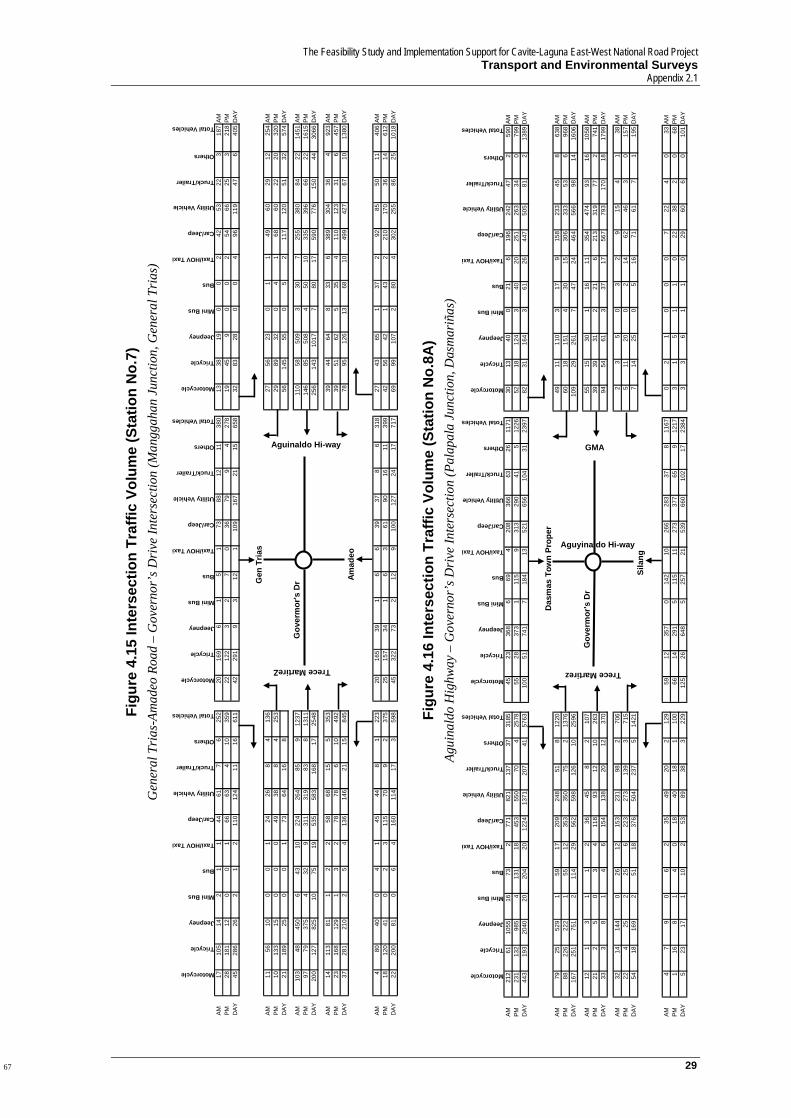
4.2 Traffic Volume at Major Intersections
The summary of Average Daily Intersection Counts is shown in Figure 4.7 to 4.20. Individual survey results are presented in Traffic Survey Report Volume 2: Intersection Traffic Counts (TSR-V2).
62
The Feasibility Study and Implementation Support for Cavite-Laguna East-West National Road Project Transport and Environmental Surveys
Appendix 2.1
25
Motorcycle
Tricycle
Jeepney
Mini Bus
Bus
Taxi/HOV Taxi
Car/Jeep
Utility Vehicle
Truck/Trailer
Others
Total Vehicles
Motorcycle
Tricycle
Jeepney
Mini Bus
Bus
Taxi/HOV Taxi
Car/Jeep
Utility Vehicle
Truck/Trailer
Others
Total Vehicles
Motorcycle
Tricycle
Jeepney
Mini Bus
Bus
Taxi/HOV Taxi
Car/Jeep
Utility Vehicle
Truck/Trailer
Others
Total Vehicles
AMAM
PMPM
DAY
DAY
AM7
292
03
627
223
816
687
5522
93
210
6957
611
062
0AM
PM5
413
51
04
2318
319
205
145
2715
92
010
7179
315
964
9PM
DAY
126
227
13
1050
406
2737
123
282
388
52
2014
013
69
269
1269
DAY
AM27
438
473
181
39
7984
1110
712
5415
345
476
157
512
132
166
2811
912
86AM
PM13
822
480
124
120
9610
211
113
1102
437
2845
012
53
3521
923
525
178
1729
PMD
AY41
260
953
305
429
175
186
2222
023
5659
073
926
282
847
351
401
5329
730
15D
AY
AM9
1421
01
07
2626
913
309
4972
500
610
4535
791
719
AMPM
1311
170
00
653
356
2231
226
771
781
437
235
279
2114
611
35PM
DAY
2225
380
10
1379
6115
3562
131
614
312
81
1047
280
314
2823
718
54D
AY
AM6
1431
20
04
2614
512
386
2717
330
312
226
826
77
3577
227
010
146
20
1579
7810
176
770
AMPM
149
258
00
333
2612
935
927
125
01
2852
638
3722
911
366
390
015
4774
815
551
2PM
DAY
2023
570
00
759
4017
2174
554
2938
04
150
320
330
1572
1001
383
167
852
030
126
152
1833
112
82D
AY
Agui
nald
o H
i-way
Evangelista
Aniban-MolinoRd
Bacoor
Baclaran
Figu
re 4
.7 In
ters
ectio
n Tr
affic
Vol
ume
(Sta
tion
No.
1)
Agui
nald
o H
ighw
ay -
Mol
ino
Road
Inte
rsec
tion
(Bac
oor
Motorcycle
Tricycle
Jeepney
Mini Bus
Bus
Taxi/HOV Taxi
Car/Jeep
Utility Vehicle
Truck/Trailer
Others
Total Vehicles
Motorcycle
Tricycle
Jeepney
Mini Bus
Bus
Taxi/HOV Taxi
Car/Jeep
Utility Vehicle
Truck/Trailer
Others
Total Vehicles
Motorcycle
Tricycle
Jeepney
Mini Bus
Bus
Taxi/HOV Taxi
Car/Jeep
Utility Vehicle
Truck/Trailer
Others
Total Vehicles
AM4
33
00
112
171
138
131
2674
42
147
7550
064
710
518
2388
815
10
00
5552
51
135
AMPM
132
00
02
2024
12
6129
232
727
418
715
776
568
673
1329
3014
101
10
239
553
512
7PM
DAY
175
30
03
3241
23
9942
358
1471
633
423
212
6513
3317
831
5318
2225
21
02
9410
78
626
2D
AY
AM27
172
10
04
4252
024
319
211
40
03
1317
02
48AM
PM23
341
00
110
130
6914
55
21
00
016
183
040
PMD
AY50
206
20
05
5265
093
464
713
50
03
2935
32
88D
AY
AM23
179
00
02
3437
020
290
1596
170
00
4956
130
264
AMPM
1949
00
01
912
026
112
2443
10
01
3643
216
166
PMD
AY42
228
00
03
4349
046
402
3913
918
00
185
993
4643
0D
AY
AM81
439
200
06
6588
356
753
1126
190
02
4043
620
161
AMPM
105
436
10
03
3145
151
669
1842
40
01
2627
313
129
PMD
AY18
629
6823
00
366
709
3329
0D
AY
AM53
394
00
01
58
035
493
863
9318
594
494
405
1630
2186
194
131
7859
1812
40
07
2529
08
98AM
PM88
435
00
01
199
054
603
297
8714
077
352
181
1398
1966
264
112
6071
1111
30
00
1816
26
61PM
DAY
141
829
00
02
2417
089
1096
1160
180
3266
1184
658
630
2841
5245
824
313
930
2923
70
07
4345
214
159
DAY
Aguinaldo Hi-way
Palic
o III
Palic
o IV
Bac
oor
Imus
Figu
re 4
.8 In
ters
ectio
n Tr
affic
Vol
ume
(Sta
tion
No.
2A)
Agui
nald
o H
ighw
ay -
Mam
bog
Road
Inte
rsec
tion
(Im
us)
63
The Feasibility Study and Implementation Support for the Cavite-Laguna East-West National Road Project Transport and Environmental Surveys Appendix 2.1
26
Motorcycle
Tricycle
Jeepney
Mini Bus
Bus
Taxi/HOV Taxi
Car/Jeep
Utility Vehicle
Truck/Trailer
Others
Total Vehicles
Motorcycle
Tricycle
Jeepney
Mini Bus
Bus
Taxi/HOV Taxi
Car/Jeep
Utility Vehicle
Truck/Trailer
Others
Total Vehicles
Motorcycle
Tricycle
Jeepney
Mini Bus
Bus
Taxi/HOV Taxi
Car/Jeep
Utility Vehicle
Truck/Trailer
Others
Total Vehicles
AM54
5619
00
3914
622
831
2659
4AM
PM62
2856
01
5429
940
216
1292
7PM
DAY
116
8475
01
9344
563
047
3815
21D
AY
AM98
5112
00
038
409
437
3036
1213
AMPM
3926
870
131
173
270
2641
689
PMD
AY13
777
207
01
6958
270
756
7719
02D
AY
AMAM
PMPM
DAY
DAY
AM15
574
00
612
520
516
344
4AM
PM20
1850
22
919
126
027
457
7PM
DAY
3523
124
22
1531
646
543
710
21D
AY
AM13
1662
11
1114
420
416
847
1AM
PM12
1266
11
2723
227
520
464
4PM
DAY
2528
128
22
3837
647
936
1211
15D
AY
Aguinaldo Hi-way
Palic
o III
Palic
o IV
Bac
oor
Imus
Figu
re 4
.9 In
ters
ectio
n Tr
affic
Vol
ume
(Sta
tion
No.
2B)
Agui
nald
o H
ighw
ay -
Mam
bog
Road
Inte
rsec
tion
Bypa
ss (I
mus
) Motorcycle
Tricycle
Jeepney
Mini Bus
Bus
Taxi/HOV Taxi
Car/Jeep
Utility Vehicle
Truck/Trailer
Others
Total Vehicles
Motorcycle
Tricycle
Jeepney
Mini Bus
Bus
Taxi/HOV Taxi
Car/Jeep
Utility Vehicle
Truck/Trailer
Others
Total Vehicles
Motorcycle
Tricycle
Jeepney
Mini Bus
Bus
Taxi/HOV Taxi
Car/Jeep
Utility Vehicle
Truck/Trailer
Others
Total Vehicles
AM21
2412
192
11
3023
88
314
129
124
72
02
114
101
923
507
4013
64
136
323
163
156
3016
707
AMPM
2518
219
20
032
254
1030
516
878
65
02
100
898
2447
469
120
917
625
618
016
326
2979
8PM
DAY
4642
1438
41
162
4812
1861
929
720
213
70
421
419
017
4798
110
925
613
312
579
343
319
5645
1505
DAY
AM17
304
200
00
3122
129
319
6014
29
181
197
150
163
2825
779
AMPM
2513
217
91
128
227
1028
276
127
717
724
1420
218
012
4084
9PM
DAY
4243
637
91
159
4419
1960
113
626
916
358
4321
352
343
4065
1628
DAY
AM55
134
1089
02
8892
2332
525
9421
923
922
510
613
129
3072
4AM
PM84
122
3477
24
6972
1621
503
141
197
6110
11
714
612
321
3682
9PM
DAY
139
256
4416
62
615
716
439
5310
2823
541
684
193
312
252
254
5066
1553
DAY
AM51
108
81
01
5154
2314
306
2613
74
00
251
433
1928
0AM
PM59
895
20
236
3813
2726
723
192
228
03
5043
225
362
PMD
AY11
019
713
30
387
9236
4157
349
329
628
05
101
865
4464
2D
AY
AM28
118
40
00
3146
1512
248
110
107
295
11
9276
1011
436
2620
79
00
250
408
2235
8AM
PM47
651
00
041
4115
1221
712
865
42
02
121
888
1542
762
279
10
02
6549
434
491
PMD
AY75
183
50
00
7287
3024
465
238
172
337
13
213
164
1826
863
8848
610
00
411
589
1256
849
DAY
Ros
ario
Cav
ite C
ityl
Kaw
it
Gen
Tria
s
Hi-w
ay 2
5
Figu
re 4
.10
Inte
rsec
tion
Traf
fic V
olum
e (S
tatio
n N
o.3)
H
ighw
ay 2
5 –
Gen
eral
Alv
arez
Inte
rsec
tion
(Nov
elet
a)
64
The Feasibility Study and Implementation Support for Cavite-Laguna East-West National Road Project Transport and Environmental Surveys
Appendix 2.1
27
Motorcycle
Tricycle
Jeepney
Mini Bus
Bus
Taxi/HOV Taxi
Car/Jeep
Utility Vehicle
Truck/Trailer
Others
Total Vehicles
Motorcycle
Tricycle
Jeepney
Mini Bus
Bus
Taxi/HOV Taxi
Car/Jeep
Utility Vehicle
Truck/Trailer
Others
Total Vehicles
Motorcycle
Tricycle
Jeepney
Mini Bus
Bus
Taxi/HOV Taxi
Car/Jeep
Utility Vehicle
Truck/Trailer
Others
Total Vehicles
AM36
816
123
527
10
278
9312
9813
1310
956
232
50
043
4115
3553
024
1215
20
516
189
910
4AM
PM55
310
216
325
01
211
611
08
112
1410
264
4322
211
00
6647
550
703
3114
61
01
2134
94
116
PMD
AY92
126
339
852
11
419
420
320
210
2723
373
9945
416
00
109
8820
8512
3355
2621
30
637
5218
1322
0D
AY
AM65
210
824
729
60
410
411
519
127
1666
3222
86
04
167
99
109
AMPM
395
8812
628
30
384
859
7911
4765
108
10
220
85
2914
2PM
DAY
1047
196
373
579
07
188
200
2820
628
1397
3216
70
636
1514
3825
1D
AY
AM45
433
222
813
520
2440
132
413
559
2103
132
279
209
9213
1111
418
363
1711
06AM
PM20
163
154
719
1520
322
695
2110
4932
249
150
122
2431
319
331
8330
1455
PMD
AY65
539
538
220
629
3960
455
023
080
3152
454
328
359
214
3742
433
514
146
4725
61D
AY
AM97
768
00
160
6412
4235
637
8713
21
30
2763
2111
378
AMPM
189
679
21
254
396
6843
168
1590
26
546
7430
833
7PM
DAY
286
143
172
13
114
103
1811
078
710
510
222
23
95
7313
751
1971
5D
AY
AM72
683
02
150
568
2427
928
941
241
320
357
6015
9682
794
106
117
44
1064
116
3612
556
AMPM
111
833
11
167
7410
2637
317
131
174
70
042
572
4652
658
4060
26
656
113
5513
399
PMD
AY18
315
16
13
211
713
018
5065
246
072
415
390
399
117
1714
213
5315
214
617
76
1016
120
229
9125
955
DAY
Soria
no H
i-way
Ros
ario
Kaw
it
Gem Trias Dr.
Bak
aw R
d
Figu
re 4
.11
Inte
rsec
tion
Traf
fic V
olum
e (S
tatio
n N
o.4)
G
ener
al T
rias
Dri
ve –
A S
oria
no H
ighw
ay /
Baka
w R
oad
Inte
rsec
tion
(Gen
eral
Tri
as)
Motorcycle
Tricycle
Jeepney
Mini Bus
Bus
Taxi/HOV Taxi
Car/Jeep
Utility Vehicle
Truck/Trailer
Others
Total Vehicles
Motorcycle
Tricycle
Jeepney
Mini Bus
Bus
Taxi/HOV Taxi
Car/Jeep
Utility Vehicle
Truck/Trailer
Others
Total Vehicles
Motorcycle
Tricycle
Jeepney
Mini Bus
Bus
Taxi/HOV Taxi
Car/Jeep
Utility Vehicle
Truck/Trailer
Others
Total Vehicles
AM8
792
40
04
54
510
710
436
665
239
156
6433
672
321
526
45
125
2117
915
4AM
PM4
390
00
03
50
552
167
233
5311
84
7292
2012
665
1945
22
11
1524
148
126
PMD
AY12
118
24
00
710
410
159
271
599
118
3417
512
815
653
1813
8840
978
66
240
4531
1728
0D
AY
AM3
651
50
02
53
282
2560
213
51
1922
117
159
AMPM
432
18
31
24
02
5328
602
132
115
2619
1017
0PM
DAY
797
213
31
49
34
135
5312
04
267
234
4830
1732
9D
AY
AM28
195
280
01
2023
918
316
1516
021
11
215
2612
1125
7AM
PM35
170
181
11
2120
419
285
2813
024
01
122
228
924
1PM
DAY
6336
546
11
241
4313
3760
143
290
451
23
3748
2020
498
DAY
AM27
336
62
00
1826
511
427
2857
30
00
2335
2411
177
AMPM
4719
811
101
327
343
733
338
541
00
034
4511
1319
2PM
DAY
7453
417
121
345
608
1876
066
111
40
00
5780
3524
369
DAY
AM19
318
2624
03
1940
64
453
149
318
5898
117
7893
2024
848
2560
24
00
3639
79
178
AMPM
1419
323
270
119
323
430
913
626
526
138
88
8811
235
1982
932
5511
40
227
5121
1521
1PM
DAY
3351
149
510
438
729
876
228
558
384
236
1915
166
205
5543
1677
5711
513
80
263
9028
2438
9D
AY
Soriano Hi-way
Gov
erno
r's D
rive
Trece Martirez
Tanz
a
Fi
gure
4.1
2 In
ters
ectio
n Tr
affic
Vol
ume
(Sta
tion
No.
5A)
A So
rian
o H
ighw
ay –
Gov
erno
r’s D
rive
Inte
rsec
tion
(Nai
c)
65
The Feasibility Study and Implementation Support for the Cavite-Laguna East-West National Road Project Transport and Environmental Surveys Appendix 2.1
28
Motorcycle
Tricycle
Jeepney
Mini Bus
Bus
Taxi/HOV Taxi
Car/Jeep
Utility Vehicle
Truck/Trailer
Others
Total Vehicles
Motorcycle
Tricycle
Jeepney
Mini Bus
Bus
Taxi/HOV Taxi
Car/Jeep
Utility Vehicle
Truck/Trailer
Others
Total Vehicles
Motorcycle
Tricycle
Jeepney
Mini Bus
Bus
Taxi/HOV Taxi
Car/Jeep
Utility Vehicle
Truck/Trailer
Others
Total Vehicles
AM16
511
4440
134
013
6969
1054
1691
AMPM
303
1040
2719
95
3578
102
649
1837
PMD
AY46
821
8467
333
548
147
171
1610
335
28D
AY
AM18
711
9546
460
3785
8016
2017
05AM
PM25
911
4218
480
4383
9034
3417
45PM
DAY
446
2337
6494
080
168
170
5054
3450
DAY
AMAM
PMPM
DAY
DAY
AM12
972
10
18
133
413
7AM
PM11
393
01
28
61
470
PMD
AY23
136
51
13
1619
48
207
DAY
AMAM
PMPM
DAY
DAY
Soriano Hi-way
Gov
erno
r's D
rive
Tanz
a
Trece Martirez
Figu
re 4
.13
Inte
rsec
tion
Traf
fic V
olum
e (S
tatio
n N
o.5B
) A
Sori
ano
Hig
hway
– G
over
nor’
s Dri
ve In
ters
ectio
n By
pass
(Nai
c)
Motorcycle
Tricycle
Jeepney
Mini Bus
Bus
Taxi/HOV Taxi
Car/Jeep
Utility Vehicle
Truck/Trailer
Others
Total Vehicles
Motorcycle
Tricycle
Jeepney
Mini Bus
Bus
Taxi/HOV Taxi
Car/Jeep
Utility Vehicle
Truck/Trailer
Others
Total Vehicles
Motorcycle
Tricycle
Jeepney
Mini Bus
Bus
Taxi/HOV Taxi
Car/Jeep
Utility Vehicle
Truck/Trailer
Others
Total Vehicles
AM26
570
90
01
6055
1012
737
469
208
02
288
9116
446
345
399
100
06
9188
3318
685
AMPM
5136
43
00
144
507
1252
680
519
81
13
9999
82
490
4618
011
10
310
775
272
445
PMD
AY77
934
120
02
104
105
1724
1263
126
1440
61
35
187
190
246
953
9157
921
10
919
816
360
2011
30D
AY
AM25
235
280
02
3646
51
374
3229
116
00
162
8821
551
2AM
PM31
128
190
02
5259
76
298
6018
09
00
211
010
938
751
0PM
DAY
5636
347
00
488
105
127
672
9247
125
00
317
219
759
1210
22D
AY
AM61
446
280
05
109
153
2523
843
4748
875
27
611
815
136
793
0AM
PM81
512
391
26
111
151
409
945
9249
033
03
205
127
149
3416
1144
PMD
AY14
295
867
12
1122
030
465
3217
8813
997
810
82
1021
124
530
070
2320
74D
AY
AM23
212
01
231
385
511
37
620
51
284
3811
37
440
7AM
PM39
98
05
136
455
1616
029
421
71
496
7518
68
157
0PM
DAY
6211
200
63
6783
1021
273
3610
422
277
1011
329
915
597
7D
AY
AM50
254
461
01
3544
69
441
270
345
189
6913
1525
319
475
2714
4476
694
424
090
5217
551
532
1820
76AM
PM50
360
271
11
4044
88
534
138
126
154
304
813
815
860
1282
275
362
368
472
1818
944
925
1515
77PM
DAY
100
614
732
12
7588
1417
975
408
471
343
9917
2339
135
213
539
2266
151
1056
792
416
270
364
964
5733
3653
DAY
Gov
erno
r's D
rive
San Agustin
Tanz
a
Figu
re 4
.14
Inte
rsec
tion
Traf
fic V
olum
e (S
tatio
n N
o.6)
Ta
nza-
Inda
ng R
oad
– G
over
nor’
s Dri
ve In
ters
ectio
n (T
rece
Mar
tires
City
)
66
The Feasibility Study and Implementation Support for Cavite-Laguna East-West National Road Project Transport and Environmental Surveys
Appendix 2.1
29
Motorcycle
Tricycle
Jeepney
Mini Bus
Bus
Taxi/HOV Taxi
Car/Jeep
Utility Vehicle
Truck/Trailer
Others
Total Vehicles
Motorcycle
Tricycle
Jeepney
Mini Bus
Bus
Taxi/HOV Taxi
Car/Jeep
Utility Vehicle
Truck/Trailer
Others
Total Vehicles
Motorcycle
Tricycle
Jeepney
Mini Bus
Bus
Taxi/HOV Taxi
Car/Jeep
Utility Vehicle
Truck/Trailer
Others
Total Vehicles
AM17
105
142
11
4461
76
252
2016
96
15
173
8812
1138
013
3819
00
242
5322
318
7AM
PM28
181
120
01
6663
410
359
2212
23
27
036
799
427
819
459
00
254
6625
321
8PM
DAY
4528
626
21
211
012
411
1661
142
291
93
121
109
167
2115
658
3283
280
04
9611
947
640
5D
AY
AM11
5610
00
124
268
413
627
5623
01
149
6029
1225
4AM
PM10
133
150
00
4938
84
253
2989
320
41
6860
2220
320
PMD
AY21
189
250
01
7364
168
56
145
550
52
117
120
5132
574
DAY
AM10
348
450
643
1022
426
485
912
3711
058
509
330
725
538
084
2214
51AM
PM97
7937
54
329
311
319
838
1311
146
8550
84
5010
335
396
6622
1615
PMD
AY20
012
782
510
7519
535
583
168
1725
4825
614
310
177
8017
590
776
150
4430
66D
AY
AM14
113
811
22
5868
155
353
3944
648
336
389
304
364
923
AMPM
2316
812
91
32
7878
610
492
3951
625
354
110
123
316
457
PMD
AY37
281
210
25
413
614
621
1584
578
9512
613
6810
499
427
6710
1380
DAY
AM4
8040
04
145
448
122
320
165
391
66
3937
86
318
2743
651
372
9285
5011
406
AMPM
1812
041
02
311
570
92
375
2515
734
16
361
9016
1139
942
5642
143
221
017
036
1461
2PM
DAY
2220
081
06
416
011
417
359
845
322
732
129
100
127
2417
717
6999
107
280
430
225
586
2510
18D
AY
Trece MartireZ
Gen
Tria
s
Aguinaldo Hi-way
Amad
eo
Gov
erm
or's
Dr
Figu
re 4
.15
Inte
rsec
tion
Traf
fic V
olum
e (S
tatio
n N
o.7)
G
ener
al T
rias
-Am
adeo
Roa
d –
Gov
erno
r’s D
rive
Inte
rsec
tion
(Man
ggah
an J
unct
ion,
Gen
eral
Tri
as)
Motorcycle
Tricycle
Jeepney
Mini Bus
Bus
Taxi/HOV Taxi
Car/Jeep
Utility Vehicle
Truck/Trailer
Others
Total Vehicles
Motorcycle
Tricycle
Jeepney
Mini Bus
Bus
Taxi/HOV Taxi
Car/Jeep
Utility Vehicle
Truck/Trailer
Others
Total Vehicles
Motorcycle
Tricycle
Jeepney
Mini Bus
Bus
Taxi/HOV Taxi
Car/Jeep
Utility Vehicle
Truck/Trailer
Others
Total Vehicles
AM21
261
1055
1673
277
182
113
737
3185
4523
368
669
420
836
663
2611
7130
1340
021
619
624
247
259
0AM
PM23
113
298
54
131
1845
355
070
425
7855
2837
31
115
931
329
041
512
2652
1812
43
4020
251
263
340
799
PMD
AY44
319
320
4020
204
2012
2413
7120
741
5763
100
5174
17
184
1352
165
610
431
2397
8231
164
361
2644
750
581
213
89D
AY
AM79
2552
91
5917
209
248
518
1220
4911
110
317
915
823
345
863
8AM
PM88
226
222
155
1235
335
075
213
7660
1815
14
3015
306
333
536
968
PMD
AY16
725
175
12
114
2956
259
812
610
2596
109
2926
17
4724
464
566
9814
1606
DAY
AM12
13
11
236
458
210
755
1530
116
1135
447
493
1610
58AM
PM21
25
03
411
893
1210
263
3939
312
216
213
319
772
741
PMD
AY33
38
14
615
413
820
1237
094
5461
337
1756
779
317
018
1799
DAY
AM32
1414
40
2612
153
231
982
706
23
50
32
915
41
38AM
PM22
425
225
622
327
313
93
715
511
200
214
6246
30
157
PMD
AY54
1816
92
5118
376
504
237
514
217
1425
05
1671
617
119
5D
AY
AM4
79
06
235
4920
212
959
1235
70
142
1026
628
337
811
670
21
00
07
224
033
AMPM
116
81
40
1840
181
100
6614
291
511
511
273
377
659
1217
31
51
10
2238
20
68PM
DAY
523
171
102
5389
383
229
125
2664
85
257
2153
966
010
217
2384
33
61
10
2960
60
101
DAY
Trece Martirez
Das
mas
Tow
n Pr
oper
GMA
Sila
ng
Gov
erm
or's
Dr
Aguyinaldo Hi-way
Figu
re 4
.16
Inte
rsec
tion
Traf
fic V
olum
e (S
tatio
n N
o.8A
) Ag
uina
ldo
Hig
hway
– G
over
nor’
s Dri
ve In
ters
ectio
n (P
alap
ala
Junc
tion,
Das
mar
iñas
)
67

The Feasibility Study and Implementation Support for the Cavite-Laguna East-West National Road Project Transport and Environmental Surveys Appendix 2.1
30
Figu
re 4
.17
Inte
rsec
tion
Traf
fic V
olum
e (S
tatio
n N
o.8B
) Ag
uina
ldo
Hig
hway
– G
over
nor’
s Dri
ve In
ters
ectio
n –
SLEx
Byp
ass (
Das
mar
iñas
) Motorcycle
Tricycle
Jeepney
Mini Bus
Bus
Taxi/HOV Taxi
Car/Jeep
Utility Vehicle
Truck/Trailer
Others
Total Vehicles
Motorcycle
Tricycle
Jeepney
Mini Bus
Bus
Taxi/HOV Taxi
Car/Jeep
Utility Vehicle
Truck/Trailer
Others
Total Vehicles
Motorcycle
Tricycle
Jeepney
Mini Bus
Bus
Taxi/HOV Taxi
Car/Jeep
Utility Vehicle
Truck/Trailer
Others
Total Vehicles
AM69
103
273
533
917
227
111
27
1049
AMPM
114
100
341
637
940
344
617
014
1633
PMD
AY18
320
361
411
7018
575
717
282
2126
82D
AY
AM44
8216
00
3111
8212
019
1355
3AM
PM59
3518
62
327
7813
123
1255
7PM
DAY
103
117
346
263
1816
025
142
2511
10D
AY
AMAM
PMPM
DAY
DAY
AM23
1513
112
296
134
361
327
AMPM
1510
112
32
121
120
370
317
PMD
AY38
2524
315
421
725
473
164
4D
AY
AM17
3021
12
391
161
3714
372
AMPM
3013
162
83
155
201
4310
475
PMD
AY47
4337
310
624
636
280
2484
7D
AY
Aguyinaldo Hi-way
Das
mar
inas
Tow
n Pr
oper
GMA
Sila
ng
Figu
re 4
.18
Inte
rsec
tion
Traf
fic V
olum
e (S
tatio
n N
o.9)
G
over
nor’
s Dri
ve In
ters
ectio
n –
Mol
ino-
Palip
aran
Roa
d In
ters
ectio
n (D
asm
ariñ
as)
Motorcycle
Tricycle
Jeepney
Mini Bus
Bus
Taxi/HOV Taxi
Car/Jeep
Utility Vehicle
Truck/Trailer
Others
Total Vehicles
Motorcycle
Tricycle
Jeepney
Mini Bus
Bus
Taxi/HOV Taxi
Car/Jeep
Utility Vehicle
Truck/Trailer
Others
Total Vehicles
Motorcycle
Tricycle
Jeepney
Mini Bus
Bus
Taxi/HOV Taxi
Car/Jeep
Utility Vehicle
Truck/Trailer
Others
Total Vehicles
AM42
1860
010
373
124
2533
380
129
277
860
12
122
189
4223
865
AMPM
188
751
34
5987
1911
280
102
170
922
22
8115
740
3367
3PM
DAY
6026
135
113
713
221
144
4466
023
144
717
82
34
203
346
8256
1538
DAY
AM19
1956
012
344
7519
724
794
261
850
65
7113
742
4273
8AM
PM28
1275
212
692
136
2725
408
110
157
101
14
712
318
958
3377
5PM
DAY
4731
131
224
913
621
146
3265
520
441
818
61
1012
194
326
100
7515
13D
AY
AM11
452
285
175
741
353
575
1115
6310
963
260
331
2548
767
211
317
1772
AMPM
128
6226
83
277
535
674
157
2818
8410
151
246
243
1842
960
117
18
1664
PMD
AY24
211
455
34
102
1494
812
0923
239
3447
210
114
506
574
4391
612
7328
425
3436
DAY
AMAM
PMPM
DAY
DAY
AMAM
PMPM
DAY
DAY
Gov
erno
r's D
r
Molino Rd
GMAAguinaldo Hi-way
68
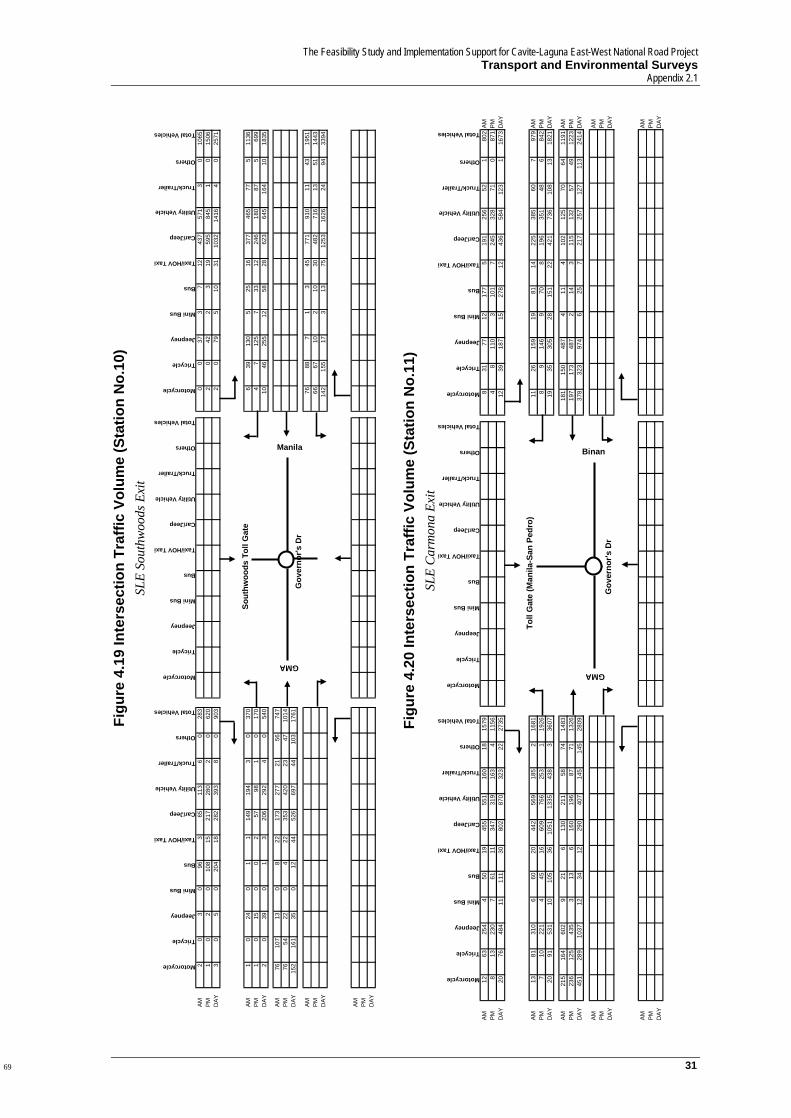
The Feasibility Study and Implementation Support for Cavite-Laguna East-West National Road Project Transport and Environmental Surveys
Appendix 2.1
31
Motorcycle
Tricycle
Jeepney
Mini Bus
Bus
Taxi/HOV Taxi
Car/Jeep
Utility Vehicle
Truck/Trailer
Others
Total Vehicles
Motorcycle
Tricycle
Jeepney
Mini Bus
Bus
Taxi/HOV Taxi
Car/Jeep
Utility Vehicle
Truck/Trailer
Others
Total Vehicles
Motorcycle
Tricycle
Jeepney
Mini Bus
Bus
Taxi/HOV Taxi
Car/Jeep
Utility Vehicle
Truck/Trailer
Others
Total Vehicles
AM2
03
096
365
113
60
283
00
373
712
437
571
30
1065
PM1
02
010
815
217
280
20
620
20
422
319
595
845
10
1506
DAY
30
50
204
1828
239
38
090
32
079
510
3110
3214
164
025
71
AM1
024
01
114
919
43
037
06
3913
05
2516
377
465
775
1136
PM1
015
00
257
981
017
04
712
57
3312
246
180
875
699
DAY
20
390
13
206
292
40
540
1046
255
1258
2862
364
516
410
1835
AM76
107
130
822
173
277
2156
747
PM76
5422
04
2235
342
023
4710
14D
AY15
216
135
012
4452
669
744
103
1761
AM76
887
13
4577
191
011
4319
51PM
6667
102
1030
482
716
1351
1443
DAY
142
155
173
1375
1253
1626
2494
3394
AM PM DAY
Gov
erno
r's D
r
Sout
hwoo
ds T
oll G
ate
ManilaGMA
Figu
re 4
.19
Inte
rsec
tion
Traf
fic V
olum
e (S
tatio
n N
o.10
) SL
E So
uthw
oods
Exi
t Motorcycle
Tricycle
Jeepney
Mini Bus
Bus
Taxi/HOV Taxi
Car/Jeep
Utility Vehicle
Truck/Trailer
Others
Total Vehicles
Motorcycle
Tricycle
Jeepney
Mini Bus
Bus
Taxi/HOV Taxi
Car/Jeep
Utility Vehicle
Truck/Trailer
Others
Total Vehicles
Motorcycle
Tricycle
Jeepney
Mini Bus
Bus
Taxi/HOV Taxi
Car/Jeep
Utility Vehicle
Truck/Trailer
Others
Total Vehicles
AM12
6325
44
5019
455
551
160
1815
798
3177
1217
75
191
256
521
802
AMPM
813
230
761
1134
731
916
34
1156
48
110
310
17
245
328
710
871
PMD
AY20
7648
411
111
3080
287
032
322
2735
1239
187
1527
812
436
584
123
116
73D
AY
AM13
8131
06
6020
442
569
185
216
8111
2615
919
8114
225
385
607
979
AMPM
710
221
445
1660
976
625
31
1926
89
146
970
819
635
148
684
2PM
DAY
2091
531
1010
536
1051
1335
438
336
0719
3530
528
151
2242
173
610
813
1821
DAY
AM21
516
460
29
216
130
211
5874
1483
181
150
487
411
410
212
570
6411
91AM
PM23
612
543
53
136
160
196
8771
1326
197
173
487
214
311
513
257
4912
23PM
DAY
451
289
1037
1234
1229
040
714
514
528
0937
832
397
46
257
217
257
127
113
2414
DAY
AMAM
PMPM
DAY
DAY
AMAM
PMPM
DAY
DAY
Gov
erno
r's D
r
Toll
Gat
e (M
anila
-San
Ped
ro)
BinanGMA
Figu
re 4
.20
Inte
rsec
tion
Traf
fic V
olum
e (S
tatio
n N
o.11
) SL
E C
arm
ona
Exit
69

The Feasibility Study and Implementation Support for the Cavite-Laguna East-West National Road Project Transport and Environmental Surveys Appendix 2.1
32
4.3 Travel Speed Survey
A summary of results of the travel speed survey is shown in Table 4.4. Detailed results are presented in Traffic Survey Report Volume 3: Travel Speed Survey Report (TSR-V3).
Tabl
e 4.
4 Su
mm
ary
of T
rave
l Spe
ed S
urve
y by
Rou
te
From
To
AM
Off
PM
Tota
lA
MO
ffP
MTo
tal
AM
Off
PM
Tota
lC
ar26
.48
27.0
626
.60
26.7
10.
440.
130.
550.
3714
.88
19.8
931
.75
22.1
7Tr
uck
27.6
427
.37
25.7
426
.92
1.51
1.27
1.58
1.45
26.6
515
.33
32.7
024
.89
Jeep
ney
23.3
923
.28
23.3
523
.34
1.59
1.87
1.89
1.79
33.9
834
.65
26.8
231
.82
Bus
26.9
126
.81
26.8
226
.85
1.45
1.51
1.44
1.47
29.2
122
.35
23.7
825
.11
Car
26.8
626
.93
26.5
726
.79
0.97
0.56
0.77
0.77
25.2
37.
9112
.67
15.2
7Tr
uck
24.5
624
.77
24.6
324
.65
0.98
0.86
1.22
1.02
30.6
423
.48
20.9
125
.01
Jeep
ney
23.3
823
.06
23.5
323
.32
1.15
1.19
1.06
1.13
29.8
817
.01
19.9
022
.26
Bus
26.0
026
.71
25.6
126
.11
0.94
1.10
1.14
1.06
33.4
029
.76
29.7
430
.97
Car
36.2
945
.17
33.2
038
.22
0.26
0.56
0.77
0.53
24.4
44.
7718
.38
15.8
6Tr
uck
34.6
940
.33
33.1
236
.05
0.55
0.41
0.56
0.51
23.1
312
.76
18.5
418
.14
Jeep
ney
34.8
735
.52
34.8
635
.09
0.95
0.90
0.93
0.93
14.0
612
.14
39.9
222
.04
Bus
34.6
940
.33
33.1
236
.05
0.55
0.41
0.56
0.51
23.1
312
.76
18.5
418
.14
Car
34.9
444
.84
32.7
637
.51
0.55
0.21
0.61
0.46
23.4
66.
5023
.85
17.9
4Tr
uck
34.4
442
.66
32.1
536
.42
0.52
0.35
0.54
0.47
21.9
312
.81
26.0
520
.26
Jeep
ney
37.6
736
.40
35.4
136
.49
0.42
0.34
0.36
0.37
27.5
420
.13
18.5
322
.07
Bus
34.9
444
.84
32.7
637
.51
0.55
0.21
0.61
0.46
23.4
66.
5023
.85
17.9
4C
ar24
.11
21.9
021
.80
22.6
00.
580.
420.
420.
4712
.20
9.57
6.26
9.35
Truc
k21
.51
21.6
620
.04
21.0
70.
580.
420.
420.
4714
.16
9.51
5.81
9.82
Jeep
ney
22.9
319
.99
20.5
521
.16
1.26
1.26
1.26
1.26
18.7
816
.45
19.9
218
.38
Car
25.3
225
.50
23.1
424
.65
0.48
0.34
0.37
0.40
6.87
7.57
7.00
7.15
Truc
k24
.59
25.5
121
.05
23.7
20.
480.
340.
370.
407.
907.
426.
377.
23Je
epne
y22
.25
16.5
216
.64
18.4
70.
970.
970.
970.
9734
.23
22.9
321
.95
26.3
7C
ar34
.96
35.9
834
.89
35.2
80.
610.
410.
540.
524.
813.
533.
373.
90Tr
uck
32.6
132
.91
32.6
132
.71
0.95
0.88
0.82
0.88
5.67
5.22
5.17
5.35
Jeep
ney
31.2
031
.45
30.6
631
.11
1.02
1.16
1.09
1.09
5.48
7.65
6.89
6.67
Car
36.6
137
.55
36.4
236
.86
0.54
0.34
0.34
0.41
2.99
2.04
2.03
2.35
Truc
k34
.32
36.1
734
.82
35.1
00.
480.
270.
410.
392.
931.
642.
052.
21Je
epne
y0.
000.
000.
000.
000.
000.
000.
000.
000.
000.
000.
000.
00C
ar21
.94
23.5
422
.32
22.6
01.
451.
231.
551.
4116
.17
17.5
512
.38
15.3
6B
us19
.37
26.1
121
.16
22.2
11.
811.
601.
681.
6921
.05
13.5
210
.21
14.9
3Tr
uck
34.6
235
.77
32.8
034
.40
0.66
0.63
0.88
0.72
6.34
7.40
8.40
7.38
Car
24.4
923
.49
22.8
923
.62
1.33
1.24
1.56
1.38
15.4
313
.37
20.6
916
.50
Bus
23.4
223
.03
21.7
822
.74
1.59
1.40
1.62
1.54
18.6
714
.64
10.5
314
.62
Truc
k35
.07
36.4
434
.23
35.2
50.
780.
580.
810.
727.
417.
0916
.26
10.2
654
.7C
ar48
.55
50.6
147
.12
48.7
60.
190.
150.
160.
172.
142.
280.
671.
69B
us42
.48
42.5
641
.94
42.3
30.
220.
280.
270.
262.
102.
912.
482.
50Tr
uck
47.6
152
.62
53.6
851
.30
0.36
0.19
0.34
0.29
4.96
1.85
3.91
3.57
54.7
Car
44.7
848
.08
38.2
943
.72
0.19
0.18
0.29
0.22
2.56
2.78
2.58
2.64
Bus
43.0
942
.86
43.1
043
.02
0.30
0.37
0.37
0.34
3.82
5.27
31.6
913
.59
Truc
k47
.72
45.8
343
.74
45.7
60.
160.
130.
320.
201.
831.
2630
.90
11.3
351
.5C
ar44
.82
51.2
950
.38
48.8
30.
650.
430.
310.
469.
828.
587.
508.
6347
.4 *
*B
us51
.18
57.2
658
.56
55.6
70.
450.
320.
370.
386.
858.
219.
538.
2046
.4 *
**Tr
uck
48.4
051
.75
50.8
350
.33
0.37
0.29
0.33
0.33
4.81
4.77
5.77
5.12
51.5
Car
50.9
961
.94
42.9
251
.95
0.36
0.33
0.57
0.42
12.8
711
.27
12.5
512
.23
47.4
**
Bus
53.1
455
.44
45.4
751
.35
0.32
0.27
0.75
0.45
7.24
6.09
42.0
318
.45
46.4
***
Truc
k51
.79
54.6
345
.22
50.5
50.
280.
140.
540.
325.
674.
348.
836.
28
* -
Surv
ey tr
ip d
ista
nce
from
Cal
amba
to P
obla
cion
Jct
. To
Bat
anga
s C
ity P
ort A
rea,
whe
re b
us a
nd tr
uck
traffi
c ta
ke a
diff
eren
t rou
te.
**
- S
urve
y tri
p di
stan
ce fr
o C
alam
ba to
Taf
t Ave
nue,
Man
ila, w
here
bus
es ta
ke T
aft A
ve. t
o/fro
m L
awto
n ar
ea.
***
- Su
rvey
trip
dis
tanc
e fro
m C
alam
ba to
Inte
rsec
tion
of Q
uirin
o H
ighw
ay a
nd O
smen
a H
ighw
ay, w
here
truc
ks ta
ke a
righ
t tur
n to
war
ds P
laza
Dila
w.
Sal
itran
4.1
Agui
nald
o H
ighw
ay-M
olin
o R
oad
(S
alaw
ag-S
alitr
an R
oad)
Sal
itran
Sal
awag
4.1
Sal
awag
Baco
or-G
over
nors
Driv
e (M
olin
o R
oad)
Gov
erno
rs D
rive
Bac
oor
46.3
29.0
Bac
oor
Gov
erno
rs
Driv
e
46
.3
Bin
an
N
aic
Ave
. No.
of S
tops
(tim
es/k
m)
Zapo
te -
Sila
ng (A
guin
aldo
Hig
hway
)
29.0
Nai
c - B
inan
(Gov
erno
rs D
rive)
Mod
e of
Tr
ansp
ort
Sila
ng
Za
pote
Bin
an
N
aic
20.7
Zapo
te
Sila
ng
46.3
Rou
te N
ame
Dire
ctio
nLe
ngth
(k
m)
Ave
rage
Rat
io o
f Sto
ppin
g Ti
me
(%)
Ave
rage
Tra
vel S
peed
(km
/h)
Agui
nald
o H
ighw
ay -
Gov
erno
r's D
rive
(Tiro
na H
ighw
ay)
Gov
erno
r's
Driv
eA
guin
aldo
H
ighw
ay28
.8
Agu
inal
do
Hig
hway
Gov
erno
r's
Driv
e28
.8
Cal
amba
- B
atan
gas
Por
t Are
a
Bat
anga
s Po
rt Ar
eaC
alam
ba52
.8 *
Cal
amba
Bata
ngas
Por
t A
rea
52.8
*
Man
ila P
ort A
rea
- Cal
amba
(Via
Sou
th L
uzon
Tol
lway
)
Cal
amba
Man
ila P
ort
Are
a
Man
ila P
ort
Are
aC
alam
ba
70

The Feasibility Study and Implementation Support for Cavite-Laguna East-West National Road Project Transport and Environmental Surveys
Appendix 2.1
33
4.4 Public Transport Routes Survey results indicate the following findings:
• The long distance routes are plied by the buses while the short distance routes are plied by jeepneys and FX/HOV which compete with each other.
• Buses do also compete with jeepneys and FX/HOV modes but only for portions of their total routes.
Detailed results are presented in Traffic Survey Report Volume 4: Public Transport Route/Service Frequency Survey Report (TSR-V4). Figures 4.21 to 4.23 show the public transport service coverage in the study area.
Figure 4.21 Bus Service Coverage
Legend: Bus Route
Coverage
71
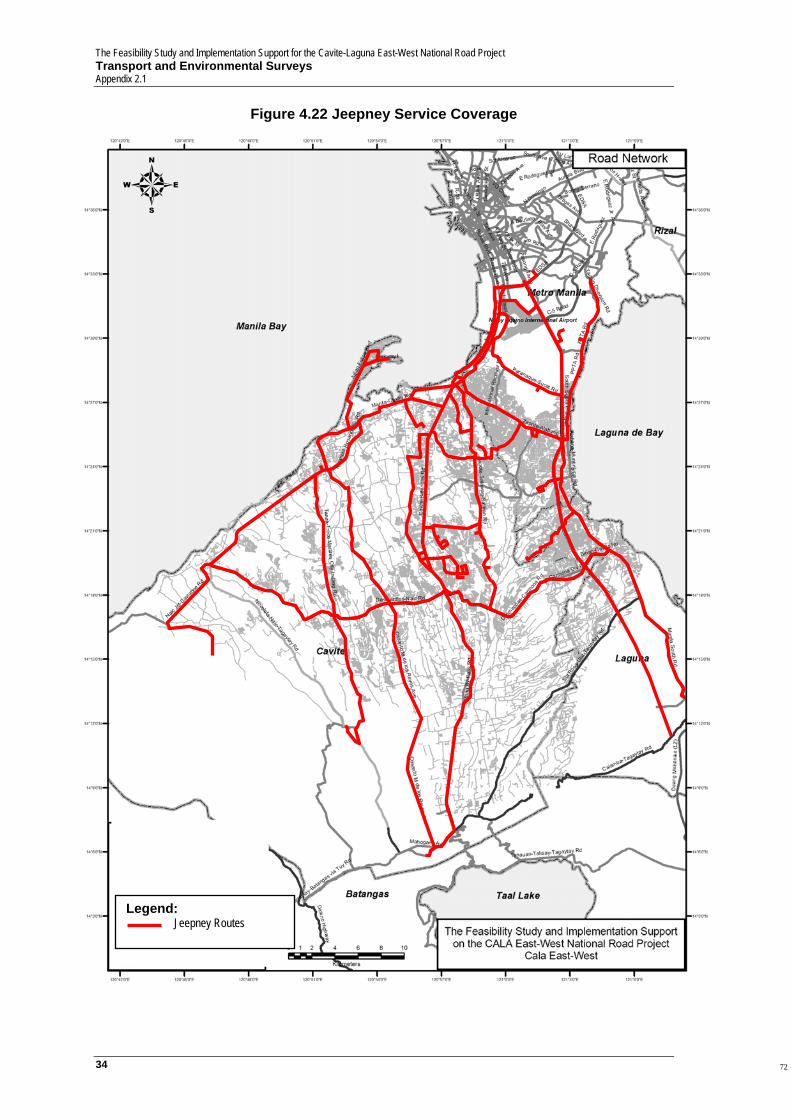
The Feasibility Study and Implementation Support for the Cavite-Laguna East-West National Road Project Transport and Environmental Surveys Appendix 2.1
34
Figure 4.22 Jeepney Service Coverage
Legend: Jeepney Routes
72
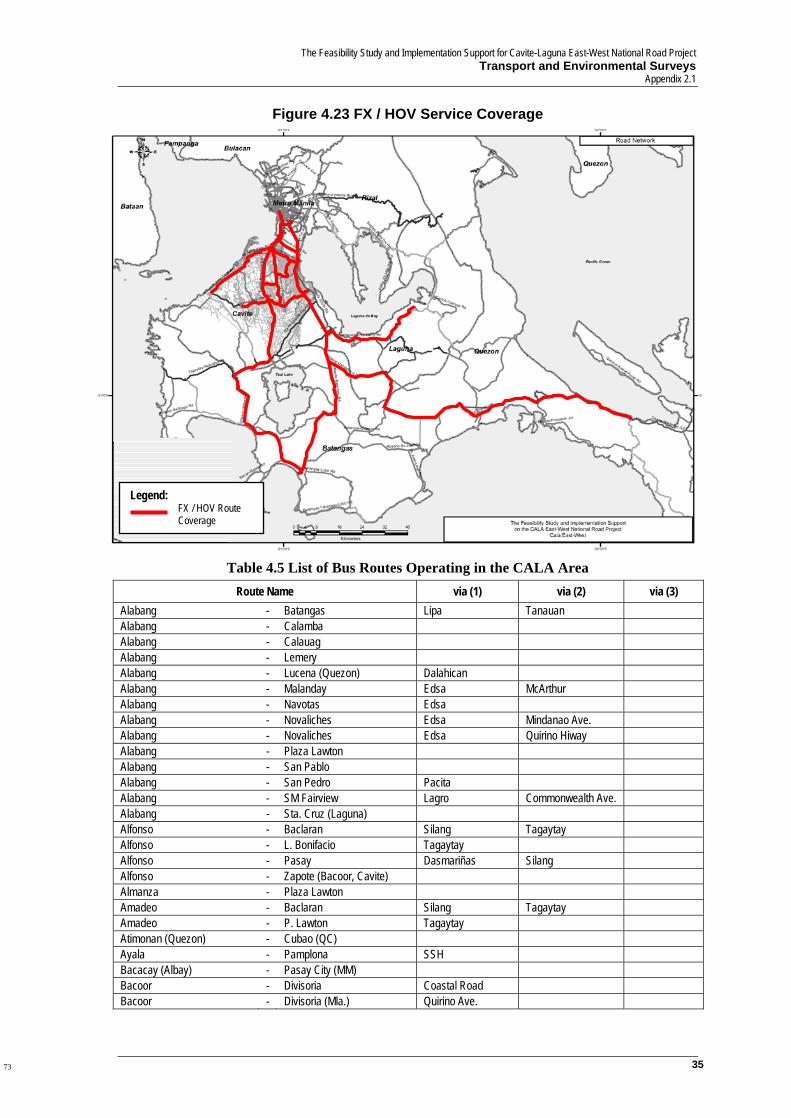
The Feasibility Study and Implementation Support for Cavite-Laguna East-West National Road Project Transport and Environmental Surveys
Appendix 2.1
35
Figure 4.23 FX / HOV Service Coverage
Table 4.5 List of Bus Routes Operating in the CALA Area Route Name via (1) via (2) via (3)
Alabang - Batangas Lipa Tanauan Alabang - Calamba Alabang - Calauag Alabang - Lemery Alabang - Lucena (Quezon) Dalahican Alabang - Malanday Edsa McArthur Alabang - Navotas Edsa Alabang - Novaliches Edsa Mindanao Ave. Alabang - Novaliches Edsa Quirino Hiway Alabang - Plaza Lawton Alabang - San Pablo Alabang - San Pedro Pacita Alabang - SM Fairview Lagro Commonwealth Ave. Alabang - Sta. Cruz (Laguna) Alfonso - Baclaran Silang Tagaytay Alfonso - L. Bonifacio Tagaytay Alfonso - Pasay Dasmariñas Silang Alfonso - Zapote (Bacoor, Cavite) Almanza - Plaza Lawton Amadeo - Baclaran Silang Tagaytay Amadeo - P. Lawton Tagaytay Atimonan (Quezon) - Cubao (QC) Ayala - Pamplona SSH Bacacay (Albay) - Pasay City (MM) Bacoor - Divisoria Coastal Road Bacoor - Divisoria (Mla.) Quirino Ave.
Legend: FX / HOV Route Coverage
73
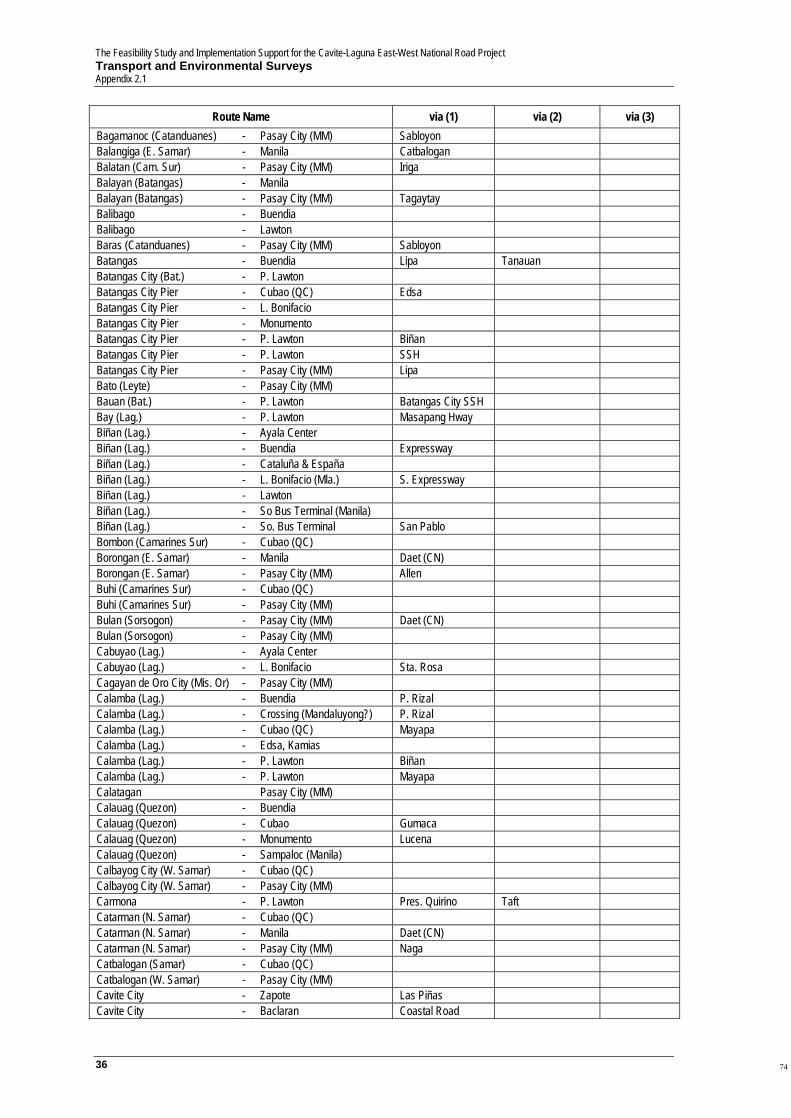
The Feasibility Study and Implementation Support for the Cavite-Laguna East-West National Road Project Transport and Environmental Surveys Appendix 2.1
36
Route Name via (1) via (2) via (3) Bagamanoc (Catanduanes) - Pasay City (MM) Sabloyon Balangiga (E. Samar) - Manila Catbalogan Balatan (Cam. Sur) - Pasay City (MM) Iriga Balayan (Batangas) - Manila Balayan (Batangas) - Pasay City (MM) Tagaytay Balibago - Buendia Balibago - Lawton Baras (Catanduanes) - Pasay City (MM) Sabloyon Batangas - Buendia Lipa Tanauan Batangas City (Bat.) - P. Lawton Batangas City Pier - Cubao (QC) Edsa Batangas City Pier - L. Bonifacio Batangas City Pier - Monumento Batangas City Pier - P. Lawton Biñan Batangas City Pier - P. Lawton SSH Batangas City Pier - Pasay City (MM) Lipa Bato (Leyte) - Pasay City (MM) Bauan (Bat.) - P. Lawton Batangas City SSH Bay (Lag.) - P. Lawton Masapang Hway Biñan (Lag.) - Ayala Center Biñan (Lag.) - Buendia Expressway Biñan (Lag.) - Cataluña & España Biñan (Lag.) - L. Bonifacio (Mla.) S. Expressway Biñan (Lag.) - Lawton Biñan (Lag.) - So Bus Terminal (Manila) Biñan (Lag.) - So. Bus Terminal San Pablo Bombon (Camarines Sur) - Cubao (QC) Borongan (E. Samar) - Manila Daet (CN) Borongan (E. Samar) - Pasay City (MM) Allen Buhi (Camarines Sur) - Cubao (QC) Buhi (Camarines Sur) - Pasay City (MM) Bulan (Sorsogon) - Pasay City (MM) Daet (CN) Bulan (Sorsogon) - Pasay City (MM) Cabuyao (Lag.) - Ayala Center Cabuyao (Lag.) - L. Bonifacio Sta. Rosa Cagayan de Oro City (Mis. Or) - Pasay City (MM) Calamba (Lag.) - Buendia P. Rizal Calamba (Lag.) - Crossing (Mandaluyong?) P. Rizal Calamba (Lag.) - Cubao (QC) Mayapa Calamba (Lag.) - Edsa, Kamias Calamba (Lag.) - P. Lawton Biñan Calamba (Lag.) - P. Lawton Mayapa Calatagan Pasay City (MM) Calauag (Quezon) - Buendia Calauag (Quezon) - Cubao Gumaca Calauag (Quezon) - Monumento Lucena Calauag (Quezon) - Sampaloc (Manila) Calbayog City (W. Samar) - Cubao (QC) Calbayog City (W. Samar) - Pasay City (MM) Carmona - P. Lawton Pres. Quirino Taft Catarman (N. Samar) - Cubao (QC) Catarman (N. Samar) - Manila Daet (CN) Catarman (N. Samar) - Pasay City (MM) Naga Catbalogan (Samar) - Cubao (QC) Catbalogan (W. Samar) - Pasay City (MM) Cavite City - Zapote Las Piñas Cavite City - Baclaran Coastal Road
74

The Feasibility Study and Implementation Support for Cavite-Laguna East-West National Road Project Transport and Environmental Surveys
Appendix 2.1
37
Route Name via (1) via (2) via (3) Cavite City - Buendia Ayala Cavite City - L. Bonifacio Noveleta Cavite City - P. Lawton Quirino Ave. Cavite City - Vito Cruz (Manila) Baclaran Coastal Road Cavite City - Zapote (Las Piñas) Noveleta Cotta (Lucena, Quezon) - Manila Daet (Camarines Norte) - Cubao (QC) Labo Sta. Elena Daet (Camarines Norte) - Manila Dasmarinas Plaza Lawton Dasmariñas - Ayala Dasmariñas - Divisoria Coastal Road Davao City (Davao DS) - Pasay City (MM) Donsol (Sorsogon) - Pasay City (MM) Daet Naga Legaspi FTI - Ragay (Cam. Sur) Maharlika Hiway
FTI Terminal - Sabang San Jose Camarines Sur
Gasan (Marinduque) - P. Lawton Balanacan Port Gen. M. Alvarez - Ayala Carmona
Gen. M. Alvarez - Ayala Loop Buendia Ave. Extension
Gen. M. Alvarez - P. Lawton Ayala Carmona SSH Gen. M. Alvarez - P. Lawton Zapote Gen. M. Alvarez - Vito Cruz (Manila) Gubat (Sorsogon) - Cubao (QC) Gubat (Sorsogon) - Pasay City (MM) Daet Naga Guinavangan (Quezon) - Cubao (QC) Guinavangan (Quezon) - Sampaloc (Manila) Guluan (E Samar) - Pasay City (MM) Guluan(E & W Samar & Catbalogan) - Manila
Gumaca (Quezon) - Pasay City (MM) Imus - Ayala (Makati, MM) Indang - Baclaran Quirino Ave. Indang - Baclaran Trece Martirez Indang - Pasay Rotonda Trece Martirez Irosin (Sorsogon) - Cubao (QC) Irosin (Sorsogon) - Pasay City (MM) Jose Panganiban (Cam. Norte) - Pasay City (MM)
Lagonoy (Cam. Sur) - Cubao (QC) Lagonoy (Cam. Sur) - Pasay City (MM) Legaspi City (Albay) - Cubao (QC) Buhi Ligao Legaspi City (Albay) - Cubao (QC) Daet Naga Legaspi City (Albay) - Manila Legaspi City (Albay) - Pasay City (MM) Cubao Legaspi City (Albay) - Pasay City (MM) Daet Lemery (Batangas) - Buendia Lipa Tanauan Lemery (Batangas) - Cubao (QC) Lemery (Batangas) - L. Bonifacio Lemery (Batangas) - P. Lawton Lemery (Batangas) - Pasay City (MM) Lemery (Batangas) - Timog (QC) Libmanan (Cam. Sur) - Cubao (QC) Libmanan (Cam. Sur) - Pasay City (MM) Daet Ligao (Albay) - Pasay City (MM) Liliw (Lag.) - Manila Sta. Cruz Liloan (S. Leyte) - Cubao (QC) Liloan (S. Leyte) - Pasay City (MM)
75

The Feasibility Study and Implementation Support for the Cavite-Laguna East-West National Road Project Transport and Environmental Surveys Appendix 2.1
38
Route Name via (1) via (2) via (3) Lipa City (Batangas) - Gil Puyat (Mla) Lucban (Quezon) - Gov. Forbes (Mla) Pagsanjan Lucena (Dalahican, Quezon) - P. Lawton Lucena City (Quezon) - Buendia San Pablo Alaminos Lucena City (Quezon) - Cubao (QC) Edsa Lucena City (Quezon) - P. Lawton Lucena City (Quezon) - Pasay City (MM)
Maasin (Leyte) - Metro South Internodal Terminal
Maasin (S. Leyte) - Cubao (QC) Maasin (S. Leyte) - FTI (Taguig) Maasin (S. Leyte) - Manila Daet (CN) Maasin (S. Leyte) - Pasay City (MM) Naga Macalaya (Sorsogon) - Pasay City (MM) Magallanes - Baclaran Silang Tagaytay Majayjay - Manila Masapang Hway Malanday - Muntinlupa EDSA Monumento Manito (Albay) - Pasay City (MM) Legaspi Maragondon - Baclaran (MM) Coastal Road Maragondon - P. Lawton Tanza Maragondon - Vito Cruz (Manila) Matnog (Sorsogon) - FTI Alabang Matnog (Sorsogon) - Parañaque (MM) S. Exp Matnog (Sorsogon) - Pasay City (MM) Mendez - Baclaran Silang Tagaytay Mendez - P. Lawton Tagaytay Mendez - Pasay Rotonda Moonwalk Quiapo Buendia Ave. Mulanay (Quezon) - Cubao (QC) Atimonan Nabua (Cam. Sur) - Pasay City (MM) Naga City - FTI (Taguig) Naga City (Cam. Sur) - P. Lawton Naga City (Cam. Sur) - Pasay City (MM) Daet (CN) Naga City (Cam. Sur) - Sampaloc (Manila) Quirino Hiway Nagcarlan - Manila Calumpang Naic - Baclaran Redemptorist Naic - P. Lawton Naic - Vito Cruz (Manila) Salinas EPZA Nasugbu (Batangas) - Pasay City (MM) Lian Tagaytay
Naval (Leyte) - Metro South Internodal Terminal
Naval (Leyte) - Pasay City (MM) Navotas Terminal - Pacita Complex Edsa Novaliches Terminal - Pacita Complex Malinta Exit Edsa Ormoc (Leyte) - Cubao (QC) Ormoc (Leyte) - Manila Daet
Ormoc (Leyte) - Metro South Internodal Terminal
Ormoc (Leyte) - Pasay City (MM) Abuyog Baybay Ormoc (Leyte) - Pasay City (MM) Naga Ormoc (Leyte) - Pasay City (MM) Palompon Pacita Complex - SM Fairview EDSA Pacita Complex (SP, Lag.) - Buendia Susana heights San Pedro Pacita Complex (SP, Lag.) - Cubao (QC) Pacita Complex (SP, Lag.) - Fairview Cubao Crossing Alabang Pacita Complex (SP, Lag.) - L. Bonifacio (Mla.) SSH Pacita Complex (SP, Lag.) - Lagro Fairview
76
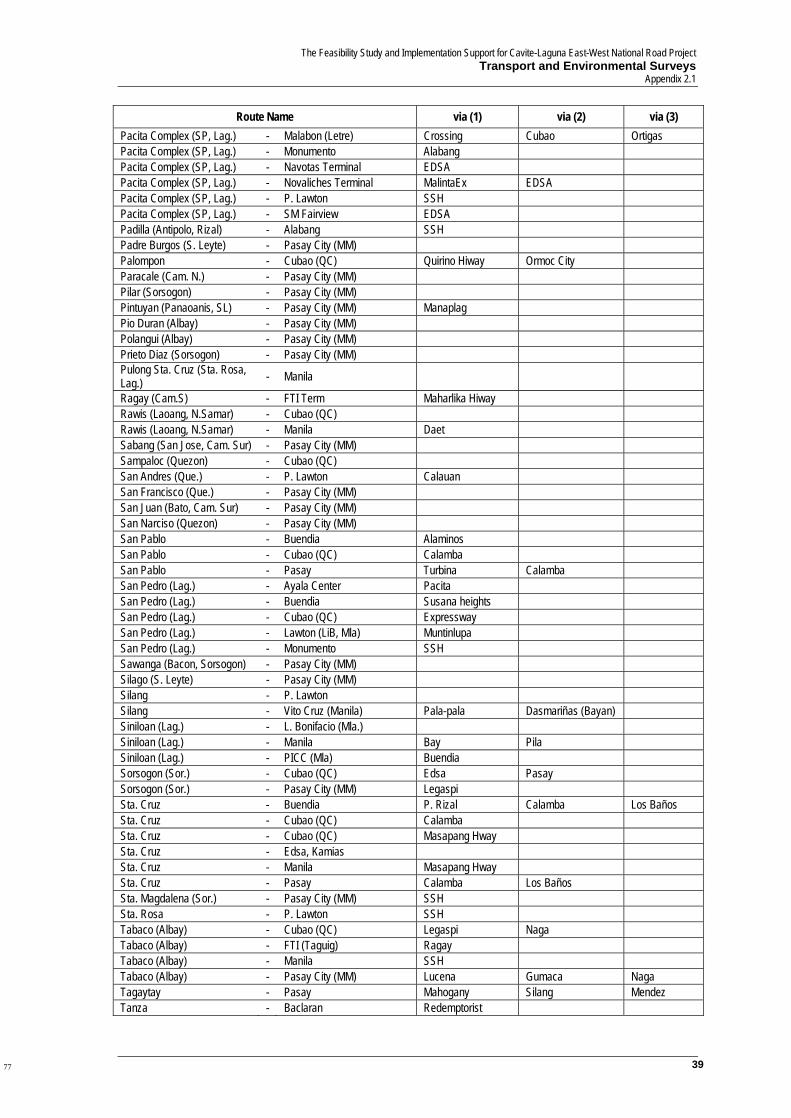
The Feasibility Study and Implementation Support for Cavite-Laguna East-West National Road Project Transport and Environmental Surveys
Appendix 2.1
39
Route Name via (1) via (2) via (3) Pacita Complex (SP, Lag.) - Malabon (Letre) Crossing Cubao Ortigas Pacita Complex (SP, Lag.) - Monumento Alabang Pacita Complex (SP, Lag.) - Navotas Terminal EDSA Pacita Complex (SP, Lag.) - Novaliches Terminal MalintaEx EDSA Pacita Complex (SP, Lag.) - P. Lawton SSH Pacita Complex (SP, Lag.) - SM Fairview EDSA Padilla (Antipolo, Rizal) - Alabang SSH Padre Burgos (S. Leyte) - Pasay City (MM) Palompon - Cubao (QC) Quirino Hiway Ormoc City Paracale (Cam. N.) - Pasay City (MM) Pilar (Sorsogon) - Pasay City (MM) Pintuyan (Panaoanis, SL) - Pasay City (MM) Manaplag Pio Duran (Albay) - Pasay City (MM) Polangui (Albay) - Pasay City (MM) Prieto Diaz (Sorsogon) - Pasay City (MM) Pulong Sta. Cruz (Sta. Rosa, Lag.) - Manila
Ragay (Cam.S) - FTI Term Maharlika Hiway Rawis (Laoang, N.Samar) - Cubao (QC) Rawis (Laoang, N.Samar) - Manila Daet Sabang (San Jose, Cam. Sur) - Pasay City (MM) Sampaloc (Quezon) - Cubao (QC) San Andres (Que.) - P. Lawton Calauan San Francisco (Que.) - Pasay City (MM) San Juan (Bato, Cam. Sur) - Pasay City (MM) San Narciso (Quezon) - Pasay City (MM) San Pablo - Buendia Alaminos San Pablo - Cubao (QC) Calamba San Pablo - Pasay Turbina Calamba San Pedro (Lag.) - Ayala Center Pacita San Pedro (Lag.) - Buendia Susana heights San Pedro (Lag.) - Cubao (QC) Expressway San Pedro (Lag.) - Lawton (LiB, Mla) Muntinlupa San Pedro (Lag.) - Monumento SSH Sawanga (Bacon, Sorsogon) - Pasay City (MM) Silago (S. Leyte) - Pasay City (MM) Silang - P. Lawton Silang - Vito Cruz (Manila) Pala-pala Dasmariñas (Bayan) Siniloan (Lag.) - L. Bonifacio (Mla.) Siniloan (Lag.) - Manila Bay Pila Siniloan (Lag.) - PICC (Mla) Buendia Sorsogon (Sor.) - Cubao (QC) Edsa Pasay Sorsogon (Sor.) - Pasay City (MM) Legaspi Sta. Cruz - Buendia P. Rizal Calamba Los Baños Sta. Cruz - Cubao (QC) Calamba Sta. Cruz - Cubao (QC) Masapang Hway Sta. Cruz - Edsa, Kamias Sta. Cruz - Manila Masapang Hway Sta. Cruz - Pasay Calamba Los Baños Sta. Magdalena (Sor.) - Pasay City (MM) SSH Sta. Rosa - P. Lawton SSH Tabaco (Albay) - Cubao (QC) Legaspi Naga Tabaco (Albay) - FTI (Taguig) Ragay Tabaco (Albay) - Manila SSH Tabaco (Albay) - Pasay City (MM) Lucena Gumaca Naga Tagaytay - Pasay Mahogany Silang Mendez Tanza - Baclaran Redemptorist
77

The Feasibility Study and Implementation Support for the Cavite-Laguna East-West National Road Project Transport and Environmental Surveys Appendix 2.1
40
Route Name via (1) via (2) via (3) Ternate - Lawton Maragondon Naic Trece Martires - Baclaran Rosario Trece Martires - P. Lawton Tanza UP Los Baños IRRI (Lag.) - UP Diliman (QC)
Table 4.6 List of Jeepney Routes Operating in the CALA Area
Route Name via (1) via (2) via (3) Alabang - Alabang Twins Alabang - Almanza Alabang - Baclaran Ninoy Aquino Ave. Alabang - Baclaran San Isidro Zapote Alabang - Bagumbayan Bicutan Alabang - Balibago Alabang - Balibago (Sta. Rosa) National Road Alabang - Balibago (Sta. Rosa) SSH Alabang - Bicutan (lower) SSH Sucat Kanan Alabang - Bicutan (lower) Alabang - Biñan National Road Alabang - Calamba National Road Alabang - Carmona National Hiway Alabang - Carmona Expressway Alabang - Carmona Bulihan Alabang - EDSA/SSH Expressway Alabang - FTI SSH Alabang - GMA Carmona Expressway Alabang - GMA Carmona National Road Alabang - GMA National Road Alabang - Langgam (San Pedro) Alabang - Muntinlupa National Road
Alabang - Muntinlupa Bilibid Prison Katarungan Village
Alabang - Paliparan (Dasma) SSH Governor's Drive Carmona Alabang - Pasay Rtd FTI Service Rd
Alabang - Pasay Rtd Nichols Air Base Service Rd
Alabang - Pasay Rtd SSH Alabang - San Joaquin Bicutan Alabang - Signal Village SE Service Rd
Alabang - Sucat Cupang (East Service Rd)
Alabang - Zapote (Las Piñas) Alabang GMA Alab Carmona - Bulihan Alabang-Muntinlupa - Langgam (San Pedro) Almanza (LP) - Baclaran Amadeo - Tagaytay
Ayala (Landmark) - Bahayang Pag-asa Ayala Ctr. Terminal
Ayala Center - Imus Zapote Baclaran - DBB-C Aguinaldo Hway Coastal Road Resettlement Area Baclaran - DBB-I Coastal
Baclaran - Imus Resettlement Area Bacoor
Baclaran - Bacoor Redemptorist Baclaran - Bahayang Pagasa Subd. Coastal Road Baclaran - Dasmariñas Bagong Bayan Baclaran - Imus Imus Terminal
78
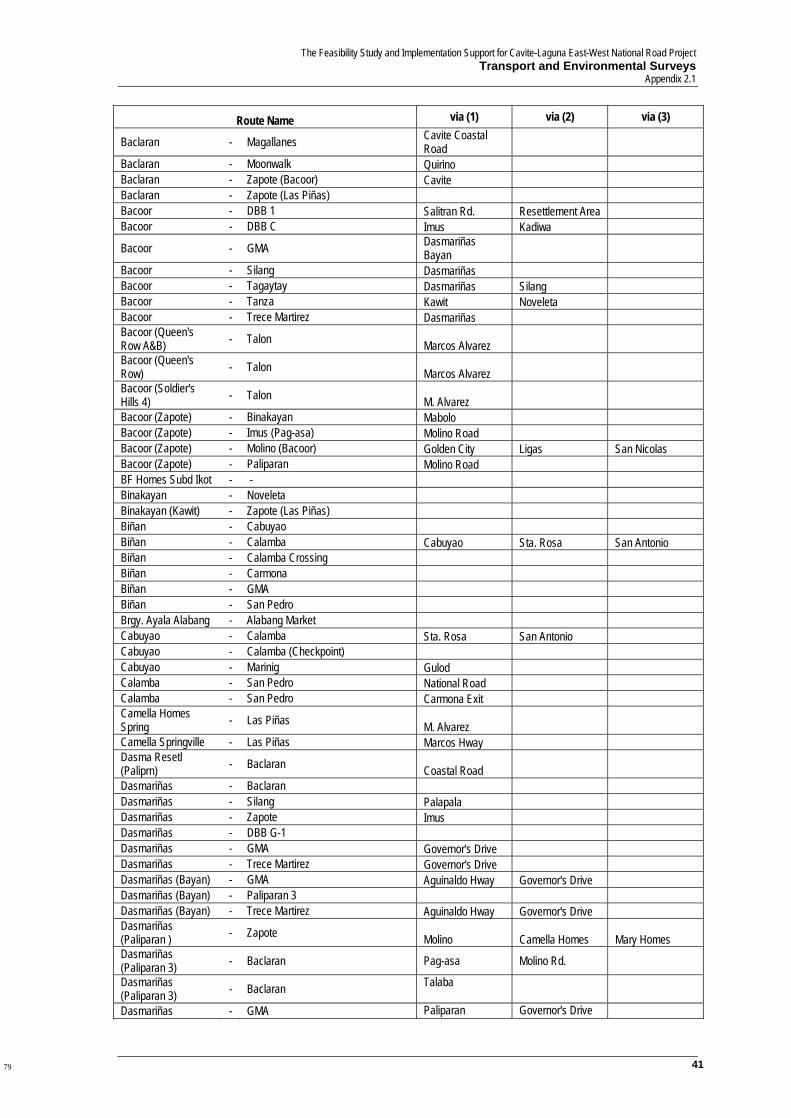
The Feasibility Study and Implementation Support for Cavite-Laguna East-West National Road Project Transport and Environmental Surveys
Appendix 2.1
41
Route Name via (1) via (2) via (3)
Baclaran - Magallanes Cavite Coastal Road
Baclaran - Moonwalk Quirino Baclaran - Zapote (Bacoor) Cavite Baclaran - Zapote (Las Piñas) Bacoor - DBB 1 Salitran Rd. Resettlement Area Bacoor - DBB C Imus Kadiwa
Bacoor - GMA Dasmariñas Bayan
Bacoor - Silang Dasmariñas Bacoor - Tagaytay Dasmariñas Silang Bacoor - Tanza Kawit Noveleta Bacoor - Trece Martirez Dasmariñas Bacoor (Queen's Row A&B) - Talon Marcos Alvarez Bacoor (Queen's Row) - Talon Marcos Alvarez Bacoor (Soldier's Hills 4) - Talon M. Alvarez Bacoor (Zapote) - Binakayan Mabolo Bacoor (Zapote) - Imus (Pag-asa) Molino Road Bacoor (Zapote) - Molino (Bacoor) Golden City Ligas San Nicolas Bacoor (Zapote) - Paliparan Molino Road BF Homes Subd Ikot - - Binakayan - Noveleta Binakayan (Kawit) - Zapote (Las Piñas) Biñan - Cabuyao Biñan - Calamba Cabuyao Sta. Rosa San Antonio Biñan - Calamba Crossing Biñan - Carmona Biñan - GMA Biñan - San Pedro Brgy. Ayala Alabang - Alabang Market Cabuyao - Calamba Sta. Rosa San Antonio Cabuyao - Calamba (Checkpoint) Cabuyao - Marinig Gulod Calamba - San Pedro National Road Calamba - San Pedro Carmona Exit Camella Homes Spring - Las Piñas M. Alvarez Camella Springville - Las Piñas Marcos Hway Dasma Resetl (Paliprn) - Baclaran Coastal Road Dasmariñas - Baclaran Dasmariñas - Silang Palapala Dasmariñas - Zapote Imus Dasmariñas - DBB G-1 Dasmariñas - GMA Governor's Drive Dasmariñas - Trece Martirez Governor's Drive Dasmariñas (Bayan) - GMA Aguinaldo Hway Governor's Drive Dasmariñas (Bayan) - Paliparan 3 Dasmariñas (Bayan) - Trece Martirez Aguinaldo Hway Governor's Drive Dasmariñas (Paliparan ) - Zapote Molino Camella Homes Mary Homes Dasmariñas (Paliparan 3) - Baclaran Pag-asa Molino Rd. Dasmariñas (Paliparan 3) - Baclaran Talaba
Dasmariñas - GMA Paliparan Governor's Drive
79
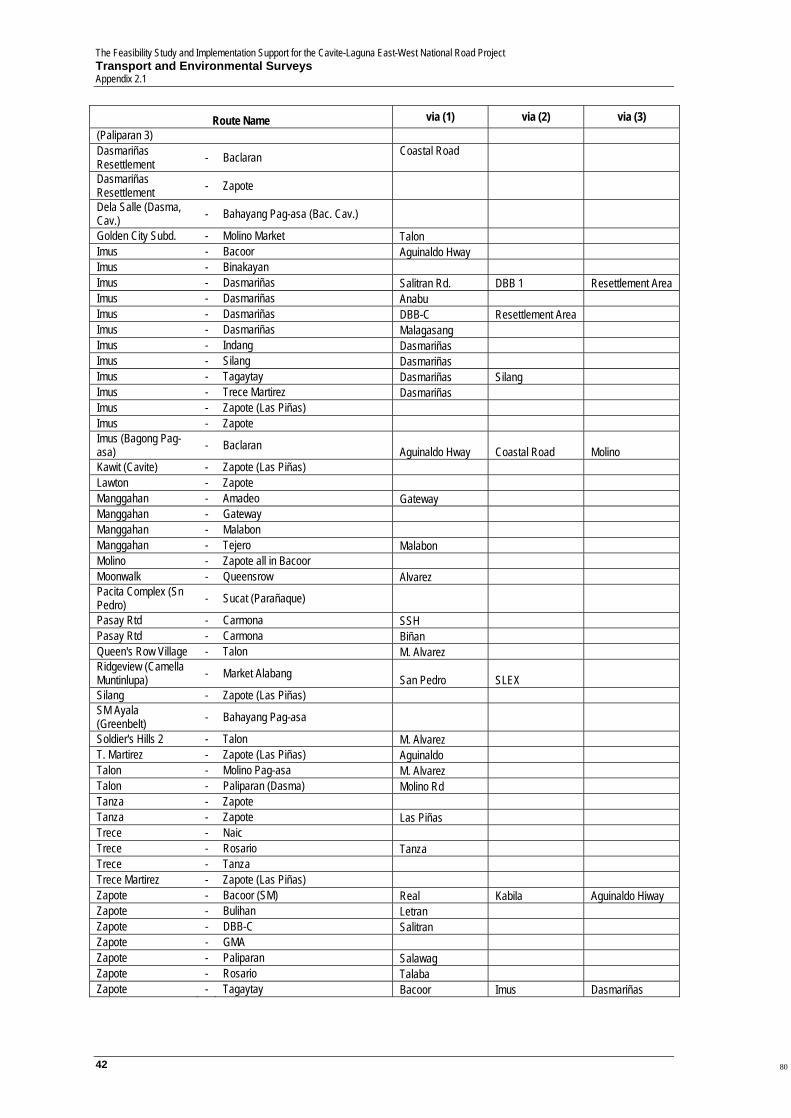
The Feasibility Study and Implementation Support for the Cavite-Laguna East-West National Road Project Transport and Environmental Surveys Appendix 2.1
42
Route Name via (1) via (2) via (3) (Paliparan 3) Dasmariñas Resettlement - Baclaran Coastal Road
Dasmariñas Resettlement - Zapote Dela Salle (Dasma, Cav.) - Bahayang Pag-asa (Bac. Cav.) Golden City Subd. - Molino Market Talon Imus - Bacoor Aguinaldo Hway Imus - Binakayan Imus - Dasmariñas Salitran Rd. DBB 1 Resettlement Area Imus - Dasmariñas Anabu Imus - Dasmariñas DBB-C Resettlement Area Imus - Dasmariñas Malagasang Imus - Indang Dasmariñas Imus - Silang Dasmariñas Imus - Tagaytay Dasmariñas Silang Imus - Trece Martirez Dasmariñas Imus - Zapote (Las Piñas) Imus - Zapote Imus (Bagong Pag-asa) - Baclaran Aguinaldo Hway Coastal Road Molino Kawit (Cavite) - Zapote (Las Piñas) Lawton - Zapote Manggahan - Amadeo Gateway Manggahan - Gateway Manggahan - Malabon Manggahan - Tejero Malabon Molino - Zapote all in Bacoor Moonwalk - Queensrow Alvarez Pacita Complex (Sn Pedro) - Sucat (Parañaque) Pasay Rtd - Carmona SSH Pasay Rtd - Carmona Biñan Queen's Row Village - Talon M. Alvarez Ridgeview (Camella Muntinlupa) - Market Alabang San Pedro SLEX Silang - Zapote (Las Piñas) SM Ayala (Greenbelt) - Bahayang Pag-asa Soldier's Hills 2 - Talon M. Alvarez T. Martirez - Zapote (Las Piñas) Aguinaldo Talon - Molino Pag-asa M. Alvarez Talon - Paliparan (Dasma) Molino Rd Tanza - Zapote Tanza - Zapote Las Piñas Trece - Naic Trece - Rosario Tanza Trece - Tanza Trece Martirez - Zapote (Las Piñas) Zapote - Bacoor (SM) Real Kabila Aguinaldo Hiway Zapote - Bulihan Letran Zapote - DBB-C Salitran Zapote - GMA Zapote - Paliparan Salawag Zapote - Rosario Talaba Zapote - Tagaytay Bacoor Imus Dasmariñas
80
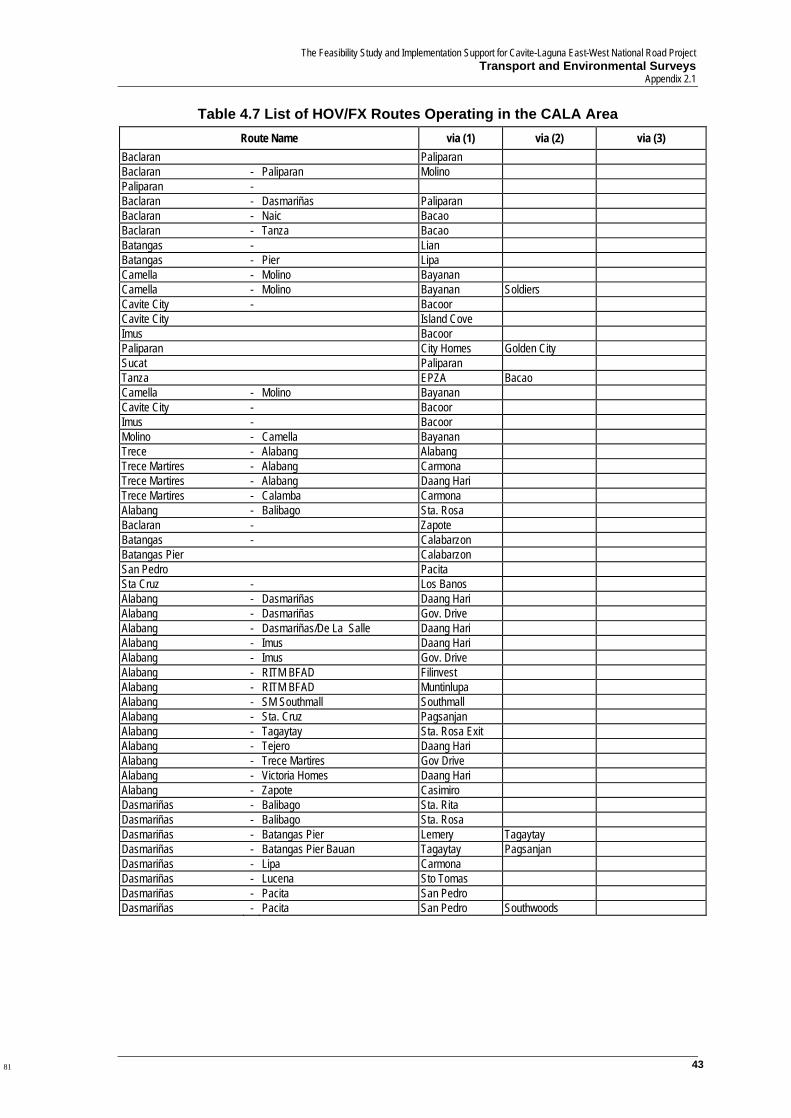
The Feasibility Study and Implementation Support for Cavite-Laguna East-West National Road Project Transport and Environmental Surveys
Appendix 2.1
43
Table 4.7 List of HOV/FX Routes Operating in the CALA Area Route Name via (1) via (2) via (3)
Baclaran Paliparan Baclaran - Paliparan Molino Paliparan - Baclaran - Dasmariñas Paliparan Baclaran - Naic Bacao Baclaran - Tanza Bacao Batangas - Lian Batangas - Pier Lipa Camella - Molino Bayanan Camella - Molino Bayanan Soldiers Cavite City - Bacoor Cavite City Island Cove Imus Bacoor Paliparan City Homes Golden City Sucat Paliparan Tanza EPZA Bacao Camella - Molino Bayanan Cavite City - Bacoor Imus - Bacoor Molino - Camella Bayanan Trece - Alabang Alabang Trece Martires - Alabang Carmona Trece Martires - Alabang Daang Hari Trece Martires - Calamba Carmona Alabang - Balibago Sta. Rosa Baclaran - Zapote Batangas - Calabarzon Batangas Pier Calabarzon San Pedro Pacita Sta Cruz - Los Banos Alabang - Dasmariñas Daang Hari Alabang - Dasmariñas Gov. Drive Alabang - Dasmariñas/De La Salle Daang Hari Alabang - Imus Daang Hari Alabang - Imus Gov. Drive Alabang - RITM BFAD Filinvest Alabang - RITM BFAD Muntinlupa Alabang - SM Southmall Southmall Alabang - Sta. Cruz Pagsanjan Alabang - Tagaytay Sta. Rosa Exit Alabang - Tejero Daang Hari Alabang - Trece Martires Gov Drive Alabang - Victoria Homes Daang Hari Alabang - Zapote Casimiro Dasmariñas - Balibago Sta. Rita Dasmariñas - Balibago Sta. Rosa Dasmariñas - Batangas Pier Lemery Tagaytay Dasmariñas - Batangas Pier Bauan Tagaytay Pagsanjan Dasmariñas - Lipa Carmona Dasmariñas - Lucena Sto Tomas Dasmariñas - Pacita San Pedro Dasmariñas - Pacita San Pedro Southwoods
81

The Feasibility Study and Implementation Support for the Cavite-Laguna East-West National Road Project Transport and Environmental Surveys Appendix 2.1
44
4.5 Bus Terminal Passenger Count Table 4.8 shows a summary of passenger count in each surveyed major bus terminal in the study area. Detailed results are presented in Traffic Survey Report Volume 5: Bus Terminal Passenger Count Survey Report (TSR-V5).
Table 4.8 Number of Passengers by Route at Major Bus Terminals
No. of Passengers Station No. Terminal Name
Incoming Outgoing Total
01-A BACLARAN (INFRONT OF MCDONALD) TERMINAL 74 1,432 1,506
Baclaran-Cavite City 27 258 285 Baclaran-Noveleta 0 33 33 Baclaran-Indang via Trece Martires City 47 1068 1115 Baclaran-Indang via Dasmariñas 0 73 73
01-B BACLARAN (MINI-BUS)-CAVITE (NAIC/TANZA) TERMINAL 67 1,534 1,601
Baclarñññan-Naic 0 43 43 Baclaran-Naic via Bacao 0 175 175 Baclaran-Naic via Noveleta 0 160 160 Baclaran-Naic via Salinas 3 90 93 Baclaran-Naic via Tanza 62 801 863 Baclaran-Naic via Tejero 2 265 267
01-C DMML-BUS TERMINAL (INFRONT OF LRT) 1,261 458 1,719 Baclaran-Alfonso 1174 404 1578 Baclaran-Alfonso via Silang 0 0 0 Baclaran-Alfonso via Tagaytay 0 5 5 Baclaran-Indang 75 46 121 Baclaran-Tagaytay 12 3 15
01-D SAULOG TERMINAL (INFRONT OF LRT) 0 2,610 2,610 Baclaran-Calatagan 0 210 210 Baclaran-Indang 0 1,312 1,312 Baclaran-Mendez 0 1,088 1,088
02 LAWTON BUS TERMINAL 4,451 8,929 13,380 Lawton-Alabang 0 54 54 Lawton-Balayan 0 354 354 Lawton-Batangas 0 574 574 Lawton-Dasmariñas 0 4,136 4,136 Lawton-Dasmariñas via Palapala 0 48 48 Lawton-GMA 0 168 168 Lawton-GMA via Carmona 0 56 56 Lawton-Indang 0 5 5 Lawton-Lemery 0 0 0 Lawton-Lipa via Tanauan 0 29 29 Lawton-Nasugbu 0 309 309 Lawton-Pacita 0 2,133 2,133 Lawton-Palapala 0 147 147
82
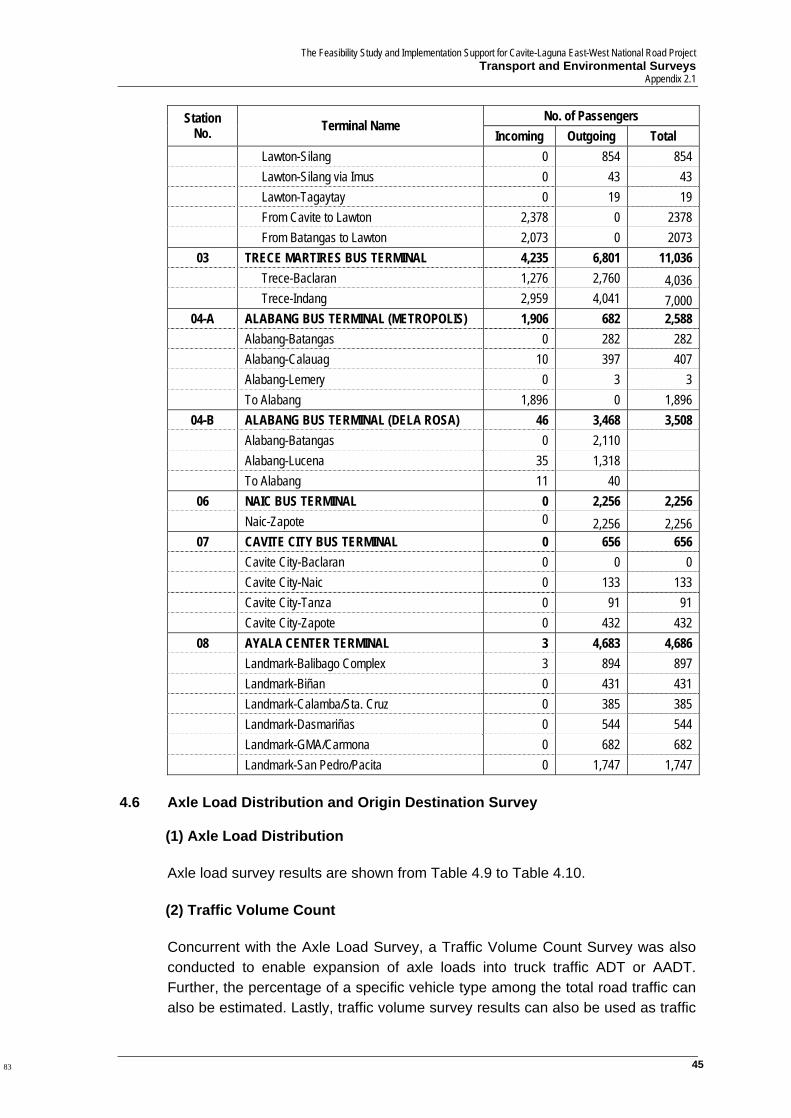
The Feasibility Study and Implementation Support for Cavite-Laguna East-West National Road Project Transport and Environmental Surveys
Appendix 2.1
45
No. of Passengers Station No. Terminal Name
Incoming Outgoing Total Lawton-Silang 0 854 854 Lawton-Silang via Imus 0 43 43 Lawton-Tagaytay 0 19 19 From Cavite to Lawton 2,378 0 2378 From Batangas to Lawton 2,073 0 2073
03 TRECE MARTIRES BUS TERMINAL 4,235 6,801 11,036 Trece-Baclaran 1,276 2,760 4,036 Trece-Indang 2,959 4,041 7,000
04-A ALABANG BUS TERMINAL (METROPOLIS) 1,906 682 2,588 Alabang-Batangas 0 282 282 Alabang-Calauag 10 397 407 Alabang-Lemery 0 3 3 To Alabang 1,896 0 1,896
04-B ALABANG BUS TERMINAL (DELA ROSA) 46 3,468 3,508 Alabang-Batangas 0 2,110 Alabang-Lucena 35 1,318 To Alabang 11 40
06 NAIC BUS TERMINAL 0 2,256 2,256 Naic-Zapote 0 2,256 2,256
07 CAVITE CITY BUS TERMINAL 0 656 656 Cavite City-Baclaran 0 0 0 Cavite City-Naic 0 133 133 Cavite City-Tanza 0 91 91 Cavite City-Zapote 0 432 432
08 AYALA CENTER TERMINAL 3 4,683 4,686 Landmark-Balibago Complex 3 894 897 Landmark-Biñan 0 431 431 Landmark-Calamba/Sta. Cruz 0 385 385 Landmark-Dasmariñas 0 544 544 Landmark-GMA/Carmona 0 682 682 Landmark-San Pedro/Pacita 0 1,747 1,747
4.6 Axle Load Distribution and Origin Destination Survey
(1) Axle Load Distribution Axle load survey results are shown from Table 4.9 to Table 4.10. (2) Traffic Volume Count Concurrent with the Axle Load Survey, a Traffic Volume Count Survey was also conducted to enable expansion of axle loads into truck traffic ADT or AADT. Further, the percentage of a specific vehicle type among the total road traffic can also be estimated. Lastly, traffic volume survey results can also be used as traffic
83
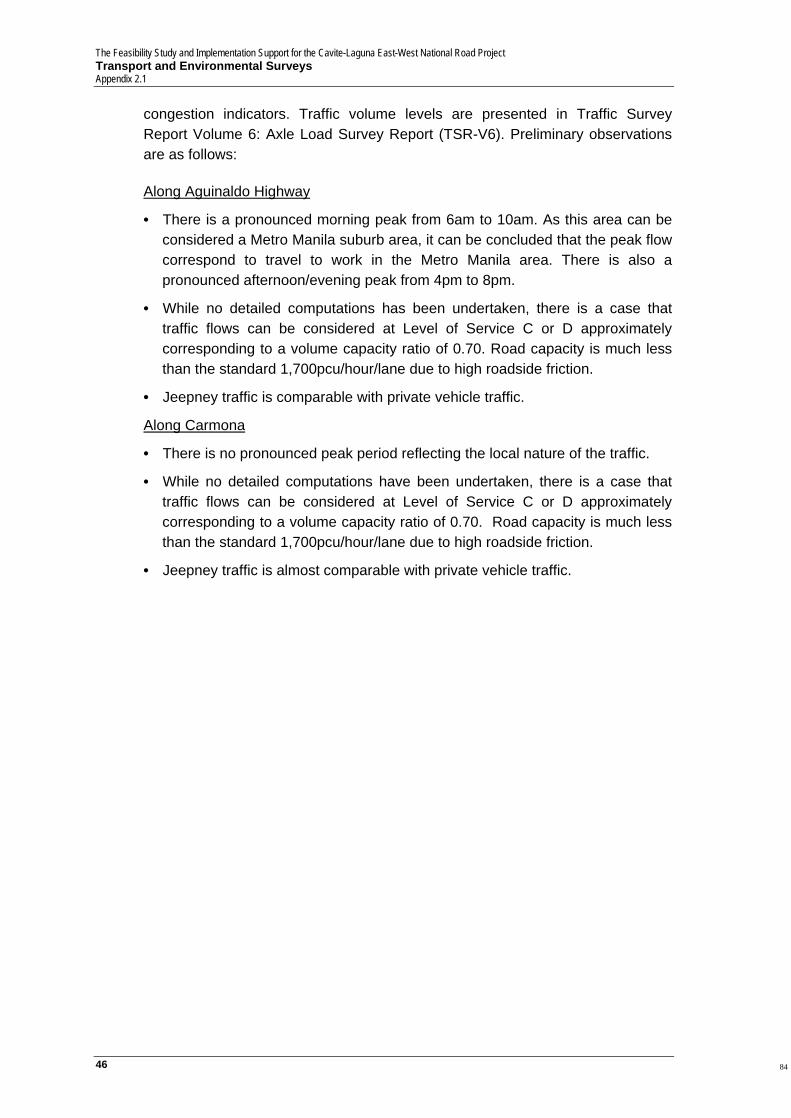
The Feasibility Study and Implementation Support for the Cavite-Laguna East-West National Road Project Transport and Environmental Surveys Appendix 2.1
46
congestion indicators. Traffic volume levels are presented in Traffic Survey Report Volume 6: Axle Load Survey Report (TSR-V6). Preliminary observations are as follows:
Along Aguinaldo Highway
• There is a pronounced morning peak from 6am to 10am. As this area can be considered a Metro Manila suburb area, it can be concluded that the peak flow correspond to travel to work in the Metro Manila area. There is also a pronounced afternoon/evening peak from 4pm to 8pm.
• While no detailed computations has been undertaken, there is a case that traffic flows can be considered at Level of Service C or D approximately corresponding to a volume capacity ratio of 0.70. Road capacity is much less than the standard 1,700pcu/hour/lane due to high roadside friction.
• Jeepney traffic is comparable with private vehicle traffic.
Along Carmona
• There is no pronounced peak period reflecting the local nature of the traffic.
• While no detailed computations have been undertaken, there is a case that traffic flows can be considered at Level of Service C or D approximately corresponding to a volume capacity ratio of 0.70. Road capacity is much less than the standard 1,700pcu/hour/lane due to high roadside friction.
• Jeepney traffic is almost comparable with private vehicle traffic.
84
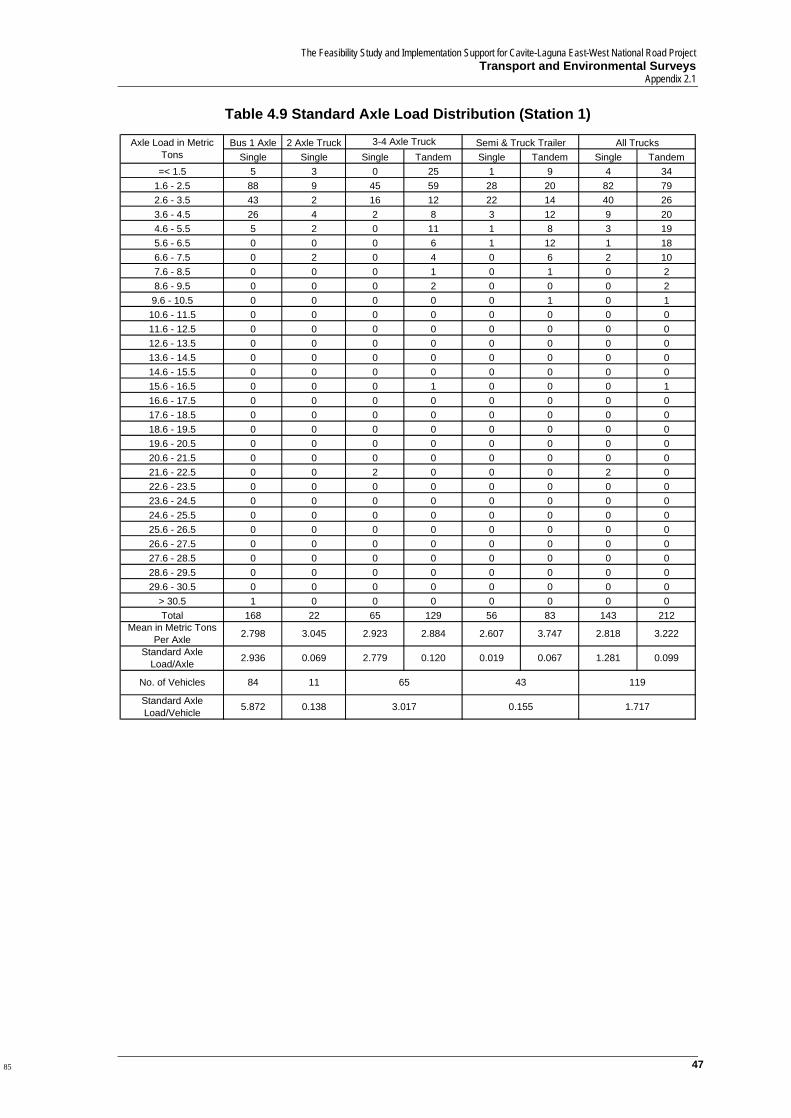
The Feasibility Study and Implementation Support for Cavite-Laguna East-West National Road Project Transport and Environmental Surveys
Appendix 2.1
47
Table 4.9 Standard Axle Load Distribution (Station 1)
Bus 1 Axle 2 Axle TruckSingle Single Single Tandem Single Tandem Single Tandem
=< 1.5 5 3 0 25 1 9 4 341.6 - 2.5 88 9 45 59 28 20 82 792.6 - 3.5 43 2 16 12 22 14 40 263.6 - 4.5 26 4 2 8 3 12 9 204.6 - 5.5 5 2 0 11 1 8 3 195.6 - 6.5 0 0 0 6 1 12 1 186.6 - 7.5 0 2 0 4 0 6 2 107.6 - 8.5 0 0 0 1 0 1 0 28.6 - 9.5 0 0 0 2 0 0 0 29.6 - 10.5 0 0 0 0 0 1 0 110.6 - 11.5 0 0 0 0 0 0 0 011.6 - 12.5 0 0 0 0 0 0 0 012.6 - 13.5 0 0 0 0 0 0 0 013.6 - 14.5 0 0 0 0 0 0 0 014.6 - 15.5 0 0 0 0 0 0 0 015.6 - 16.5 0 0 0 1 0 0 0 116.6 - 17.5 0 0 0 0 0 0 0 017.6 - 18.5 0 0 0 0 0 0 0 018.6 - 19.5 0 0 0 0 0 0 0 019.6 - 20.5 0 0 0 0 0 0 0 020.6 - 21.5 0 0 0 0 0 0 0 021.6 - 22.5 0 0 2 0 0 0 2 022.6 - 23.5 0 0 0 0 0 0 0 023.6 - 24.5 0 0 0 0 0 0 0 024.6 - 25.5 0 0 0 0 0 0 0 025.6 - 26.5 0 0 0 0 0 0 0 026.6 - 27.5 0 0 0 0 0 0 0 027.6 - 28.5 0 0 0 0 0 0 0 028.6 - 29.5 0 0 0 0 0 0 0 029.6 - 30.5 0 0 0 0 0 0 0 0
> 30.5 1 0 0 0 0 0 0 0Total 168 22 65 129 56 83 143 212
Axle Load in Metric Tons
0.099
No. of Vehicles 84 11
3.222Mean in Metric Tons Per Axle
Standard Axle Load/Axle 2.936 0.069 2.779 0.120 0.019 0.067 1.281
3-4 Axle Truck Semi & Truck Trailer All Trucks
2.798 3.045 2.923 2.884 2.607 3.747 2.818
0.155 1.717Standard Axle Load/Vehicle 5.872 0.138 3.017
65 43 119
85

The Feasibility Study and Implementation Support for the Cavite-Laguna East-West National Road Project Transport and Environmental Surveys Appendix 2.1
48
Table 4.10 Standard Axle Load Distribution (Station 2)
Bus 1 Axle 2 Axle TruckSingle Single Single Tandem Single Tandem Single Tandem
=< 1.5 2 80 2 11 1 6 83 171.6 - 2.5 9 37 40 46 31 20 108 662.6 - 3.5 9 11 41 19 13 10 65 293.6 - 4.5 2 3 13 20 0 6 16 264.6 - 5.5 3 6 0 23 1 10 7 335.6 - 6.5 1 3 0 27 1 8 4 356.6 - 7.5 0 2 0 16 0 4 2 207.6 - 8.5 0 2 0 9 1 1 3 108.6 - 9.5 0 0 0 10 0 2 0 129.6 - 10.5 0 0 0 6 0 0 0 610.6 - 11.5 0 0 0 3 0 0 0 311.6 - 12.5 0 0 0 0 0 0 0 012.6 - 13.5 0 0 0 0 0 0 0 013.6 - 14.5 0 0 0 1 0 0 0 114.6 - 15.5 0 0 0 0 0 0 0 015.6 - 16.5 0 0 0 0 0 0 0 016.6 - 17.5 0 0 0 0 0 0 0 017.6 - 18.5 0 0 0 0 0 0 0 018.6 - 19.5 0 0 0 0 0 0 0 019.6 - 20.5 0 0 0 0 0 0 0 020.6 - 21.5 0 0 0 0 0 0 0 021.6 - 22.5 0 0 0 0 0 0 0 022.6 - 23.5 0 0 0 0 0 0 0 023.6 - 24.5 0 0 0 0 0 0 0 024.6 - 25.5 0 0 0 0 0 0 0 025.6 - 26.5 0 0 0 0 0 0 0 026.6 - 27.5 0 0 0 0 0 0 0 027.6 - 28.5 0 0 0 0 0 0 0 028.6 - 29.5 0 0 0 0 0 0 0 029.6 - 30.5 0 0 0 0 0 0 0 0
> 30.5 0 0 0 1 0 0 0 1Total 26 144 96 192 48 67 288 259
Axle Load in Metric Tons
3-4 Axle Truck Semi & Truck Trailer All Trucks
Mean in Metric Tons Per Axle 2.923 1.924 2.677
0.028 1.117
4.839 2.521 3.761 2.274
72 96
4.560
Standard Axle Load/Axle 0.034 0.033 0.018 1.482 0.034 0.071
36 204
Standard Axle Load/Vehicle 0.068 0.065 2.981 0.178 1.458
No. of Vehicles 13
(3) Origin-Destination Survey While the trucks are being weighed, OD survey was also conducted. The same vehicle classification was used in the conduct of this survey. The detailed results of OD of commodities (in terms of tons) by commodity type are presented in TSR-V6. As shown in Figure 4.24, the study area has been divided into internal and external zones, with the former corresponding to each municipality (though some municipalities have been subdivided into smaller zones). Commodities were classified according to the DPWH commodity coding scheme, which may also be referred in the Appendix of TSR-V6. The following OD patterns were observed in Station 1:
86
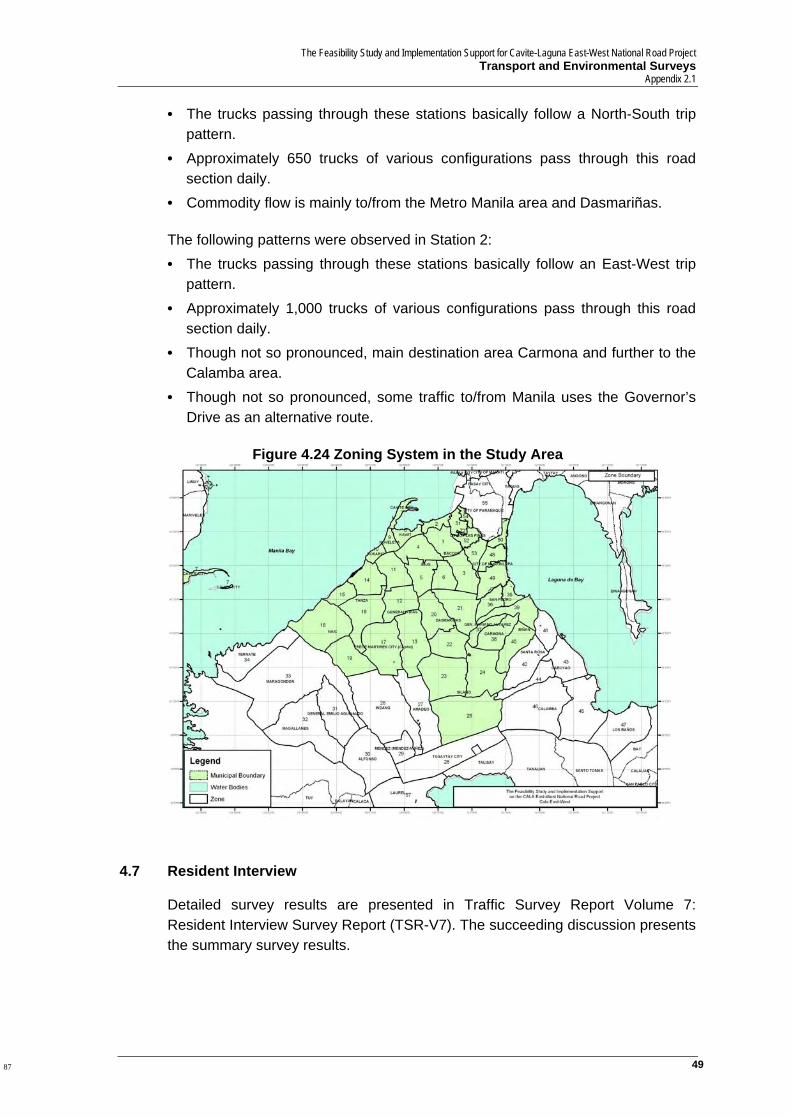
The Feasibility Study and Implementation Support for Cavite-Laguna East-West National Road Project Transport and Environmental Surveys
Appendix 2.1
49
• The trucks passing through these stations basically follow a North-South trip pattern.
• Approximately 650 trucks of various configurations pass through this road section daily.
• Commodity flow is mainly to/from the Metro Manila area and Dasmariñas.
The following patterns were observed in Station 2: • The trucks passing through these stations basically follow an East-West trip
pattern. • Approximately 1,000 trucks of various configurations pass through this road
section daily. • Though not so pronounced, main destination area Carmona and further to the
Calamba area. • Though not so pronounced, some traffic to/from Manila uses the Governor’s
Drive as an alternative route.
Figure 4.24 Zoning System in the Study Area
4.7 Resident Interview
Detailed survey results are presented in Traffic Survey Report Volume 7: Resident Interview Survey Report (TSR-V7). The succeeding discussion presents the summary survey results.
87
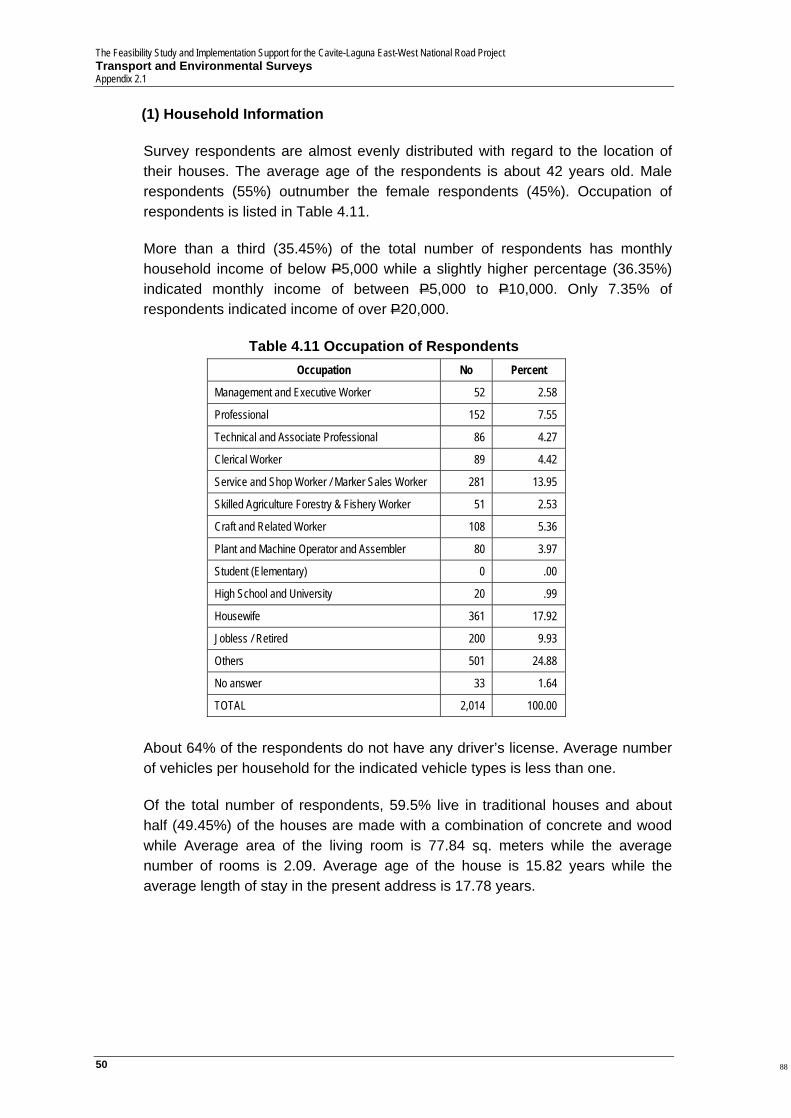
The Feasibility Study and Implementation Support for the Cavite-Laguna East-West National Road Project Transport and Environmental Surveys Appendix 2.1
50
(1) Household Information Survey respondents are almost evenly distributed with regard to the location of their houses. The average age of the respondents is about 42 years old. Male respondents (55%) outnumber the female respondents (45%). Occupation of respondents is listed in Table 4.11. More than a third (35.45%) of the total number of respondents has monthly household income of below P5,000 while a slightly higher percentage (36.35%) indicated monthly income of between P5,000 to P10,000. Only 7.35% of respondents indicated income of over P20,000.
Table 4.11 Occupation of Respondents
About 64% of the respondents do not have any driver’s license. Average number of vehicles per household for the indicated vehicle types is less than one. Of the total number of respondents, 59.5% live in traditional houses and about half (49.45%) of the houses are made with a combination of concrete and wood while Average area of the living room is 77.84 sq. meters while the average number of rooms is 2.09. Average age of the house is 15.82 years while the average length of stay in the present address is 17.78 years.
Occupation No Percent
Management and Executive Worker 52 2.58 Professional 152 7.55 Technical and Associate Professional 86 4.27 Clerical Worker 89 4.42 Service and Shop Worker / Marker Sales Worker 281 13.95 Skilled Agriculture Forestry & Fishery Worker 51 2.53 Craft and Related Worker 108 5.36 Plant and Machine Operator and Assembler 80 3.97 Student (Elementary) 0 .00 High School and University 20 .99 Housewife 361 17.92 Jobless / Retired 200 9.93 Others 501 24.88 No answer 33 1.64 TOTAL 2,014 100.00
88
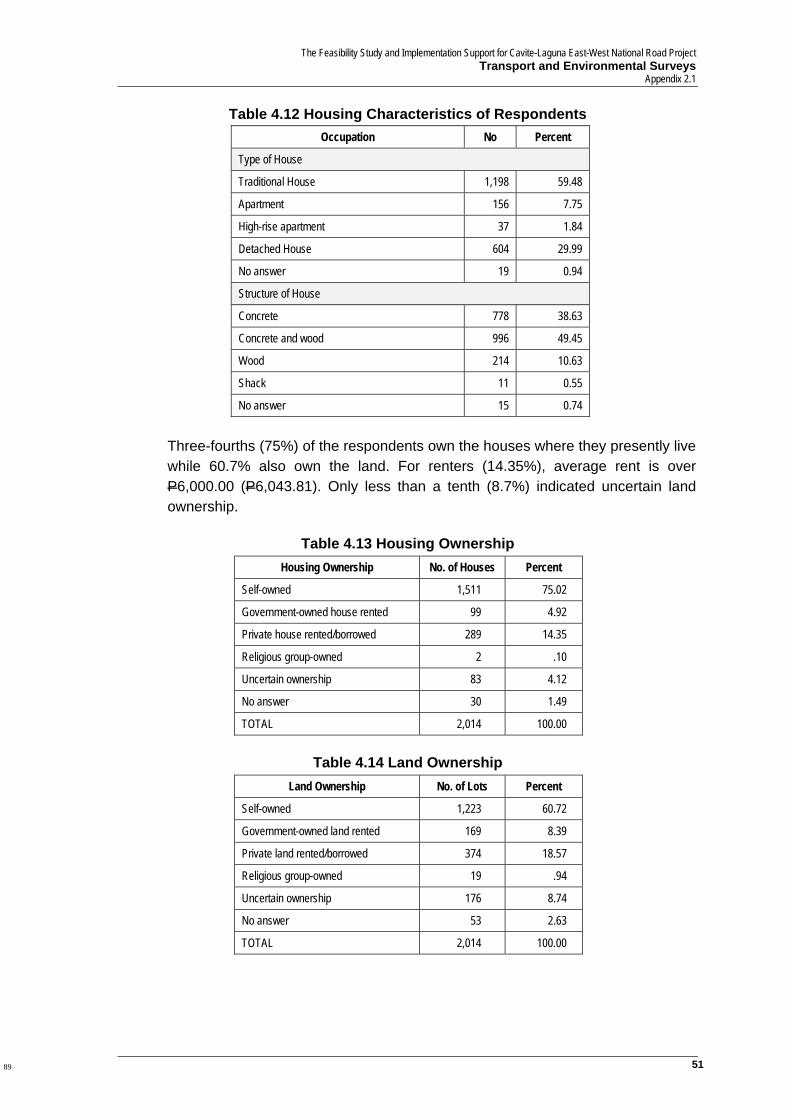
The Feasibility Study and Implementation Support for Cavite-Laguna East-West National Road Project Transport and Environmental Surveys
Appendix 2.1
51
Table 4.12 Housing Characteristics of Respondents Three-fourths (75%) of the respondents own the houses where they presently live while 60.7% also own the land. For renters (14.35%), average rent is over P6,000.00 (P6,043.81). Only less than a tenth (8.7%) indicated uncertain land ownership.
Table 4.13 Housing Ownership Housing Ownership No. of Houses Percent
Self-owned 1,511 75.02
Government-owned house rented 99 4.92
Private house rented/borrowed 289 14.35
Religious group-owned 2 .10
Uncertain ownership 83 4.12
No answer 30 1.49
TOTAL 2,014 100.00
Table 4.14 Land Ownership
Land Ownership No. of Lots Percent
Self-owned 1,223 60.72
Government-owned land rented 169 8.39
Private land rented/borrowed 374 18.57
Religious group-owned 19 .94
Uncertain ownership 176 8.74
No answer 53 2.63
TOTAL 2,014 100.00
Occupation No Percent
Type of House Traditional House 1,198 59.48
Apartment 156 7.75
High-rise apartment 37 1.84
Detached House 604 29.99
No answer 19 0.94
Structure of House
Concrete 778 38.63
Concrete and wood 996 49.45
Wood 214 10.63
Shack 11 0.55
No answer 15 0.74
89
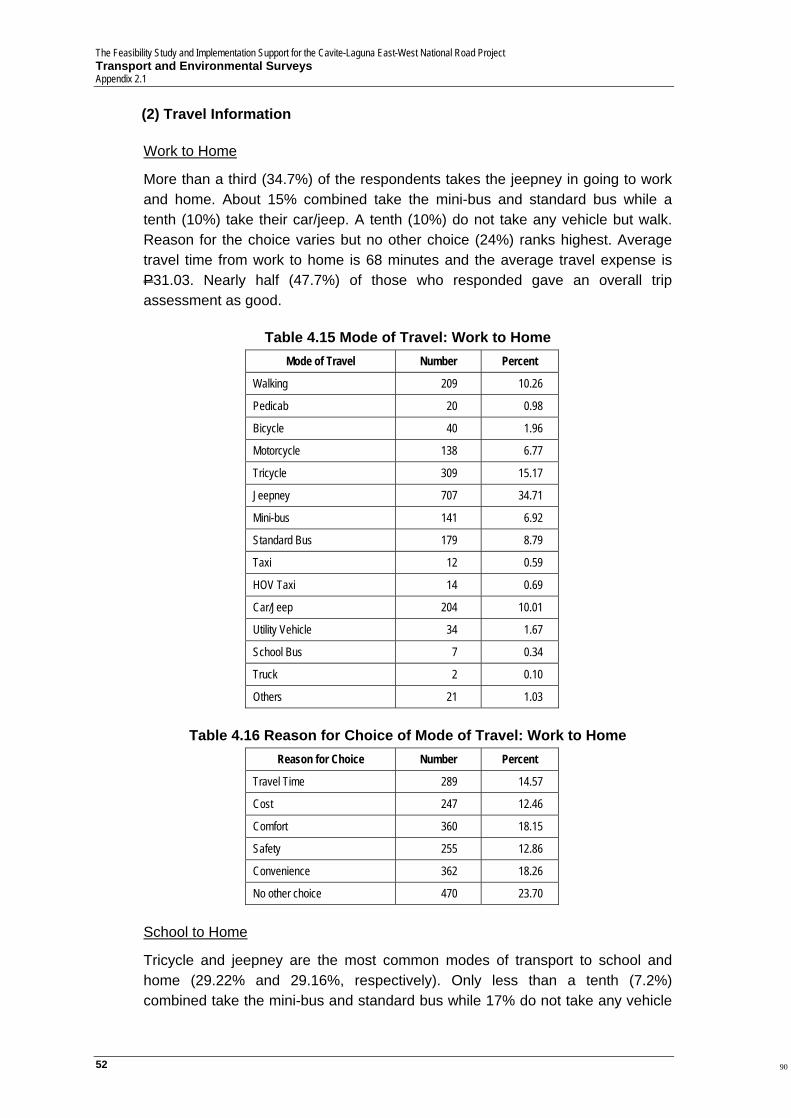
The Feasibility Study and Implementation Support for the Cavite-Laguna East-West National Road Project Transport and Environmental Surveys Appendix 2.1
52
(2) Travel Information Work to Home
More than a third (34.7%) of the respondents takes the jeepney in going to work and home. About 15% combined take the mini-bus and standard bus while a tenth (10%) take their car/jeep. A tenth (10%) do not take any vehicle but walk. Reason for the choice varies but no other choice (24%) ranks highest. Average travel time from work to home is 68 minutes and the average travel expense is P31.03. Nearly half (47.7%) of those who responded gave an overall trip assessment as good.
Table 4.15 Mode of Travel: Work to Home
Table 4.16 Reason for Choice of Mode of Travel: Work to Home
Reason for Choice Number Percent
Travel Time 289 14.57
Cost 247 12.46
Comfort 360 18.15
Safety 255 12.86
Convenience 362 18.26
No other choice 470 23.70
School to Home
Tricycle and jeepney are the most common modes of transport to school and home (29.22% and 29.16%, respectively). Only less than a tenth (7.2%) combined take the mini-bus and standard bus while 17% do not take any vehicle
Mode of Travel Number Percent
Walking 209 10.26
Pedicab 20 0.98
Bicycle 40 1.96
Motorcycle 138 6.77
Tricycle 309 15.17
Jeepney 707 34.71
Mini-bus 141 6.92
Standard Bus 179 8.79
Taxi 12 0.59
HOV Taxi 14 0.69
Car/Jeep 204 10.01
Utility Vehicle 34 1.67
School Bus 7 0.34
Truck 2 0.10
Others 21 1.03
90
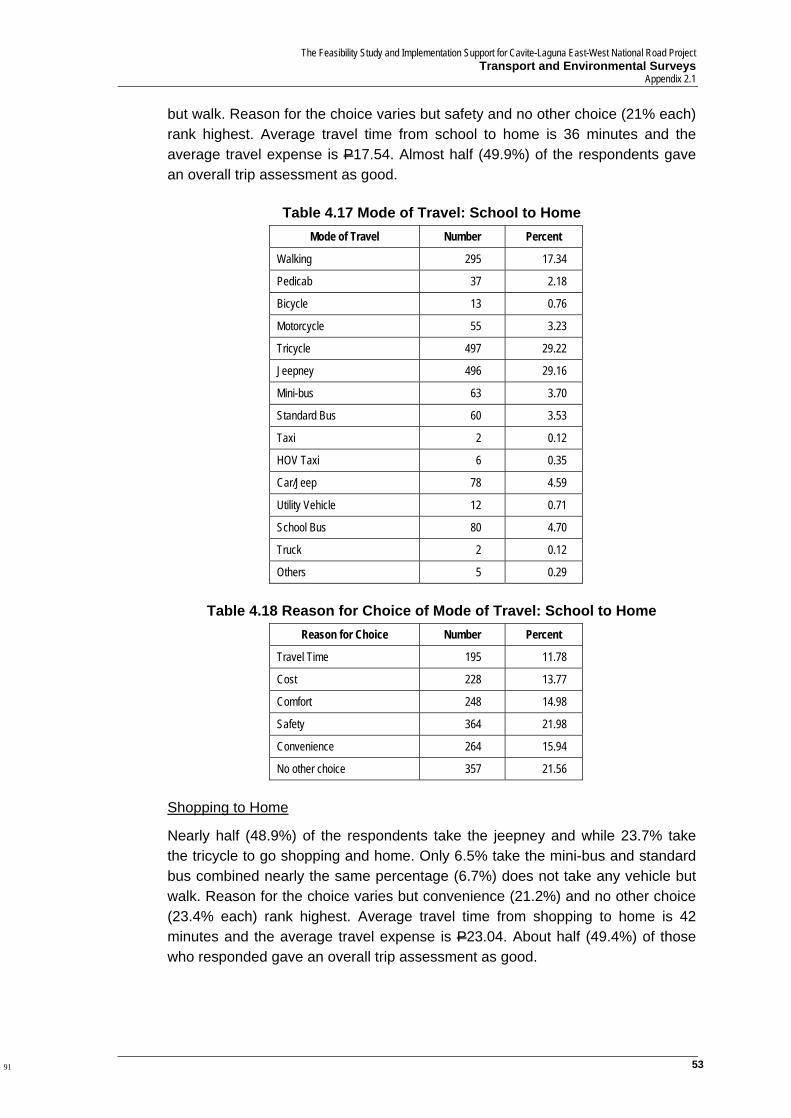
The Feasibility Study and Implementation Support for Cavite-Laguna East-West National Road Project Transport and Environmental Surveys
Appendix 2.1
53
but walk. Reason for the choice varies but safety and no other choice (21% each) rank highest. Average travel time from school to home is 36 minutes and the average travel expense is P17.54. Almost half (49.9%) of the respondents gave an overall trip assessment as good.
Table 4.17 Mode of Travel: School to Home
Table 4.18 Reason for Choice of Mode of Travel: School to Home
Reason for Choice Number Percent
Travel Time 195 11.78
Cost 228 13.77
Comfort 248 14.98
Safety 364 21.98
Convenience 264 15.94
No other choice 357 21.56
Shopping to Home
Nearly half (48.9%) of the respondents take the jeepney and while 23.7% take the tricycle to go shopping and home. Only 6.5% take the mini-bus and standard bus combined nearly the same percentage (6.7%) does not take any vehicle but walk. Reason for the choice varies but convenience (21.2%) and no other choice (23.4% each) rank highest. Average travel time from shopping to home is 42 minutes and the average travel expense is P23.04. About half (49.4%) of those who responded gave an overall trip assessment as good.
Mode of Travel Number Percent
Walking 295 17.34
Pedicab 37 2.18
Bicycle 13 0.76
Motorcycle 55 3.23
Tricycle 497 29.22
Jeepney 496 29.16
Mini-bus 63 3.70
Standard Bus 60 3.53
Taxi 2 0.12
HOV Taxi 6 0.35
Car/Jeep 78 4.59
Utility Vehicle 12 0.71
School Bus 80 4.70
Truck 2 0.12
Others 5 0.29
91
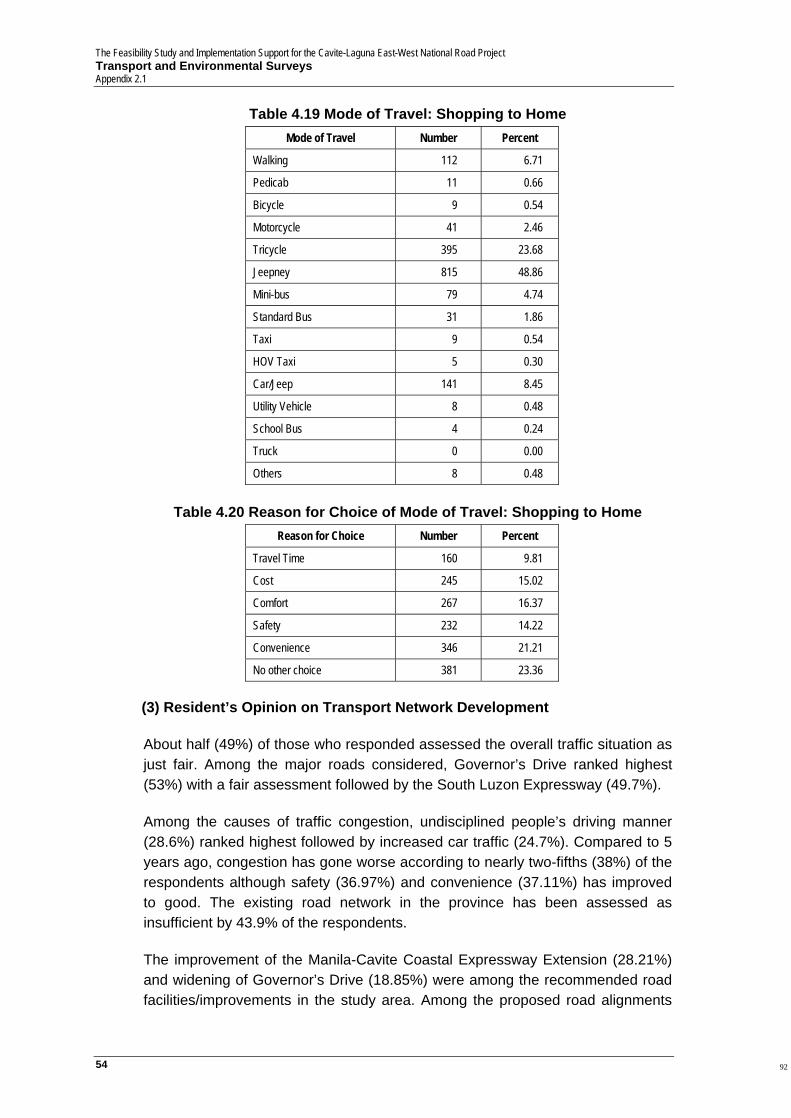
The Feasibility Study and Implementation Support for the Cavite-Laguna East-West National Road Project Transport and Environmental Surveys Appendix 2.1
54
Table 4.19 Mode of Travel: Shopping to Home
Table 4.20 Reason for Choice of Mode of Travel: Shopping to Home
Reason for Choice Number Percent
Travel Time 160 9.81
Cost 245 15.02
Comfort 267 16.37
Safety 232 14.22
Convenience 346 21.21
No other choice 381 23.36
(3) Resident’s Opinion on Transport Network Development
About half (49%) of those who responded assessed the overall traffic situation as just fair. Among the major roads considered, Governor’s Drive ranked highest (53%) with a fair assessment followed by the South Luzon Expressway (49.7%).
Among the causes of traffic congestion, undisciplined people’s driving manner (28.6%) ranked highest followed by increased car traffic (24.7%). Compared to 5 years ago, congestion has gone worse according to nearly two-fifths (38%) of the respondents although safety (36.97%) and convenience (37.11%) has improved to good. The existing road network in the province has been assessed as insufficient by 43.9% of the respondents.
The improvement of the Manila-Cavite Coastal Expressway Extension (28.21%) and widening of Governor’s Drive (18.85%) were among the recommended road facilities/improvements in the study area. Among the proposed road alignments
Mode of Travel Number Percent
Walking 112 6.71
Pedicab 11 0.66
Bicycle 9 0.54
Motorcycle 41 2.46
Tricycle 395 23.68
Jeepney 815 48.86
Mini-bus 79 4.74
Standard Bus 31 1.86
Taxi 9 0.54
HOV Taxi 5 0.30
Car/Jeep 141 8.45
Utility Vehicle 8 0.48
School Bus 4 0.24
Truck 0 0.00
Others 8 0.48
92
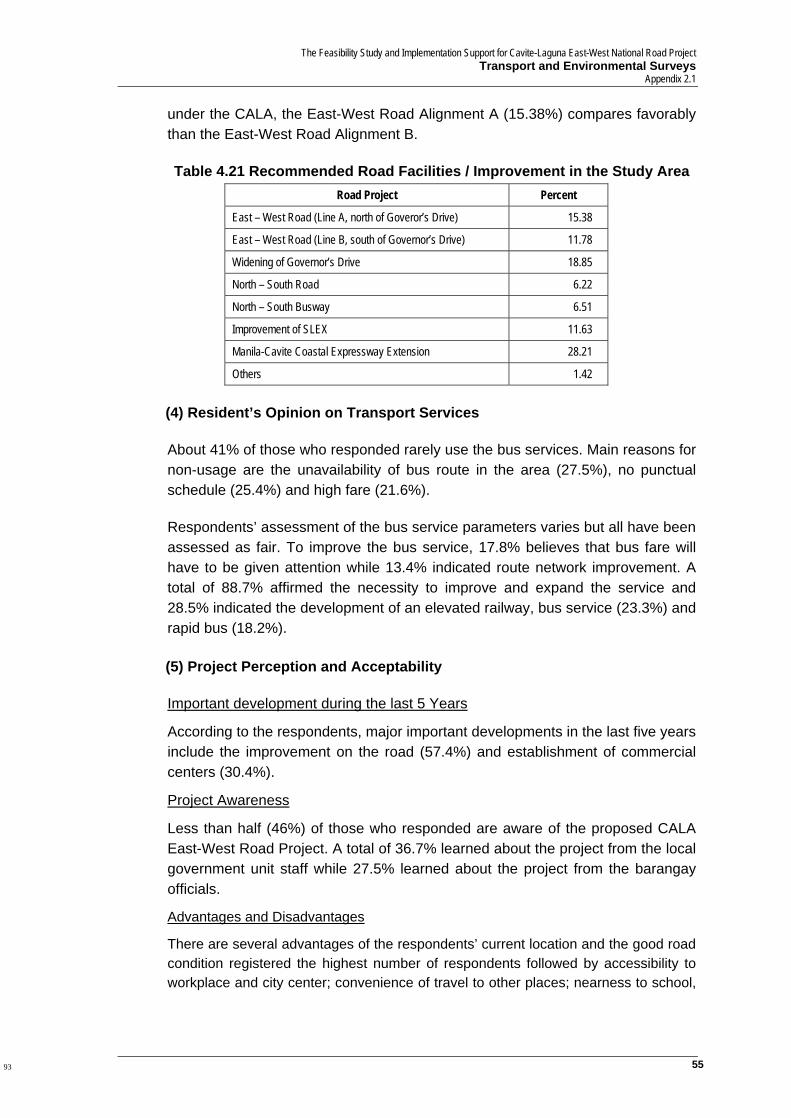
The Feasibility Study and Implementation Support for Cavite-Laguna East-West National Road Project Transport and Environmental Surveys
Appendix 2.1
55
under the CALA, the East-West Road Alignment A (15.38%) compares favorably than the East-West Road Alignment B. Table 4.21 Recommended Road Facilities / Improvement in the Study Area
Road Project Percent
East – West Road (Line A, north of Goveror’s Drive) 15.38
East – West Road (Line B, south of Governor’s Drive) 11.78
Widening of Governor’s Drive 18.85
North – South Road 6.22
North – South Busway 6.51
Improvement of SLEX 11.63
Manila-Cavite Coastal Expressway Extension 28.21
Others 1.42
(4) Resident’s Opinion on Transport Services
About 41% of those who responded rarely use the bus services. Main reasons for non-usage are the unavailability of bus route in the area (27.5%), no punctual schedule (25.4%) and high fare (21.6%). Respondents’ assessment of the bus service parameters varies but all have been assessed as fair. To improve the bus service, 17.8% believes that bus fare will have to be given attention while 13.4% indicated route network improvement. A total of 88.7% affirmed the necessity to improve and expand the service and 28.5% indicated the development of an elevated railway, bus service (23.3%) and rapid bus (18.2%).
(5) Project Perception and Acceptability Important development during the last 5 Years
According to the respondents, major important developments in the last five years include the improvement on the road (57.4%) and establishment of commercial centers (30.4%).
Project Awareness
Less than half (46%) of those who responded are aware of the proposed CALA East-West Road Project. A total of 36.7% learned about the project from the local government unit staff while 27.5% learned about the project from the barangay officials.
Advantages and Disadvantages
There are several advantages of the respondents’ current location and the good road condition registered the highest number of respondents followed by accessibility to workplace and city center; convenience of travel to other places; nearness to school,
93
The Feasibility Study and Implementation Support for the Cavite-Laguna East-West National Road Project Transport and Environmental Surveys Appendix 2.1
56
market, and other facilities among others. The disadvantages include road congestion; being far from relatives; less access to transport modes, among others.
Perceived Changes
Several perceived changes had been presented to the respondents for their assessment.
According to the respondents, there had been improvement in the following aspects: traveling time (48.70%); comfort to travel (49%); availability of transport route (52%); availability of alternate route (50%); delivery of goods (45.6%); mobility (44%); road safety (39%); safety of pedestrian crossing (46.4%); safety (53.3%); accessibility to school (60%); accessibility to work (56.4%); accessibility to public transport (58%); accessibility to market (59%); accessibility to social facilities (51%); general accessibility (55%); business opportunities (52%); employment opportunities (53%); working efficiency (48.3%); land value (51.5%); and vending opportunities (45.7%).
On the other hand, the respondents also indicated worsening of the following aspects: traffic congestion (37.6%); cost of fuel for vehicles (48.7%); volume of speeding motorists (38.1%); squatter situation (37.5%); air pollution (36.5%); and respiratory illness (35.4%).
There had been no perceived changes in the following aspects: punctuality of commuting for work (38.2%); incidence of accidents (35.4%); safety of driving bikes (40%); business for tourists (50.6%); existing social networks (42%); incidence of flooding (33%); and attractive facilities (44%).
Project Desirability
Majority (89.9%) of those who responded indicated that the project is a good initiative.
Project Benefits
According to the respondents, more business opportunities rank high as one of the benefits that the project will bring followed by employment opportunities; working efficiency due to time saved; and solution of the congestion problem, among others.
94
The Feasibility Study and Implementation Support for Cavite-Laguna East-West National Road Project Transport and Environmental Surveys
Appendix 2.1
57
Project Negative Impacts
Among the negative impacts that the respondents cited include relocation to other places; loss of work; loss of livelihood; and low compensation benefits, among others.
Project Approval
A total of 64.9% of the respondents generally approve of the implementation of the proposed CALA East-West Road Project, 34.5% of which strongly approves while a 30.5% somewhat approves. Only 8.4% of the total disapproves of the project.
4.8 Business Establishment Detailed survey results are presented in Traffic Survey Report Volume 8: Business Establishment Interview Survey Report (TSR-V8). The succeeding discussion presents the summary survey results.
(1) Profile of Establishment
A total of 56% of the businesses visited for the interview are generally local entities while 9% are joint venture and 16% are owned by multinational companies. According to the respondents, more than a third (34%) of these are generally classified as small-sized while another more than a third (36%) are classified as medium-sized. The large businesses account for less than a third (29%) of the total.
Of the interviewed establishments, 43% have been in operation for 1-5 years; 28.9% have been in operation for 6-10 years; 23.8% for 10-19 years; and only 3% of the respondents operated for more than 20 years.
Most (57%) of the business establishments interviewed have between 1-9 employees; 22% have 10-99 employees and 20% have more than 200 employees. In terms of operating hours, 43.4% operate 8 hours a day while 20.6% operate 24 hours a day. (2) Assessment of Current Transport Problems
Several typical current traffic conditions affecting the business and employees’ transport had been presented to the respondents for their assessment.
Traffic Congestion
Traffic congestion in the study area has been generally regarded as “very bad” (78.9%).
Traffic Safety
Traffic safety is regarded as “very bad” by 34.3% of the respondents. Only 14.5% regarded it is still “good”.
Air Pollution
Majority (73.2%) of the respondents indicated air pollution as “very bad”.
Commuting to Establishment/Workplace
95
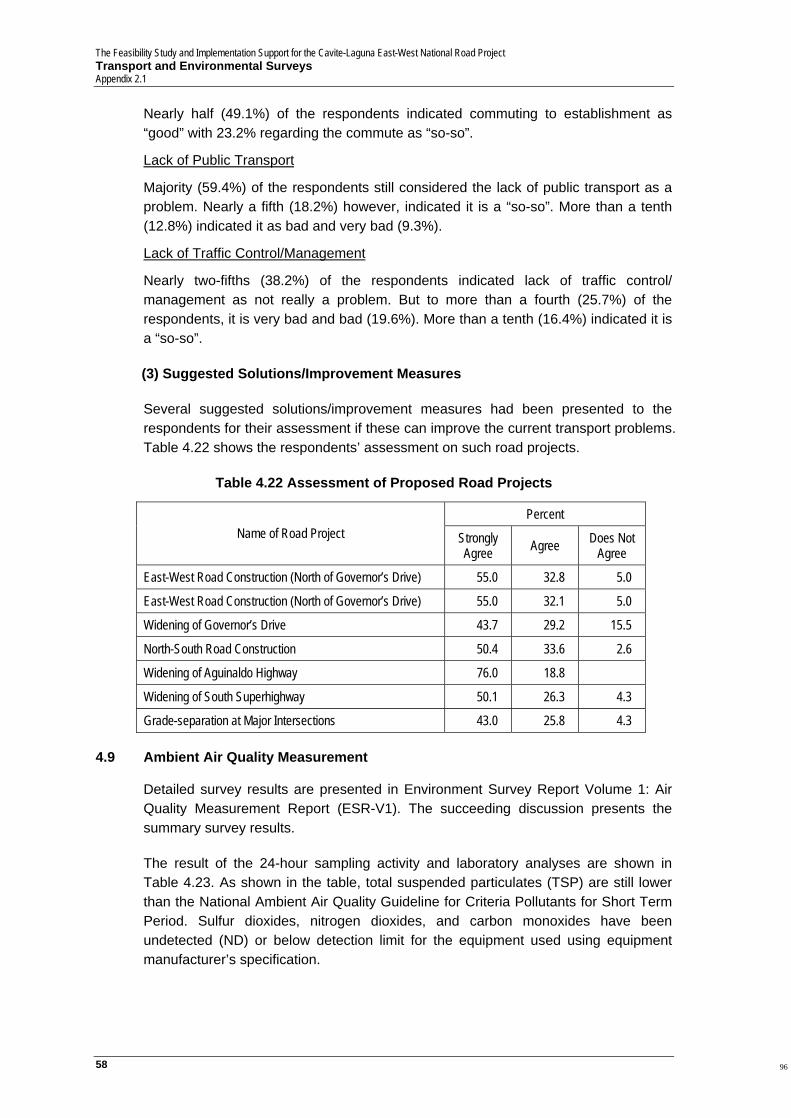
The Feasibility Study and Implementation Support for the Cavite-Laguna East-West National Road Project Transport and Environmental Surveys Appendix 2.1
58
Nearly half (49.1%) of the respondents indicated commuting to establishment as “good” with 23.2% regarding the commute as “so-so”.
Lack of Public Transport
Majority (59.4%) of the respondents still considered the lack of public transport as a problem. Nearly a fifth (18.2%) however, indicated it is a “so-so”. More than a tenth (12.8%) indicated it as bad and very bad (9.3%).
Lack of Traffic Control/Management
Nearly two-fifths (38.2%) of the respondents indicated lack of traffic control/ management as not really a problem. But to more than a fourth (25.7%) of the respondents, it is very bad and bad (19.6%). More than a tenth (16.4%) indicated it is a “so-so”. (3) Suggested Solutions/Improvement Measures
Several suggested solutions/improvement measures had been presented to the respondents for their assessment if these can improve the current transport problems. Table 4.22 shows the respondents’ assessment on such road projects.
Table 4.22 Assessment of Proposed Road Projects
Percent Name of Road Project Strongly
Agree Agree Does Not Agree
East-West Road Construction (North of Governor’s Drive) 55.0 32.8 5.0
East-West Road Construction (North of Governor’s Drive) 55.0 32.1 5.0
Widening of Governor’s Drive 43.7 29.2 15.5
North-South Road Construction 50.4 33.6 2.6
Widening of Aguinaldo Highway 76.0 18.8
Widening of South Superhighway 50.1 26.3 4.3
Grade-separation at Major Intersections 43.0 25.8 4.3
4.9 Ambient Air Quality Measurement Detailed survey results are presented in Environment Survey Report Volume 1: Air Quality Measurement Report (ESR-V1). The succeeding discussion presents the summary survey results. The result of the 24-hour sampling activity and laboratory analyses are shown in Table 4.23. As shown in the table, total suspended particulates (TSP) are still lower than the National Ambient Air Quality Guideline for Criteria Pollutants for Short Term Period. Sulfur dioxides, nitrogen dioxides, and carbon monoxides have been undetected (ND) or below detection limit for the equipment used using equipment manufacturer’s specification.
96
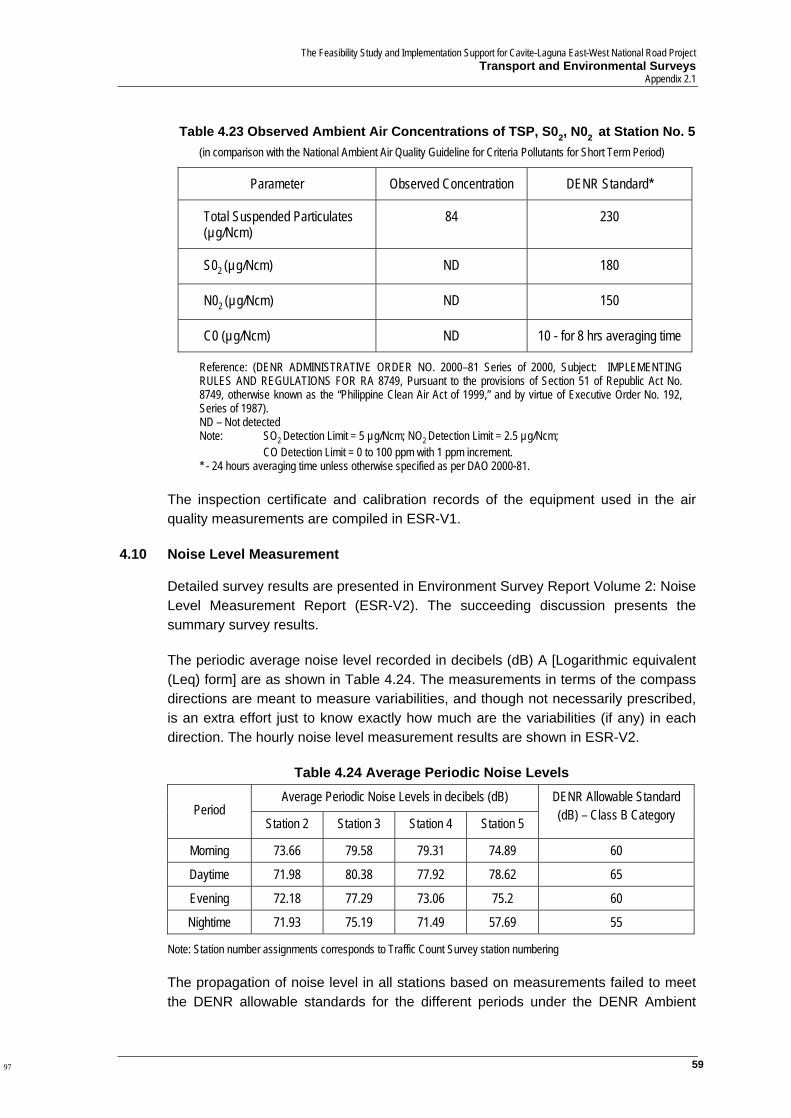
The Feasibility Study and Implementation Support for Cavite-Laguna East-West National Road Project Transport and Environmental Surveys
Appendix 2.1
59
Table 4.23 Observed Ambient Air Concentrations of TSP, S02, N02 at Station No. 5
(in comparison with the National Ambient Air Quality Guideline for Criteria Pollutants for Short Term Period)
Parameter Observed Concentration DENR Standard*
Total Suspended Particulates (µg/Ncm)
84 230
S02 (µg/Ncm) ND 180
N02 (µg/Ncm) ND 150
C0 (µg/Ncm) ND 10 - for 8 hrs averaging time
Reference: (DENR ADMINISTRATIVE ORDER NO. 2000–81 Series of 2000, Subject: IMPLEMENTING RULES AND REGULATIONS FOR RA 8749, Pursuant to the provisions of Section 51 of Republic Act No. 8749, otherwise known as the “Philippine Clean Air Act of 1999,” and by virtue of Executive Order No. 192, Series of 1987). ND – Not detected Note: SO2 Detection Limit = 5 µg/Ncm; NO2 Detection Limit = 2.5 µg/Ncm;
CO Detection Limit = 0 to 100 ppm with 1 ppm increment. * - 24 hours averaging time unless otherwise specified as per DAO 2000-81.
The inspection certificate and calibration records of the equipment used in the air quality measurements are compiled in ESR-V1.
4.10 Noise Level Measurement
Detailed survey results are presented in Environment Survey Report Volume 2: Noise Level Measurement Report (ESR-V2). The succeeding discussion presents the summary survey results.
The periodic average noise level recorded in decibels (dB) A [Logarithmic equivalent (Leq) form] are as shown in Table 4.24. The measurements in terms of the compass directions are meant to measure variabilities, and though not necessarily prescribed, is an extra effort just to know exactly how much are the variabilities (if any) in each direction. The hourly noise level measurement results are shown in ESR-V2.
Table 4.24 Average Periodic Noise Levels
Average Periodic Noise Levels in decibels (dB) Period
Station 2 Station 3 Station 4 Station 5
DENR Allowable Standard (dB) – Class B Category
Morning 73.66 79.58 79.31 74.89 60
Daytime 71.98 80.38 77.92 78.62 65
Evening 72.18 77.29 73.06 75.2 60
Nightime 71.93 75.19 71.49 57.69 55
Note: Station number assignments corresponds to Traffic Count Survey station numbering The propagation of noise level in all stations based on measurements failed to meet the DENR allowable standards for the different periods under the DENR Ambient
97

The Feasibility Study and Implementation Support for the Cavite-Laguna East-West National Road Project Transport and Environmental Surveys Appendix 2.1
60
Noise Quality Standards Sec. 78 Chapter IV, Article 1 of NPCC Rules & Regulations, 1978 standard limits for Class B category. The main reason for this condition at the time of survey is the sustained vehicular traffic movement that passes through the sampling points with very minimal or absence of noise abatement structures and/or vegetation that would dampen the noise levels from such sources along the alignment where the sampling stations are located. The traffic count during the same date of the noise level measurement is appended in the Annex of ESR-V2. The inspection certificate and calibration records of the sound level meters are compiled in ESR-V2.
4.11 Water Quality Sampling
Detailed survey results are presented in Environment Survey Report Volume 3: Water Quality Sampling and Laboratory Report (ESR-V3). The laboratory results of the water sampling activities are shown in Table 4.25 and Table 4.26. The pre-tabulated DENR laboratory results are compiled in ESR-V3.
(1) Imus River
The Imus River has been classified by the DENR as Class C waters under “Section 68. Water Usage and Classification” for fresh surface waters (rivers, lakes, reservoirs, etc.) of DAO 90-34. Class C waters has defined beneficial uses such as fishery water for the propagation and growth of fish and other aquatic resources; recreational water class II (for boating etc.), and as Industrial Water Supply Class I (for manufacturing processes after treatment). The laboratory results of Imus River as shown in Table 4.25 are therefore comparable only to the standards applicable to that class. The Biological Oxygen Demand (BOD) observed values for the Imus River are generally below DENR’s minimum limits except during the morning sampling for Sampling locations 1 and 3, and during the evening for Sampling Station 2 where the observed values exceeded the DENR’s maximum limits.
Dissolved Oxygen (DO) observed values on the other hand exceeded DENR’s standard except during the morning sampling for Sampling Stations 1 and 3, and during the afternoon and evening samplings for Sampling Station 2.
Oil and grease observed values exceeded DENR’s standard except during the morning sampling for Sampling locations 1 and 2, and during the evening sampling for Sampling Station 2.
For Total Suspended Solids (TSS), the DENR specified a standard of not more than 30 mg/L increase. It is not clear however, where it will have to be referred to. In the case of the observations made, the observe values exceed the DENR standard only for Sampling Station 1 if comparisons will be made in between sampling periods.
98
The Feasibility Study and Implementation Support for Cavite-Laguna East-West National Road Project Transport and Environmental Surveys
Appendix 2.1
61
The Total Coliform count in all of the sampling stations of Imus River was observably high compared to the DENR standard. The numbers are also observed to peak during the afternoon sampling period.
(2) Ylang-Ylang River
The Ylang-Ylang River has been classified by the DENR either as Class C waters for its downstream (Sampling Stations 1 and 2), and Class B (Sampling Station 3) for its upstream under “Section 68. Water Usage and Classification” for fresh surface waters (rivers, lakes, reservoirs, etc.) of DAO 90-34. Class C waters has defined beneficial uses such as fishery water for the propagation and growth of fish and other aquatic resources; recreational water class II (for boating etc.), and as Industrial Water Supply Class I (for manufacturing processes after treatment). Class B waters on the other hand has defined beneficial use as recreational water class I (for primary contact recreation such as bathing, swimming, skin diving, etc. particularly those designated for tourism purposes). The laboratory results of Ylang-Ylang River as shown in Table 4.26 are therefore comparable only to the standards applicable to that class.
99

The F
easib
ility S
tudy a
nd Im
pleme
ntatio
n Sup
port
for th
e Cav
ite-L
agun
a Eas
t-Wes
t Nati
onal
Road
Pro
ject
Tran
spor
t and
Env
ironm
enta
l Sur
veys
Ap
pend
ix 2.1
62
t Tr
ansp
ort a
nd E
n
DE
NR
Par
amet
ers
Sta
nd
ard
(Tab
le 1
of
DA
O 9
0-34
)A
.MP.
M.
Eve
ning
A.M
P.M
.E
veni
ngA
.MP.
M.
Eve
ning
Am
mon
ia, m
g/L
-0.
414
0.41
70.
156
0.05
0.72
50.
531
1.03
0.06
3<
0.00
1B
iolo
gic
al O
xyg
en D
eman
d (
BO
D),
mg
/7(
10)
185
64
720
141
1
Col
or (A
ppar
ent C
olor
), PC
U*
5050
505
7575
5015
15D
isso
lved
Ox
ygen
(D
O),
mg
/L
54.
35.
46.
38
2.9
1.4
4.6
7.7
7.7
Oil
an
d G
reas
e, m
g/
L2
16
61
69
57
2
pH (O
n-si
te)
6.5
- 8.5
7.68
7.76
7.86
7.66
7.65
7.56
7.6
7.53
7.58
Phos
phat
e (a
s O
rtho
), m
g/L
0.4
0.99
50.
489
0.56
80.
572
2.12
2.58
1.78
0.57
20.
564
Tem
pera
ture
(On-
site
), 0 C
3*
*28
.529
.528
.526
.528
.627
.723
22.9
22.8
Tot
al D
isso
lved
Sol
ids,
mg/
L-
3049
034
974
3393
630
947
646
145
528
428
8T
otal
Sol
ids,
mg/
L-
3049
935
057
3397
132
150
747
547
029
331
6T
ota
l S
usp
end
ed S
oli
ds
(TS
S),
mg
/L
***
983
3512
3114
159
28
To
tal
Co
lifo
rm, M
PN
/10
0 m
L5,
000
24 x
103
50 x
102
30 x
103
24 x
104
90 x
104
30 x
104
13 x
103
50 x
103
30 x
103
Feca
l Col
iform
, MPN
/100
mL
-24
x 1
0311
x 1
0280
x 1
0250
x 1
0316
x 1
0450
x 1
0313
x 1
0330
x 1
0350
x 1
02
Sta
tio
n I
den
tifi
cati
on
:
Stat
ion
1 - I
slan
d C
ove
Brid
ge (D
owns
trea
m in
Kaw
it, C
avite
)
Stat
ion
2 - S
alitr
an B
ridge
(Mid
stre
am a
t the
vici
nity
of D
e La
Sal
le U
nive
rsity
, Das
mar
inas
, Cav
ite)
St
atio
n 3
- Bal
ite 1
Brid
ge (U
pstr
eam
in B
aran
gay
Bal
ite, S
ilang
, Cav
ite)
Ex
cerp
ted
No
tes
fro
m D
AO
90-
34:
--- -
Mea
ns th
e st
anda
rd o
f the
se s
ubst
ance
s ar
e no
t con
side
red
nece
ssar
y fo
r the
pre
sent
tim
e, co
nsid
erin
g th
e st
age
of th
e A
30 d
evel
opm
ent a
nd D
EN
R ca
pabi
litie
s,
equ
ipm
ent a
nd re
sour
ces.
( ) -
Val
ues
in p
aren
thes
is m
eans
max
imum
val
ues
* - N
o ab
norm
al d
isco
lora
tion
from
unn
atur
al ca
uses
** -
The
allo
wab
le te
mpe
ratu
re in
crea
se o
ver t
he a
vera
ge a
mbi
ent t
empe
ratu
re fo
r eac
h m
onth
. T
his
rise
shal
l be
base
d on
the
aver
age
of th
e m
axim
um d
aily
tem
pera
ture
r
eadi
ngs
reco
rded
at t
he s
ite b
ut u
pstr
eam
of t
he m
ixin
g zo
ne o
ver a
per
iod
of o
ne (1
) mon
th.
***
- Not
mor
e th
an 3
0 m
g/L
incr
ease
3
Sam
pli
ng
Lo
cati
on
/S
tati
on
Nu
mb
er/
Per
iod
Imu
s R
iver
12
Tabl
e 4.
25 W
ater
Qua
lity
Sam
plin
g an
d La
bora
tory
Res
ults
– Im
us R
iver
100
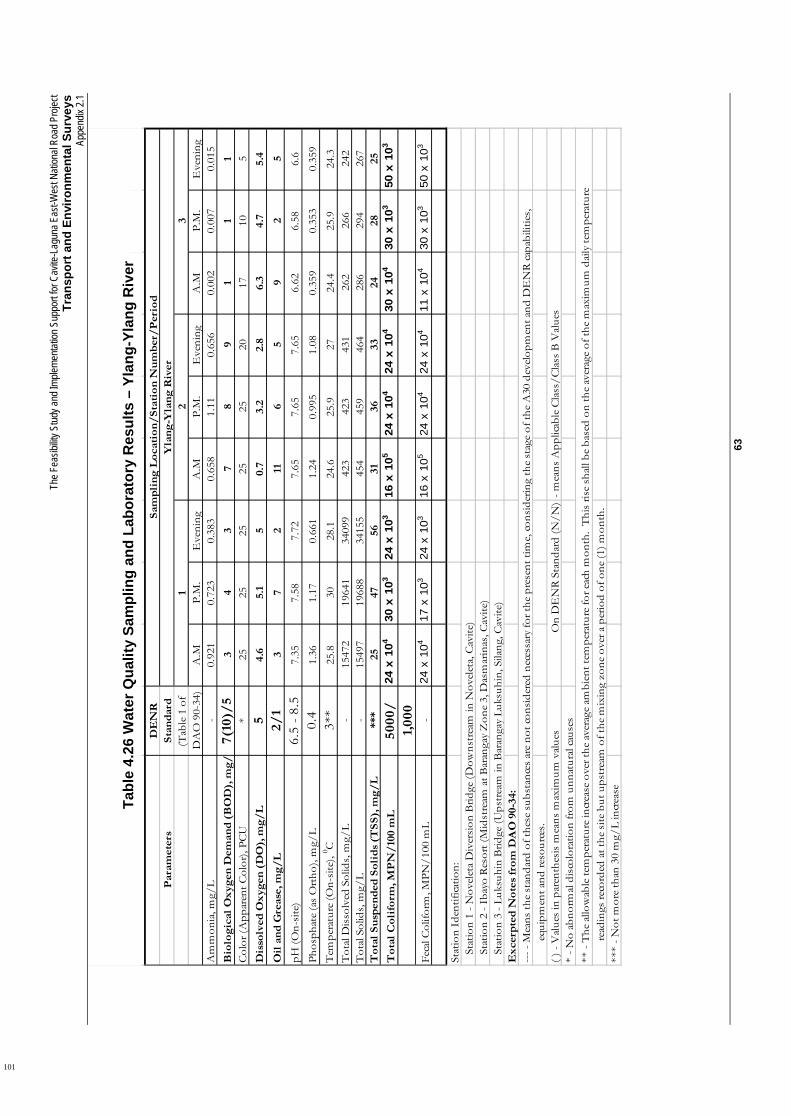
The F
easib
ility S
tudy a
nd Im
pleme
ntatio
n Sup
port
for C
avite
-Lag
una E
ast-W
est N
ation
al Ro
ad P
rojec
t Tr
ansp
ort a
nd E
nviro
nmen
tal S
urve
ys
Appe
ndix
2.1
63
DE
NR
Par
amet
ers
Sta
nd
ard
(Tab
le 1
of
DA
O 9
0-34
)A
.MP.
M.
Eve
ning
A.M
P.M
.E
veni
ngA
.MP.
M.
Eve
ning
Am
mon
ia, m
g/L
-0.
921
0.72
30.
383
0.65
81.
110.
656
0.00
20.
007
0.01
5B
iolo
gic
al O
xyg
en D
eman
d (
BO
D),
mg
/7(
10)/
53
43
78
91
11
Col
or (A
ppar
ent C
olor
), PC
U*
2525
2525
2520
1710
5D
isso
lved
Ox
ygen
(D
O),
mg
/L
54.
65.
15
0.7
3.2
2.8
6.3
4.7
5.4
Oil
an
d G
reas
e, m
g/
L2/
13
72
116
59
25
pH (O
n-si
te)
6.5
- 8.5
7.35
7.58
7.72
7.65
7.65
7.65
6.62
6.58
6.6
Phos
phat
e (a
s O
rtho
), m
g/L
0.4
1.36
1.17
0.66
11.
240.
995
1.08
0.35
90.
353
0.35
9T
empe
ratu
re (O
n-si
te),
0 C
3**
25.8
3028
.124
.625
.927
24.4
25.9
24.3
Tot
al D
isso
lved
Sol
ids,
mg/
L-
1547
219
641
3409
942
342
343
126
226
624
2T
otal
Sol
ids,
mg/
L-
1549
719
688
3415
545
445
946
428
629
426
7T
ota
l S
usp
end
ed S
oli
ds
(TS
S),
mg
/L
***
2547
5631
3633
2428
25
To
tal
Co
lifo
rm, M
PN
/10
0 m
L50
00/
24 x
104
30 x
103
24 x
103
16 x
105
24 x
104
24 x
104
30 x
104
30 x
103
50 x
103
1,00
0Fe
cal C
olifo
rm, M
PN/1
00 m
L-
24 x
104
17 x
103
24 x
103
16 x
105
24 x
104
24 x
104
11 x
104
30 x
103
50 x
103
Stat
ion
Iden
tifica
tion:
St
atio
n 1
- Nov
elet
a D
iver
sion
Brid
ge (D
owns
trea
m in
Nov
elet
a, C
avite
)
Stat
ion
2 - I
bayo
Res
ort (
Mid
stre
am a
t Bar
anga
y Z
one
3, D
asm
arin
as, C
avite
)
Stat
ion
3 - L
uksu
hin
Brid
ge (U
pstr
eam
in B
aran
gay
Luks
uhin
, Sila
ng, C
avite
)E
xce
rpte
d N
ote
s fr
om
DA
O 9
0-34
:--
- - M
eans
the
stan
dard
of t
hese
sub
stan
ces
are
not c
onsi
dere
d ne
cess
ary
for t
he p
rese
nt ti
me,
cons
ider
ing
the
stag
e of
the
A30
dev
elop
men
t and
DE
NR
capa
bilit
ies,
e
quip
men
t and
reso
urce
s.( )
- V
alue
s in
par
enth
esis
mea
ns m
axim
um v
alue
sO
n D
EN
R S
tand
ard
(N/N
)- m
eans
App
licab
le C
lass
/Cla
ss B
Val
ues
* - N
o ab
norm
al d
isco
lora
tion
from
unn
atur
al ca
uses
** -
The
allo
wab
le te
mpe
ratu
re in
crea
se o
ver t
he a
vera
ge a
mbi
ent t
empe
ratu
re fo
r eac
h m
onth
. T
his
rise
shal
l be
base
d on
the
aver
age
of th
e m
axim
um d
aily
tem
pera
ture
r
eadi
ngs
reco
rded
at t
he s
ite b
ut u
pstr
eam
of t
he m
ixin
g zo
ne o
ver a
per
iod
of o
ne (1
) mon
th.
***
- Not
mor
e th
an 3
0 m
g/L
incr
ease
Yla
ng
-Yla
ng
Riv
er1
23
Sam
pli
ng
Lo
cati
on
/S
tati
on
Nu
mb
er/
Per
iod
Tabl
e 4.
26 W
ater
Qua
lity
Sam
plin
g an
d La
bora
tory
Res
ults
– Y
lang
-Yla
ng R
iver
101
The Feasibility Study and Implementation Support for the Cavite-Laguna East-West National Road Project Transport and Environmental Surveys Appendix 2.1
64
The Biological Oxygen Demand (BOD) observed values of the Ylang-Ylang River are generally within DENR’s minimum and maximum limits. Dissolved Oxygen (DO) observed values are within DENR’s standard except for the afternoon sampling period for Sampling Station 1 and for both morning and evening sampling periods for Sampling Station 3.
Oil and grease observed values exceeded DENR’s standard except during the evening sampling period for Sampling Station 1, and during the afternoon sampling period for Sampling Station 3.
For Total Suspended Solids (TSS), the DENR specified a standard of not more than 30 mg/L increase. It is not clear however, where it will have to be referred to. In the case of the observations made, the observe values are within the DENR standard if comparisons will be made in between sampling periods.
The Total Coliform count in all of the sampling stations of Ylang-Ylang River was observably high compared to the DENR standard. The numbers are also observed to peak during the afternoon sampling period for Stations 1 and 2, and during the evening for Station 3.
The inspection certificate, calibration records of the sampling and laboratory equipment, and the official certificates of compliance proficiency that verify reliable and accurate quality of equipment to be used for the analysis are compiled in ESR-V3.
102

The Feasibility Study and Implementation Support for Cavite-Laguna East-West National Road Project Transport and Environmental Surveys
Appendix 2.1
65
Annex 1: Average Daily Traffic Volume
103
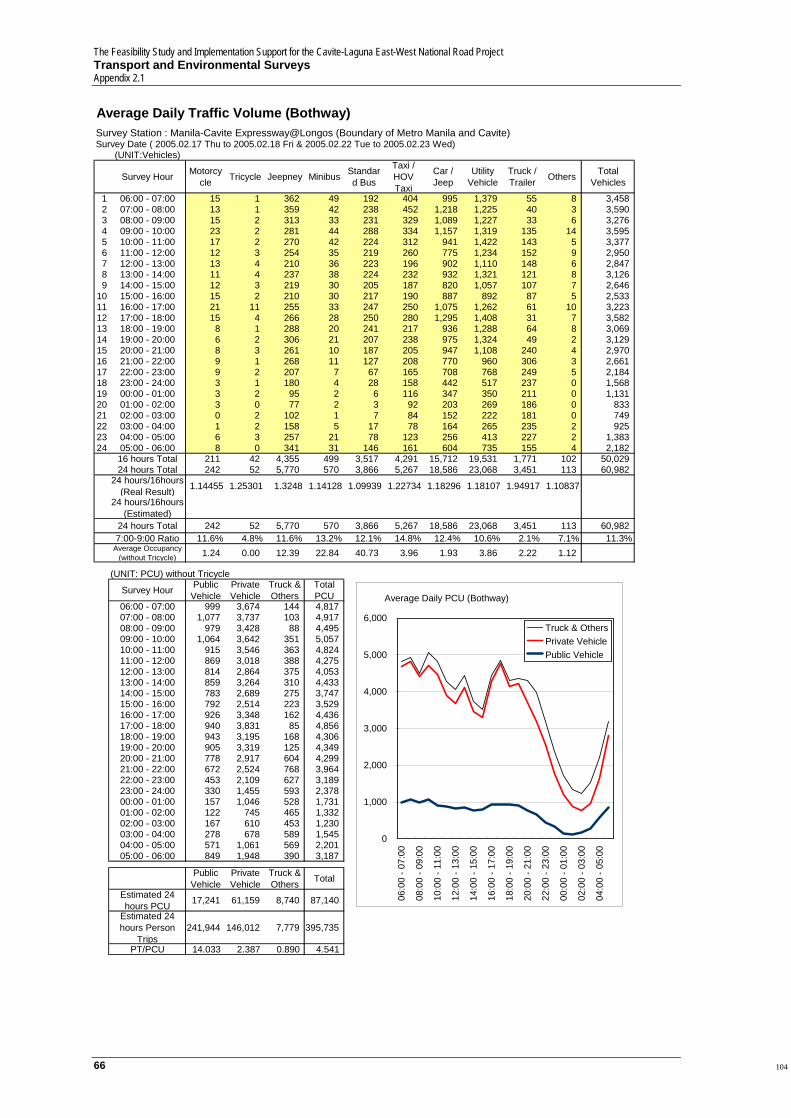
The Feasibility Study and Implementation Support for the Cavite-Laguna East-West National Road Project Transport and Environmental Surveys Appendix 2.1
66
Average Daily Traffic Volume (Bothway)Survey Station : Manila-Cavite Expressway@Longos (Boundary of Metro Manila and Cavite)Survey Date ( 2005.02.17 Thu to 2005.02.18 Fri & 2005.02.22 Tue to 2005.02.23 Wed)
(UNIT:Vehicles)
Survey Hour Motorcycle Tricycle Jeepney Minibus Standar
d Bus
Taxi /HOV Taxi
Car / Jeep
Utility Vehicle
Truck / Trailer Others Total
Vehicles
1 06:00 - 07:00 15 1 362 49 192 404 995 1,379 55 8 3,4582 07:00 - 08:00 13 1 359 42 238 452 1,218 1,225 40 3 3,5903 08:00 - 09:00 15 2 313 33 231 329 1,089 1,227 33 6 3,2764 09:00 - 10:00 23 2 281 44 288 334 1,157 1,319 135 14 3,5955 10:00 - 11:00 17 2 270 42 224 312 941 1,422 143 5 3,3776 11:00 - 12:00 12 3 254 35 219 260 775 1,234 152 9 2,9507 12:00 - 13:00 13 4 210 36 223 196 902 1,110 148 6 2,8478 13:00 - 14:00 11 4 237 38 224 232 932 1,321 121 8 3,1269 14:00 - 15:00 12 3 219 30 205 187 820 1,057 107 7 2,646
10 15:00 - 16:00 15 2 210 30 217 190 887 892 87 5 2,53311 16:00 - 17:00 21 11 255 33 247 250 1,075 1,262 61 10 3,22312 17:00 - 18:00 15 4 266 28 250 280 1,295 1,408 31 7 3,58213 18:00 - 19:00 8 1 288 20 241 217 936 1,288 64 8 3,06914 19:00 - 20:00 6 2 306 21 207 238 975 1,324 49 2 3,12915 20:00 - 21:00 8 3 261 10 187 205 947 1,108 240 4 2,97016 21:00 - 22:00 9 1 268 11 127 208 770 960 306 3 2,66117 22:00 - 23:00 9 2 207 7 67 165 708 768 249 5 2,18418 23:00 - 24:00 3 1 180 4 28 158 442 517 237 0 1,56819 00:00 - 01:00 3 2 95 2 6 116 347 350 211 0 1,13120 01:00 - 02:00 3 0 77 2 3 92 203 269 186 0 83321 02:00 - 03:00 0 2 102 1 7 84 152 222 181 0 74922 03:00 - 04:00 1 2 158 5 17 78 164 265 235 2 92523 04:00 - 05:00 6 3 257 21 78 123 256 413 227 2 1,38324 05:00 - 06:00 8 0 341 31 146 161 604 735 155 4 2,182
16 hours Total 211 42 4,355 499 3,517 4,291 15,712 19,531 1,771 102 50,02924 hours Total 242 52 5,770 570 3,866 5,267 18,586 23,068 3,451 113 60,982
24 hours/16hours (Real Result) 1.14455 1.25301 1.3248 1.14128 1.09939 1.22734 1.18296 1.18107 1.94917 1.10837
24 hours/16hours (Estimated)
24 hours Total 242 52 5,770 570 3,866 5,267 18,586 23,068 3,451 113 60,9827:00-9:00 Ratio 11.6% 4.8% 11.6% 13.2% 12.1% 14.8% 12.4% 10.6% 2.1% 7.1% 11.3%
Average Occupancy (without Tricycle) 1.24 0.00 12.39 22.84 40.73 3.96 1.93 3.86 2.22 1.12
(UNIT: PCU) without Tricycle
Survey Hour Public Vehicle
Private Vehicle
Truck & Others
Total PCU
06:00 - 07:00 999 3,674 144 4,81707:00 - 08:00 1,077 3,737 103 4,91708:00 - 09:00 979 3,428 88 4,49509:00 - 10:00 1,064 3,642 351 5,05710:00 - 11:00 915 3,546 363 4,82411:00 - 12:00 869 3,018 388 4,27512:00 - 13:00 814 2,864 375 4,05313:00 - 14:00 859 3,264 310 4,43314:00 - 15:00 783 2,689 275 3,74715:00 - 16:00 792 2,514 223 3,52916:00 - 17:00 926 3,348 162 4,43617:00 - 18:00 940 3,831 85 4,85618:00 - 19:00 943 3,195 168 4,30619:00 - 20:00 905 3,319 125 4,34920:00 - 21:00 778 2,917 604 4,29921:00 - 22:00 672 2,524 768 3,96422:00 - 23:00 453 2,109 627 3,18923:00 - 24:00 330 1,455 593 2,37800:00 - 01:00 157 1,046 528 1,73101:00 - 02:00 122 745 465 1,33202:00 - 03:00 167 610 453 1,23003:00 - 04:00 278 678 589 1,54504:00 - 05:00 571 1,061 569 2,20105:00 - 06:00 849 1,948 390 3,187
Public Vehicle
Private Vehicle
Truck & Others Total
Estimated 24 hours PCU 17,241 61,159 8,740 87,140
Estimated 24 hours Person
Trips241,944 146,012 7,779 395,735
PT/PCU 14.033 2.387 0.890 4.541
Average Daily PCU (Bothway)
0
1,000
2,000
3,000
4,000
5,000
6,000
06:0
0 - 0
7:00
08:0
0 - 0
9:00
10:0
0 - 1
1:00
12:0
0 - 1
3:00
14:0
0 - 1
5:00
16:0
0 - 1
7:00
18:0
0 - 1
9:00
20:0
0 - 2
1:00
22:0
0 - 2
3:00
00:0
0 - 0
1:00
02:0
0 - 0
3:00
04:0
0 - 0
5:00
Truck & OthersPrivate VehiclePublic Vehicle
104
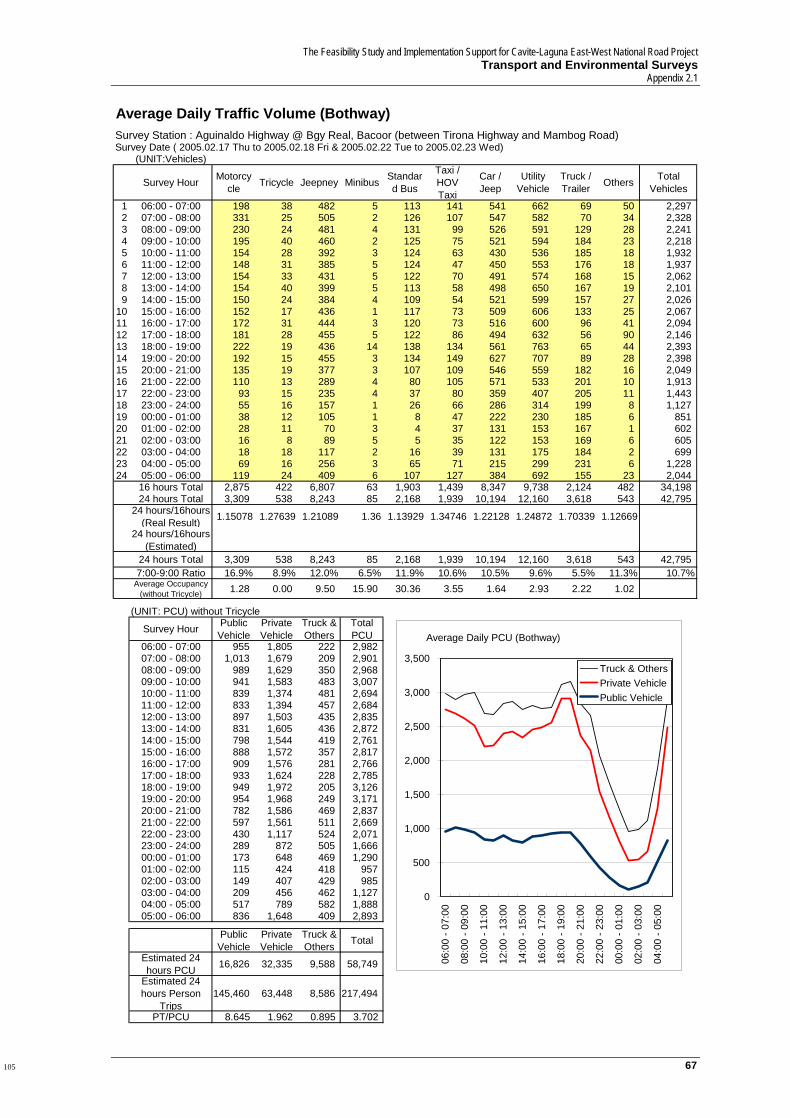
The Feasibility Study and Implementation Support for Cavite-Laguna East-West National Road Project Transport and Environmental Surveys
Appendix 2.1
67
Average Daily Traffic Volume (Bothway)Survey Station : Aguinaldo Highway @ Bgy Real, Bacoor (between Tirona Highway and Mambog Road)Survey Date ( 2005.02.17 Thu to 2005.02.18 Fri & 2005.02.22 Tue to 2005.02.23 Wed)
(UNIT:Vehicles)
Survey Hour Motorcycle Tricycle Jeepney Minibus Standar
d Bus
Taxi /HOV Taxi
Car / Jeep
Utility Vehicle
Truck / Trailer Others Total
Vehicles
1 06:00 - 07:00 198 38 482 5 113 141 541 662 69 50 2,2972 07:00 - 08:00 331 25 505 2 126 107 547 582 70 34 2,3283 08:00 - 09:00 230 24 481 4 131 99 526 591 129 28 2,2414 09:00 - 10:00 195 40 460 2 125 75 521 594 184 23 2,2185 10:00 - 11:00 154 28 392 3 124 63 430 536 185 18 1,9326 11:00 - 12:00 148 31 385 5 124 47 450 553 176 18 1,9377 12:00 - 13:00 154 33 431 5 122 70 491 574 168 15 2,0628 13:00 - 14:00 154 40 399 5 113 58 498 650 167 19 2,1019 14:00 - 15:00 150 24 384 4 109 54 521 599 157 27 2,026
10 15:00 - 16:00 152 17 436 1 117 73 509 606 133 25 2,06711 16:00 - 17:00 172 31 444 3 120 73 516 600 96 41 2,09412 17:00 - 18:00 181 28 455 5 122 86 494 632 56 90 2,14613 18:00 - 19:00 222 19 436 14 138 134 561 763 65 44 2,39314 19:00 - 20:00 192 15 455 3 134 149 627 707 89 28 2,39815 20:00 - 21:00 135 19 377 3 107 109 546 559 182 16 2,04916 21:00 - 22:00 110 13 289 4 80 105 571 533 201 10 1,91317 22:00 - 23:00 93 15 235 4 37 80 359 407 205 11 1,44318 23:00 - 24:00 55 16 157 1 26 66 286 314 199 8 1,12719 00:00 - 01:00 38 12 105 1 8 47 222 230 185 6 85120 01:00 - 02:00 28 11 70 3 4 37 131 153 167 1 60221 02:00 - 03:00 16 8 89 5 5 35 122 153 169 6 60522 03:00 - 04:00 18 18 117 2 16 39 131 175 184 2 69923 04:00 - 05:00 69 16 256 3 65 71 215 299 231 6 1,22824 05:00 - 06:00 119 24 409 6 107 127 384 692 155 23 2,044
16 hours Total 2,875 422 6,807 63 1,903 1,439 8,347 9,738 2,124 482 34,19824 hours Total 3,309 538 8,243 85 2,168 1,939 10,194 12,160 3,618 543 42,795
24 hours/16hours (Real Result) 1.15078 1.27639 1.21089 1.36 1.13929 1.34746 1.22128 1.24872 1.70339 1.12669
24 hours/16hours (Estimated)
24 hours Total 3,309 538 8,243 85 2,168 1,939 10,194 12,160 3,618 543 42,7957:00-9:00 Ratio 16.9% 8.9% 12.0% 6.5% 11.9% 10.6% 10.5% 9.6% 5.5% 11.3% 10.7%
Average Occupancy (without Tricycle) 1.28 0.00 9.50 15.90 30.36 3.55 1.64 2.93 2.22 1.02
(UNIT: PCU) without Tricycle
Survey Hour Public Vehicle
Private Vehicle
Truck & Others
Total PCU
06:00 - 07:00 955 1,805 222 2,98207:00 - 08:00 1,013 1,679 209 2,90108:00 - 09:00 989 1,629 350 2,96809:00 - 10:00 941 1,583 483 3,00710:00 - 11:00 839 1,374 481 2,69411:00 - 12:00 833 1,394 457 2,68412:00 - 13:00 897 1,503 435 2,83513:00 - 14:00 831 1,605 436 2,87214:00 - 15:00 798 1,544 419 2,76115:00 - 16:00 888 1,572 357 2,81716:00 - 17:00 909 1,576 281 2,76617:00 - 18:00 933 1,624 228 2,78518:00 - 19:00 949 1,972 205 3,12619:00 - 20:00 954 1,968 249 3,17120:00 - 21:00 782 1,586 469 2,83721:00 - 22:00 597 1,561 511 2,66922:00 - 23:00 430 1,117 524 2,07123:00 - 24:00 289 872 505 1,66600:00 - 01:00 173 648 469 1,29001:00 - 02:00 115 424 418 95702:00 - 03:00 149 407 429 98503:00 - 04:00 209 456 462 1,12704:00 - 05:00 517 789 582 1,88805:00 - 06:00 836 1,648 409 2,893
Public Vehicle
Private Vehicle
Truck & Others Total
Estimated 24 hours PCU 16,826 32,335 9,588 58,749
Estimated 24 hours Person
Trips145,460 63,448 8,586 217,494
PT/PCU 8.645 1.962 0.895 3.702
Average Daily PCU (Bothway)
0
500
1,000
1,500
2,000
2,500
3,000
3,500
06:0
0 - 0
7:00
08:0
0 - 0
9:00
10:0
0 - 1
1:00
12:0
0 - 1
3:00
14:0
0 - 1
5:00
16:0
0 - 1
7:00
18:0
0 - 1
9:00
20:0
0 - 2
1:00
22:0
0 - 2
3:00
00:0
0 - 0
1:00
02:0
0 - 0
3:00
04:0
0 - 0
5:00
Truck & OthersPrivate VehiclePublic Vehicle
105
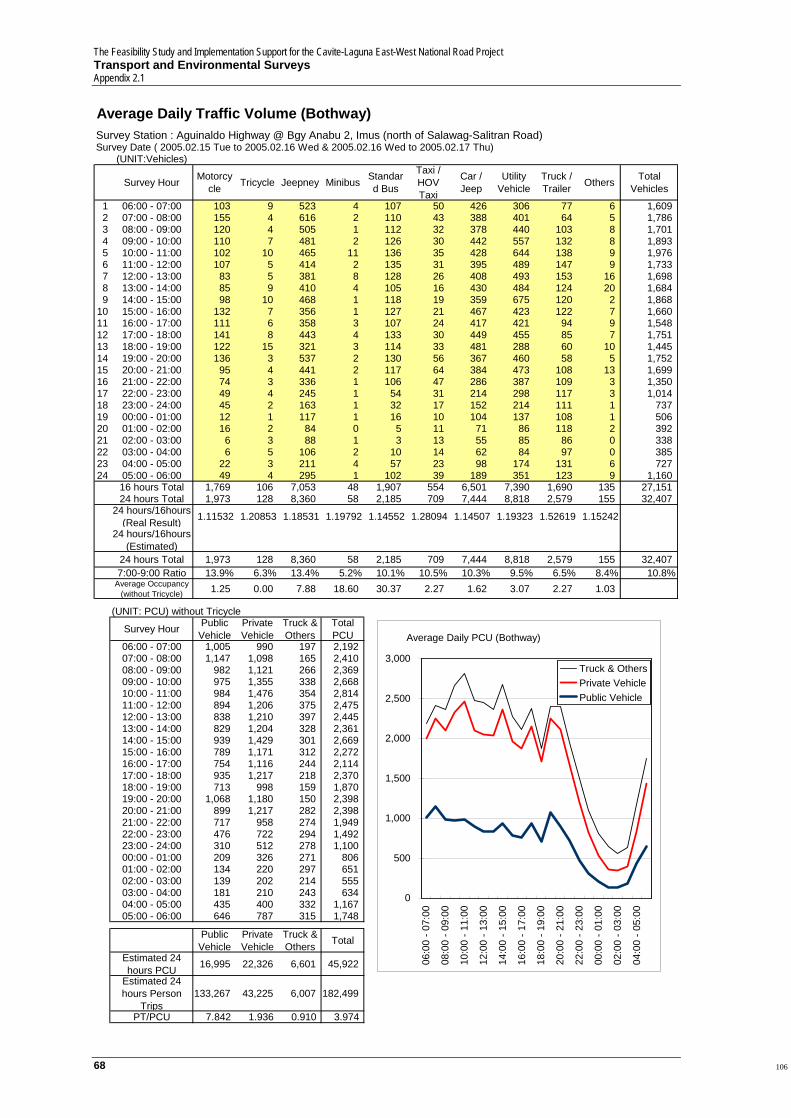
The Feasibility Study and Implementation Support for the Cavite-Laguna East-West National Road Project Transport and Environmental Surveys Appendix 2.1
68
Average Daily Traffic Volume (Bothway)Survey Station : Aguinaldo Highway @ Bgy Anabu 2, Imus (north of Salawag-Salitran Road)Survey Date ( 2005.02.15 Tue to 2005.02.16 Wed & 2005.02.16 Wed to 2005.02.17 Thu)
(UNIT:Vehicles)
Survey Hour Motorcycle Tricycle Jeepney Minibus Standar
d Bus
Taxi /HOV Taxi
Car / Jeep
Utility Vehicle
Truck / Trailer Others Total
Vehicles
1 06:00 - 07:00 103 9 523 4 107 50 426 306 77 6 1,6092 07:00 - 08:00 155 4 616 2 110 43 388 401 64 5 1,7863 08:00 - 09:00 120 4 505 1 112 32 378 440 103 8 1,7014 09:00 - 10:00 110 7 481 2 126 30 442 557 132 8 1,8935 10:00 - 11:00 102 10 465 11 136 35 428 644 138 9 1,9766 11:00 - 12:00 107 5 414 2 135 31 395 489 147 9 1,7337 12:00 - 13:00 83 5 381 8 128 26 408 493 153 16 1,6988 13:00 - 14:00 85 9 410 4 105 16 430 484 124 20 1,6849 14:00 - 15:00 98 10 468 1 118 19 359 675 120 2 1,868
10 15:00 - 16:00 132 7 356 1 127 21 467 423 122 7 1,66011 16:00 - 17:00 111 6 358 3 107 24 417 421 94 9 1,54812 17:00 - 18:00 141 8 443 4 133 30 449 455 85 7 1,75113 18:00 - 19:00 122 15 321 3 114 33 481 288 60 10 1,44514 19:00 - 20:00 136 3 537 2 130 56 367 460 58 5 1,75215 20:00 - 21:00 95 4 441 2 117 64 384 473 108 13 1,69916 21:00 - 22:00 74 3 336 1 106 47 286 387 109 3 1,35017 22:00 - 23:00 49 4 245 1 54 31 214 298 117 3 1,01418 23:00 - 24:00 45 2 163 1 32 17 152 214 111 1 73719 00:00 - 01:00 12 1 117 1 16 10 104 137 108 1 50620 01:00 - 02:00 16 2 84 0 5 11 71 86 118 2 39221 02:00 - 03:00 6 3 88 1 3 13 55 85 86 0 33822 03:00 - 04:00 6 5 106 2 10 14 62 84 97 0 38523 04:00 - 05:00 22 3 211 4 57 23 98 174 131 6 72724 05:00 - 06:00 49 4 295 1 102 39 189 351 123 9 1,160
16 hours Total 1,769 106 7,053 48 1,907 554 6,501 7,390 1,690 135 27,15124 hours Total 1,973 128 8,360 58 2,185 709 7,444 8,818 2,579 155 32,407
24 hours/16hours (Real Result) 1.11532 1.20853 1.18531 1.19792 1.14552 1.28094 1.14507 1.19323 1.52619 1.15242
24 hours/16hours (Estimated)
24 hours Total 1,973 128 8,360 58 2,185 709 7,444 8,818 2,579 155 32,4077:00-9:00 Ratio 13.9% 6.3% 13.4% 5.2% 10.1% 10.5% 10.3% 9.5% 6.5% 8.4% 10.8%
Average Occupancy (without Tricycle) 1.25 0.00 7.88 18.60 30.37 2.27 1.62 3.07 2.27 1.03
(UNIT: PCU) without Tricycle
Survey Hour Public Vehicle
Private Vehicle
Truck & Others
Total PCU
06:00 - 07:00 1,005 990 197 2,19207:00 - 08:00 1,147 1,098 165 2,41008:00 - 09:00 982 1,121 266 2,36909:00 - 10:00 975 1,355 338 2,66810:00 - 11:00 984 1,476 354 2,81411:00 - 12:00 894 1,206 375 2,47512:00 - 13:00 838 1,210 397 2,44513:00 - 14:00 829 1,204 328 2,36114:00 - 15:00 939 1,429 301 2,66915:00 - 16:00 789 1,171 312 2,27216:00 - 17:00 754 1,116 244 2,11417:00 - 18:00 935 1,217 218 2,37018:00 - 19:00 713 998 159 1,87019:00 - 20:00 1,068 1,180 150 2,39820:00 - 21:00 899 1,217 282 2,39821:00 - 22:00 717 958 274 1,94922:00 - 23:00 476 722 294 1,49223:00 - 24:00 310 512 278 1,10000:00 - 01:00 209 326 271 80601:00 - 02:00 134 220 297 65102:00 - 03:00 139 202 214 55503:00 - 04:00 181 210 243 63404:00 - 05:00 435 400 332 1,16705:00 - 06:00 646 787 315 1,748
Public Vehicle
Private Vehicle
Truck & Others Total
Estimated 24 hours PCU 16,995 22,326 6,601 45,922
Estimated 24 hours Person
Trips133,267 43,225 6,007 182,499
PT/PCU 7.842 1.936 0.910 3.974
Average Daily PCU (Bothway)
0
500
1,000
1,500
2,000
2,500
3,000
06:0
0 - 0
7:00
08:0
0 - 0
9:00
10:0
0 - 1
1:00
12:0
0 - 1
3:00
14:0
0 - 1
5:00
16:0
0 - 1
7:00
18:0
0 - 1
9:00
20:0
0 - 2
1:00
22:0
0 - 2
3:00
00:0
0 - 0
1:00
02:0
0 - 0
3:00
04:0
0 - 0
5:00
Truck & OthersPrivate VehiclePublic Vehicle
106
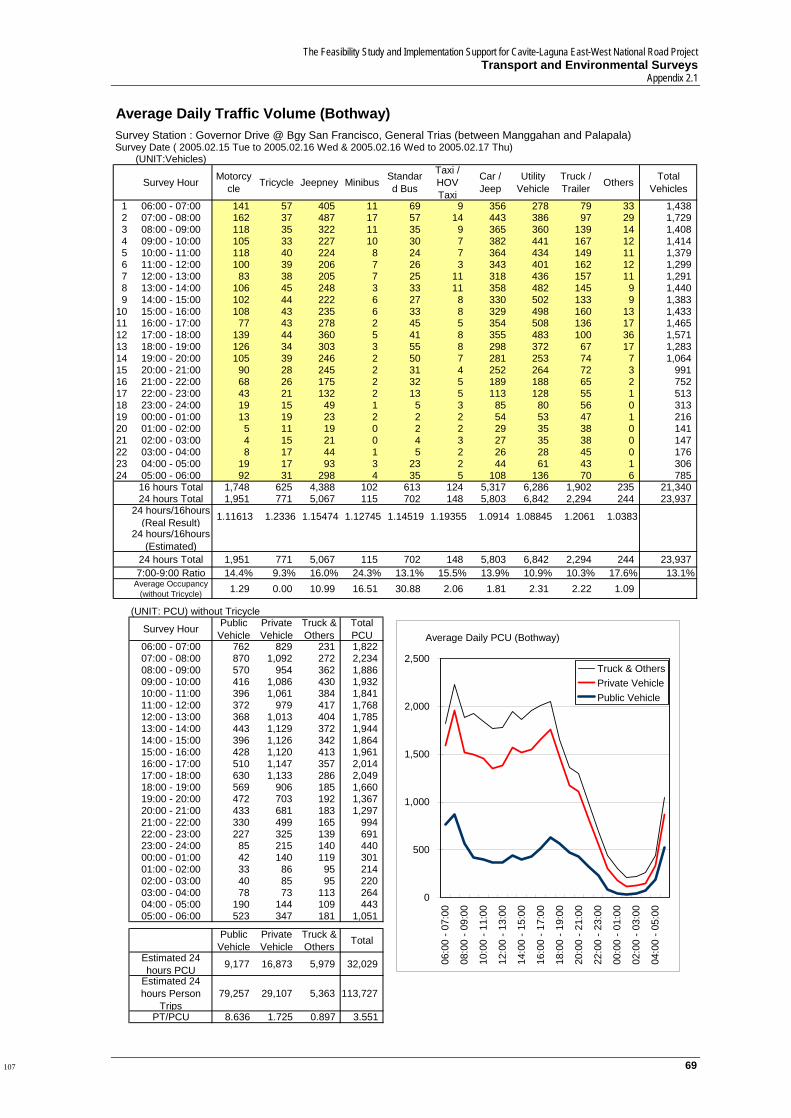
The Feasibility Study and Implementation Support for Cavite-Laguna East-West National Road Project Transport and Environmental Surveys
Appendix 2.1
69
Average Daily Traffic Volume (Bothway)Survey Station : Governor Drive @ Bgy San Francisco, General Trias (between Manggahan and Palapala)Survey Date ( 2005.02.15 Tue to 2005.02.16 Wed & 2005.02.16 Wed to 2005.02.17 Thu)
(UNIT:Vehicles)
Survey Hour Motorcycle Tricycle Jeepney Minibus Standar
d Bus
Taxi /HOV Taxi
Car / Jeep
Utility Vehicle
Truck / Trailer Others Total
Vehicles
1 06:00 - 07:00 141 57 405 11 69 9 356 278 79 33 1,4382 07:00 - 08:00 162 37 487 17 57 14 443 386 97 29 1,7293 08:00 - 09:00 118 35 322 11 35 9 365 360 139 14 1,4084 09:00 - 10:00 105 33 227 10 30 7 382 441 167 12 1,4145 10:00 - 11:00 118 40 224 8 24 7 364 434 149 11 1,3796 11:00 - 12:00 100 39 206 7 26 3 343 401 162 12 1,2997 12:00 - 13:00 83 38 205 7 25 11 318 436 157 11 1,2918 13:00 - 14:00 106 45 248 3 33 11 358 482 145 9 1,4409 14:00 - 15:00 102 44 222 6 27 8 330 502 133 9 1,383
10 15:00 - 16:00 108 43 235 6 33 8 329 498 160 13 1,43311 16:00 - 17:00 77 43 278 2 45 5 354 508 136 17 1,46512 17:00 - 18:00 139 44 360 5 41 8 355 483 100 36 1,57113 18:00 - 19:00 126 34 303 3 55 8 298 372 67 17 1,28314 19:00 - 20:00 105 39 246 2 50 7 281 253 74 7 1,06415 20:00 - 21:00 90 28 245 2 31 4 252 264 72 3 99116 21:00 - 22:00 68 26 175 2 32 5 189 188 65 2 75217 22:00 - 23:00 43 21 132 2 13 5 113 128 55 1 51318 23:00 - 24:00 19 15 49 1 5 3 85 80 56 0 31319 00:00 - 01:00 13 19 23 2 2 2 54 53 47 1 21620 01:00 - 02:00 5 11 19 0 2 2 29 35 38 0 14121 02:00 - 03:00 4 15 21 0 4 3 27 35 38 0 14722 03:00 - 04:00 8 17 44 1 5 2 26 28 45 0 17623 04:00 - 05:00 19 17 93 3 23 2 44 61 43 1 30624 05:00 - 06:00 92 31 298 4 35 5 108 136 70 6 785
16 hours Total 1,748 625 4,388 102 613 124 5,317 6,286 1,902 235 21,34024 hours Total 1,951 771 5,067 115 702 148 5,803 6,842 2,294 244 23,937
24 hours/16hours (Real Result) 1.11613 1.2336 1.15474 1.12745 1.14519 1.19355 1.0914 1.08845 1.2061 1.0383
24 hours/16hours (Estimated)
24 hours Total 1,951 771 5,067 115 702 148 5,803 6,842 2,294 244 23,9377:00-9:00 Ratio 14.4% 9.3% 16.0% 24.3% 13.1% 15.5% 13.9% 10.9% 10.3% 17.6% 13.1%
Average Occupancy (without Tricycle) 1.29 0.00 10.99 16.51 30.88 2.06 1.81 2.31 2.22 1.09
(UNIT: PCU) without Tricycle
Survey Hour Public Vehicle
Private Vehicle
Truck & Others
Total PCU
06:00 - 07:00 762 829 231 1,82207:00 - 08:00 870 1,092 272 2,23408:00 - 09:00 570 954 362 1,88609:00 - 10:00 416 1,086 430 1,93210:00 - 11:00 396 1,061 384 1,84111:00 - 12:00 372 979 417 1,76812:00 - 13:00 368 1,013 404 1,78513:00 - 14:00 443 1,129 372 1,94414:00 - 15:00 396 1,126 342 1,86415:00 - 16:00 428 1,120 413 1,96116:00 - 17:00 510 1,147 357 2,01417:00 - 18:00 630 1,133 286 2,04918:00 - 19:00 569 906 185 1,66019:00 - 20:00 472 703 192 1,36720:00 - 21:00 433 681 183 1,29721:00 - 22:00 330 499 165 99422:00 - 23:00 227 325 139 69123:00 - 24:00 85 215 140 44000:00 - 01:00 42 140 119 30101:00 - 02:00 33 86 95 21402:00 - 03:00 40 85 95 22003:00 - 04:00 78 73 113 26404:00 - 05:00 190 144 109 44305:00 - 06:00 523 347 181 1,051
Public Vehicle
Private Vehicle
Truck & Others Total
Estimated 24 hours PCU 9,177 16,873 5,979 32,029
Estimated 24 hours Person
Trips79,257 29,107 5,363 113,727
PT/PCU 8.636 1.725 0.897 3.551
Average Daily PCU (Bothway)
0
500
1,000
1,500
2,000
2,500
06:0
0 - 0
7:00
08:0
0 - 0
9:00
10:0
0 - 1
1:00
12:0
0 - 1
3:00
14:0
0 - 1
5:00
16:0
0 - 1
7:00
18:0
0 - 1
9:00
20:0
0 - 2
1:00
22:0
0 - 2
3:00
00:0
0 - 0
1:00
02:0
0 - 0
3:00
04:0
0 - 0
5:00
Truck & OthersPrivate VehiclePublic Vehicle
107

The Feasibility Study and Implementation Support for the Cavite-Laguna East-West National Road Project Transport and Environmental Surveys Appendix 2.1
70
Average Daily Traffic Volume (Bothway)Survey Station : Governor Drive @ Bgy Paliparan, Dasmarinas (between Molino Rd and Gen Mariano Alvarez)Survey Date ( 2005.02.15 Tue to 2005.02.16 Wed & 2005.02.16 Wed to 2005.02.17 Thu)
(UNIT:Vehicles)
Survey Hour Motorcycle Tricycle Jeepney Minibus Standar
d Bus
Taxi /HOV Taxi
Car / Jeep
Utility Vehicle
Truck / Trailer Others Total
Vehicles
1 06:00 - 07:00 136 653 304 4 23 14 290 400 98 45 1,9662 07:00 - 08:00 164 416 263 5 26 21 414 592 106 55 2,0593 08:00 - 09:00 132 232 214 1 15 28 364 584 164 46 1,7774 09:00 - 10:00 123 174 174 1 14 15 390 681 209 26 1,8065 10:00 - 11:00 101 144 153 1 3 13 348 664 232 26 1,6836 11:00 - 12:00 100 124 130 1 2 19 315 604 202 28 1,5227 12:00 - 13:00 92 169 134 1 7 20 301 588 187 22 1,5188 13:00 - 14:00 108 163 145 3 3 13 317 639 180 16 1,5869 14:00 - 15:00 81 138 144 2 4 17 302 737 197 17 1,637
10 15:00 - 16:00 97 159 147 1 7 19 311 711 189 27 1,66611 16:00 - 17:00 110 158 190 3 18 16 391 659 185 34 1,75912 17:00 - 18:00 141 204 246 2 23 19 398 696 141 75 1,94313 18:00 - 19:00 163 208 260 6 24 12 385 540 122 41 1,75714 19:00 - 20:00 122 129 211 1 42 9 331 373 115 15 1,34615 20:00 - 21:00 101 285 176 3 22 9 196 326 99 14 1,22816 21:00 - 22:00 63 125 129 3 17 9 167 230 97 10 84917 22:00 - 23:00 52 46 86 2 8 9 109 163 86 4 56318 23:00 - 24:00 28 28 51 1 3 4 77 102 60 2 35319 00:00 - 01:00 13 31 26 0 0 2 35 47 46 1 19920 01:00 - 02:00 7 19 19 0 1 5 26 32 45 0 15221 02:00 - 03:00 7 23 15 0 1 3 15 34 35 0 13222 03:00 - 04:00 13 18 18 0 2 2 17 30 45 0 14423 04:00 - 05:00 31 56 80 1 15 7 38 81 59 1 36624 05:00 - 06:00 89 158 145 3 25 11 110 188 93 24 843
16 hours Total 1,832 3,478 3,015 33 248 248 5,216 9,020 2,518 494 26,09924 hours Total 2,070 3,854 3,454 38 301 289 5,641 9,696 2,986 524 28,850
24 hours/16hours (Real Result) 1.13022 1.10827 1.14561 1.16923 1.21414 1.16331 1.08149 1.07489 1.1859 1.05972
24 hours/16hours (Estimated)
24 hours Total 2,070 3,854 3,454 38 301 289 5,641 9,696 2,986 524 28,8507:00-9:00 Ratio 14.3% 16.8% 13.8% 13.2% 13.5% 16.8% 13.8% 12.1% 9.0% 19.1% 13.3%
Average Occupancy (without Tricycle) 1.33 0.00 11.83 14.03 17.65 2.65 1.86 3.38 2.09 1.04
(UNIT: PCU) without Tricycle
Survey Hour Public Vehicle
Private Vehicle
Truck & Others
Total PCU
06:00 - 07:00 507 951 290 1,74807:00 - 08:00 453 1,381 318 2,15208:00 - 09:00 350 1,321 454 2,12509:00 - 10:00 291 1,469 547 2,30710:00 - 11:00 235 1,393 604 2,23211:00 - 12:00 199 1,278 532 2,00912:00 - 13:00 216 1,239 488 1,94313:00 - 14:00 227 1,327 465 2,01914:00 - 15:00 226 1,456 510 2,19215:00 - 16:00 235 1,433 500 2,16816:00 - 17:00 323 1,434 495 2,25217:00 - 18:00 417 1,513 426 2,35618:00 - 19:00 445 1,260 345 2,05019:00 - 20:00 400 939 303 1,64220:00 - 21:00 313 727 260 1,30021:00 - 22:00 231 544 253 1,02822:00 - 23:00 147 382 217 74623:00 - 24:00 82 243 152 47700:00 - 01:00 39 112 116 26701:00 - 02:00 30 82 113 22502:00 - 03:00 24 72 88 18403:00 - 04:00 31 68 113 21204:00 - 05:00 151 178 147 47605:00 - 06:00 270 434 256 960
Public Vehicle
Private Vehicle
Truck & Others Total
Estimated 24 hours PCU 5,839 21,238 7,987 35,064
Estimated 24 hours Person
Trips46,684 46,764 6,788 100,236
PT/PCU 7.995 2.202 0.850 2.859
Average Daily PCU (Bothway)
0
500
1,000
1,500
2,000
2,500
06:0
0 - 0
7:00
08:0
0 - 0
9:00
10:0
0 - 1
1:00
12:0
0 - 1
3:00
14:0
0 - 1
5:00
16:0
0 - 1
7:00
18:0
0 - 1
9:00
20:0
0 - 2
1:00
22:0
0 - 2
3:00
00:0
0 - 0
1:00
02:0
0 - 0
3:00
04:0
0 - 0
5:00
Truck & OthersPrivate VehiclePublic Vehicle
108
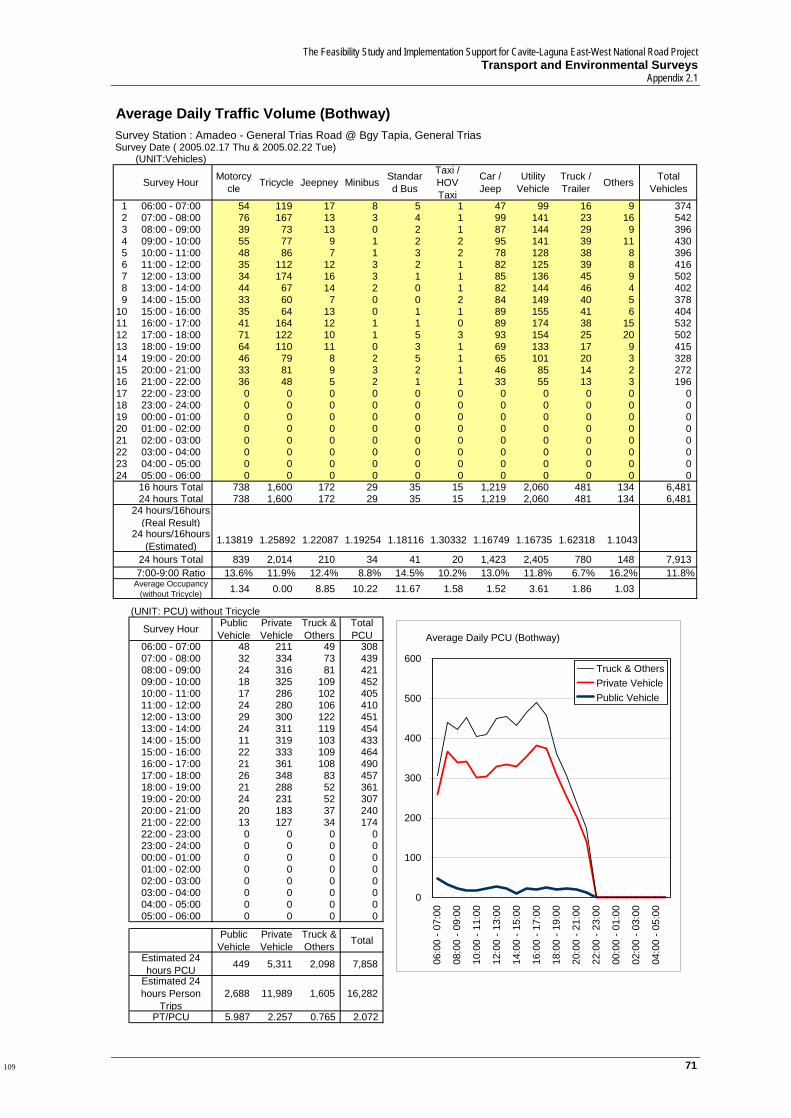
The Feasibility Study and Implementation Support for Cavite-Laguna East-West National Road Project Transport and Environmental Surveys
Appendix 2.1
71
Average Daily Traffic Volume (Bothway)Survey Station : Amadeo - General Trias Road @ Bgy Tapia, General TriasSurvey Date ( 2005.02.17 Thu & 2005.02.22 Tue)
(UNIT:Vehicles)
Survey Hour Motorcycle Tricycle Jeepney Minibus Standar
d Bus
Taxi /HOV Taxi
Car / Jeep
Utility Vehicle
Truck / Trailer Others Total
Vehicles
1 06:00 - 07:00 54 119 17 8 5 1 47 99 16 9 3742 07:00 - 08:00 76 167 13 3 4 1 99 141 23 16 5423 08:00 - 09:00 39 73 13 0 2 1 87 144 29 9 3964 09:00 - 10:00 55 77 9 1 2 2 95 141 39 11 4305 10:00 - 11:00 48 86 7 1 3 2 78 128 38 8 3966 11:00 - 12:00 35 112 12 3 2 1 82 125 39 8 4167 12:00 - 13:00 34 174 16 3 1 1 85 136 45 9 5028 13:00 - 14:00 44 67 14 2 0 1 82 144 46 4 4029 14:00 - 15:00 33 60 7 0 0 2 84 149 40 5 378
10 15:00 - 16:00 35 64 13 0 1 1 89 155 41 6 40411 16:00 - 17:00 41 164 12 1 1 0 89 174 38 15 53212 17:00 - 18:00 71 122 10 1 5 3 93 154 25 20 50213 18:00 - 19:00 64 110 11 0 3 1 69 133 17 9 41514 19:00 - 20:00 46 79 8 2 5 1 65 101 20 3 32815 20:00 - 21:00 33 81 9 3 2 1 46 85 14 2 27216 21:00 - 22:00 36 48 5 2 1 1 33 55 13 3 19617 22:00 - 23:00 0 0 0 0 0 0 0 0 0 0 018 23:00 - 24:00 0 0 0 0 0 0 0 0 0 0 019 00:00 - 01:00 0 0 0 0 0 0 0 0 0 0 020 01:00 - 02:00 0 0 0 0 0 0 0 0 0 0 021 02:00 - 03:00 0 0 0 0 0 0 0 0 0 0 022 03:00 - 04:00 0 0 0 0 0 0 0 0 0 0 023 04:00 - 05:00 0 0 0 0 0 0 0 0 0 0 024 05:00 - 06:00 0 0 0 0 0 0 0 0 0 0 0
16 hours Total 738 1,600 172 29 35 15 1,219 2,060 481 134 6,48124 hours Total 738 1,600 172 29 35 15 1,219 2,060 481 134 6,481
24 hours/16hours (Real Result)
24 hours/16hours (Estimated) 1.13819 1.25892 1.22087 1.19254 1.18116 1.30332 1.16749 1.16735 1.62318 1.1043
24 hours Total 839 2,014 210 34 41 20 1,423 2,405 780 148 7,9137:00-9:00 Ratio 13.6% 11.9% 12.4% 8.8% 14.5% 10.2% 13.0% 11.8% 6.7% 16.2% 11.8%
Average Occupancy (without Tricycle) 1.34 0.00 8.85 10.22 11.67 1.58 1.52 3.61 1.86 1.03
(UNIT: PCU) without Tricycle
Survey Hour Public Vehicle
Private Vehicle
Truck & Others
Total PCU
06:00 - 07:00 48 211 49 30807:00 - 08:00 32 334 73 43908:00 - 09:00 24 316 81 42109:00 - 10:00 18 325 109 45210:00 - 11:00 17 286 102 40511:00 - 12:00 24 280 106 41012:00 - 13:00 29 300 122 45113:00 - 14:00 24 311 119 45414:00 - 15:00 11 319 103 43315:00 - 16:00 22 333 109 46416:00 - 17:00 21 361 108 49017:00 - 18:00 26 348 83 45718:00 - 19:00 21 288 52 36119:00 - 20:00 24 231 52 30720:00 - 21:00 20 183 37 24021:00 - 22:00 13 127 34 17422:00 - 23:00 0 0 0 023:00 - 24:00 0 0 0 000:00 - 01:00 0 0 0 001:00 - 02:00 0 0 0 002:00 - 03:00 0 0 0 003:00 - 04:00 0 0 0 004:00 - 05:00 0 0 0 005:00 - 06:00 0 0 0 0
Public Vehicle
Private Vehicle
Truck & Others Total
Estimated 24 hours PCU 449 5,311 2,098 7,858
Estimated 24 hours Person
Trips2,688 11,989 1,605 16,282
PT/PCU 5.987 2.257 0.765 2.072
Average Daily PCU (Bothway)
0
100
200
300
400
500
600
06:0
0 - 0
7:00
08:0
0 - 0
9:00
10:0
0 - 1
1:00
12:0
0 - 1
3:00
14:0
0 - 1
5:00
16:0
0 - 1
7:00
18:0
0 - 1
9:00
20:0
0 - 2
1:00
22:0
0 - 2
3:00
00:0
0 - 0
1:00
02:0
0 - 0
3:00
04:0
0 - 0
5:00
Truck & OthersPrivate VehiclePublic Vehicle
109

The Feasibility Study and Implementation Support for the Cavite-Laguna East-West National Road Project Transport and Environmental Surveys Appendix 2.1
72
Average Daily Traffic Volume (Bothway)Survey Station : Aguinaldo Highway @ Bgy Zapote II, Bacoor (boundary of Bacoor and Las Pinas)Survey Date ( 2005.02.17 Thu to 2005.02.18 Fri & 2005.02.22 Tue to 2005.02.23 Wed)
(UNIT:Vehicles)
Survey Hour Motorcycle Tricycle Jeepney Minibus Standar
d Bus
Taxi /HOV Taxi
Car / Jeep
Utility Vehicle
Truck / Trailer Others Total
Vehicles
1 06:00 - 07:00 241 154 533 92 2 20 120 175 16 213 1,5642 07:00 - 08:00 383 137 543 109 8 29 155 200 20 316 1,8973 08:00 - 09:00 273 82 578 121 2 27 140 186 24 211 1,6404 09:00 - 10:00 225 90 540 131 3 41 159 216 36 188 1,6275 10:00 - 11:00 217 59 521 110 2 25 154 248 41 170 1,5456 11:00 - 12:00 196 65 537 110 2 26 159 189 41 133 1,4567 12:00 - 13:00 203 66 570 107 4 31 159 217 44 98 1,4978 13:00 - 14:00 216 43 570 93 2 29 156 233 48 90 1,4779 14:00 - 15:00 220 50 591 99 3 32 182 251 44 103 1,574
10 15:00 - 16:00 231 54 626 109 5 42 155 223 41 116 1,59911 16:00 - 17:00 295 40 589 90 3 40 178 224 37 185 1,67712 17:00 - 18:00 326 56 469 84 3 47 197 226 40 273 1,71913 18:00 - 19:00 294 31 438 76 3 42 212 227 30 170 1,52014 19:00 - 20:00 190 37 409 60 3 62 172 224 18 105 1,27615 20:00 - 21:00 203 31 438 66 6 56 180 172 25 76 1,25216 21:00 - 22:00 157 36 450 72 3 67 161 179 51 56 1,23017 22:00 - 23:00 175 15 424 58 3 58 206 161 94 49 1,24118 23:00 - 24:00 97 16 344 33 6 60 138 137 122 28 98019 00:00 - 01:00 67 28 249 16 1 67 104 106 96 13 74620 01:00 - 02:00 57 31 201 8 2 50 58 72 113 11 59921 02:00 - 03:00 38 43 224 13 0 49 71 78 86 19 62022 03:00 - 04:00 39 66 288 16 1 41 57 69 68 41 68323 04:00 - 05:00 66 139 377 36 4 28 57 55 49 73 88224 05:00 - 06:00 128 151 446 65 2 21 56 61 20 118 1,066
16 hours Total 3,866 1,027 8,398 1,525 50 613 2,635 3,385 553 2,498 24,54724 hours Total 4,531 1,514 10,950 1,768 67 985 3,380 4,122 1,198 2,849 31,361
24 hours/16hours (Real Result) 1.17216 1.47371 1.3039 1.15934 1.34343 1.60735 1.28273 1.21776 2.16833 1.14031
24 hours/16hours (Estimated)
24 hours Total 4,531 1,514 10,950 1,768 67 985 3,380 4,122 1,198 2,849 31,3617:00-9:00 Ratio 14.5% 14.4% 10.2% 13.0% 14.3% 5.6% 8.7% 9.3% 3.6% 18.5% 11.3%
Average Occupancy (without Tricycle) 1.38 0.00 7.32 7.11 23.39 2.47 1.92 3.25 2.27 1.03
(UNIT: PCU) without Tricycle
Survey Hour Public Vehicle
Private Vehicle
Truck & Others
Total PCU
06:00 - 07:00 942 483 253 1,67807:00 - 08:00 993 612 364 1,96908:00 - 09:00 1,050 540 270 1,86009:00 - 10:00 1,011 612 278 1,90110:00 - 11:00 949 628 272 1,84911:00 - 12:00 972 540 235 1,74712:00 - 13:00 1,022 590 208 1,82013:00 - 14:00 997 613 210 1,82014:00 - 15:00 1,041 672 213 1,92615:00 - 16:00 1,111 620 217 1,94816:00 - 17:00 1,022 661 276 1,95917:00 - 18:00 835 704 373 1,91218:00 - 19:00 775 702 243 1,72019:00 - 20:00 708 656 149 1,51320:00 - 21:00 768 582 137 1,48721:00 - 22:00 788 576 184 1,54822:00 - 23:00 728 585 283 1,59623:00 - 24:00 578 461 333 1,37200:00 - 01:00 399 384 252 1,03501:00 - 02:00 315 257 292 86402:00 - 03:00 355 273 232 86003:00 - 04:00 457 232 210 89904:00 - 05:00 626 201 196 1,02305:00 - 06:00 770 216 168 1,154
Public Vehicle
Private Vehicle
Truck & Others Total
Estimated 24 hours PCU 19,209 12,398 5,844 37,451
Estimated 24 hours Person
Trips94,278 28,551 5,667 128,496
PT/PCU 4.908 2.303 0.970 3.431
Average Daily PCU (Bothway)
0
500
1,000
1,500
2,000
2,500
06:0
0 - 0
7:00
08:0
0 - 0
9:00
10:0
0 - 1
1:00
12:0
0 - 1
3:00
14:0
0 - 1
5:00
16:0
0 - 1
7:00
18:0
0 - 1
9:00
20:0
0 - 2
1:00
22:0
0 - 2
3:00
00:0
0 - 0
1:00
02:0
0 - 0
3:00
04:0
0 - 0
5:00
Truck & OthersPrivate VehiclePublic Vehicle
110
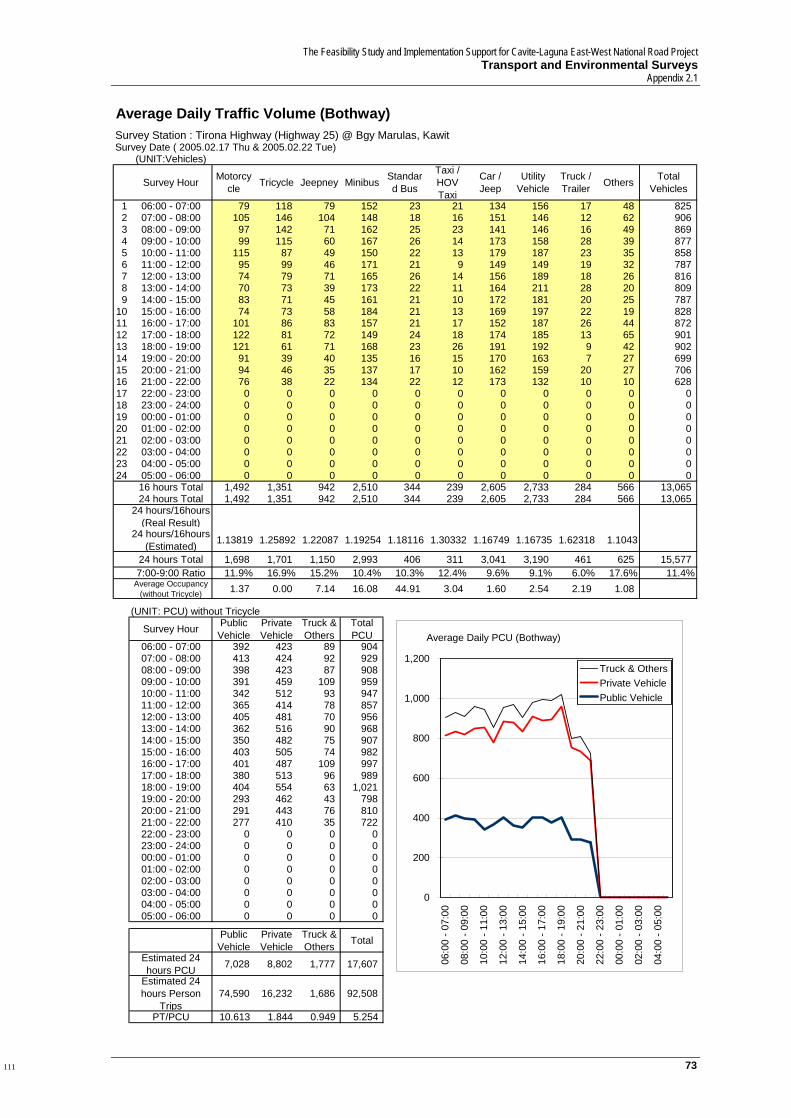
The Feasibility Study and Implementation Support for Cavite-Laguna East-West National Road Project Transport and Environmental Surveys
Appendix 2.1
73
Average Daily Traffic Volume (Bothway)Survey Station : Tirona Highway (Highway 25) @ Bgy Marulas, KawitSurvey Date ( 2005.02.17 Thu & 2005.02.22 Tue)
(UNIT:Vehicles)
Survey Hour Motorcycle Tricycle Jeepney Minibus Standar
d Bus
Taxi /HOV Taxi
Car / Jeep
Utility Vehicle
Truck / Trailer Others Total
Vehicles
1 06:00 - 07:00 79 118 79 152 23 21 134 156 17 48 8252 07:00 - 08:00 105 146 104 148 18 16 151 146 12 62 9063 08:00 - 09:00 97 142 71 162 25 23 141 146 16 49 8694 09:00 - 10:00 99 115 60 167 26 14 173 158 28 39 8775 10:00 - 11:00 115 87 49 150 22 13 179 187 23 35 8586 11:00 - 12:00 95 99 46 171 21 9 149 149 19 32 7877 12:00 - 13:00 74 79 71 165 26 14 156 189 18 26 8168 13:00 - 14:00 70 73 39 173 22 11 164 211 28 20 8099 14:00 - 15:00 83 71 45 161 21 10 172 181 20 25 787
10 15:00 - 16:00 74 73 58 184 21 13 169 197 22 19 82811 16:00 - 17:00 101 86 83 157 21 17 152 187 26 44 87212 17:00 - 18:00 122 81 72 149 24 18 174 185 13 65 90113 18:00 - 19:00 121 61 71 168 23 26 191 192 9 42 90214 19:00 - 20:00 91 39 40 135 16 15 170 163 7 27 69915 20:00 - 21:00 94 46 35 137 17 10 162 159 20 27 70616 21:00 - 22:00 76 38 22 134 22 12 173 132 10 10 62817 22:00 - 23:00 0 0 0 0 0 0 0 0 0 0 018 23:00 - 24:00 0 0 0 0 0 0 0 0 0 0 019 00:00 - 01:00 0 0 0 0 0 0 0 0 0 0 020 01:00 - 02:00 0 0 0 0 0 0 0 0 0 0 021 02:00 - 03:00 0 0 0 0 0 0 0 0 0 0 022 03:00 - 04:00 0 0 0 0 0 0 0 0 0 0 023 04:00 - 05:00 0 0 0 0 0 0 0 0 0 0 024 05:00 - 06:00 0 0 0 0 0 0 0 0 0 0 0
16 hours Total 1,492 1,351 942 2,510 344 239 2,605 2,733 284 566 13,06524 hours Total 1,492 1,351 942 2,510 344 239 2,605 2,733 284 566 13,065
24 hours/16hours (Real Result)
24 hours/16hours (Estimated) 1.13819 1.25892 1.22087 1.19254 1.18116 1.30332 1.16749 1.16735 1.62318 1.1043
24 hours Total 1,698 1,701 1,150 2,993 406 311 3,041 3,190 461 625 15,5777:00-9:00 Ratio 11.9% 16.9% 15.2% 10.4% 10.3% 12.4% 9.6% 9.1% 6.0% 17.6% 11.4%
Average Occupancy (without Tricycle) 1.37 0.00 7.14 16.08 44.91 3.04 1.60 2.54 2.19 1.08
(UNIT: PCU) without Tricycle
Survey Hour Public Vehicle
Private Vehicle
Truck & Others
Total PCU
06:00 - 07:00 392 423 89 90407:00 - 08:00 413 424 92 92908:00 - 09:00 398 423 87 90809:00 - 10:00 391 459 109 95910:00 - 11:00 342 512 93 94711:00 - 12:00 365 414 78 85712:00 - 13:00 405 481 70 95613:00 - 14:00 362 516 90 96814:00 - 15:00 350 482 75 90715:00 - 16:00 403 505 74 98216:00 - 17:00 401 487 109 99717:00 - 18:00 380 513 96 98918:00 - 19:00 404 554 63 1,02119:00 - 20:00 293 462 43 79820:00 - 21:00 291 443 76 81021:00 - 22:00 277 410 35 72222:00 - 23:00 0 0 0 023:00 - 24:00 0 0 0 000:00 - 01:00 0 0 0 001:00 - 02:00 0 0 0 002:00 - 03:00 0 0 0 003:00 - 04:00 0 0 0 004:00 - 05:00 0 0 0 005:00 - 06:00 0 0 0 0
Public Vehicle
Private Vehicle
Truck & Others Total
Estimated 24 hours PCU 7,028 8,802 1,777 17,607
Estimated 24 hours Person
Trips74,590 16,232 1,686 92,508
PT/PCU 10.613 1.844 0.949 5.254
Average Daily PCU (Bothway)
0
200
400
600
800
1,000
1,200
06:0
0 - 0
7:00
08:0
0 - 0
9:00
10:0
0 - 1
1:00
12:0
0 - 1
3:00
14:0
0 - 1
5:00
16:0
0 - 1
7:00
18:0
0 - 1
9:00
20:0
0 - 2
1:00
22:0
0 - 2
3:00
00:0
0 - 0
1:00
02:0
0 - 0
3:00
04:0
0 - 0
5:00
Truck & OthersPrivate VehiclePublic Vehicle
111

The Feasibility Study and Implementation Support for the Cavite-Laguna East-West National Road Project Transport and Environmental Surveys Appendix 2.1
74
Average Daily Traffic Volume (Bothway)Survey Station : Molino Road @ Bgy Molino IV, Bacoor (boundary of Bacoor and Dasmarinas)Survey Date ( 2005.02.17 Thu & 2005.02.22 Tue)
(UNIT:Vehicles)
Survey Hour Motorcycle Tricycle Jeepney Minibus Standar
d Bus
Taxi /HOV Taxi
Car / Jeep
Utility Vehicle
Truck / Trailer Others Total
Vehicles
1 06:00 - 07:00 123 50 174 0 1 31 168 219 24 52 8412 07:00 - 08:00 292 67 356 0 7 57 369 527 63 89 1,8253 08:00 - 09:00 210 54 341 2 6 56 320 506 75 56 1,6234 09:00 - 10:00 151 77 279 2 1 59 308 520 94 33 1,5225 10:00 - 11:00 138 84 292 0 1 83 275 525 99 30 1,5256 11:00 - 12:00 119 102 291 1 1 53 250 457 97 15 1,3847 12:00 - 13:00 104 85 271 3 1 64 243 458 96 21 1,3458 13:00 - 14:00 116 49 270 1 0 62 259 518 101 21 1,3959 14:00 - 15:00 118 64 256 1 1 66 273 436 104 23 1,339
10 15:00 - 16:00 111 61 269 1 0 72 294 489 98 16 1,40911 16:00 - 17:00 139 61 308 2 0 85 321 515 75 31 1,53512 17:00 - 18:00 202 71 311 1 3 80 400 583 74 92 1,81613 18:00 - 19:00 228 51 311 2 7 69 360 566 49 49 1,69014 19:00 - 20:00 181 34 292 1 1 65 327 593 37 19 1,54815 20:00 - 21:00 169 36 288 1 3 62 250 464 39 16 1,32616 21:00 - 22:00 105 38 201 1 1 56 250 359 31 7 1,04617 22:00 - 23:00 0 0 0 0 0 0 0 0 0 0 018 23:00 - 24:00 0 0 0 0 0 0 0 0 0 0 019 00:00 - 01:00 0 0 0 0 0 0 0 0 0 0 020 01:00 - 02:00 0 0 0 0 0 0 0 0 0 0 021 02:00 - 03:00 0 0 0 0 0 0 0 0 0 0 022 03:00 - 04:00 0 0 0 0 0 0 0 0 0 0 023 04:00 - 05:00 0 0 0 0 0 0 0 0 0 0 024 05:00 - 06:00 0 0 0 0 0 0 0 0 0 0 0
16 hours Total 2,501 981 4,506 16 30 1,017 4,663 7,731 1,153 567 23,16424 hours Total 2,501 981 4,506 16 30 1,017 4,663 7,731 1,153 567 23,164
24 hours/16hours (Real Result)
24 hours/16hours (Estimated) 1.13819 1.25892 1.22087 1.19254 1.18116 1.30332 1.16749 1.16735 1.62318 1.1043
24 hours Total 2,847 1,235 5,501 19 35 1,325 5,443 9,025 1,871 626 27,9287:00-9:00 Ratio 17.6% 9.8% 12.7% 7.9% 33.9% 8.5% 12.6% 11.4% 7.4% 23.0% 12.3%
Average Occupancy (without Tricycle) 1.28 0.00 8.86 9.70 21.06 3.02 1.68 2.36 2.32 1.02
(UNIT: PCU) without Tricycle
Survey Hour Public Vehicle
Private Vehicle
Truck & Others
Total PCU
06:00 - 07:00 262 579 112 95307:00 - 08:00 546 1,332 246 2,12408:00 - 09:00 524 1,224 243 1,99109:00 - 10:00 422 1,221 268 1,91110:00 - 11:00 439 1,228 276 1,94311:00 - 12:00 439 1,049 258 1,74612:00 - 13:00 411 1,057 261 1,72913:00 - 14:00 406 1,163 274 1,84314:00 - 15:00 386 1,059 283 1,72815:00 - 16:00 404 1,168 260 1,83216:00 - 17:00 464 1,261 219 1,94417:00 - 18:00 474 1,454 276 2,20418:00 - 19:00 484 1,380 170 2,03419:00 - 20:00 441 1,367 110 1,91820:00 - 21:00 438 1,090 112 1,64021:00 - 22:00 304 902 83 1,28922:00 - 23:00 0 0 0 023:00 - 24:00 0 0 0 000:00 - 01:00 0 0 0 001:00 - 02:00 0 0 0 002:00 - 03:00 0 0 0 003:00 - 04:00 0 0 0 004:00 - 05:00 0 0 0 005:00 - 06:00 0 0 0 0
Public Vehicle
Private Vehicle
Truck & Others Total
Estimated 24 hours PCU 8,351 21,823 5,303 35,477
Estimated 24 hours Person
Trips49,659 38,127 4,978 92,764
PT/PCU 5.946 1.747 0.939 2.615
Average Daily PCU (Bothway)
0
500
1,000
1,500
2,000
2,500
06:0
0 - 0
7:00
08:0
0 - 0
9:00
10:0
0 - 1
1:00
12:0
0 - 1
3:00
14:0
0 - 1
5:00
16:0
0 - 1
7:00
18:0
0 - 1
9:00
20:0
0 - 2
1:00
22:0
0 - 2
3:00
00:0
0 - 0
1:00
02:0
0 - 0
3:00
04:0
0 - 0
5:00
Truck & OthersPrivate VehiclePublic Vehicle
112
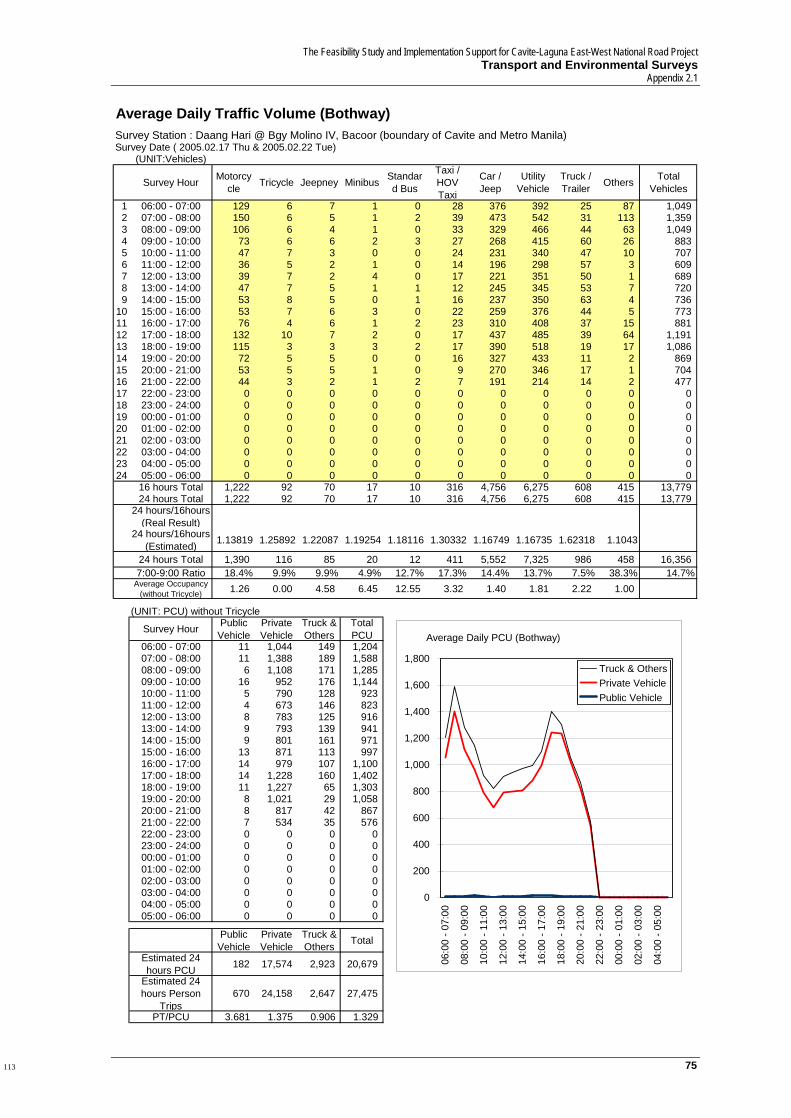
The Feasibility Study and Implementation Support for Cavite-Laguna East-West National Road Project Transport and Environmental Surveys
Appendix 2.1
75
Average Daily Traffic Volume (Bothway)Survey Station : Daang Hari @ Bgy Molino IV, Bacoor (boundary of Cavite and Metro Manila)Survey Date ( 2005.02.17 Thu & 2005.02.22 Tue)
(UNIT:Vehicles)
Survey Hour Motorcycle Tricycle Jeepney Minibus Standar
d Bus
Taxi /HOV Taxi
Car / Jeep
Utility Vehicle
Truck / Trailer Others Total
Vehicles
1 06:00 - 07:00 129 6 7 1 0 28 376 392 25 87 1,0492 07:00 - 08:00 150 6 5 1 2 39 473 542 31 113 1,3593 08:00 - 09:00 106 6 4 1 0 33 329 466 44 63 1,0494 09:00 - 10:00 73 6 6 2 3 27 268 415 60 26 8835 10:00 - 11:00 47 7 3 0 0 24 231 340 47 10 7076 11:00 - 12:00 36 5 2 1 0 14 196 298 57 3 6097 12:00 - 13:00 39 7 2 4 0 17 221 351 50 1 6898 13:00 - 14:00 47 7 5 1 1 12 245 345 53 7 7209 14:00 - 15:00 53 8 5 0 1 16 237 350 63 4 736
10 15:00 - 16:00 53 7 6 3 0 22 259 376 44 5 77311 16:00 - 17:00 76 4 6 1 2 23 310 408 37 15 88112 17:00 - 18:00 132 10 7 2 0 17 437 485 39 64 1,19113 18:00 - 19:00 115 3 3 3 2 17 390 518 19 17 1,08614 19:00 - 20:00 72 5 5 0 0 16 327 433 11 2 86915 20:00 - 21:00 53 5 5 1 0 9 270 346 17 1 70416 21:00 - 22:00 44 3 2 1 2 7 191 214 14 2 47717 22:00 - 23:00 0 0 0 0 0 0 0 0 0 0 018 23:00 - 24:00 0 0 0 0 0 0 0 0 0 0 019 00:00 - 01:00 0 0 0 0 0 0 0 0 0 0 020 01:00 - 02:00 0 0 0 0 0 0 0 0 0 0 021 02:00 - 03:00 0 0 0 0 0 0 0 0 0 0 022 03:00 - 04:00 0 0 0 0 0 0 0 0 0 0 023 04:00 - 05:00 0 0 0 0 0 0 0 0 0 0 024 05:00 - 06:00 0 0 0 0 0 0 0 0 0 0 0
16 hours Total 1,222 92 70 17 10 316 4,756 6,275 608 415 13,77924 hours Total 1,222 92 70 17 10 316 4,756 6,275 608 415 13,779
24 hours/16hours (Real Result)
24 hours/16hours (Estimated) 1.13819 1.25892 1.22087 1.19254 1.18116 1.30332 1.16749 1.16735 1.62318 1.1043
24 hours Total 1,390 116 85 20 12 411 5,552 7,325 986 458 16,3567:00-9:00 Ratio 18.4% 9.9% 9.9% 4.9% 12.7% 17.3% 14.4% 13.7% 7.5% 38.3% 14.7%
Average Occupancy (without Tricycle) 1.26 0.00 4.58 6.45 12.55 3.32 1.40 1.81 2.22 1.00
(UNIT: PCU) without Tricycle
Survey Hour Public Vehicle
Private Vehicle
Truck & Others
Total PCU
06:00 - 07:00 11 1,044 149 1,20407:00 - 08:00 11 1,388 189 1,58808:00 - 09:00 6 1,108 171 1,28509:00 - 10:00 16 952 176 1,14410:00 - 11:00 5 790 128 92311:00 - 12:00 4 673 146 82312:00 - 13:00 8 783 125 91613:00 - 14:00 9 793 139 94114:00 - 15:00 9 801 161 97115:00 - 16:00 13 871 113 99716:00 - 17:00 14 979 107 1,10017:00 - 18:00 14 1,228 160 1,40218:00 - 19:00 11 1,227 65 1,30319:00 - 20:00 8 1,021 29 1,05820:00 - 21:00 8 817 42 86721:00 - 22:00 7 534 35 57622:00 - 23:00 0 0 0 023:00 - 24:00 0 0 0 000:00 - 01:00 0 0 0 001:00 - 02:00 0 0 0 002:00 - 03:00 0 0 0 003:00 - 04:00 0 0 0 004:00 - 05:00 0 0 0 005:00 - 06:00 0 0 0 0
Public Vehicle
Private Vehicle
Truck & Others Total
Estimated 24 hours PCU 182 17,574 2,923 20,679
Estimated 24 hours Person
Trips670 24,158 2,647 27,475
PT/PCU 3.681 1.375 0.906 1.329
Average Daily PCU (Bothway)
0
200
400
600
800
1,000
1,200
1,400
1,600
1,800
06:0
0 - 0
7:00
08:0
0 - 0
9:00
10:0
0 - 1
1:00
12:0
0 - 1
3:00
14:0
0 - 1
5:00
16:0
0 - 1
7:00
18:0
0 - 1
9:00
20:0
0 - 2
1:00
22:0
0 - 2
3:00
00:0
0 - 0
1:00
02:0
0 - 0
3:00
04:0
0 - 0
5:00
Truck & OthersPrivate VehiclePublic Vehicle
113
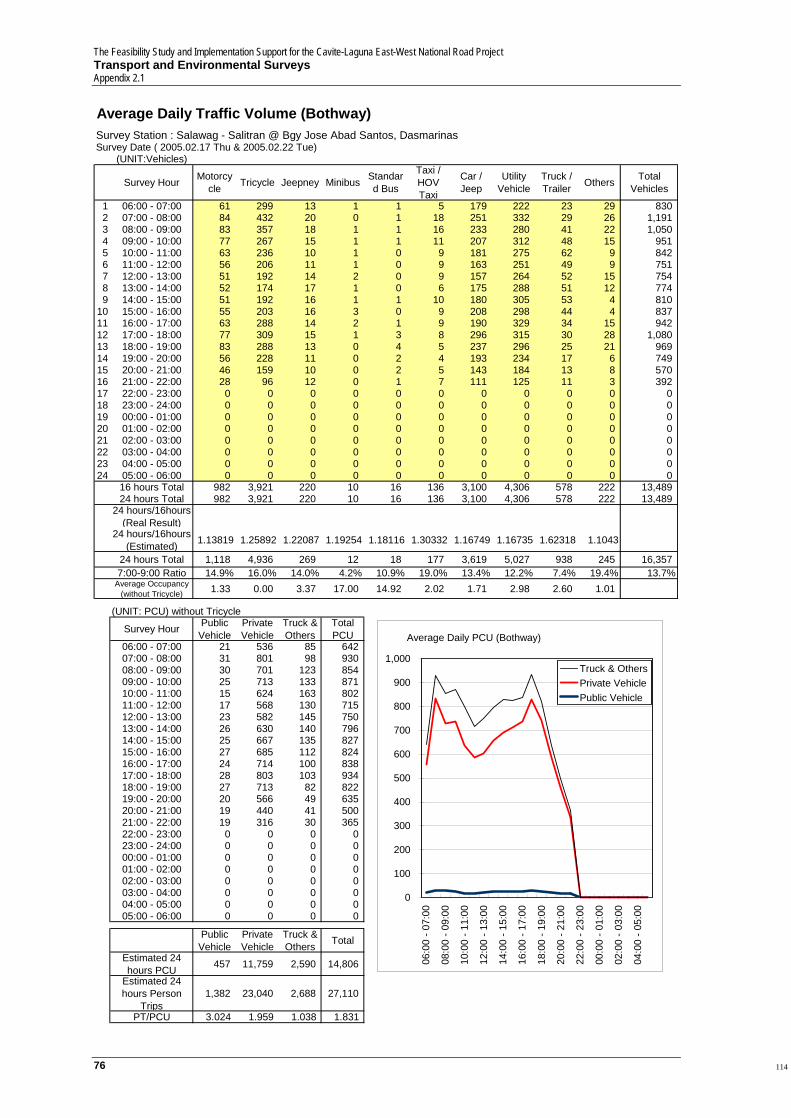
The Feasibility Study and Implementation Support for the Cavite-Laguna East-West National Road Project Transport and Environmental Surveys Appendix 2.1
76
Average Daily Traffic Volume (Bothway)Survey Station : Salawag - Salitran @ Bgy Jose Abad Santos, DasmarinasSurvey Date ( 2005.02.17 Thu & 2005.02.22 Tue)
(UNIT:Vehicles)
Survey Hour Motorcycle Tricycle Jeepney Minibus Standar
d Bus
Taxi /HOV Taxi
Car / Jeep
Utility Vehicle
Truck / Trailer Others Total
Vehicles
1 06:00 - 07:00 61 299 13 1 1 5 179 222 23 29 8302 07:00 - 08:00 84 432 20 0 1 18 251 332 29 26 1,1913 08:00 - 09:00 83 357 18 1 1 16 233 280 41 22 1,0504 09:00 - 10:00 77 267 15 1 1 11 207 312 48 15 9515 10:00 - 11:00 63 236 10 1 0 9 181 275 62 9 8426 11:00 - 12:00 56 206 11 1 0 9 163 251 49 9 7517 12:00 - 13:00 51 192 14 2 0 9 157 264 52 15 7548 13:00 - 14:00 52 174 17 1 0 6 175 288 51 12 7749 14:00 - 15:00 51 192 16 1 1 10 180 305 53 4 810
10 15:00 - 16:00 55 203 16 3 0 9 208 298 44 4 83711 16:00 - 17:00 63 288 14 2 1 9 190 329 34 15 94212 17:00 - 18:00 77 309 15 1 3 8 296 315 30 28 1,08013 18:00 - 19:00 83 288 13 0 4 5 237 296 25 21 96914 19:00 - 20:00 56 228 11 0 2 4 193 234 17 6 74915 20:00 - 21:00 46 159 10 0 2 5 143 184 13 8 57016 21:00 - 22:00 28 96 12 0 1 7 111 125 11 3 39217 22:00 - 23:00 0 0 0 0 0 0 0 0 0 0 018 23:00 - 24:00 0 0 0 0 0 0 0 0 0 0 019 00:00 - 01:00 0 0 0 0 0 0 0 0 0 0 020 01:00 - 02:00 0 0 0 0 0 0 0 0 0 0 021 02:00 - 03:00 0 0 0 0 0 0 0 0 0 0 022 03:00 - 04:00 0 0 0 0 0 0 0 0 0 0 023 04:00 - 05:00 0 0 0 0 0 0 0 0 0 0 024 05:00 - 06:00 0 0 0 0 0 0 0 0 0 0 0
16 hours Total 982 3,921 220 10 16 136 3,100 4,306 578 222 13,48924 hours Total 982 3,921 220 10 16 136 3,100 4,306 578 222 13,489
24 hours/16hours (Real Result)
24 hours/16hours (Estimated) 1.13819 1.25892 1.22087 1.19254 1.18116 1.30332 1.16749 1.16735 1.62318 1.1043
24 hours Total 1,118 4,936 269 12 18 177 3,619 5,027 938 245 16,3577:00-9:00 Ratio 14.9% 16.0% 14.0% 4.2% 10.9% 19.0% 13.4% 12.2% 7.4% 19.4% 13.7%
Average Occupancy (without Tricycle) 1.33 0.00 3.37 17.00 14.92 2.02 1.71 2.98 2.60 1.01
(UNIT: PCU) without Tricycle
Survey Hour Public Vehicle
Private Vehicle
Truck & Others
Total PCU
06:00 - 07:00 21 536 85 64207:00 - 08:00 31 801 98 93008:00 - 09:00 30 701 123 85409:00 - 10:00 25 713 133 87110:00 - 11:00 15 624 163 80211:00 - 12:00 17 568 130 71512:00 - 13:00 23 582 145 75013:00 - 14:00 26 630 140 79614:00 - 15:00 25 667 135 82715:00 - 16:00 27 685 112 82416:00 - 17:00 24 714 100 83817:00 - 18:00 28 803 103 93418:00 - 19:00 27 713 82 82219:00 - 20:00 20 566 49 63520:00 - 21:00 19 440 41 50021:00 - 22:00 19 316 30 36522:00 - 23:00 0 0 0 023:00 - 24:00 0 0 0 000:00 - 01:00 0 0 0 001:00 - 02:00 0 0 0 002:00 - 03:00 0 0 0 003:00 - 04:00 0 0 0 004:00 - 05:00 0 0 0 005:00 - 06:00 0 0 0 0
Public Vehicle
Private Vehicle
Truck & Others Total
Estimated 24 hours PCU 457 11,759 2,590 14,806
Estimated 24 hours Person
Trips1,382 23,040 2,688 27,110
PT/PCU 3.024 1.959 1.038 1.831
Average Daily PCU (Bothway)
0
100
200
300
400
500
600
700
800
900
1,000
06:0
0 - 0
7:00
08:0
0 - 0
9:00
10:0
0 - 1
1:00
12:0
0 - 1
3:00
14:0
0 - 1
5:00
16:0
0 - 1
7:00
18:0
0 - 1
9:00
20:0
0 - 2
1:00
22:0
0 - 2
3:00
00:0
0 - 0
1:00
02:0
0 - 0
3:00
04:0
0 - 0
5:00
Truck & OthersPrivate VehiclePublic Vehicle
114
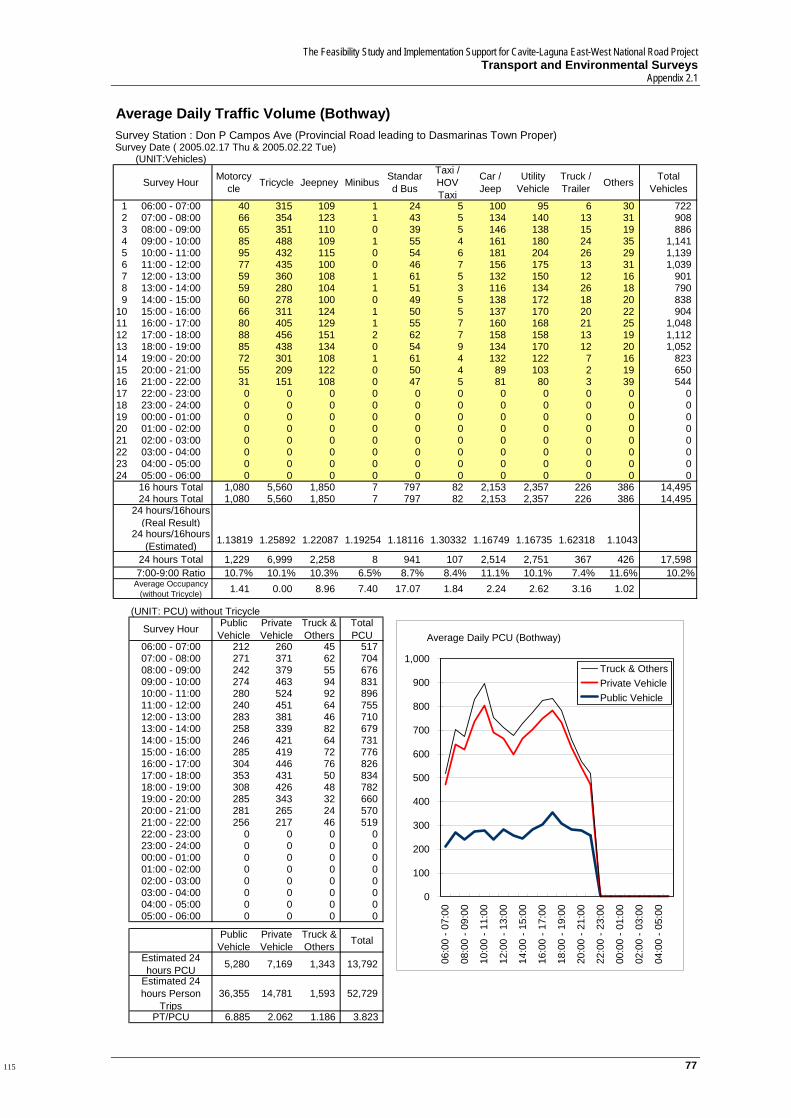
The Feasibility Study and Implementation Support for Cavite-Laguna East-West National Road Project Transport and Environmental Surveys
Appendix 2.1
77
Average Daily Traffic Volume (Bothway)Survey Station : Don P Campos Ave (Provincial Road leading to Dasmarinas Town Proper)Survey Date ( 2005.02.17 Thu & 2005.02.22 Tue)
(UNIT:Vehicles)
Survey Hour Motorcycle Tricycle Jeepney Minibus Standar
d Bus
Taxi /HOV Taxi
Car / Jeep
Utility Vehicle
Truck / Trailer Others Total
Vehicles
1 06:00 - 07:00 40 315 109 1 24 5 100 95 6 30 7222 07:00 - 08:00 66 354 123 1 43 5 134 140 13 31 9083 08:00 - 09:00 65 351 110 0 39 5 146 138 15 19 8864 09:00 - 10:00 85 488 109 1 55 4 161 180 24 35 1,1415 10:00 - 11:00 95 432 115 0 54 6 181 204 26 29 1,1396 11:00 - 12:00 77 435 100 0 46 7 156 175 13 31 1,0397 12:00 - 13:00 59 360 108 1 61 5 132 150 12 16 9018 13:00 - 14:00 59 280 104 1 51 3 116 134 26 18 7909 14:00 - 15:00 60 278 100 0 49 5 138 172 18 20 838
10 15:00 - 16:00 66 311 124 1 50 5 137 170 20 22 90411 16:00 - 17:00 80 405 129 1 55 7 160 168 21 25 1,04812 17:00 - 18:00 88 456 151 2 62 7 158 158 13 19 1,11213 18:00 - 19:00 85 438 134 0 54 9 134 170 12 20 1,05214 19:00 - 20:00 72 301 108 1 61 4 132 122 7 16 82315 20:00 - 21:00 55 209 122 0 50 4 89 103 2 19 65016 21:00 - 22:00 31 151 108 0 47 5 81 80 3 39 54417 22:00 - 23:00 0 0 0 0 0 0 0 0 0 0 018 23:00 - 24:00 0 0 0 0 0 0 0 0 0 0 019 00:00 - 01:00 0 0 0 0 0 0 0 0 0 0 020 01:00 - 02:00 0 0 0 0 0 0 0 0 0 0 021 02:00 - 03:00 0 0 0 0 0 0 0 0 0 0 022 03:00 - 04:00 0 0 0 0 0 0 0 0 0 0 023 04:00 - 05:00 0 0 0 0 0 0 0 0 0 0 024 05:00 - 06:00 0 0 0 0 0 0 0 0 0 0 0
16 hours Total 1,080 5,560 1,850 7 797 82 2,153 2,357 226 386 14,49524 hours Total 1,080 5,560 1,850 7 797 82 2,153 2,357 226 386 14,495
24 hours/16hours (Real Result)
24 hours/16hours (Estimated) 1.13819 1.25892 1.22087 1.19254 1.18116 1.30332 1.16749 1.16735 1.62318 1.1043
24 hours Total 1,229 6,999 2,258 8 941 107 2,514 2,751 367 426 17,5987:00-9:00 Ratio 10.7% 10.1% 10.3% 6.5% 8.7% 8.4% 11.1% 10.1% 7.4% 11.6% 10.2%
Average Occupancy (without Tricycle) 1.41 0.00 8.96 7.40 17.07 1.84 2.24 2.62 3.16 1.02
(UNIT: PCU) without Tricycle
Survey Hour Public Vehicle
Private Vehicle
Truck & Others
Total PCU
06:00 - 07:00 212 260 45 51707:00 - 08:00 271 371 62 70408:00 - 09:00 242 379 55 67609:00 - 10:00 274 463 94 83110:00 - 11:00 280 524 92 89611:00 - 12:00 240 451 64 75512:00 - 13:00 283 381 46 71013:00 - 14:00 258 339 82 67914:00 - 15:00 246 421 64 73115:00 - 16:00 285 419 72 77616:00 - 17:00 304 446 76 82617:00 - 18:00 353 431 50 83418:00 - 19:00 308 426 48 78219:00 - 20:00 285 343 32 66020:00 - 21:00 281 265 24 57021:00 - 22:00 256 217 46 51922:00 - 23:00 0 0 0 023:00 - 24:00 0 0 0 000:00 - 01:00 0 0 0 001:00 - 02:00 0 0 0 002:00 - 03:00 0 0 0 003:00 - 04:00 0 0 0 004:00 - 05:00 0 0 0 005:00 - 06:00 0 0 0 0
Public Vehicle
Private Vehicle
Truck & Others Total
Estimated 24 hours PCU 5,280 7,169 1,343 13,792
Estimated 24 hours Person
Trips36,355 14,781 1,593 52,729
PT/PCU 6.885 2.062 1.186 3.823
Average Daily PCU (Bothway)
0
100
200
300
400
500
600
700
800
900
1,000
06:0
0 - 0
7:00
08:0
0 - 0
9:00
10:0
0 - 1
1:00
12:0
0 - 1
3:00
14:0
0 - 1
5:00
16:0
0 - 1
7:00
18:0
0 - 1
9:00
20:0
0 - 2
1:00
22:0
0 - 2
3:00
00:0
0 - 0
1:00
02:0
0 - 0
3:00
04:0
0 - 0
5:00
Truck & OthersPrivate VehiclePublic Vehicle
115
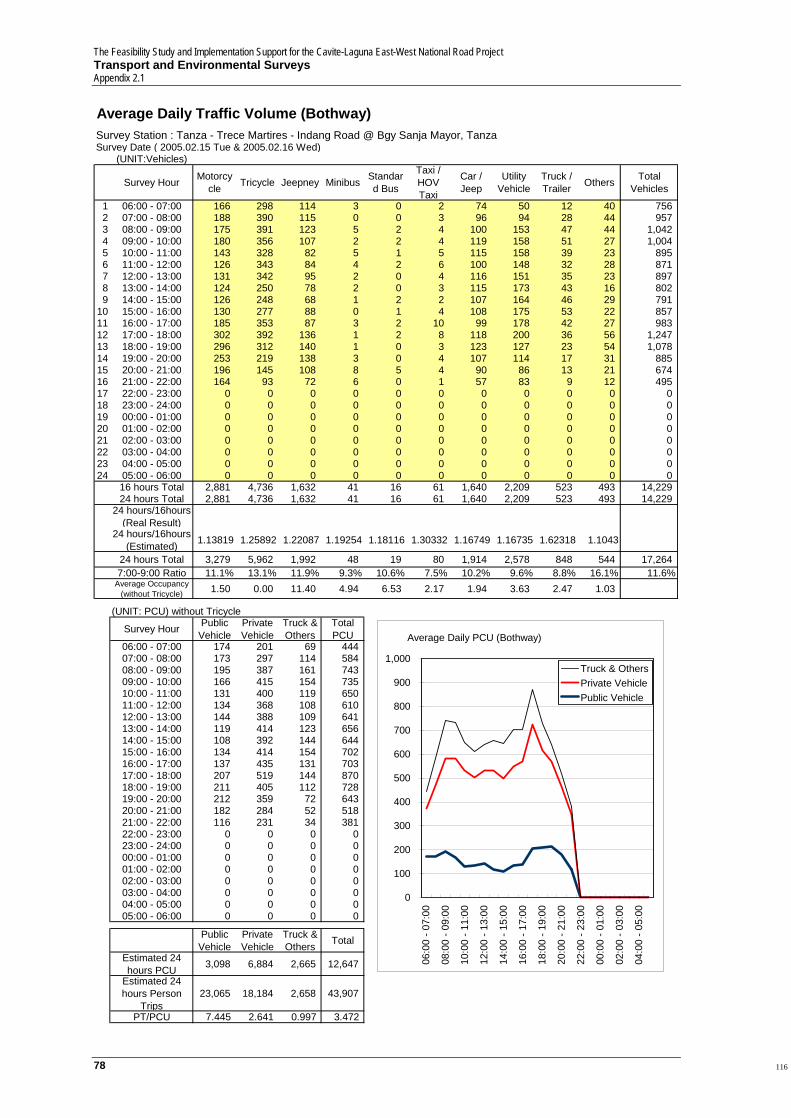
The Feasibility Study and Implementation Support for the Cavite-Laguna East-West National Road Project Transport and Environmental Surveys Appendix 2.1
78
Average Daily Traffic Volume (Bothway)Survey Station : Tanza - Trece Martires - Indang Road @ Bgy Sanja Mayor, TanzaSurvey Date ( 2005.02.15 Tue & 2005.02.16 Wed)
(UNIT:Vehicles)
Survey Hour Motorcycle Tricycle Jeepney Minibus Standar
d Bus
Taxi /HOV Taxi
Car / Jeep
Utility Vehicle
Truck / Trailer Others Total
Vehicles
1 06:00 - 07:00 166 298 114 3 0 2 74 50 12 40 7562 07:00 - 08:00 188 390 115 0 0 3 96 94 28 44 9573 08:00 - 09:00 175 391 123 5 2 4 100 153 47 44 1,0424 09:00 - 10:00 180 356 107 2 2 4 119 158 51 27 1,0045 10:00 - 11:00 143 328 82 5 1 5 115 158 39 23 8956 11:00 - 12:00 126 343 84 4 2 6 100 148 32 28 8717 12:00 - 13:00 131 342 95 2 0 4 116 151 35 23 8978 13:00 - 14:00 124 250 78 2 0 3 115 173 43 16 8029 14:00 - 15:00 126 248 68 1 2 2 107 164 46 29 791
10 15:00 - 16:00 130 277 88 0 1 4 108 175 53 22 85711 16:00 - 17:00 185 353 87 3 2 10 99 178 42 27 98312 17:00 - 18:00 302 392 136 1 2 8 118 200 36 56 1,24713 18:00 - 19:00 296 312 140 1 0 3 123 127 23 54 1,07814 19:00 - 20:00 253 219 138 3 0 4 107 114 17 31 88515 20:00 - 21:00 196 145 108 8 5 4 90 86 13 21 67416 21:00 - 22:00 164 93 72 6 0 1 57 83 9 12 49517 22:00 - 23:00 0 0 0 0 0 0 0 0 0 0 018 23:00 - 24:00 0 0 0 0 0 0 0 0 0 0 019 00:00 - 01:00 0 0 0 0 0 0 0 0 0 0 020 01:00 - 02:00 0 0 0 0 0 0 0 0 0 0 021 02:00 - 03:00 0 0 0 0 0 0 0 0 0 0 022 03:00 - 04:00 0 0 0 0 0 0 0 0 0 0 023 04:00 - 05:00 0 0 0 0 0 0 0 0 0 0 024 05:00 - 06:00 0 0 0 0 0 0 0 0 0 0 0
16 hours Total 2,881 4,736 1,632 41 16 61 1,640 2,209 523 493 14,22924 hours Total 2,881 4,736 1,632 41 16 61 1,640 2,209 523 493 14,229
24 hours/16hours (Real Result)
24 hours/16hours (Estimated) 1.13819 1.25892 1.22087 1.19254 1.18116 1.30332 1.16749 1.16735 1.62318 1.1043
24 hours Total 3,279 5,962 1,992 48 19 80 1,914 2,578 848 544 17,2647:00-9:00 Ratio 11.1% 13.1% 11.9% 9.3% 10.6% 7.5% 10.2% 9.6% 8.8% 16.1% 11.6%
Average Occupancy (without Tricycle) 1.50 0.00 11.40 4.94 6.53 2.17 1.94 3.63 2.47 1.03
(UNIT: PCU) without Tricycle
Survey Hour Public Vehicle
Private Vehicle
Truck & Others
Total PCU
06:00 - 07:00 174 201 69 44407:00 - 08:00 173 297 114 58408:00 - 09:00 195 387 161 74309:00 - 10:00 166 415 154 73510:00 - 11:00 131 400 119 65011:00 - 12:00 134 368 108 61012:00 - 13:00 144 388 109 64113:00 - 14:00 119 414 123 65614:00 - 15:00 108 392 144 64415:00 - 16:00 134 414 154 70216:00 - 17:00 137 435 131 70317:00 - 18:00 207 519 144 87018:00 - 19:00 211 405 112 72819:00 - 20:00 212 359 72 64320:00 - 21:00 182 284 52 51821:00 - 22:00 116 231 34 38122:00 - 23:00 0 0 0 023:00 - 24:00 0 0 0 000:00 - 01:00 0 0 0 001:00 - 02:00 0 0 0 002:00 - 03:00 0 0 0 003:00 - 04:00 0 0 0 004:00 - 05:00 0 0 0 005:00 - 06:00 0 0 0 0
Public Vehicle
Private Vehicle
Truck & Others Total
Estimated 24 hours PCU 3,098 6,884 2,665 12,647
Estimated 24 hours Person
Trips23,065 18,184 2,658 43,907
PT/PCU 7.445 2.641 0.997 3.472
Average Daily PCU (Bothway)
0
100
200
300
400
500
600
700
800
900
1,000
06:0
0 - 0
7:00
08:0
0 - 0
9:00
10:0
0 - 1
1:00
12:0
0 - 1
3:00
14:0
0 - 1
5:00
16:0
0 - 1
7:00
18:0
0 - 1
9:00
20:0
0 - 2
1:00
22:0
0 - 2
3:00
00:0
0 - 0
1:00
02:0
0 - 0
3:00
04:0
0 - 0
5:00
Truck & OthersPrivate VehiclePublic Vehicle
116

The Feasibility Study and Implementation Support for Cavite-Laguna East-West National Road Project Transport and Environmental Surveys
Appendix 2.1
79
Average Daily Traffic Volume (Bothway)Survey Station : Noveleta - Tanza - Naic Road @ Bgy Capipisa, Tanza (Boundary of Naic and Tanza)Survey Date ( 2005.02.15 Tue & 2005.02.16 Wed)
(UNIT:Vehicles)
Survey Hour Motorcycle Tricycle Jeepney Minibus Standar
d Bus
Taxi /HOV Taxi
Car / Jeep
Utility Vehicle
Truck / Trailer Others Total
Vehicles
1 06:00 - 07:00 63 34 42 52 7 3 38 28 5 1 2702 07:00 - 08:00 101 40 41 80 9 9 50 47 23 3 4003 08:00 - 09:00 95 40 37 98 14 4 64 85 36 6 4774 09:00 - 10:00 94 51 27 109 11 8 65 103 35 2 5035 10:00 - 11:00 77 64 12 100 11 5 67 120 35 5 4936 11:00 - 12:00 68 46 13 111 14 8 70 109 32 5 4737 12:00 - 13:00 59 44 20 115 16 9 57 109 22 3 4528 13:00 - 14:00 56 45 9 106 14 8 70 122 45 1 4749 14:00 - 15:00 55 48 13 92 16 12 53 114 40 1 441
10 15:00 - 16:00 54 67 16 120 11 16 60 127 35 2 50611 16:00 - 17:00 91 45 27 134 10 17 62 104 34 2 52312 17:00 - 18:00 139 54 27 136 8 12 61 107 26 6 57413 18:00 - 19:00 113 35 41 112 11 6 45 86 17 5 46914 19:00 - 20:00 83 25 34 124 13 4 37 97 14 2 43115 20:00 - 21:00 69 15 31 101 10 5 38 63 8 1 33816 21:00 - 22:00 58 10 19 82 3 4 33 54 4 1 26517 22:00 - 23:00 0 0 0 0 0 0 0 0 0 0 018 23:00 - 24:00 0 0 0 0 0 0 0 0 0 0 019 00:00 - 01:00 0 0 0 0 0 0 0 0 0 0 020 01:00 - 02:00 0 0 0 0 0 0 0 0 0 0 021 02:00 - 03:00 0 0 0 0 0 0 0 0 0 0 022 03:00 - 04:00 0 0 0 0 0 0 0 0 0 0 023 04:00 - 05:00 0 0 0 0 0 0 0 0 0 0 024 05:00 - 06:00 0 0 0 0 0 0 0 0 0 0 0
16 hours Total 1,271 658 407 1,668 172 127 866 1,470 409 41 7,08724 hours Total 1,271 658 407 1,668 172 127 866 1,470 409 41 7,087
24 hours/16hours (Real Result)
24 hours/16hours (Estimated) 1.13819 1.25892 1.22087 1.19254 1.18116 1.30332 1.16749 1.16735 1.62318 1.1043
24 hours Total 1,446 828 496 1,989 203 165 1,011 1,716 663 45 8,5637:00-9:00 Ratio 13.6% 9.6% 15.6% 8.9% 11.1% 7.9% 11.2% 7.7% 8.7% 17.9% 10.2%
Average Occupancy (without Tricycle) 1.46 0.00 9.09 9.70 19.96 4.99 2.12 3.88 2.34 1.00
(UNIT: PCU) without Tricycle
Survey Hour Public Vehicle
Private Vehicle
Truck & Others
Total PCU
06:00 - 07:00 153 102 12 26707:00 - 08:00 198 164 59 42108:00 - 09:00 230 226 94 55009:00 - 10:00 224 259 90 57310:00 - 11:00 189 276 92 55711:00 - 12:00 213 264 85 56212:00 - 13:00 234 250 56 54013:00 - 14:00 199 281 114 59414:00 - 15:00 187 257 101 54515:00 - 16:00 226 289 90 60516:00 - 17:00 260 270 85 61517:00 - 18:00 260 280 71 61118:00 - 19:00 251 216 47 51419:00 - 20:00 261 213 37 51120:00 - 21:00 217 159 21 39721:00 - 22:00 155 137 11 30322:00 - 23:00 0 0 0 023:00 - 24:00 0 0 0 000:00 - 01:00 0 0 0 001:00 - 02:00 0 0 0 002:00 - 03:00 0 0 0 003:00 - 04:00 0 0 0 004:00 - 05:00 0 0 0 005:00 - 06:00 0 0 0 0
Public Vehicle
Private Vehicle
Truck & Others Total
Estimated 24 hours PCU 4,134 4,266 1,702 10,102
Estimated 24 hours Person
Trips27,867 11,732 1,598 41,197
PT/PCU 6.741 2.750 0.939 4.078
Average Daily PCU (Bothway)
0
100
200
300
400
500
600
700
06:0
0 - 0
7:00
08:0
0 - 0
9:00
10:0
0 - 1
1:00
12:0
0 - 1
3:00
14:0
0 - 1
5:00
16:0
0 - 1
7:00
18:0
0 - 1
9:00
20:0
0 - 2
1:00
22:0
0 - 2
3:00
00:0
0 - 0
1:00
02:0
0 - 0
3:00
04:0
0 - 0
5:00
Truck & OthersPrivate VehiclePublic Vehicle
117
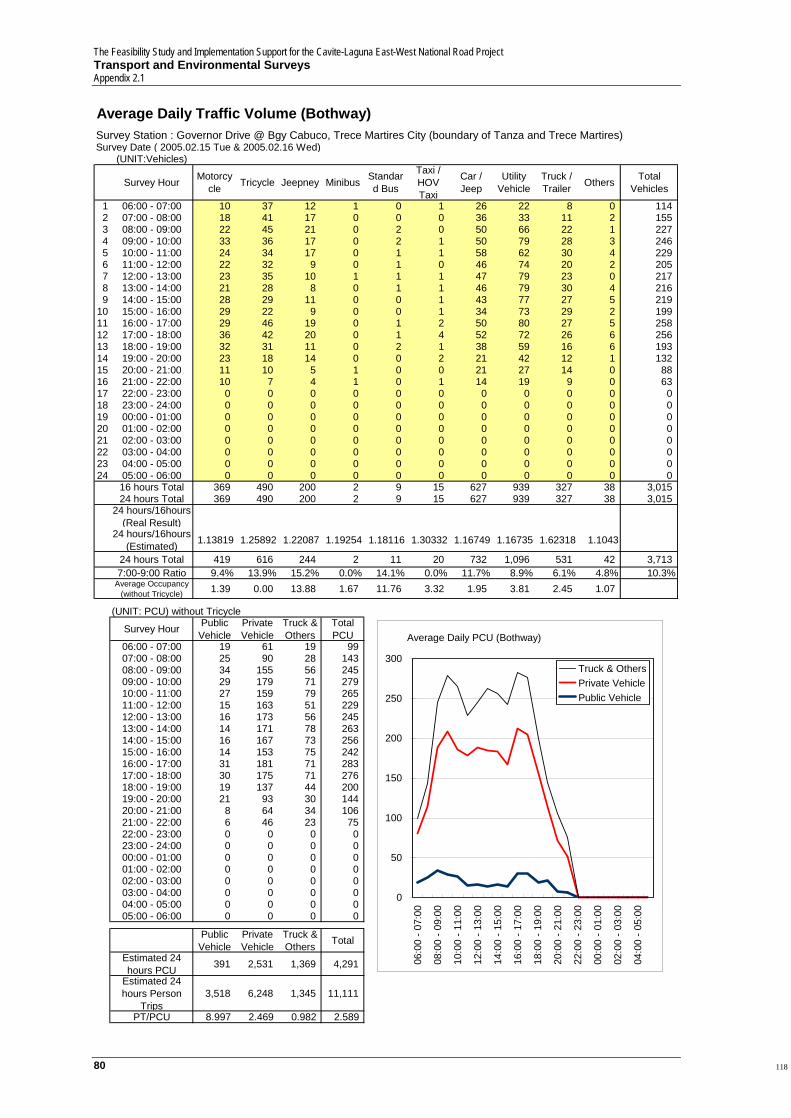
The Feasibility Study and Implementation Support for the Cavite-Laguna East-West National Road Project Transport and Environmental Surveys Appendix 2.1
80
Average Daily Traffic Volume (Bothway)Survey Station : Governor Drive @ Bgy Cabuco, Trece Martires City (boundary of Tanza and Trece Martires)Survey Date ( 2005.02.15 Tue & 2005.02.16 Wed)
(UNIT:Vehicles)
Survey Hour Motorcycle Tricycle Jeepney Minibus Standar
d Bus
Taxi /HOV Taxi
Car / Jeep
Utility Vehicle
Truck / Trailer Others Total
Vehicles
1 06:00 - 07:00 10 37 12 1 0 1 26 22 8 0 1142 07:00 - 08:00 18 41 17 0 0 0 36 33 11 2 1553 08:00 - 09:00 22 45 21 0 2 0 50 66 22 1 2274 09:00 - 10:00 33 36 17 0 2 1 50 79 28 3 2465 10:00 - 11:00 24 34 17 0 1 1 58 62 30 4 2296 11:00 - 12:00 22 32 9 0 1 0 46 74 20 2 2057 12:00 - 13:00 23 35 10 1 1 1 47 79 23 0 2178 13:00 - 14:00 21 28 8 0 1 1 46 79 30 4 2169 14:00 - 15:00 28 29 11 0 0 1 43 77 27 5 219
10 15:00 - 16:00 29 22 9 0 0 1 34 73 29 2 19911 16:00 - 17:00 29 46 19 0 1 2 50 80 27 5 25812 17:00 - 18:00 36 42 20 0 1 4 52 72 26 6 25613 18:00 - 19:00 32 31 11 0 2 1 38 59 16 6 19314 19:00 - 20:00 23 18 14 0 0 2 21 42 12 1 13215 20:00 - 21:00 11 10 5 1 0 0 21 27 14 0 8816 21:00 - 22:00 10 7 4 1 0 1 14 19 9 0 6317 22:00 - 23:00 0 0 0 0 0 0 0 0 0 0 018 23:00 - 24:00 0 0 0 0 0 0 0 0 0 0 019 00:00 - 01:00 0 0 0 0 0 0 0 0 0 0 020 01:00 - 02:00 0 0 0 0 0 0 0 0 0 0 021 02:00 - 03:00 0 0 0 0 0 0 0 0 0 0 022 03:00 - 04:00 0 0 0 0 0 0 0 0 0 0 023 04:00 - 05:00 0 0 0 0 0 0 0 0 0 0 024 05:00 - 06:00 0 0 0 0 0 0 0 0 0 0 0
16 hours Total 369 490 200 2 9 15 627 939 327 38 3,01524 hours Total 369 490 200 2 9 15 627 939 327 38 3,015
24 hours/16hours (Real Result)
24 hours/16hours (Estimated) 1.13819 1.25892 1.22087 1.19254 1.18116 1.30332 1.16749 1.16735 1.62318 1.1043
24 hours Total 419 616 244 2 11 20 732 1,096 531 42 3,7137:00-9:00 Ratio 9.4% 13.9% 15.2% 0.0% 14.1% 0.0% 11.7% 8.9% 6.1% 4.8% 10.3%
Average Occupancy (without Tricycle) 1.39 0.00 13.88 1.67 11.76 3.32 1.95 3.81 2.45 1.07
(UNIT: PCU) without Tricycle
Survey Hour Public Vehicle
Private Vehicle
Truck & Others
Total PCU
06:00 - 07:00 19 61 19 9907:00 - 08:00 25 90 28 14308:00 - 09:00 34 155 56 24509:00 - 10:00 29 179 71 27910:00 - 11:00 27 159 79 26511:00 - 12:00 15 163 51 22912:00 - 13:00 16 173 56 24513:00 - 14:00 14 171 78 26314:00 - 15:00 16 167 73 25615:00 - 16:00 14 153 75 24216:00 - 17:00 31 181 71 28317:00 - 18:00 30 175 71 27618:00 - 19:00 19 137 44 20019:00 - 20:00 21 93 30 14420:00 - 21:00 8 64 34 10621:00 - 22:00 6 46 23 7522:00 - 23:00 0 0 0 023:00 - 24:00 0 0 0 000:00 - 01:00 0 0 0 001:00 - 02:00 0 0 0 002:00 - 03:00 0 0 0 003:00 - 04:00 0 0 0 004:00 - 05:00 0 0 0 005:00 - 06:00 0 0 0 0
Public Vehicle
Private Vehicle
Truck & Others Total
Estimated 24 hours PCU 391 2,531 1,369 4,291
Estimated 24 hours Person
Trips3,518 6,248 1,345 11,111
PT/PCU 8.997 2.469 0.982 2.589
Average Daily PCU (Bothway)
0
50
100
150
200
250
300
06:0
0 - 0
7:00
08:0
0 - 0
9:00
10:0
0 - 1
1:00
12:0
0 - 1
3:00
14:0
0 - 1
5:00
16:0
0 - 1
7:00
18:0
0 - 1
9:00
20:0
0 - 2
1:00
22:0
0 - 2
3:00
00:0
0 - 0
1:00
02:0
0 - 0
3:00
04:0
0 - 0
5:00
Truck & OthersPrivate VehiclePublic Vehicle
118
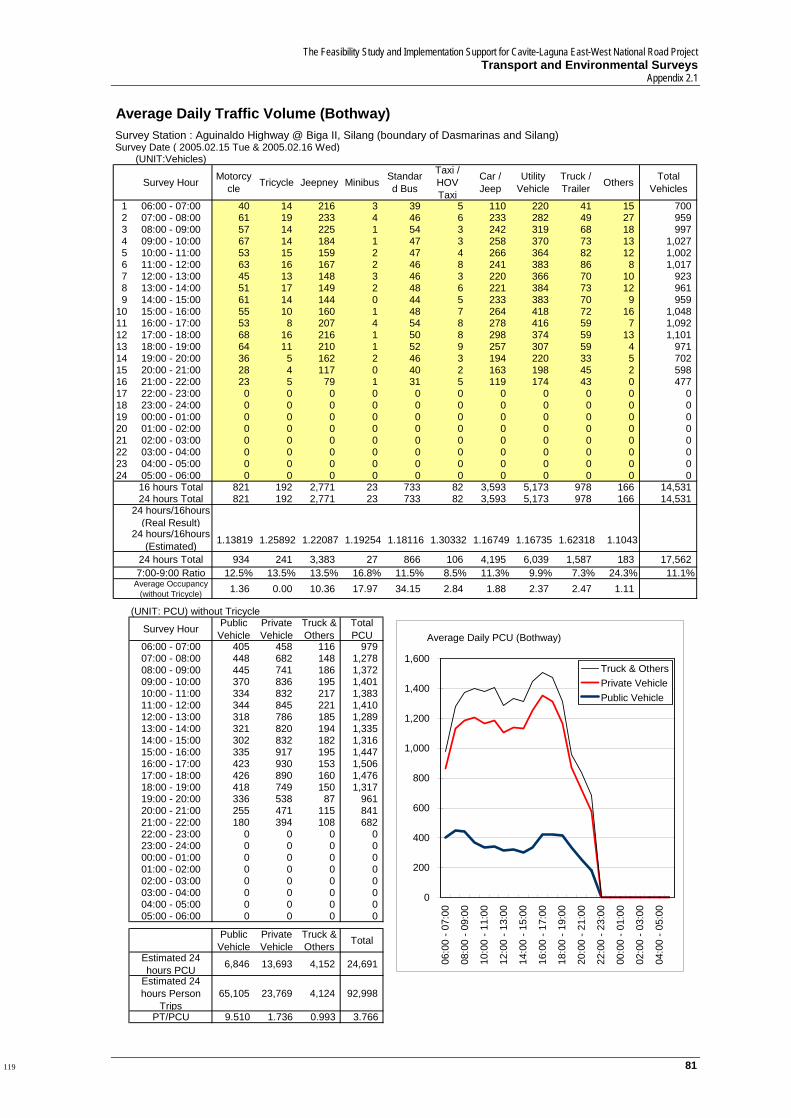
The Feasibility Study and Implementation Support for Cavite-Laguna East-West National Road Project Transport and Environmental Surveys
Appendix 2.1
81
Average Daily Traffic Volume (Bothway)Survey Station : Aguinaldo Highway @ Biga II, Silang (boundary of Dasmarinas and Silang)Survey Date ( 2005.02.15 Tue & 2005.02.16 Wed)
(UNIT:Vehicles)
Survey Hour Motorcycle Tricycle Jeepney Minibus Standar
d Bus
Taxi /HOV Taxi
Car / Jeep
Utility Vehicle
Truck / Trailer Others Total
Vehicles
1 06:00 - 07:00 40 14 216 3 39 5 110 220 41 15 7002 07:00 - 08:00 61 19 233 4 46 6 233 282 49 27 9593 08:00 - 09:00 57 14 225 1 54 3 242 319 68 18 9974 09:00 - 10:00 67 14 184 1 47 3 258 370 73 13 1,0275 10:00 - 11:00 53 15 159 2 47 4 266 364 82 12 1,0026 11:00 - 12:00 63 16 167 2 46 8 241 383 86 8 1,0177 12:00 - 13:00 45 13 148 3 46 3 220 366 70 10 9238 13:00 - 14:00 51 17 149 2 48 6 221 384 73 12 9619 14:00 - 15:00 61 14 144 0 44 5 233 383 70 9 959
10 15:00 - 16:00 55 10 160 1 48 7 264 418 72 16 1,04811 16:00 - 17:00 53 8 207 4 54 8 278 416 59 7 1,09212 17:00 - 18:00 68 16 216 1 50 8 298 374 59 13 1,10113 18:00 - 19:00 64 11 210 1 52 9 257 307 59 4 97114 19:00 - 20:00 36 5 162 2 46 3 194 220 33 5 70215 20:00 - 21:00 28 4 117 0 40 2 163 198 45 2 59816 21:00 - 22:00 23 5 79 1 31 5 119 174 43 0 47717 22:00 - 23:00 0 0 0 0 0 0 0 0 0 0 018 23:00 - 24:00 0 0 0 0 0 0 0 0 0 0 019 00:00 - 01:00 0 0 0 0 0 0 0 0 0 0 020 01:00 - 02:00 0 0 0 0 0 0 0 0 0 0 021 02:00 - 03:00 0 0 0 0 0 0 0 0 0 0 022 03:00 - 04:00 0 0 0 0 0 0 0 0 0 0 023 04:00 - 05:00 0 0 0 0 0 0 0 0 0 0 024 05:00 - 06:00 0 0 0 0 0 0 0 0 0 0 0
16 hours Total 821 192 2,771 23 733 82 3,593 5,173 978 166 14,53124 hours Total 821 192 2,771 23 733 82 3,593 5,173 978 166 14,531
24 hours/16hours (Real Result)
24 hours/16hours (Estimated) 1.13819 1.25892 1.22087 1.19254 1.18116 1.30332 1.16749 1.16735 1.62318 1.1043
24 hours Total 934 241 3,383 27 866 106 4,195 6,039 1,587 183 17,5627:00-9:00 Ratio 12.5% 13.5% 13.5% 16.8% 11.5% 8.5% 11.3% 9.9% 7.3% 24.3% 11.1%
Average Occupancy (without Tricycle) 1.36 0.00 10.36 17.97 34.15 2.84 1.88 2.37 2.47 1.11
(UNIT: PCU) without Tricycle
Survey Hour Public Vehicle
Private Vehicle
Truck & Others
Total PCU
06:00 - 07:00 405 458 116 97907:00 - 08:00 448 682 148 1,27808:00 - 09:00 445 741 186 1,37209:00 - 10:00 370 836 195 1,40110:00 - 11:00 334 832 217 1,38311:00 - 12:00 344 845 221 1,41012:00 - 13:00 318 786 185 1,28913:00 - 14:00 321 820 194 1,33514:00 - 15:00 302 832 182 1,31615:00 - 16:00 335 917 195 1,44716:00 - 17:00 423 930 153 1,50617:00 - 18:00 426 890 160 1,47618:00 - 19:00 418 749 150 1,31719:00 - 20:00 336 538 87 96120:00 - 21:00 255 471 115 84121:00 - 22:00 180 394 108 68222:00 - 23:00 0 0 0 023:00 - 24:00 0 0 0 000:00 - 01:00 0 0 0 001:00 - 02:00 0 0 0 002:00 - 03:00 0 0 0 003:00 - 04:00 0 0 0 004:00 - 05:00 0 0 0 005:00 - 06:00 0 0 0 0
Public Vehicle
Private Vehicle
Truck & Others Total
Estimated 24 hours PCU 6,846 13,693 4,152 24,691
Estimated 24 hours Person
Trips65,105 23,769 4,124 92,998
PT/PCU 9.510 1.736 0.993 3.766
Average Daily PCU (Bothway)
0
200
400
600
800
1,000
1,200
1,400
1,600
06:0
0 - 0
7:00
08:0
0 - 0
9:00
10:0
0 - 1
1:00
12:0
0 - 1
3:00
14:0
0 - 1
5:00
16:0
0 - 1
7:00
18:0
0 - 1
9:00
20:0
0 - 2
1:00
22:0
0 - 2
3:00
00:0
0 - 0
1:00
02:0
0 - 0
3:00
04:0
0 - 0
5:00
Truck & OthersPrivate VehiclePublic Vehicle
119

The Feasibility Study and Implementation Support for the Cavite-Laguna East-West National Road Project Transport and Environmental Surveys Appendix 2.1
82
Average Daily Traffic Volume (Bothway)Survey Station : Carmona National Road @ Bgy Maduya, Carmona (boundary of Carmona and Binan)Survey Date ( 2005.02.15 Tue & 2005.02.16 Wed)
(UNIT:Vehicles)
Survey Hour Motorcycle Tricycle Jeepney Minibus Standar
d Bus
Taxi /HOV Taxi
Car / Jeep
Utility Vehicle
Truck / Trailer Others Total
Vehicles
1 06:00 - 07:00 138 109 363 3 79 13 140 195 38 77 1,1532 07:00 - 08:00 170 89 406 6 103 15 204 277 55 114 1,4373 08:00 - 09:00 130 74 333 4 64 10 217 287 102 50 1,2704 09:00 - 10:00 122 77 291 2 33 13 213 315 119 33 1,2155 10:00 - 11:00 94 76 254 1 20 8 205 349 121 29 1,1556 11:00 - 12:00 99 72 222 2 22 6 201 300 125 25 1,0717 12:00 - 13:00 109 85 242 2 30 5 197 285 93 27 1,0738 13:00 - 14:00 102 79 244 3 33 10 196 309 104 16 1,0949 14:00 - 15:00 110 65 270 1 44 8 205 318 128 25 1,171
10 15:00 - 16:00 101 63 258 1 52 7 212 292 112 32 1,12711 16:00 - 17:00 102 71 318 1 76 6 176 265 105 53 1,17212 17:00 - 18:00 136 53 288 3 60 11 220 225 87 80 1,16013 18:00 - 19:00 158 62 338 1 66 9 174 222 57 39 1,12314 19:00 - 20:00 125 78 311 3 49 6 165 216 58 58 1,06715 20:00 - 21:00 126 64 269 2 48 6 163 211 47 23 95716 21:00 - 22:00 84 50 215 4 35 9 177 164 50 15 80017 22:00 - 23:00 0 0 0 0 0 0 0 0 0 0 018 23:00 - 24:00 0 0 0 0 0 0 0 0 0 0 019 00:00 - 01:00 0 0 0 0 0 0 0 0 0 0 020 01:00 - 02:00 0 0 0 0 0 0 0 0 0 0 021 02:00 - 03:00 0 0 0 0 0 0 0 0 0 0 022 03:00 - 04:00 0 0 0 0 0 0 0 0 0 0 023 04:00 - 05:00 0 0 0 0 0 0 0 0 0 0 024 05:00 - 06:00 0 0 0 0 0 0 0 0 0 0 0
16 hours Total 1,903 1,163 4,617 34 810 140 3,061 4,227 1,398 692 18,04124 hours Total 1,903 1,163 4,617 34 810 140 3,061 4,227 1,398 692 18,041
24 hours/16hours (Real Result)
24 hours/16hours (Estimated) 1.13819 1.25892 1.22087 1.19254 1.18116 1.30332 1.16749 1.16735 1.62318 1.1043
24 hours Total 2,165 1,463 5,637 40 956 182 3,573 4,934 2,268 764 21,9837:00-9:00 Ratio 13.9% 11.1% 13.1% 23.8% 17.4% 13.8% 11.8% 11.4% 6.9% 21.4% 12.3%
Average Occupancy (without Tricycle) 1.46 0.00 11.27 12.36 16.97 3.72 1.50 2.75 2.11 1.03
(UNIT: PCU) without Tricycle
Survey Hour Public Vehicle
Private Vehicle
Truck & Others
Total PCU
06:00 - 07:00 706 493 171 1,37007:00 - 08:00 822 692 251 1,76508:00 - 09:00 634 700 305 1,63909:00 - 10:00 504 740 329 1,57310:00 - 11:00 422 769 330 1,52111:00 - 12:00 379 688 337 1,40412:00 - 13:00 424 664 258 1,34613:00 - 14:00 435 704 275 1,41414:00 - 15:00 493 726 345 1,56415:00 - 16:00 491 690 310 1,49116:00 - 17:00 630 613 316 1,55917:00 - 18:00 555 613 298 1,46618:00 - 19:00 638 567 181 1,38619:00 - 20:00 567 536 202 1,30520:00 - 21:00 500 526 140 1,16621:00 - 22:00 397 460 140 99722:00 - 23:00 0 0 0 023:00 - 24:00 0 0 0 000:00 - 01:00 0 0 0 001:00 - 02:00 0 0 0 002:00 - 03:00 0 0 0 003:00 - 04:00 0 0 0 004:00 - 05:00 0 0 0 005:00 - 06:00 0 0 0 0
Public Vehicle
Private Vehicle
Truck & Others Total
Estimated 24 hours PCU 10,427 11,896 6,435 28,758
Estimated 24 hours Person
Trips80,257 22,784 5,569 108,610
PT/PCU 7.697 1.915 0.865 3.777
Average Daily PCU (Bothway)
0
200
400
600
800
1,000
1,200
1,400
1,600
1,800
2,000
06:0
0 - 0
7:00
08:0
0 - 0
9:00
10:0
0 - 1
1:00
12:0
0 - 1
3:00
14:0
0 - 1
5:00
16:0
0 - 1
7:00
18:0
0 - 1
9:00
20:0
0 - 2
1:00
22:0
0 - 2
3:00
00:0
0 - 0
1:00
02:0
0 - 0
3:00
04:0
0 - 0
5:00
Truck & OthersPrivate VehiclePublic Vehicle
120
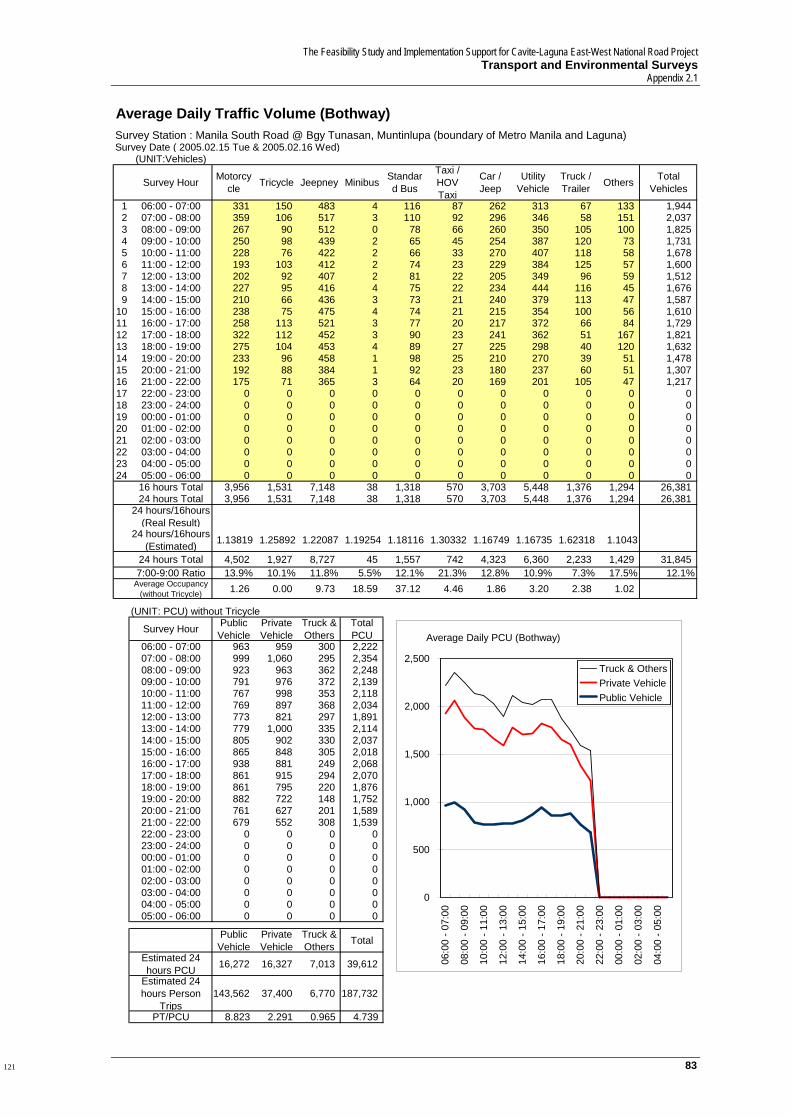
The Feasibility Study and Implementation Support for Cavite-Laguna East-West National Road Project Transport and Environmental Surveys
Appendix 2.1
83
Average Daily Traffic Volume (Bothway)Survey Station : Manila South Road @ Bgy Tunasan, Muntinlupa (boundary of Metro Manila and Laguna)Survey Date ( 2005.02.15 Tue & 2005.02.16 Wed)
(UNIT:Vehicles)
Survey Hour Motorcycle Tricycle Jeepney Minibus Standar
d Bus
Taxi /HOV Taxi
Car / Jeep
Utility Vehicle
Truck / Trailer Others Total
Vehicles
1 06:00 - 07:00 331 150 483 4 116 87 262 313 67 133 1,9442 07:00 - 08:00 359 106 517 3 110 92 296 346 58 151 2,0373 08:00 - 09:00 267 90 512 0 78 66 260 350 105 100 1,8254 09:00 - 10:00 250 98 439 2 65 45 254 387 120 73 1,7315 10:00 - 11:00 228 76 422 2 66 33 270 407 118 58 1,6786 11:00 - 12:00 193 103 412 2 74 23 229 384 125 57 1,6007 12:00 - 13:00 202 92 407 2 81 22 205 349 96 59 1,5128 13:00 - 14:00 227 95 416 4 75 22 234 444 116 45 1,6769 14:00 - 15:00 210 66 436 3 73 21 240 379 113 47 1,587
10 15:00 - 16:00 238 75 475 4 74 21 215 354 100 56 1,61011 16:00 - 17:00 258 113 521 3 77 20 217 372 66 84 1,72912 17:00 - 18:00 322 112 452 3 90 23 241 362 51 167 1,82113 18:00 - 19:00 275 104 453 4 89 27 225 298 40 120 1,63214 19:00 - 20:00 233 96 458 1 98 25 210 270 39 51 1,47815 20:00 - 21:00 192 88 384 1 92 23 180 237 60 51 1,30716 21:00 - 22:00 175 71 365 3 64 20 169 201 105 47 1,21717 22:00 - 23:00 0 0 0 0 0 0 0 0 0 0 018 23:00 - 24:00 0 0 0 0 0 0 0 0 0 0 019 00:00 - 01:00 0 0 0 0 0 0 0 0 0 0 020 01:00 - 02:00 0 0 0 0 0 0 0 0 0 0 021 02:00 - 03:00 0 0 0 0 0 0 0 0 0 0 022 03:00 - 04:00 0 0 0 0 0 0 0 0 0 0 023 04:00 - 05:00 0 0 0 0 0 0 0 0 0 0 024 05:00 - 06:00 0 0 0 0 0 0 0 0 0 0 0
16 hours Total 3,956 1,531 7,148 38 1,318 570 3,703 5,448 1,376 1,294 26,38124 hours Total 3,956 1,531 7,148 38 1,318 570 3,703 5,448 1,376 1,294 26,381
24 hours/16hours (Real Result)
24 hours/16hours (Estimated) 1.13819 1.25892 1.22087 1.19254 1.18116 1.30332 1.16749 1.16735 1.62318 1.1043
24 hours Total 4,502 1,927 8,727 45 1,557 742 4,323 6,360 2,233 1,429 31,8457:00-9:00 Ratio 13.9% 10.1% 11.8% 5.5% 12.1% 21.3% 12.8% 10.9% 7.3% 17.5% 12.1%
Average Occupancy (without Tricycle) 1.26 0.00 9.73 18.59 37.12 4.46 1.86 3.20 2.38 1.02
(UNIT: PCU) without Tricycle
Survey Hour Public Vehicle
Private Vehicle
Truck & Others
Total PCU
06:00 - 07:00 963 959 300 2,22207:00 - 08:00 999 1,060 295 2,35408:00 - 09:00 923 963 362 2,24809:00 - 10:00 791 976 372 2,13910:00 - 11:00 767 998 353 2,11811:00 - 12:00 769 897 368 2,03412:00 - 13:00 773 821 297 1,89113:00 - 14:00 779 1,000 335 2,11414:00 - 15:00 805 902 330 2,03715:00 - 16:00 865 848 305 2,01816:00 - 17:00 938 881 249 2,06817:00 - 18:00 861 915 294 2,07018:00 - 19:00 861 795 220 1,87619:00 - 20:00 882 722 148 1,75220:00 - 21:00 761 627 201 1,58921:00 - 22:00 679 552 308 1,53922:00 - 23:00 0 0 0 023:00 - 24:00 0 0 0 000:00 - 01:00 0 0 0 001:00 - 02:00 0 0 0 002:00 - 03:00 0 0 0 003:00 - 04:00 0 0 0 004:00 - 05:00 0 0 0 005:00 - 06:00 0 0 0 0
Public Vehicle
Private Vehicle
Truck & Others Total
Estimated 24 hours PCU 16,272 16,327 7,013 39,612
Estimated 24 hours Person
Trips143,562 37,400 6,770 187,732
PT/PCU 8.823 2.291 0.965 4.739
Average Daily PCU (Bothway)
0
500
1,000
1,500
2,000
2,500
06:0
0 - 0
7:00
08:0
0 - 0
9:00
10:0
0 - 1
1:00
12:0
0 - 1
3:00
14:0
0 - 1
5:00
16:0
0 - 1
7:00
18:0
0 - 1
9:00
20:0
0 - 2
1:00
22:0
0 - 2
3:00
00:0
0 - 0
1:00
02:0
0 - 0
3:00
04:0
0 - 0
5:00
Truck & OthersPrivate VehiclePublic Vehicle
121
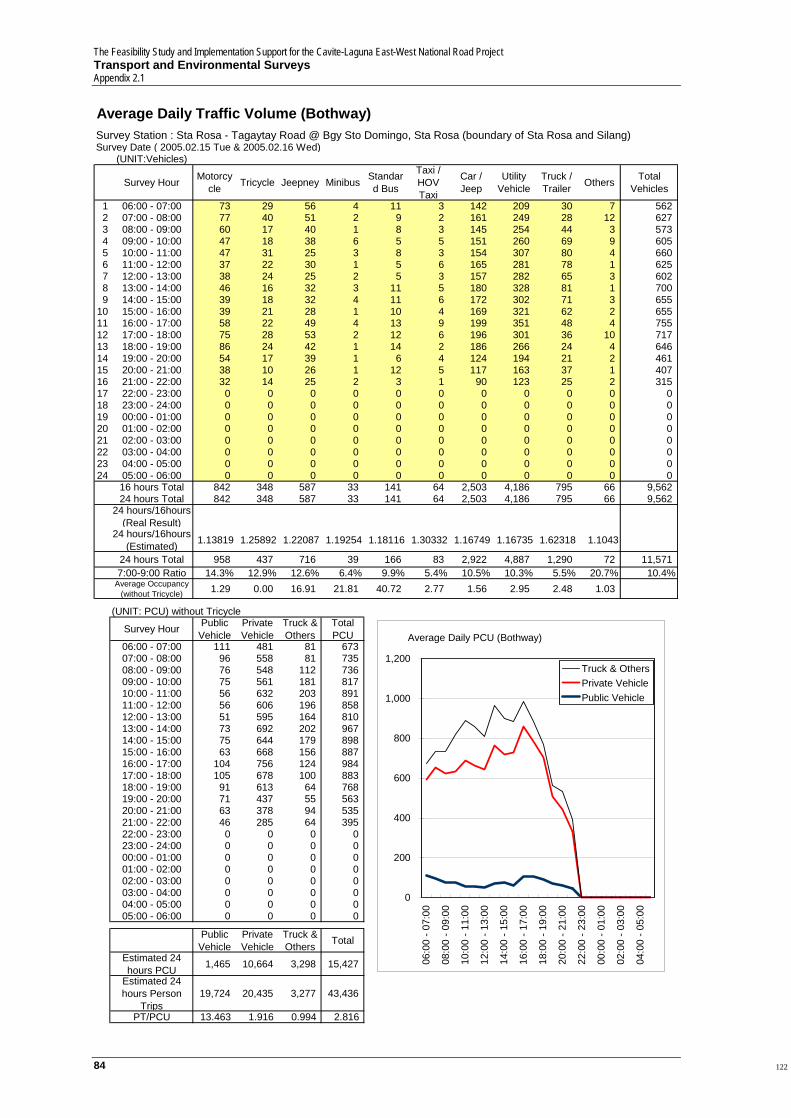
The Feasibility Study and Implementation Support for the Cavite-Laguna East-West National Road Project Transport and Environmental Surveys Appendix 2.1
84
Average Daily Traffic Volume (Bothway)Survey Station : Sta Rosa - Tagaytay Road @ Bgy Sto Domingo, Sta Rosa (boundary of Sta Rosa and Silang)Survey Date ( 2005.02.15 Tue & 2005.02.16 Wed)
(UNIT:Vehicles)
Survey Hour Motorcycle Tricycle Jeepney Minibus Standar
d Bus
Taxi /HOV Taxi
Car / Jeep
Utility Vehicle
Truck / Trailer Others Total
Vehicles
1 06:00 - 07:00 73 29 56 4 11 3 142 209 30 7 5622 07:00 - 08:00 77 40 51 2 9 2 161 249 28 12 6273 08:00 - 09:00 60 17 40 1 8 3 145 254 44 3 5734 09:00 - 10:00 47 18 38 6 5 5 151 260 69 9 6055 10:00 - 11:00 47 31 25 3 8 3 154 307 80 4 6606 11:00 - 12:00 37 22 30 1 5 6 165 281 78 1 6257 12:00 - 13:00 38 24 25 2 5 3 157 282 65 3 6028 13:00 - 14:00 46 16 32 3 11 5 180 328 81 1 7009 14:00 - 15:00 39 18 32 4 11 6 172 302 71 3 655
10 15:00 - 16:00 39 21 28 1 10 4 169 321 62 2 65511 16:00 - 17:00 58 22 49 4 13 9 199 351 48 4 75512 17:00 - 18:00 75 28 53 2 12 6 196 301 36 10 71713 18:00 - 19:00 86 24 42 1 14 2 186 266 24 4 64614 19:00 - 20:00 54 17 39 1 6 4 124 194 21 2 46115 20:00 - 21:00 38 10 26 1 12 5 117 163 37 1 40716 21:00 - 22:00 32 14 25 2 3 1 90 123 25 2 31517 22:00 - 23:00 0 0 0 0 0 0 0 0 0 0 018 23:00 - 24:00 0 0 0 0 0 0 0 0 0 0 019 00:00 - 01:00 0 0 0 0 0 0 0 0 0 0 020 01:00 - 02:00 0 0 0 0 0 0 0 0 0 0 021 02:00 - 03:00 0 0 0 0 0 0 0 0 0 0 022 03:00 - 04:00 0 0 0 0 0 0 0 0 0 0 023 04:00 - 05:00 0 0 0 0 0 0 0 0 0 0 024 05:00 - 06:00 0 0 0 0 0 0 0 0 0 0 0
16 hours Total 842 348 587 33 141 64 2,503 4,186 795 66 9,56224 hours Total 842 348 587 33 141 64 2,503 4,186 795 66 9,562
24 hours/16hours (Real Result)
24 hours/16hours (Estimated) 1.13819 1.25892 1.22087 1.19254 1.18116 1.30332 1.16749 1.16735 1.62318 1.1043
24 hours Total 958 437 716 39 166 83 2,922 4,887 1,290 72 11,5717:00-9:00 Ratio 14.3% 12.9% 12.6% 6.4% 9.9% 5.4% 10.5% 10.3% 5.5% 20.7% 10.4%
Average Occupancy (without Tricycle) 1.29 0.00 16.91 21.81 40.72 2.77 1.56 2.95 2.48 1.03
(UNIT: PCU) without Tricycle
Survey Hour Public Vehicle
Private Vehicle
Truck & Others
Total PCU
06:00 - 07:00 111 481 81 67307:00 - 08:00 96 558 81 73508:00 - 09:00 76 548 112 73609:00 - 10:00 75 561 181 81710:00 - 11:00 56 632 203 89111:00 - 12:00 56 606 196 85812:00 - 13:00 51 595 164 81013:00 - 14:00 73 692 202 96714:00 - 15:00 75 644 179 89815:00 - 16:00 63 668 156 88716:00 - 17:00 104 756 124 98417:00 - 18:00 105 678 100 88318:00 - 19:00 91 613 64 76819:00 - 20:00 71 437 55 56320:00 - 21:00 63 378 94 53521:00 - 22:00 46 285 64 39522:00 - 23:00 0 0 0 023:00 - 24:00 0 0 0 000:00 - 01:00 0 0 0 001:00 - 02:00 0 0 0 002:00 - 03:00 0 0 0 003:00 - 04:00 0 0 0 004:00 - 05:00 0 0 0 005:00 - 06:00 0 0 0 0
Public Vehicle
Private Vehicle
Truck & Others Total
Estimated 24 hours PCU 1,465 10,664 3,298 15,427
Estimated 24 hours Person
Trips19,724 20,435 3,277 43,436
PT/PCU 13.463 1.916 0.994 2.816
Average Daily PCU (Bothway)
0
200
400
600
800
1,000
1,200
06:0
0 - 0
7:00
08:0
0 - 0
9:00
10:0
0 - 1
1:00
12:0
0 - 1
3:00
14:0
0 - 1
5:00
16:0
0 - 1
7:00
18:0
0 - 1
9:00
20:0
0 - 2
1:00
22:0
0 - 2
3:00
00:0
0 - 0
1:00
02:0
0 - 0
3:00
04:0
0 - 0
5:00
Truck & OthersPrivate VehiclePublic Vehicle
122