Embed Size (px)
Citation preview

1 | P a g e
2 | P a g e
piScama xao~Iya Baar p`oYaNa koMd` kI
अगस्त 2017
maah kI p`NaalaI p`caalana irpaoT-
System Operation Report Of Western
Region
For the month of
August-2017
पावर सिस्टम ऑपरेशन कारपोरेशन सिसमटेड
(भारत िरकार का उद्यम)
पश्चिम के्षत्रिय भार प्रषेण केन्द्र,ममु्बई
Power System Operation Corporation Ltd. (A Government of India Enterprise)
Western Regional Load Despatch Centre, Mumbai
3 | P a g e
CONTENTS
1. SUMMARY REPORT
1.1 HIGHLIGHTS OF THE WR GRID
1.2 INSTALLED CAPACITY
1.3 POWER SUPPLY POSITION
1.4 WR DEMAND AND ENERGY CONSUMPTION
1.5 SEASONAL VARIATION
1.6 FREQUENCY PROFILE
1.7 VOLTAGE PROFILE
1.8 ADDITION OF NEW ELEMENTS
a) GENERATING UNITS
b) TRANSMISSION LINES
c) ICTs
d) LINE REACTORS
e) BUS REACTORS
1.9 SCHEDULE Vs DRAWAL
1.10 GENERATION (UNIT) OUTAGES
1.11 GENERATION (WIND,SOLAR)
1.12 INTERREGIONAL EXCHANGE
1.13 Payments to the RRAS Provider(s) from the DSM Pool for UP Regulation
1.14 REVISED AUFLS SCHEME
1.15 PROGRESS OF NEW GENERATION AND TRANSMISSION PROJECTS
1.16 OPEN ACCESS TRANSACTIONS
1.17 List of Grid Disturbances and Grid incidents 2. ANNEXURES
2.1 LOAD DURATION CURVE
2.2 FREQUENCY DURATION CURVE
2.3 LOAD CURVE ON PEAK DEMAND DAY AND MINIMUM DEMAND DAY
2.4 UNITWISE INSTALLED CAPACITY
2.5 ANGULAR SEPARATION VIOLATION REPORT
2.6 SYSTEM RELIABILITY INDICES (ATC/TTC AND VDI) MONTHLY REPORT 2017-18:

4 | P a g e
1.1 Western Region Highlights Aug-2017
Power Supply Position:
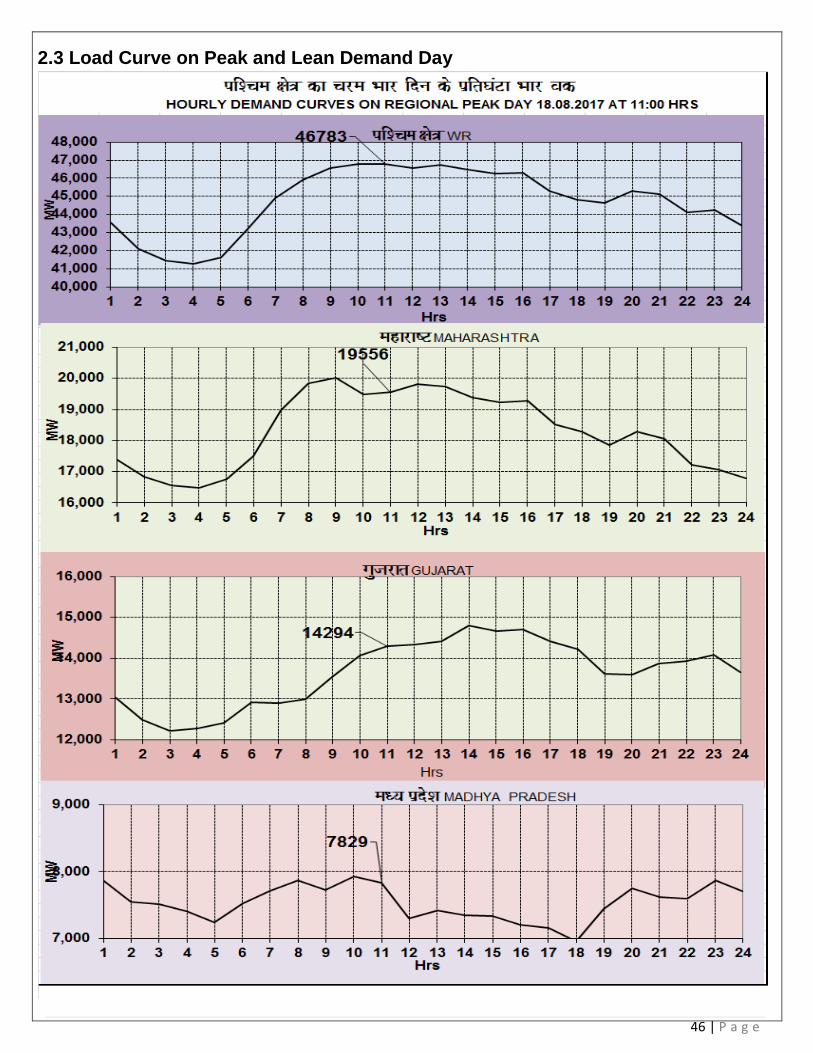
(i) Unrestricted Demand: The maximum unrestricted Demand was 46838 MW at 10:00 Hrs on 18
Aug.’17 which was 11.89 % higher as compared to last year (41861 MW). Average peak
unrestricted demand was 39817 MW which was 11.23% higher than the last year Aug.’16 (35797).
(ii) Peak Demand Met: Western Region has met gross peak demand of 46783MW at 10:00 Hrs on
18 Aug’17. It was 12.34 % higher as compared to Aug’16 (41642MW) and 8.8% higher as
compared to July’17 (42999 MW). Average Demand Met (39812 MW) increased by 11.25 %
compared to last year Aug’16(35786 MW).
(iii) Total Energy Consumption was 26620 MUs in the month of Aug.’17 at the average of 955 MUs/day
& Maximum was 1069 MUs on 18 Aug’17. Average Energy consumption increased by 11.25%
w.r.t. last year (859 MUs).
(iv) Total Energy requirement was 26624 MUs at the average of 956 MUs/day & Maximum was 1069
MUs on 18 Aug’17. Average energy requirement increased by 11.23% compared to last year of
same month (910 MUs).
Frequency Profile:
System frequency remained in IEGC band (49.9 – 50.05 Hz) for 76.99 % of time in this month. Average
frequency for this month was 49.99 Hz and frequency deviation index was 0.23. Maximum frequency of
50.20 Hz was observed on 20-Aug-’17 at 06:03:30 hrs. Minimum frequency of 49.65 Hz was observed on
on 08-Aug-2017 at 20:56:40hrs at Peak Demand time and also due to OD of UP, AP, TN, HP and
Assam. Available RRAS was also dispatched to counter low frequency.
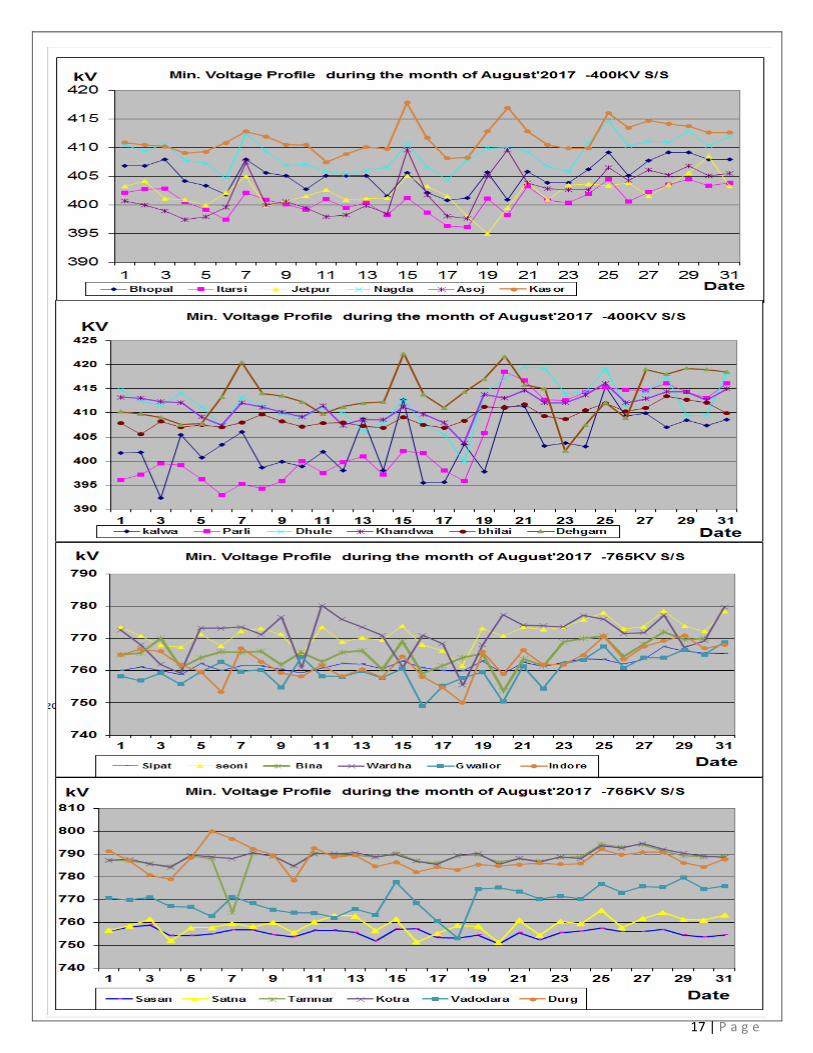
Voltage Profile:
All 765KV nodes except Durg, Kotra and Tamnar(high voltage node) of WR were within the IEGC limit . High Voltage (greater than 420 KV) at 400KV substations were observed at Khandwa, Raigarh, Wardha, Dhule, Parli, Kalwa, Karad, Dehgham, Kasor, Amreli and Mapusa. Highest of 83.32% of time above 420KV observed at Raigarh

5 | P a g e
Element Addition in Aug’17 into the WR Grid:
o Essar Mahan-2(600MW) and RKM-3(360MW) synchronized in the month of Aug’17
o 220KV Betul(PG)-Betul(MP) ckt I & II is synchronized in the grid on 3rd Aug’17
o 315MVA, 400/220KV ICT I and II are added in the grid in the month of Aug’17.
o 240MVAR Capacity Line Reactor of 765KV Aurangabad(PG)-Solapur I at Aurangabad(PG) is
added in grid.
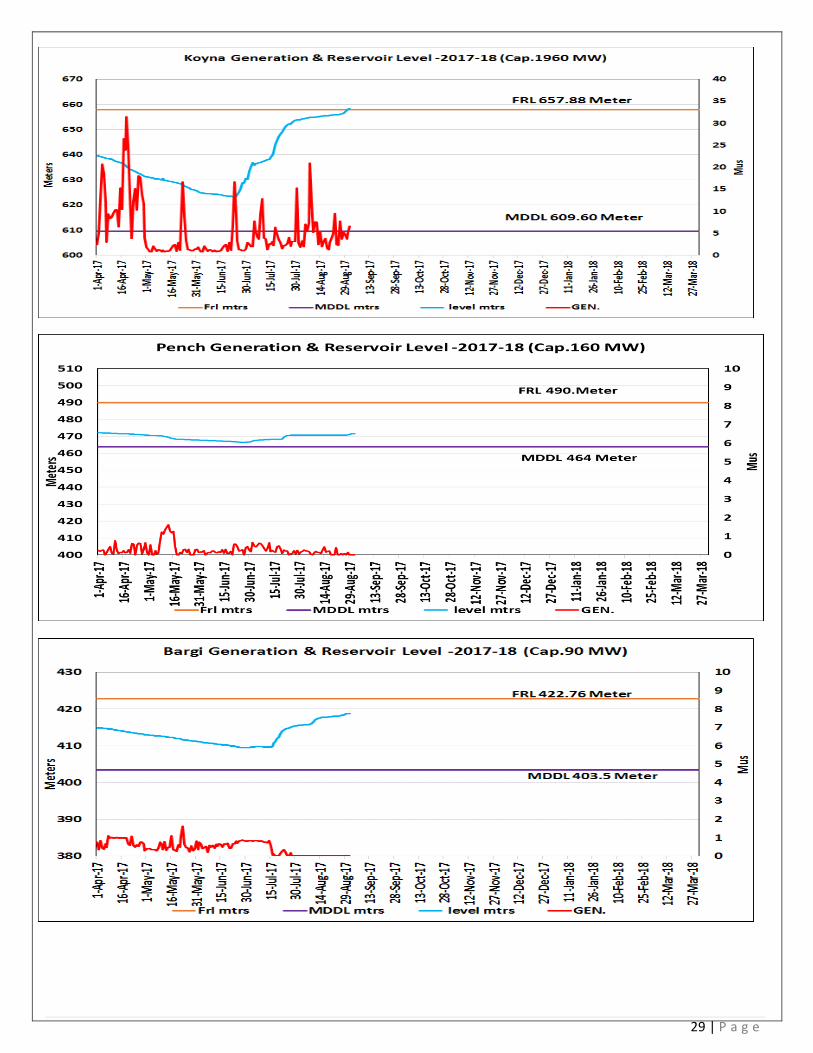
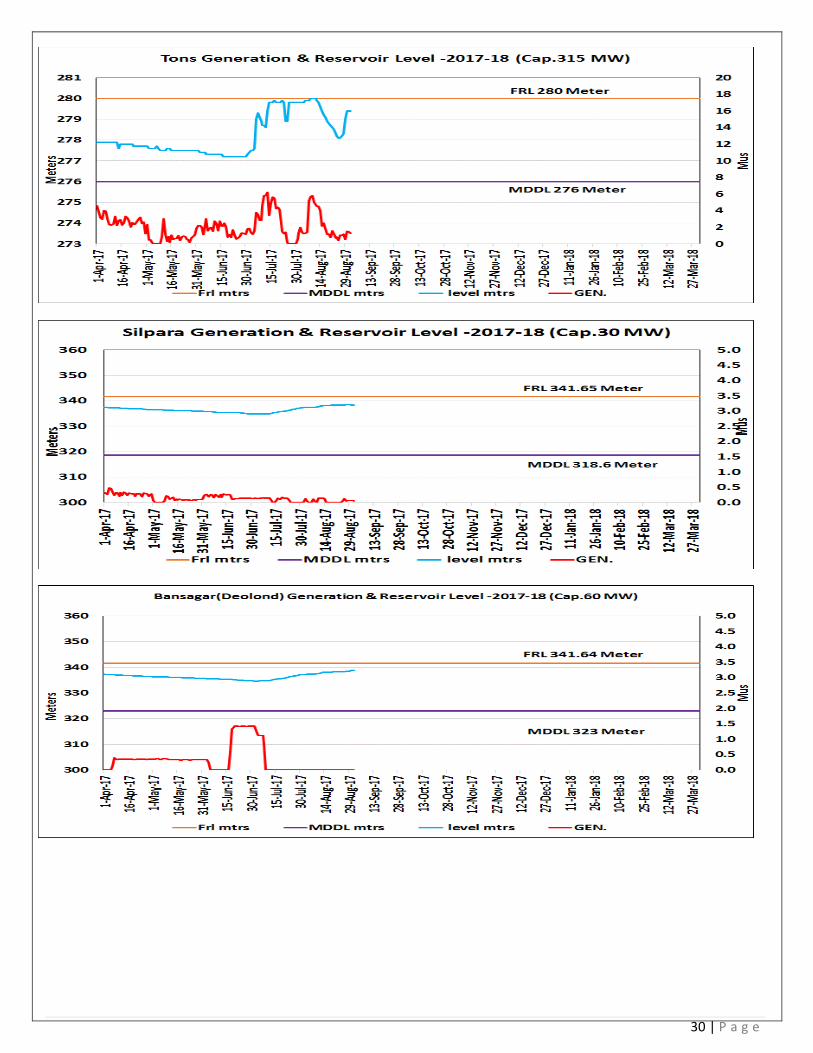
Hydro Generation:
Hydro generation in the month of Aug’17 was 647.67MUs at the average of 20.89 MUs/day. Hydro
generation Decreased by 8.80 % compared to last month (710.19 MUs). Maximum hydro generation was
37.67 Mus on 8th Aug.'17.
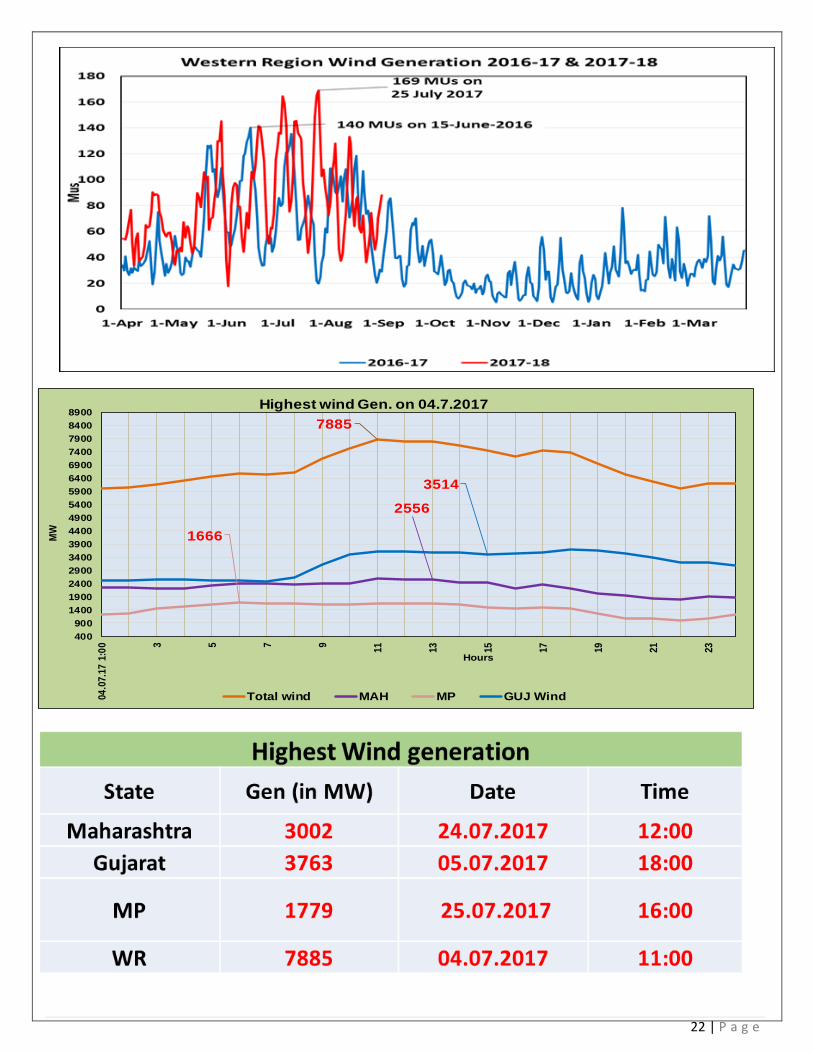
Wind Generation:
Total wind generation in the month was 2321.9 Mus at the average of 74.9 MUs/day in the month of
Aug’17. Wind Generation was Decreased by 34.30% compared to last month (3534 MUs). In Western
region, the maximum wind generation of 6475 MW was observed on 04h Aug.’17 at 14:00 hrs. Max
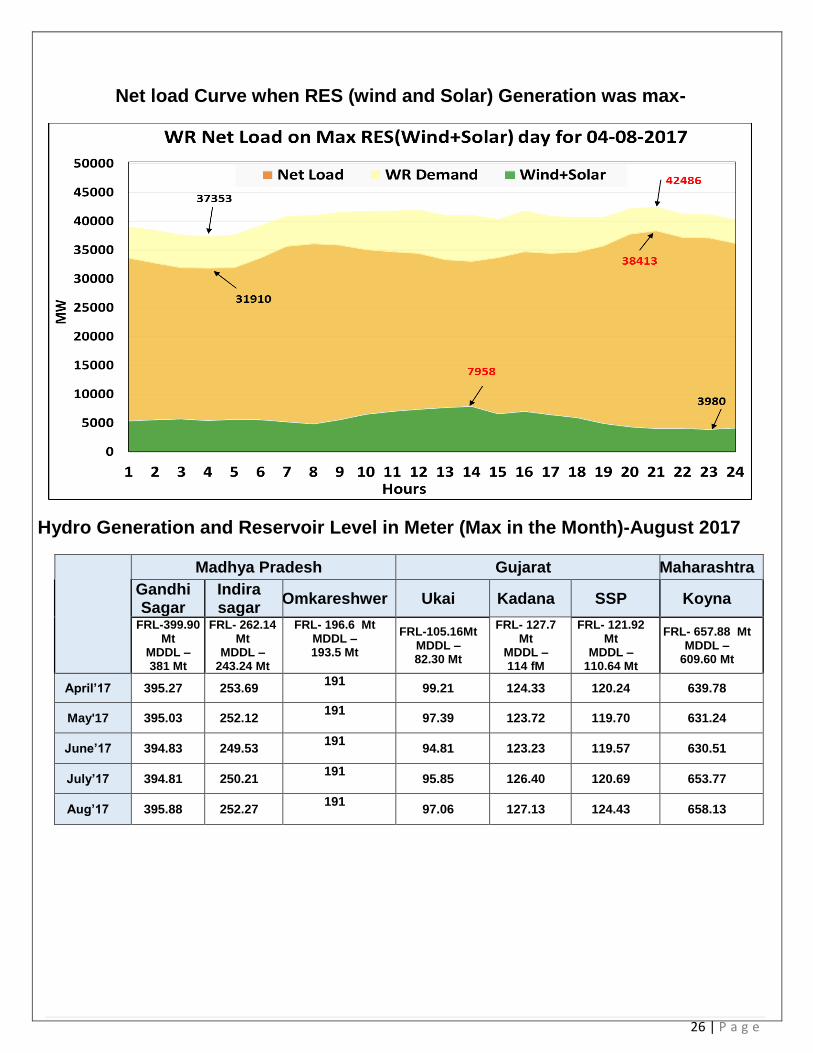
Renewable generation (wind +solar) of 7958 MW achieved in Aug’17 on 04h Aug’17 at 14:00.
Solar Generation:
Solar Generation of 312 Mus generated in the month of Aug’17 at the average of 10 MUs/day
compared to 245 MUs in last month (average of 8 Mus/day). Maximum Solar generation in the month
of Aug’17 achieved 1746 MW on 17th Aug.’17 at 13:00Hrs in WR.
Open Access:
Total 434 Nos. of Intra-regional & Inter-regional short term open access transactions for 829.11 MUs
energy were approved in this month. From Apr’17 to Aug.’17, total Nos of Intra-regional & Inter-regional
short term open access transactions are 2042 Nos and energy approved is 4998.69 MUs.
6 | P a g e
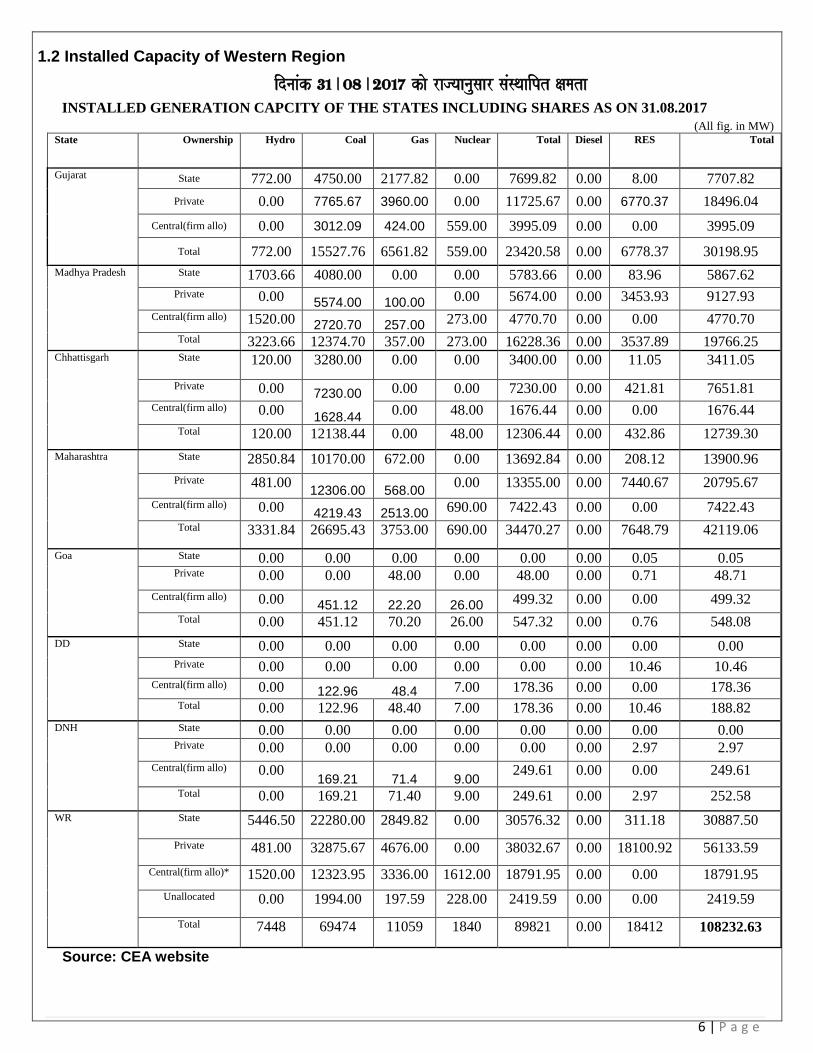
1.2 Installed Capacity of Western Region
idnaaMk 31.08.2017 kao rajyaanausaar saMsqaaipt xamata
INSTALLED GENERATION CAPCITY OF THE STATES INCLUDING SHARES AS ON 31.08.2017
(All fig. in MW) State Ownership Hydro Coal Gas Nuclear Total Diesel RES Total
Gujarat State 772.00 4750.00 2177.82 0.00 7699.82 0.00 8.00 7707.82
Private 0.00 7765.67 3960.00 0.00 11725.67 0.00 6770.37 18496.04
Central(firm allo) 0.00 3012.09 424.00 559.00 3995.09 0.00 0.00 3995.09
Total 772.00 15527.76 6561.82 559.00 23420.58 0.00 6778.37 30198.95
Madhya Pradesh State 1703.66 4080.00 0.00 0.00 5783.66 0.00 83.96 5867.62
Private 0.00 5574.00 100.00 0.00 5674.00 0.00 3453.93 9127.93
Central(firm allo) 1520.00 2720.70 257.00 273.00 4770.70 0.00 0.00 4770.70
Total 3223.66 12374.70 357.00 273.00 16228.36 0.00 3537.89 19766.25 Chhattisgarh State 120.00 3280.00 0.00 0.00 3400.00 0.00 11.05 3411.05
Private 0.00 7230.00 0.00 0.00 7230.00 0.00 421.81 7651.81
Central(firm allo) 0.00 1628.44
0.00 48.00 1676.44 0.00 0.00 1676.44
Total 120.00 12138.44 0.00 48.00 12306.44 0.00 432.86 12739.30
Maharashtra State 2850.84 10170.00 672.00 0.00 13692.84 0.00 208.12 13900.96
Private 481.00 12306.00 568.00
0.00 13355.00 0.00 7440.67 20795.67
Central(firm allo) 0.00 4219.43 2513.00 690.00 7422.43 0.00 0.00 7422.43
Total 3331.84 26695.43 3753.00 690.00 34470.27 0.00 7648.79 42119.06
Goa State 0.00 0.00 0.00 0.00 0.00 0.00 0.05 0.05 Private 0.00 0.00 48.00 0.00 48.00 0.00 0.71 48.71
Central(firm allo) 0.00 451.12 22.20 26.00 499.32 0.00 0.00 499.32
Total 0.00 451.12 70.20 26.00 547.32 0.00 0.76 548.08
DD State 0.00 0.00 0.00 0.00 0.00 0.00 0.00 0.00
Private 0.00 0.00 0.00 0.00 0.00 0.00 10.46 10.46
Central(firm allo) 0.00 122.96 48.4 7.00 178.36 0.00 0.00 178.36
Total 0.00 122.96 48.40 7.00 178.36 0.00 10.46 188.82
DNH State 0.00 0.00 0.00 0.00 0.00 0.00 0.00 0.00 Private 0.00 0.00 0.00 0.00 0.00 0.00 2.97 2.97
Central(firm allo) 0.00 169.21 71.4 9.00
249.61 0.00 0.00 249.61
Total 0.00 169.21 71.40 9.00 249.61 0.00 2.97 252.58
WR State 5446.50 22280.00 2849.82 0.00 30576.32 0.00 311.18 30887.50
Private 481.00 32875.67 4676.00 0.00 38032.67 0.00 18100.92 56133.59
Central(firm allo)* 1520.00 12323.95 3336.00 1612.00 18791.95 0.00 0.00 18791.95
Unallocated 0.00 1994.00 197.59 228.00 2419.59 0.00 0.00 2419.59
Total 7448 69474 11059 1840 89821 0.00 18412 108232.63
Source: CEA website
7 | P a g e
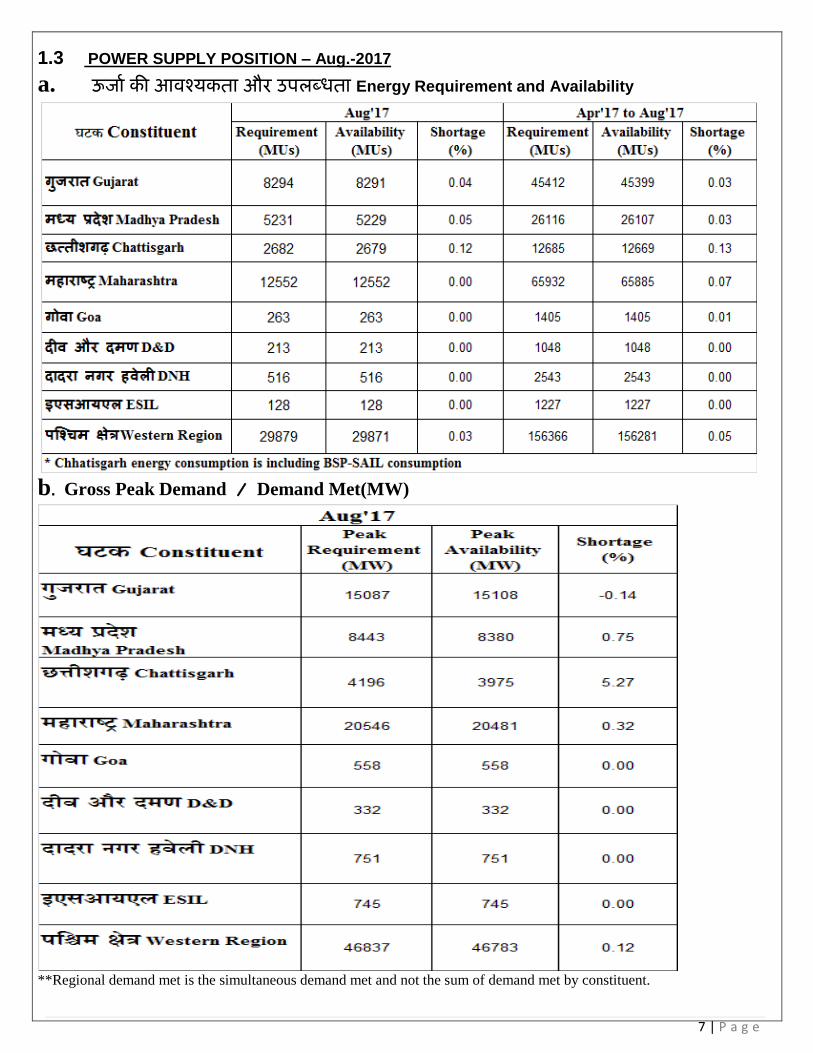
1.3 POWER SUPPLY POSITION – Aug.-2017
a. ऊर्ाा की आवश्यकता और उपिब्धता Energy Requirement and Availability
b. Gross Peak Demand / Demand Met(MW)
**Regional demand met is the simultaneous demand met and not the sum of demand met by constituent.
8 | P a g e
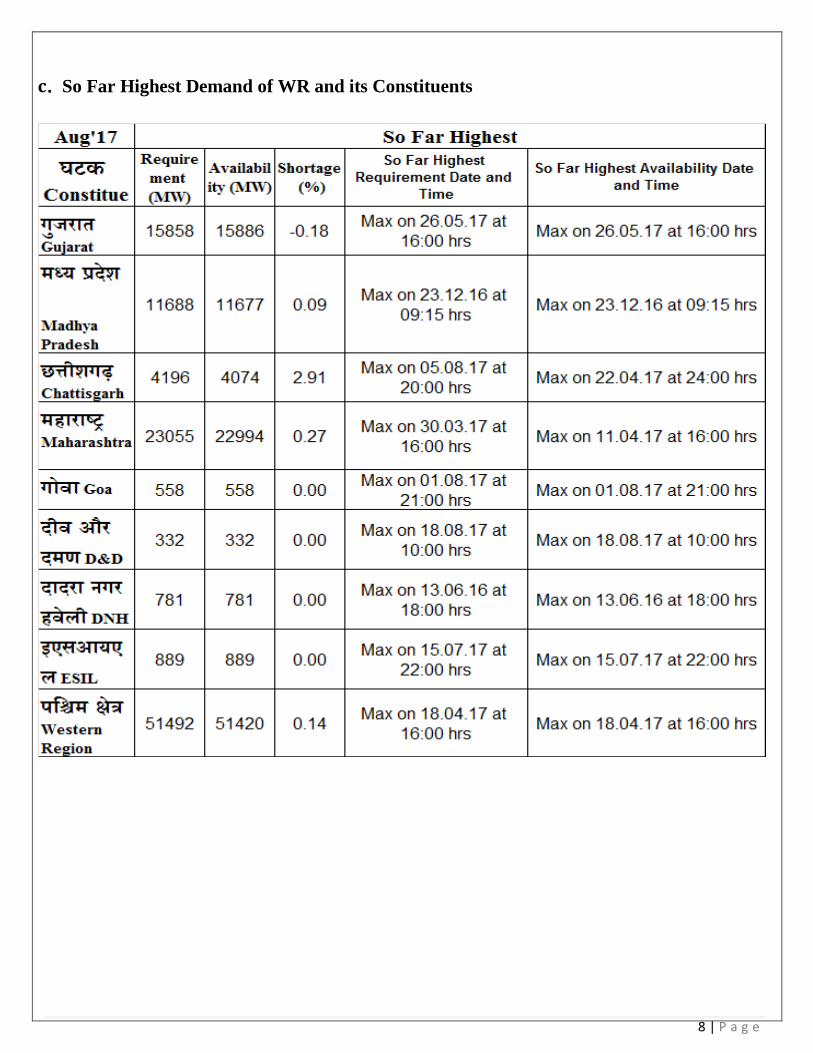
c. So Far Highest Demand of WR and its Constituents
9 | P a g e
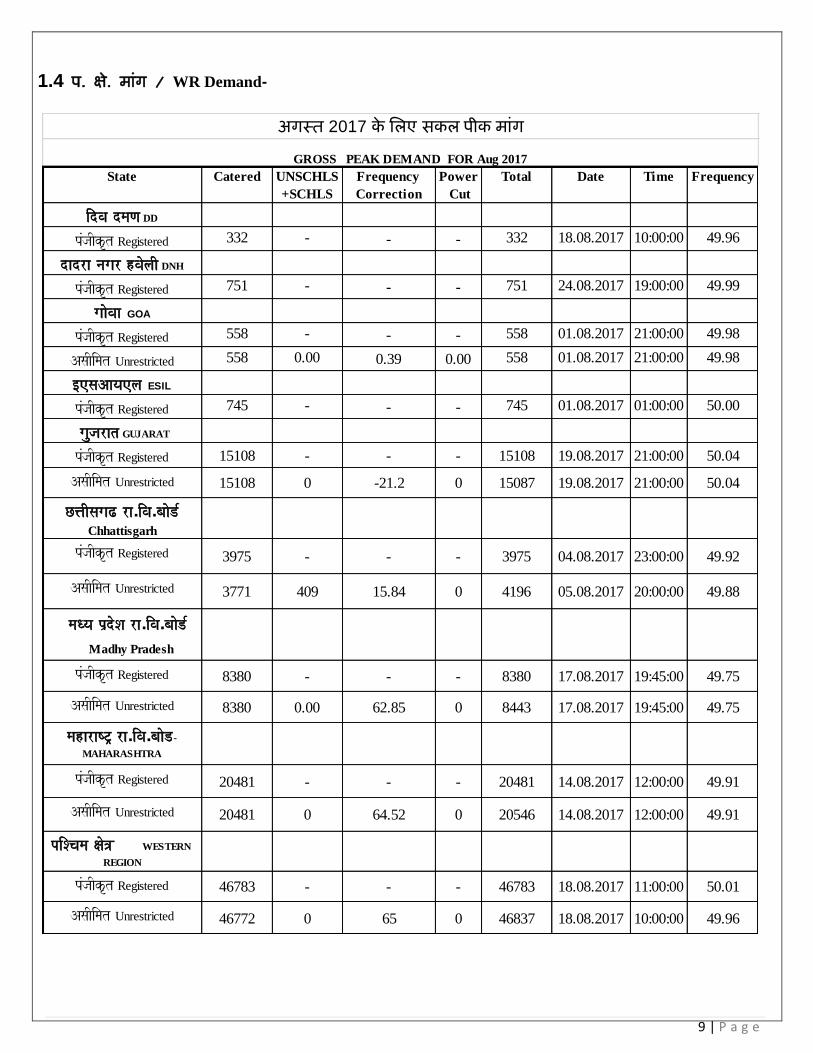
1.4 प. के्ष. माांग / WR Demand-
State Catered UNSCHLS
+SCHLS
Frequency
Correction
Power
Cut
Total Date Time Frequency
idva dmaNa DD
pMjaIkRt Registered 332 - - - 332 18.08.2017 10:00:00 49.96
dadra nagar hvaolaI DNH
pMjaIkRt Registered 751 - - - 751 24.08.2017 19:00:00 49.99
gaaov aa GOA
pMjaIkRt Registered 558 - - - 558 01.08.2017 21:00:00 49.98
AsaIimat Unrestricted 558 0.00 0.39 0.00 558 01.08.2017 21:00:00 49.98
[esaAayaela ESIL
pMjaIkRt Registered 745 - - - 745 01.08.2017 01:00:00 50.00
gaujarat GUJARAT
pMjaIkRt Registered 15108 - - - 15108 19.08.2017 21:00:00 50.04
AsaIimat Unrestricted 15108 0 -21.2 0 15087 19.08.2017 21:00:00 50.04
C<aIsagaZ ra.iva.baaoD -
Chhattisgarh
pMjaIkRt Registered 3975 - - - 3975 04.08.2017 23:00:00 49.92
AsaIimat Unrestricted 3771 409 15.84 0 4196 05.08.2017 20:00:00 49.88
maQya pd̀ oSa ra.iva.baaoD -
Madhy Pradesh
pMjaIkRt Registered 8380 - - - 8380 17.08.2017 19:45:00 49.75
AsaIimat Unrestricted 8380 0.00 62.85 0 8443 17.08.2017 19:45:00 49.75
m aharaYT/ ra.iva.baaoD-
MAHARASHTRA
pMjaIkRt Registered 20481 - - - 20481 14.08.2017 12:00:00 49.91
AsaIimat Unrestricted 20481 0 64.52 0 20546 14.08.2017 12:00:00 49.91
piScam a xao~ WESTERN
REGION
pMjaIkRt Registered 46783 - - - 46783 18.08.2017 11:00:00 50.01
AsaIimat Unrestricted 46772 0 65 0 46837 18.08.2017 10:00:00 49.96
अगस्त 2017 के सिए िकि पीक माांग GROSS PEAK DEMAND FOR Aug 2017

10 | P a g e
Demand Met Aug-17 Jul-17 Aug-16 % Change w.r.t last
month % Change w.r.t
last Year
Average 39812 37226 35786 6.95 11.25
Max 46783 42999 41642 8.80 12.34
Date when Max. 18-Aug-17 10-Jul-17 23-Aug-16 ~ ~
11 | P a g e
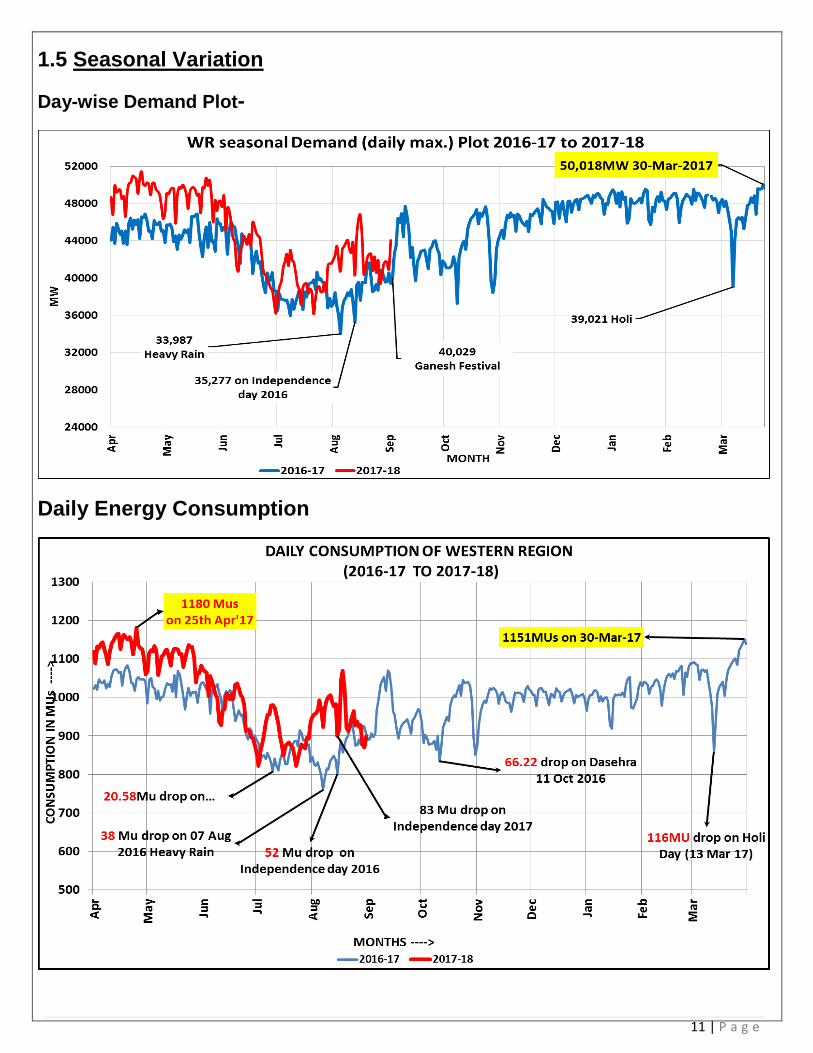
1.5 Seasonal Variation
Day-wise Demand Plot-
Daily Energy Consumption
12 | P a g e
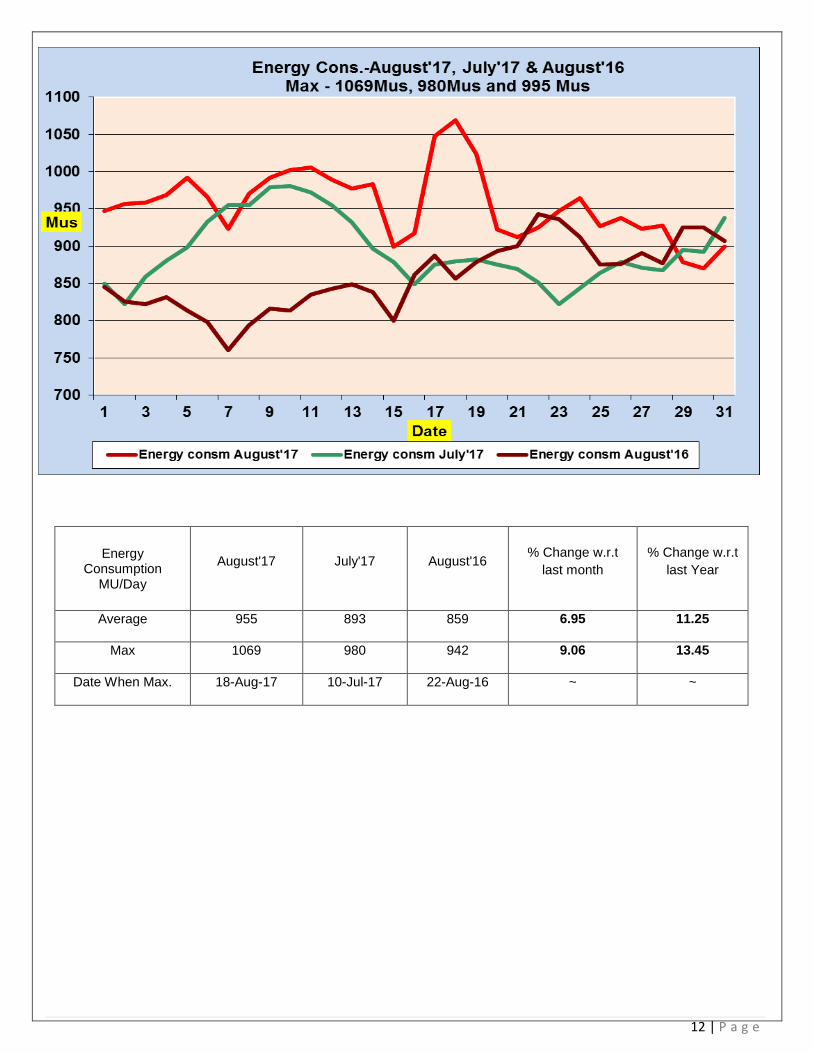
Energy Consumption
MU/Day
August'17 July'17 August'16 % Change w.r.t
last month
% Change w.r.t
last Year
Average 955 893 859 6.95 11.25
Max 1069 980 942 9.06 13.45
Date When Max. 18-Aug-17 10-Jul-17 22-Aug-16 ~ ~

13 | P a g e
1.6 Frequency Profile-
WR monthly FDI 0.23
(i) (ii) (iii)
<49.9 49.9-50.05 >50.05
% of time the
frequency
remained out of
IEGC band
No of hours during
which frequency was
out of range during
the day[(i) x24Hrs]
Daily
FDI=(ii)/24 Max. Min. Avg.
August'17 9.77 77.16 13.07 0.04 22.84 5.48 0.23 50.14 49.69 49.99
2-Aug 3.23 71.20 25.57 0.03 28.80 6.91 0.29 50.17 49.82 50.01
3-Aug 3.66 76.70 19.64 0.03 23.30 5.59 0.23 50.19 49.83 50.00
4-Aug 10.43 77.78 11.79 0.04 22.22 5.33 0.22 50.14 49.68 49.98
5-Aug 18.28 74.32 7.41 0.06 25.68 6.16 0.26 50.13 49.76 49.96
6-Aug 14.90 76.34 8.76 0.05 23.66 5.68 0.24 50.14 49.75 49.97
7-Aug 7.69 82.91 9.41 0.04 17.09 4.10 0.17 50.15 49.74 49.98
8-Aug 20.96 73.44 5.60 0.08 26.56 6.38 0.27 50.12 49.65 49.95
9-Aug 17.36 75.27 7.37 0.06 24.73 5.94 0.25 50.15 49.73 49.96
10-Aug 5.36 76.93 17.71 0.03 23.07 5.54 0.23 50.15 49.83 50.00
11-Aug 1.37 73.53 25.10 0.02 26.47 6.35 0.26 50.16 49.80 50.02
12-Aug 2.56 76.06 21.38 0.03 23.94 5.74 0.24 50.18 49.84 50.01
13-Aug 3.94 84.62 11.45 0.03 15.38 3.69 0.15 50.14 49.83 49.99
14-Aug 16.02 79.70 4.28 0.06 20.30 4.87 0.20 50.12 49.66 49.96
15-Aug 5.10 73.26 21.63 0.03 26.74 6.42 0.27 50.15 49.77 50.00
16-Aug 4.10 77.84 18.07 0.03 22.16 5.32 0.22 50.17 49.80 50.00
17-Aug 14.42 74.69 10.89 0.05 25.31 6.08 0.25 50.16 49.69 49.98
18-Aug 9.27 77.62 13.11 0.04 22.38 5.37 0.22 50.19 49.78 49.98
19-Aug 0.27 65.25 34.48 0.03 34.75 8.34 0.35 50.19 49.85 50.03
20-Aug 1.08 60.80 38.13 0.04 39.20 9.41 0.39 50.20 49.83 50.03
21-Aug 8.96 76.79 14.25 0.04 23.21 5.57 0.23 50.16 49.70 49.99
22-Aug 8.24 78.47 13.29 0.04 21.53 5.17 0.22 50.14 49.76 49.99
23-Aug 6.67 83.44 9.90 0.03 16.56 3.98 0.17 50.15 49.77 49.98
24-Aug 3.26 82.81 13.92 0.03 17.19 4.13 0.17 50.16 49.82 50.00
25-Aug 4.44 81.33 14.22 0.03 18.67 4.48 0.19 50.17 49.75 50.00
26-Aug 5.28 85.21 9.51 0.03 14.79 3.55 0.15 50.14 49.78 49.98
27-Aug 1.99 85.88 12.13 0.02 14.12 3.39 0.14 50.16 49.84 50.00
28-Aug 2.37 74.59 23.03 0.03 25.41 6.10 0.25 50.19 49.81 50.01
29-Aug 1.97 71.16 26.88 0.03 28.84 6.92 0.29 50.20 49.82 50.02
30-Aug 5.54 81.81 12.65 0.03 18.19 4.37 0.18 50.13 49.81 49.99
31-Aug 2.37 79.85 17.78 0.02 20.15 4.84 0.20 50.16 49.83 50.00
Max 20.96 85.88 38.13 0.08 39.20 9.41 0.39
Average 7.12 76.99 15.88 0.04 23.01 5.52 0.23
Frequency Profile for August.2017
Date
50.20(Max) 49.65(Min) 49.99(Avg)
Frequency (%)
FVI
Frequency (Hz)

14 | P a g e

15 | P a g e
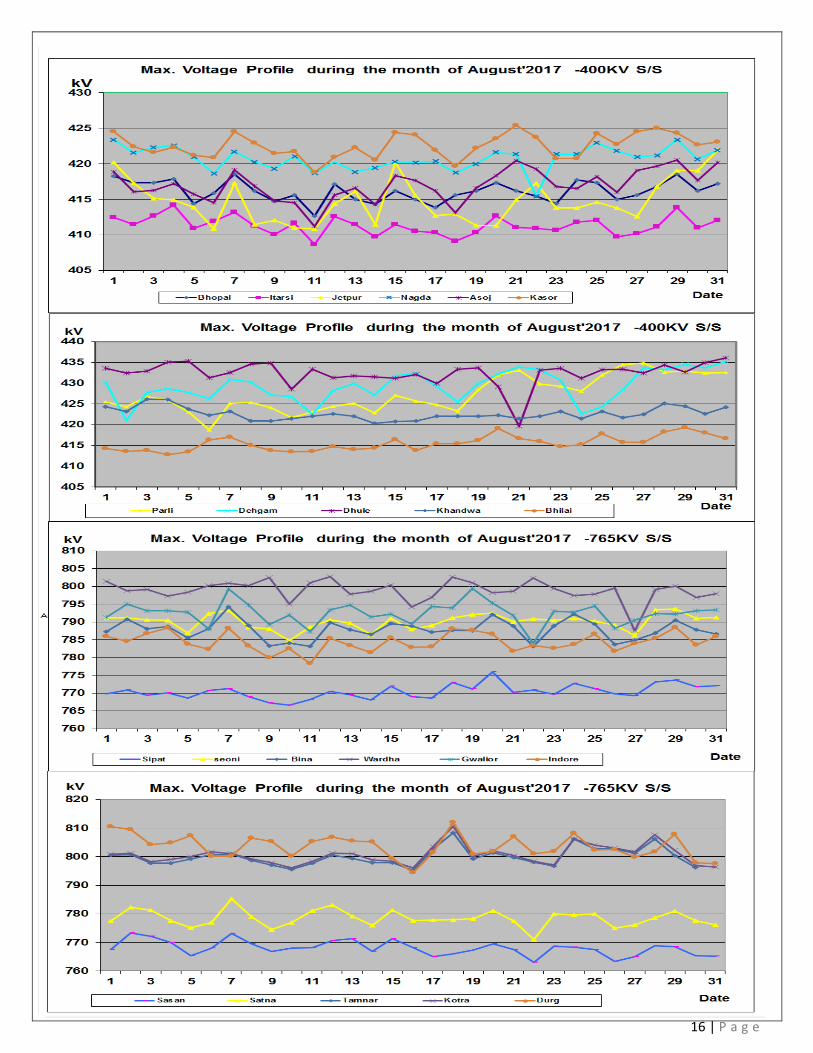
1.7. VoltageProfile-s
From 01-08-2017 TO 31-08-2017
Max Voltage Min Voltage <728 kV728 kV-800
kV>800 kV
No. of
hours
below
IEGC (i)
<728 kV
No. of
hours
above
IEGC
(ii)
>800 kV
1 Sipat 776 759 0.00 100.00 0.00 0:00 0:00 0:00 0.00
2 Seoni 794 761 0.00 100.00 0.00 0:00 0:00 0:00 0.00
3 Wardha 803 755 0.00 99.49 0.51 0:00 3:46 3:46 0.01
4 Bina 794 754 0.00 100.00 0.00 0:00 0:00 0:00 0.00
5 Indore 788 750 0.00 100.00 0.00 0:00 0:00 0:00 0.00
6 Sasan 773 751 0.00 100.00 0.00 0:00 0:00 0:00 0.00
7 Satna 785 751 0.00 100.00 0.00 0:00 0:00 0:00 0.00
8 Tamnar 808 765 0.00 94.69 5.31 0:00 39:30 39:30 0.05
9 Kotra 811 784 0.00 91.93 8.07 0:00 60:03 60:03 0.08
10 Vadodara 801 753 0.00 99.99 0.01 0:00 0:05 0:05 0.00
11 Durg 812 778 0.00 78.79 21.21 0:00 157:49 157:49 0.21
12 Gwalior 799 749 0.00 100.00 0.00 0:00 0:00 0:00 0.00
From 01-08-2017 TO 31-08-2017
Max Voltage Min Voltage <380 kV380 kV-420
kV>420 kV
No. of
hours
below
IEGC (i)
<380 kV
No. of
hours
above
IEGC
(ii)
>420 kV
1 Bhopal 419 401 0.00 100.00 0.00 0:00 0:00 0:00 0.00
2 Khandwa 426 404 0.00 81.40 18.60 0:00 138:21 138:21 0.19
3 Itarsi 414 396 0.00 100.00 0.00 0:00 0:00 0:00 0.00
4 Damoh 422 404 0.00 94.14 5.86 0:00 43:37 43:37 0.06
5 Nagda 423 404 0.00 95.66 4.34 0:00 32:19 32:19 0.04
6 Indore 421 400 0.00 99.76 0.24 0:00 1:46 1:46 0.00
7 Gwalior 417 385 0.00 100.00 0.00 0:00 0:00 0:00 0.00
8 Raipur 422 410 0.00 96.50 3.50 0:00 26:02 26:02 0.03
9 Raigarh 427 411 0.00 16.68 83.32 0:00 619:55 619:55 0.83
10 Bhilai 419 406 0.00 100.00 0.00 0:00 0:00 0:00 0.00
11 Wardha 428 407 0.00 27.72 72.28 0:00 537:48 537:48 0.72
12 Dhule 436 400 0.00 29.00 71.00 0:00 528:16 528:16 0.71
13 Parli 435 393 0.00 60.56 39.44 0:00 293:27 293:27 0.39
14 Boisar 426 390 0.00 95.52 4.48 0:00 33:21 33:21 0.04
15 Kalwa 435 392 0.00 62.40 37.60 0:00 279:44 279:44 0.38
16 Karad 433 407 0.00 27.12 72.88 0:00 542:12 542:12 0.73
17 Asoj 421 391 0.00 99.96 0.04 0:00 0:20 0:20 0.00
18 Dehgam 435 402 0.00 41.51 58.49 0:00 435:10 435:10 0.58
19 Kasor 425 407 0.00 79.53 20.47 0:00 152:19 152:19 0.20
20 Jetpur 422 395 0.00 99.79 0.21 0:00 1:35 1:35 0.00
21 Amreli 428 397 0.00 88.13 11.87 0:00 88:20 88:20 0.12
22 Vapi 428 392 0.00 90.57 9.43 0:00 70:09 70:09 0.09
23 Mapusa 433 391 0.00 70.79 29.21 0:00 217:21 217:21 0.29
24 Kala 425 390 0.00 97.34 2.66 0:00 19:47 19:47 0.03
25 Magarwada 428 390 0.00 92.54 7.46 0:00 55:31 55:31 0.07
26 Hazira 426 391 0.00 96.57 3.43 0:00 25:31 25:31 0.03
Monthly VDI
Voltage Deviation Index (VDI) - 765 kV Substations
S.No Station Name
Voltage (in Volts) Voltage (in % of Time) Voltage (in Time) Total
no. of
hours
out of
IEGC
range
(HH:MM
) (iii)
(i+ii)
Voltage
Deviati
on
Index
(iii)/(Tot
al No.
of
Hours
Monthly VDI
Voltage Deviation Index (VDI) - 400 kV Substations
S.No Station Name
Voltage (in Volts) Voltage (in % of Time) Voltage (in Time)Total
no. of
hours
out of
IEGC
range
(HH:MM
) (iii)
Voltage
Deviati
on
Index
(iii)/(Tot
al No.
of
16 | P a g e
17 | P a g e

18 | P a g e
1.8 Commissioning of New Elements
Commissioning of New Elements-Aug 2017
a)Generating Units
Sl. No. Owner/ Location(Const.) Station Name Capacity (MW) Unit No.Date of
SynchronizationDate of COD
1 Essar, MP Essar Mahan 600 2 03-08-2017
4 RKMPPL, Chhattisgahrh RKM 360 3 31-08-2017
b)Transmission Lines
Sl. No. Owner/ Location(Const.) Line Name Ckt No. KVDate of
SynchronizationLine Length (in Km)
1 MPPTCL,MP Betul-Betul I 220 03-08-2017 2
2 MPPTCL,MP Betul-Betul II 220 03-08-2017 2
3 MPPTCL,MP Itarsi(MP)-Itarsi(PG)-II 220 12-08-2017 -
4 MPPTCL,MP Itarsi(PG)-Hoshangabad-II 220 12-08-2017 -
5 MPPTCL,MP Damoh(MP)-Damoh(PG)-III 220 28-08-2017 -
6 MPPTCL,MP Damoh(PG)-Sagar-II 220 29-08-2017 -
Total 4
c)ICTs
Sl. No. Owner/ Location(Const.) Station Name KV RatioCapacity
(MVA)Date
1 PGCIL,MP Betul ICT-1 400/220 315 03-08-2017
2 PGCIL,MP Betul ICT-2 400/220 315 22-08-2017
d)Line Reactor
Sl. No. Owner/ Location(Const.) Station Name Line Name KV Capacity
(MVAR)Date
1 PGCIL,Maharashtra Aurangabad(PG) Aurangabad(PG)-Solapur I 765 240 23-08-2017
e)Bus Reactor
Sl. No. Constituent Station Name KV Capacity
(MVAR)Date
1 PGCIL,MP Betul 400 125
LILO of Itarsi(MP)-
Hoshangabad ckt at
Itarsi(PG)
LILO of Damoh(MP)-Sagar
line at Damoh(PG)

19 | P a g e
1.9 Schedule Vs Drawl of Western Region-Aug.’17

20 | P a g e
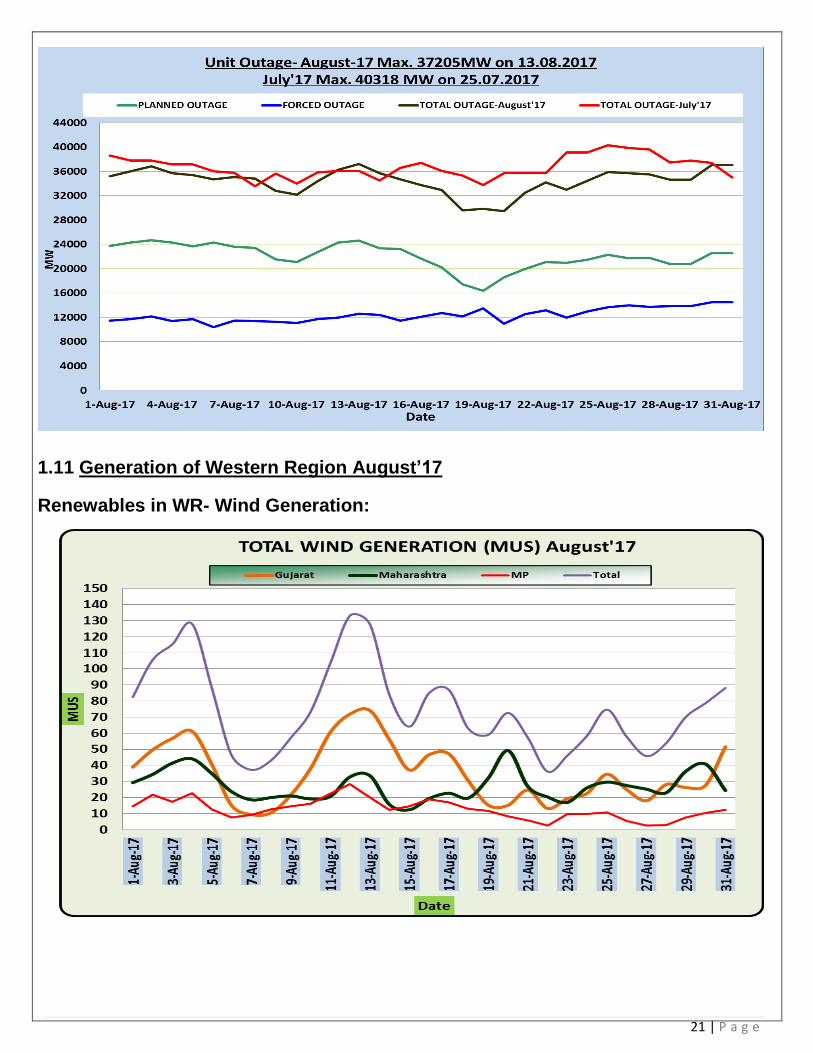
1.10 Generation Outages:
UNIT OUTAGES (in MW) IN August-17
DATE PLANNED OUTAGE FORCED OUTAGETOTAL OUTAGE-
August'17TOTAL OUTAGE-July'17
1-Aug-17 23749 11461 35210 38599
2-Aug-17 24322 11708 36030 37769
3-Aug-17 24650 12168 36818 37798
4-Aug-17 24320 11373 35693 37137
5-Aug-17 23700 11699 35399 37156
6-Aug-17 24309 10398 34707 36038
7-Aug-17 23634 11428 35062 35761
8-Aug-17 23424 11403 34827 33531
9-Aug-17 21534 11263 32797 35656
10-Aug-17 21105 11053 32158 34011
11-Aug-17 22705 11693 34398 35829
12-Aug-17 24280 11953 36233 36099
13-Aug-17 24592 12613 37205 36099
14-Aug-17 23326 12378 35704 34477
15-Aug-17 23207 11483 34690 36572
16-Aug-17 21632 12083 33715 37382
17-Aug-17 20204 12698 32902 36102
18-Aug-17 17423 12138 29561 35296
19-Aug-17 16350 13488 29838 33757
20-Aug-17 18549 10921 29470 35676
21-Aug-17 19951 12553 32504 35676
22-Aug-17 21064 13150 34214 35676
23-Aug-17 20989 11983 32972 39123
24-Aug-17 21490 12943 34433 39113
25-Aug-17 22256 13643 35899 40318
26-Aug-17 21736 13976 35712 39824
27-Aug-17 21808 13711 35519 39596
28-Aug-17 20794 13856 34650 37476
29-Aug-17 20794 13856 34650 37799
30-Aug-17 22535 14491 37026 37383
31-Aug-17 22535 14483 37027 35000
MAX 24650 14491 37205 40318
AVG 22031 12389 34420 36701
21 | P a g e
1.11 Generation of Western Region August’17
Renewables in WR- Wind Generation:
22 | P a g e
7885
2556
1666
3514
400
900
1400
1900
2400
2900
3400
3900
4400
4900
5400
5900
6400
6900
7400
7900
8400
8900
04.0
7.17
1:0
0 3 5 7 9
11 13 15 17 19 21 23
MW
Hours
Highest wind Gen. on 04.7.2017
Total wind MAH MP GUJ Wind
23 | P a g e
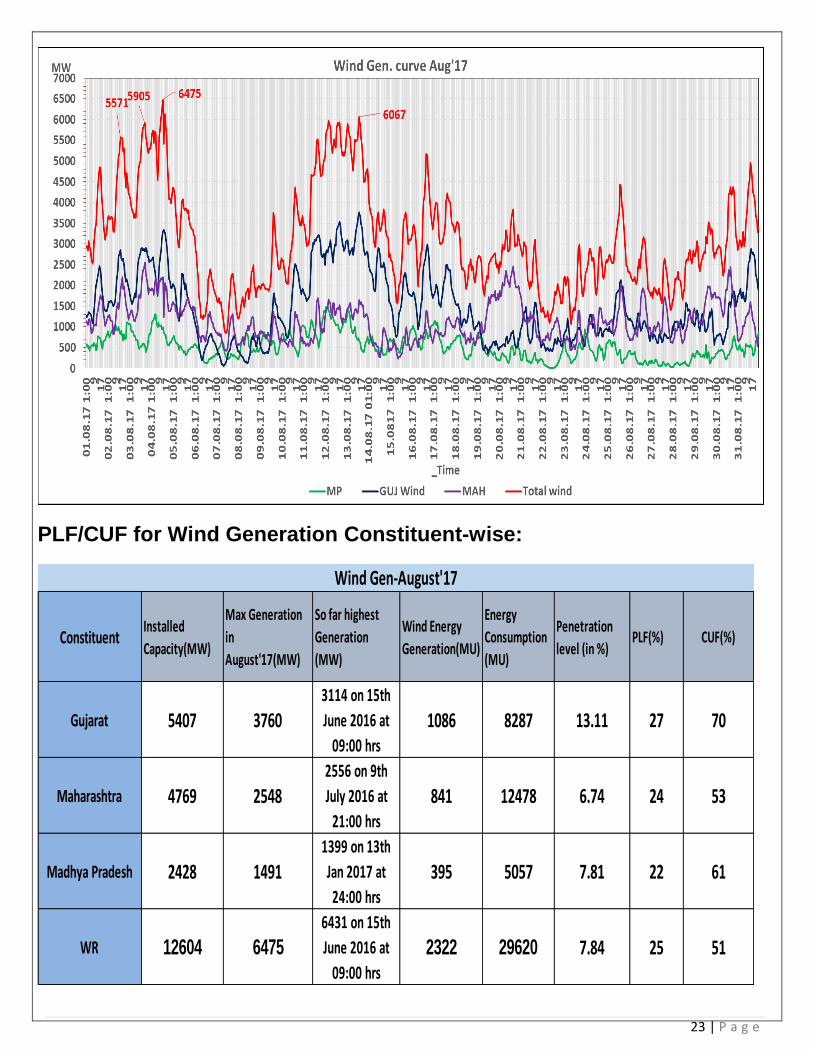
PLF/CUF for Wind Generation Constituent-wise:
ConstituentInstalled
Capacity(MW)
Max Generation
in
August'17(MW)
So far highest
Generation
(MW)
Wind Energy
Generation(MU)
Energy
Consumption
(MU)
Penetration
level (in %)PLF(%) CUF(%)
Gujarat 5407 37603114 on 15th
June 2016 at
09:00 hrs
1086 8287 13.11 27 70
Maharashtra 4769 25482556 on 9th
July 2016 at
21:00 hrs
841 12478 6.74 24 53
Madhya Pradesh 2428 14911399 on 13th
Jan 2017 at
24:00 hrs
395 5057 7.81 22 61
WR 12604 6475
6431 on 15th
June 2016 at
09:00 hrs
2322 29620 7.84 25 51
Wind Gen-August'17

24 | P a g e
Solar Generation:
So Far Highest Solar Generation on 14.04.2017- 1818 MW at 12:00 hrs. h
Highest Solar generation (as on 31.08.2017)
State Gen (in MW) Date & Time
Gujarat 886 14 Apr 2017 at 12:00 hrs
Maharashtra 319 19 June 2017 at 12:00 hrs
MP 734 07 Jul 2017 at 13:00 hrs
WR 1818 14 Apr 2017 at t 12:00 hrs

25 | P a g e
PLF for Solar Generation constituent-wise:
(Generating Hours taken : 12 hrs per day)
Constituent Installed
Capacity(MW)
Max Generation
in
August'17(MW)
So far highest
Generation
(MW)
Solar Energy
Generation(MU)
Energy
Consumption
(MU)
Penetration
level
PLF(%) CUF(%)
Gujarat 1265 785868 on 7th Apr
2016 at 12:00
hrs
131 8287 1.58 28 62
Maharashtra 383 339245 on 20th
Mar 2016 at 54 12478 0.43 38 88
Madhya Pradesh 976 729683 on 24th
Feb 2017 at 119 5057 2.35 33 75
Chhattisgarh 76 52 9 2679 0.34 32 68
WR 2700 1746
1750 on 25th
Feb 2017 at
13:00 hrs
313 29620 1.06 31 65
PLF For Solar Gen-August'17
26 | P a g e
Net load Curve when RES (wind and Solar) Generation was max-
Hydro Generation and Reservoir Level in Meter (Max in the Month)-August 2017
Madhya Pradesh Gujarat Maharashtra
Gandhi Sagar
Indira sagar
Omkareshwer Ukai Kadana SSP Koyna
FRL-399.90 Mt
MDDL – 381 Mt
FRL- 262.14 Mt
MDDL – 243.24 Mt
FRL- 196.6 Mt MDDL – 193.5 Mt
FRL-105.16Mt MDDL – 82.30 Mt
FRL- 127.7 Mt
MDDL – 114 fM
FRL- 121.92 Mt
MDDL – 110.64 Mt
FRL- 657.88 Mt MDDL –
609.60 Mt
April’17 395.27 253.69 191
99.21 124.33 120.24 639.78
May'17 395.03 252.12 191
97.39 123.72 119.70 631.24
June’17 394.83 249.53 191
94.81 123.23 119.57 630.51
July’17 394.81 250.21 191
95.85 126.40 120.69 653.77
Aug’17 395.88 252.27 191
97.06 127.13 124.43 658.13

27 | P a g e

28 | P a g e
29 | P a g e
30 | P a g e

31 | P a g e

32 | P a g e
1.12 Interregional Exchange of Western Region
Import = (+) , Export = (-)

33 | P a g e
1.13 RRAS Summary from Aug.-2017

34 | P a g e
35 | P a g e
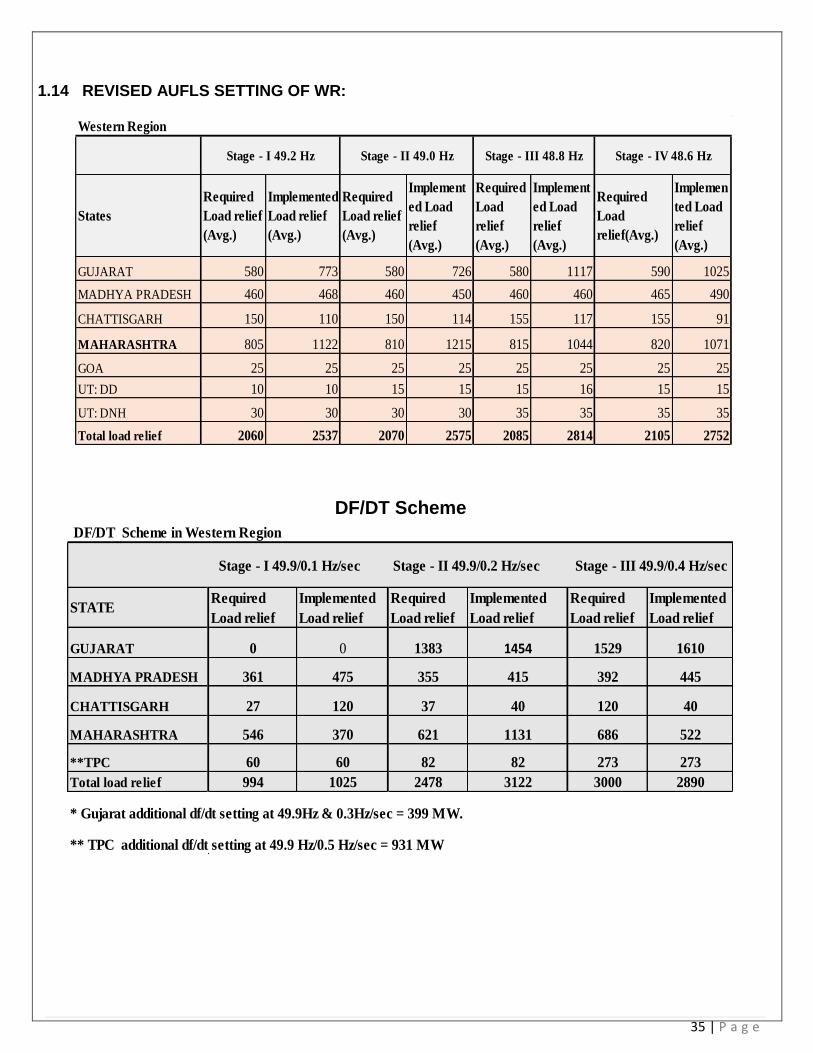
1.14 REVISED AUFLS SETTING OF WR:
DF/DT Scheme
Western Region
States
Required
Load relief
(Avg.)
Implemented
Load relief
(Avg.)
Required
Load relief
(Avg.)
Implement
ed Load
relief
(Avg.)
Required
Load
relief
(Avg.)
Implement
ed Load
relief
(Avg.)
Required
Load
relief(Avg.)
Implemen
ted Load
relief
(Avg.)
GUJARAT 580 773 580 726 580 1117 590 1025
MADHYA PRADESH 460 468 460 450 460 460 465 490
CHATTISGARH 150 110 150 114 155 117 155 91
MAHARASHTRA 805 1122 810 1215 815 1044 820 1071
GOA 25 25 25 25 25 25 25 25
UT: DD 10 10 15 15 15 16 15 15
UT: DNH 30 30 30 30 35 35 35 35
Total load relief 2060 2537 2070 2575 2085 2814 2105 2752
Stage - I 49.2 Hz Stage - II 49.0 Hz Stage - III 48.8 Hz Stage - IV 48.6 Hz
DF/DT Scheme in Western Region
Stage - I 49.9/0.1 Hz/sec Stage - II 49.9/0.2 Hz/sec Stage - III 49.9/0.4 Hz/sec
STATERequired
Load relief
Implemented
Load relief
Required
Load relief
Implemented
Load relief
Required
Load relief
Implemented
Load relief
GUJARAT 0 0 1383 1454 1529 1610
MADHYA PRADESH 361 475 355 415 392 445
CHATTISGARH 27 120 37 40 120 40
MAHARASHTRA 546 370 621 1131 686 522
**TPC 60 60 82 82 273 273
Total load relief 994 1025 2478 3122 3000 2890
* Gujarat additional df/dt setting at 49.9Hz & 0.3Hz/sec = 399 MW.
** TPC additional df/dt setting at 49.9 Hz/0.5 Hz/sec = 931 MW
36 | P a g e
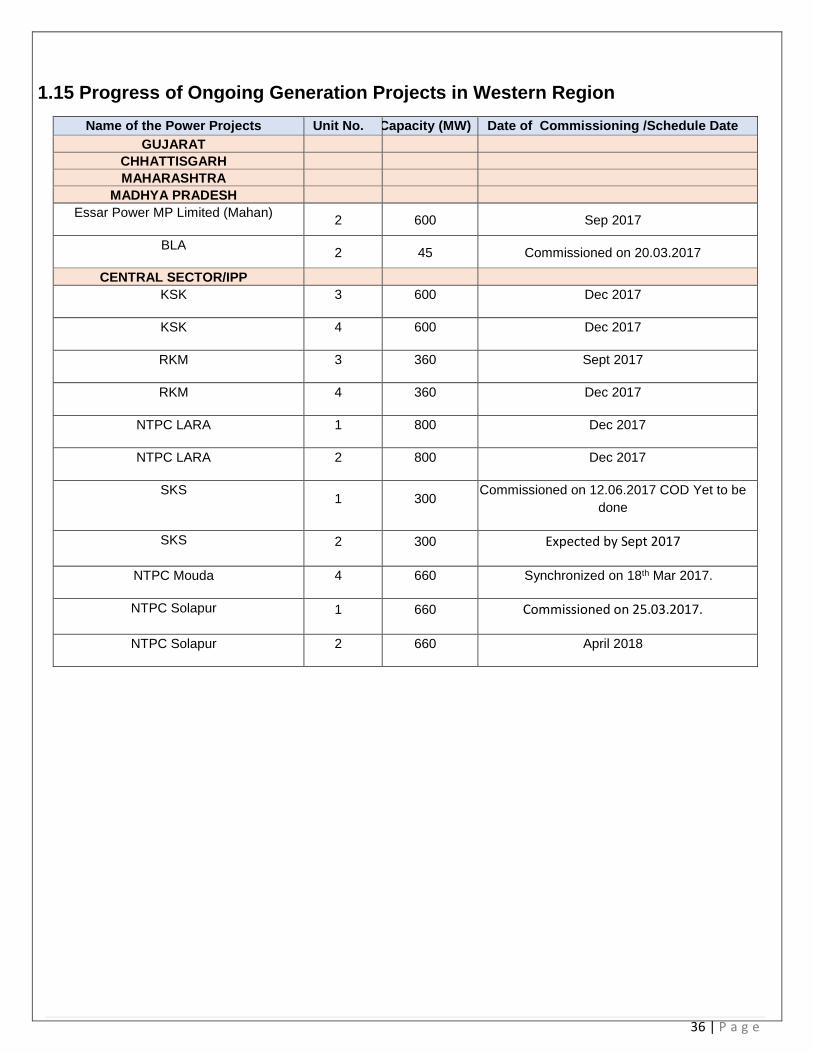
1.15 Progress of Ongoing Generation Projects in Western Region
Name of the Power Projects Unit No. Capacity (MW) Date of Commissioning /Schedule Date
GUJARAT
CHHATTISGARH
MAHARASHTRA
MADHYA PRADESH
Essar Power MP Limited (Mahan) 2 600 Sep 2017
BLA 2 45 Commissioned on 20.03.2017
CENTRAL SECTOR/IPP
KSK 3 600 Dec 2017
KSK 4 600 Dec 2017
RKM 3 360 Sept 2017
RKM 4 360 Dec 2017
NTPC LARA 1 800 Dec 2017
NTPC LARA 2 800 Dec 2017
SKS 1 300
Commissioned on 12.06.2017 COD Yet to be
done
SKS 2 300 Expected by Sept 2017
NTPC Mouda 4 660 Synchronized on 18th Mar 2017.
NTPC Solapur 1 660 Commissioned on 25.03.2017.
NTPC Solapur 2 660 April 2018

37 | P a g e
Status of Ongoing Transmission Projects in Western Region S
r.
N
o.
Name of Transmission lines Leng
th in
Ckt.
Km.
Antici
pated
Compl
etion
Target
Remarks
Status of ongoing transmission projects under Gujarat 1 400 kV D/C Vadinar-Amreli line 239 Dec-18 Work in Progress(WIP)
2 400kV Mundra-Hadala LILO to Halvad 89.4 Dec-18 Re tenderized; LOI issued
on 13.06.2016.
3 400 kV D/C Amreli-Kasor line 470 Mar-18 W I P / Severe RoW
problems
4 400 kV Charanka-Veloda 199 Sep-18 Charged
5 400 KV Kosamba- Achhalia 140 Sep.
2018
Yet to award
6 LILO of 400 KV Essar-Hadala line at Kalavad S/S 100 Sep.
2018
WIP
7 LILO of 400 KV Mundra (Adani)- Zerda line at Sankhari 200 Sep.
2018
WIP; Plan change to LILO
of one ckt. of 400kV D/C
Vadavi-Zerda
8 400 KV Vadavi-Halvad 240 Mar-18 WIP
9 line at Veloda (Sankhari) S/s having total line length - 29.3 Ckm
10 (Already consider in this report)
11 LILO of one ckt. of Vadavi-Zerda line at Veloda (Sankhari) S/s Sep
2017
WIP
12 Utran CCPP (374 MW)
13 220kV D/C Gavasad - Salejada line 194 Mar-18 WIP (Severe RoW
problems)
14 Sikka Unit 3 & 4 (2 x 250= 500 MW)
15 LILO to Sikka from 220kV Jamnagar – Jetpur ckt. No.2 120 Dec-17 WIP
16 Bhavnagar Energy Co.Ltd. (BECL)
17 220kV D/C BECL - Botad line 190 Mar-18 WIP (Severe RoW
problems)
18 Transmission Schemes associated with PGCIL Substation
19 220kV D/C Vyankatpura-Waghodia (765kV PGCIL) line 29 Dec-17 WIP
20 220kV D/C Pirana - Barejadi Line 44.96 Mar-18 WIP
21 LILO of one ckt. of 400kV D/C Vadavi-Zerda line at Veloda 29.3 Dec-17 WIP
22 LILO of one ckt. of 400kV D/C Kosamba-Chorania line at 400kV
Sanand-II GIDC S/s.
90 Mar-18 WIP
23 LILO of 400kV D/C Vadinar-Hadala Line No.1 at 400kV Kalawad S/s 7.76 Dec-17 WIP
24 LILO of 400kV D/C Vadinar-Hadala Line No.2 at 400kV Kalawad S/s 7.63 Dec-17 WIP
25 220kV LILO at Kukma S/S from one Ckt. of Shivlakha - 34 Mar-18 WIP
26 220KV D/C Halvad - Sadla line 76 Mar-18 WIP (Severe RoW
problems)
27 220KV D/C Bhatiya - Kalawad line 238 Mar-18 WIP (Severe RoW
problems)
28 220KV D/C Kalawad - Kangasiyali line 111.88 Mar-18 WIP (Severe RoW
problems)
29 Termination of one D/C line of 220KV Achhaliya-Jambuva line at 68.39 Dec-17 WIP
30 220kV Vadavi-Chhatral line LILO at 220kV Santej S/s (Work for 7.4 Mar-18 WIP
31 220kV Vadavi-Chhatral line LILO at 220kV Santej S/s 43.26 Mar-18 WIP
32 Total 50.66
33 220kV D/C Vadavi-Sanand DFCC line 61.08 Mar-18 WIP
34 220kV D/C Botad-Chorania line 103.24 Mar-18 WIP
35 220kV D/C Jamnagar-Hadala line 139.14 Sept-17 WIP
38 | P a g e
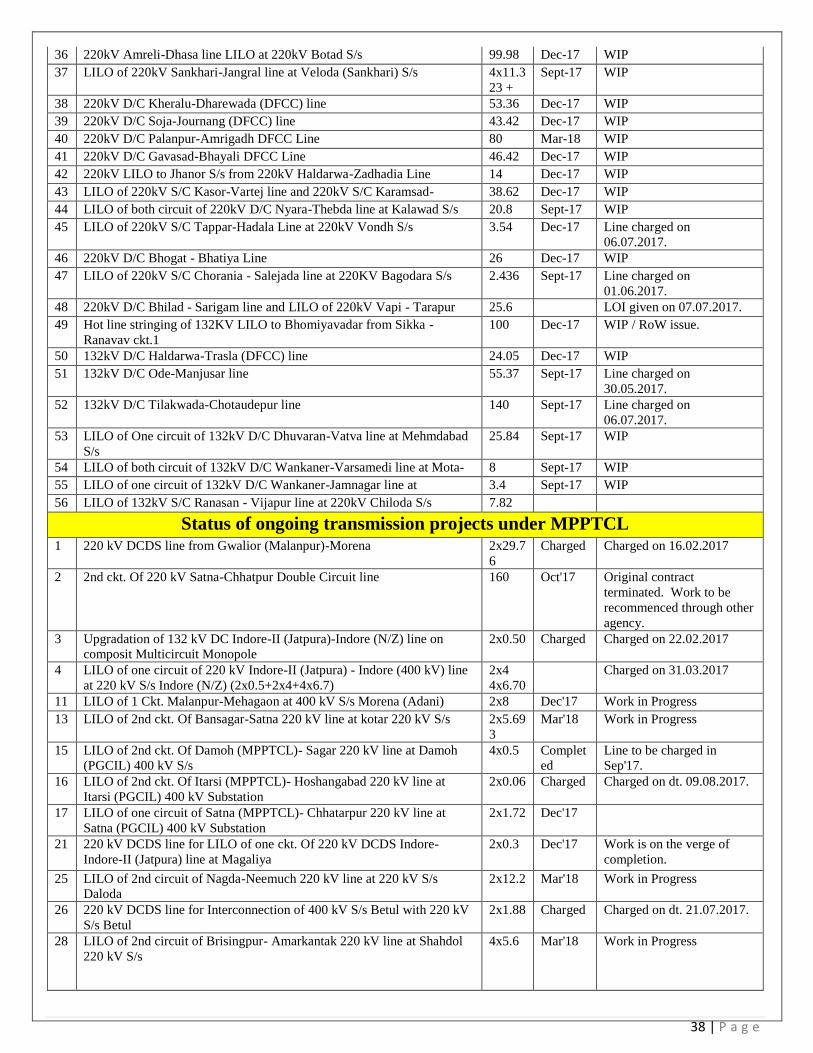
36 220kV Amreli-Dhasa line LILO at 220kV Botad S/s 99.98 Dec-17 WIP
37 LILO of 220kV Sankhari-Jangral line at Veloda (Sankhari) S/s 4x11.3
23 +
Sept-17 WIP
38 220kV D/C Kheralu-Dharewada (DFCC) line 53.36 Dec-17 WIP
39 220kV D/C Soja-Journang (DFCC) line 43.42 Dec-17 WIP
40 220kV D/C Palanpur-Amrigadh DFCC Line 80 Mar-18 WIP
41 220kV D/C Gavasad-Bhayali DFCC Line 46.42 Dec-17 WIP
42 220kV LILO to Jhanor S/s from 220kV Haldarwa-Zadhadia Line 14 Dec-17 WIP
43 LILO of 220kV S/C Kasor-Vartej line and 220kV S/C Karamsad- 38.62 Dec-17 WIP
44 LILO of both circuit of 220kV D/C Nyara-Thebda line at Kalawad S/s 20.8 Sept-17 WIP
45 LILO of 220kV S/C Tappar-Hadala Line at 220kV Vondh S/s 3.54 Dec-17 Line charged on
06.07.2017.
46 220kV D/C Bhogat - Bhatiya Line 26 Dec-17 WIP
47 LILO of 220kV S/C Chorania - Salejada line at 220KV Bagodara S/s 2.436 Sept-17 Line charged on
01.06.2017.
48 220kV D/C Bhilad - Sarigam line and LILO of 220kV Vapi - Tarapur 25.6 LOI given on 07.07.2017.
49 Hot line stringing of 132KV LILO to Bhomiyavadar from Sikka -
Ranavav ckt.1
100 Dec-17 WIP / RoW issue.
50 132kV D/C Haldarwa-Trasla (DFCC) line 24.05 Dec-17 WIP
51 132kV D/C Ode-Manjusar line 55.37 Sept-17 Line charged on
30.05.2017.
52 132kV D/C Tilakwada-Chotaudepur line 140 Sept-17 Line charged on
06.07.2017.
53 LILO of One circuit of 132kV D/C Dhuvaran-Vatva line at Mehmdabad
S/s
25.84 Sept-17 WIP
54 LILO of both circuit of 132kV D/C Wankaner-Varsamedi line at Mota- 8 Sept-17 WIP
55 LILO of one circuit of 132kV D/C Wankaner-Jamnagar line at 3.4 Sept-17 WIP
56 LILO of 132kV S/C Ranasan - Vijapur line at 220kV Chiloda S/s 7.82
Status of ongoing transmission projects under MPPTCL 1 220 kV DCDS line from Gwalior (Malanpur)-Morena 2x29.7
6
Charged Charged on 16.02.2017
2 2nd ckt. Of 220 kV Satna-Chhatpur Double Circuit line 160 Oct'17 Original contract
terminated. Work to be
recommenced through other
agency.
3 Upgradation of 132 kV DC Indore-II (Jatpura)-Indore (N/Z) line on
composit Multicircuit Monopole
2x0.50 Charged Charged on 22.02.2017
4 LILO of one circuit of 220 kV Indore-II (Jatpura) - Indore (400 kV) line
at 220 kV S/s Indore (N/Z) (2x0.5+2x4+4x6.7)
2x4
4x6.70
Charged on 31.03.2017
11 LILO of 1 Ckt. Malanpur-Mehagaon at 400 kV S/s Morena (Adani) 2x8 Dec'17 Work in Progress
13 LILO of 2nd ckt. Of Bansagar-Satna 220 kV line at kotar 220 kV S/s 2x5.69
3
Mar'18 Work in Progress
15 LILO of 2nd ckt. Of Damoh (MPPTCL)- Sagar 220 kV line at Damoh
(PGCIL) 400 kV S/s
4x0.5 Complet
ed
Line to be charged in
Sep'17.
16 LILO of 2nd ckt. Of Itarsi (MPPTCL)- Hoshangabad 220 kV line at
Itarsi (PGCIL) 400 kV Substation
2x0.06 Charged Charged on dt. 09.08.2017.
17 LILO of one circuit of Satna (MPPTCL)- Chhatarpur 220 kV line at
Satna (PGCIL) 400 kV Substation
2x1.72 Dec'17
21 220 kV DCDS line for LILO of one ckt. Of 220 kV DCDS Indore-
Indore-II (Jatpura) line at Magaliya
2x0.3 Dec'17 Work is on the verge of
completion.
25 LILO of 2nd circuit of Nagda-Neemuch 220 kV line at 220 kV S/s
Daloda
2x12.2 Mar'18 Work in Progress
26 220 kV DCDS line for Interconnection of 400 kV S/s Betul with 220 kV
S/s Betul
2x1.88 Charged Charged on dt. 21.07.2017.
28 LILO of 2nd circuit of Brisingpur- Amarkantak 220 kV line at Shahdol
220 kV S/s
4x5.6 Mar'18 Work in Progress
39 | P a g e
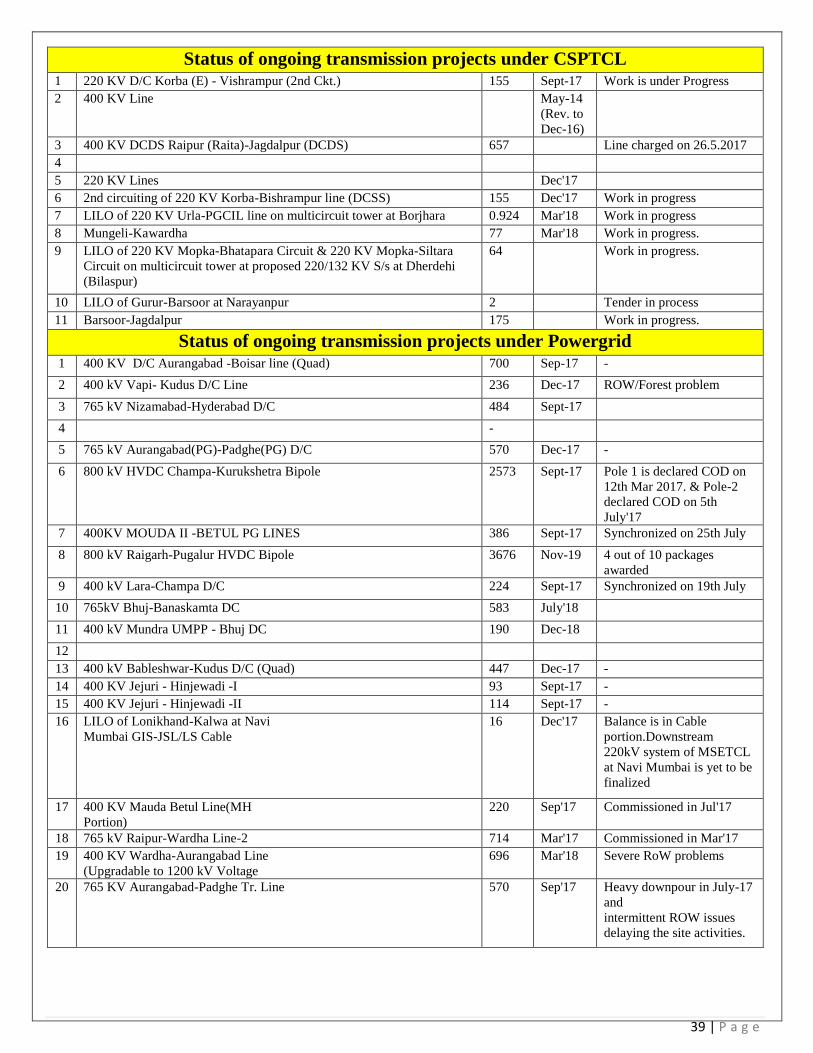
Status of ongoing transmission projects under CSPTCL 1 220 KV D/C Korba (E) - Vishrampur (2nd Ckt.) 155 Sept-17 Work is under Progress
2 400 KV Line May-14
(Rev. to
Dec-16)
3 400 KV DCDS Raipur (Raita)-Jagdalpur (DCDS) 657 Line charged on 26.5.2017
4
5 220 KV Lines Dec'17
6 2nd circuiting of 220 KV Korba-Bishrampur line (DCSS) 155 Dec'17 Work in progress
7 LILO of 220 KV Urla-PGCIL line on multicircuit tower at Borjhara 0.924 Mar'18 Work in progress
8 Mungeli-Kawardha 77 Mar'18 Work in progress.
9 LILO of 220 KV Mopka-Bhatapara Circuit & 220 KV Mopka-Siltara
Circuit on multicircuit tower at proposed 220/132 KV S/s at Dherdehi
(Bilaspur)
64 Work in progress.
10 LILO of Gurur-Barsoor at Narayanpur 2 Tender in process
11 Barsoor-Jagdalpur 175 Work in progress.
Status of ongoing transmission projects under Powergrid 1 400 KV D/C Aurangabad -Boisar line (Quad) 700 Sep-17 -
2 400 kV Vapi- Kudus D/C Line 236 Dec-17 ROW/Forest problem
3 765 kV Nizamabad-Hyderabad D/C 484 Sept-17
4 -
5 765 kV Aurangabad(PG)-Padghe(PG) D/C 570 Dec-17 -
6 800 kV HVDC Champa-Kurukshetra Bipole 2573 Sept-17 Pole 1 is declared COD on
12th Mar 2017. & Pole-2
declared COD on 5th
July'17
7 400KV MOUDA II -BETUL PG LINES 386 Sept-17 Synchronized on 25th July
8 800 kV Raigarh-Pugalur HVDC Bipole 3676 Nov-19 4 out of 10 packages
awarded
9 400 kV Lara-Champa D/C 224 Sept-17 Synchronized on 19th July
10 765kV Bhuj-Banaskamta DC 583 July'18
11 400 kV Mundra UMPP - Bhuj DC 190 Dec-18
12
13 400 kV Bableshwar-Kudus D/C (Quad) 447 Dec-17 -
14 400 KV Jejuri - Hinjewadi -I 93 Sept-17 -
15 400 KV Jejuri - Hinjewadi -II 114 Sept-17 -
16 LILO of Lonikhand-Kalwa at Navi
Mumbai GIS-JSL/LS Cable
16 Dec'17 Balance is in Cable
portion.Downstream
220kV system of MSETCL
at Navi Mumbai is yet to be
finalized
17 400 KV Mauda Betul Line(MH
Portion)
220 Sep'17 Commissioned in Jul'17
18 765 kV Raipur-Wardha Line-2 714 Mar'17 Commissioned in Mar'17
19 400 KV Wardha-Aurangabad Line
(Upgradable to 1200 kV Voltage
696 Mar'18 Severe RoW problems
20 765 KV Aurangabad-Padghe Tr. Line 570 Sep'17 Heavy downpour in July-17
and
intermittent ROW issues
delaying the site activities.
40 | P a g e
21 400 kV Padghe (PGCIL)-Padghe 2 MSETCL (Kudus) Tr. Line 33.4 Sep'17 Line is ready. Will be
commissioned
along with 765kV D/C
Aurangabad- Padghe TL
subject to readiness of
400kV Kudus (MSETCL).
22 400 KV Solapur(NTPC)-
Solapur(PG) Line-2
24 Sep'17 Severe RoW problems and
delayed
Railway clearance
23 765 KV Wardha-Nizamabad line(MH
portion)
236 Sep'17 Commissioned in Mar'17
24 400 KV Aurangabad-Boisar
Line(WR-I portion)
340 Sep'17 POWERGRID-WR-I
portion is ready in
Jun'17. POWERGRID WR-
II portion is under progress.
Work is expected to be
completed in Sep'17
25 765 kV D/C Jharsuguda-
Dharamjaygarh
210 Dec'17 Forest Stage-I received in
July-2017.
Complaince under
submission.
26 400 kV D/C LARA-Champa Tr.Line 226 Jun'17 Commissioned on 21st
july17
27 765 kV D/C Gadarwada-Warora TL
,Part-3
173.42 *Nov'17 Severe Row Problems in
Nagpur district
28 LILO of both Ckts. Of 400 kV
Wardha-Parli at Warora
193.73
4
Nov'17 Severe Row Problems
29 765 kV D/C Warora-Parli Line 695.48 *Jan'18 Severe Row Problems
30 765 KV D/C Parli - Solapur TL 236 Jan'18 Severe Row Problems
31 400 KV D/C Parli - Parli TL 36.64 Jan'18 Severe Row Problems
32 400kV D/C (Quad) Mauda II – Betul T/L. 173
33 400kV D/C (Quad) Betul - Khandwa T/L. 337.2
34 765kV D/C Jabalpur Pool - Orai (Part-I) T/L. 165.1 Sep-17 1st week of sept17, orai end
on nov17
35 765kV D/C Jabalpur Pool - Orai (Part-II) T/L. 192.7 Sep-17
36 765kV D/C Jabalpur Pool - Orai (Part-III) T/L. 184.2 Sep-17
37 765kV D/C Jabalpur Pool - Orai (Part-IV) T/L. 179.1 Sep-17
38 LILO of 765kV S/C Satna - Gwalior T/L at Orai S/S. 36.7 Sep-17
39 765kV D/C Banaskantha - Chittorgarh (Part-I) T/L. 148.3 Dec-17
40 765kV D/C Banaskantha - Chittorgarh (Part-II) T/L. 145 Dec-17
41 400kV D/C Banaskantha - Sankheri (GETCO) T/L. 43.4 Dec-17
42 400kV D/C Aurangabad - Boiser (Part-II) T/L. 338.1 Sep-17
43 LILO of 400kV D/C Mundra UMPP - Limbdi T/L at Bhachau S/s. 45.3 Sep-17 Bays ready at Bachau end,
severe ROW issues
44 LILO of 400kV D/C Vindhyachal - Jabalpur (2nd Circuit 3&4) T/L at
REWA Pooling Station.
115.7 Sep-17 Received forest clearance at
6 locations
45 400kV D/C Kala - Kudus T/L 36.9 Sep-17 Severe ROW issues at 6
locations
46 220kV D/C Magarwada - Ringanwada T/L. 12.3 Sep-17
47 765kV D/C Vindhyachal - Jabalpur (Part-I) T/L. 183.7 Mar-18 severe ROW issues
48 765kV D/C Vindhyachal - Jabalpur (Part-II) T/L. 191.2 Mar-18 severe ROW issues
49 765kV D/C Vindhyachal - Jabalpur (Part-III) T/L. 188.3 Mar-18 severe ROW issues
50 765kV D/C Vindhyachal - Jabalpur (Part-IV) T/L. 184.6 Mar-18 severe ROW issues
51 765kV D/C Gadarwara STPP - Warora (Part-I) T/L. 219.3 Nov-17
52 765kV D/C Gadarwara STPP - Warora (Part-II) T/L. 234.1 Nov-17 severe ROW issues, Nagpur

41 | P a g e
1.16 OPEN ACCESS TRANSACTION DETAILS
Apr-17 May-17 Jun-17 Jul-17 Aug-17 Sep-17 Oct-17 Nov-17 Dec-17 Jan-18 Feb-18 Mar-18 TOTAL
Day Ahead 145 188 60 116 77 586
Contingency 191 200 111 150 231 883
FCFS 115 105 80 89 119 508
Advance 8 6 25 19 7 65
TOTAL 459 499 276 374 434 0 0 0 0 0 0 0 2042
Apr-17 May-17 Jun-17 Jul-17 Aug-17 Sep-17 Oct-17 Nov-17 Dec-17 Jan-18 Feb-18 Mar-18 TOTAL
Day Ahead 273.21 369.10 207.48 270.17 144.8071 1264.77
Contingency 213.20 308.67 103.35 207.18 470.0898 1302.49
FCFS 572.88 610.76 245.68 335.86 150.4435 1915.62
Advance 120.42 118.99 181.14 31.5 63.76844 515.81
TOTAL 1179.70 1407.52 737.65 844.71 829.11 0.00 0.00 0.00 0.00 0.00 0.00 0.00 4998.69
Apr-17 May-17 Jun-17 Jul-17 Aug-17 Sep-17 Oct-17 Nov-17 Dec-17 Jan-18 Feb-18 Mar-18 TOTAL
Intra-regional 353 434 232 291 295 1605
Inter-regional 106 65 44 83 139 437
TOTAL 459 499 276 374 434 0 0 0 0 0 0 0 2042
Apr-17 May-17 Jun-17 Jul-17 Aug-17 Sep-17 Oct-17 Nov-17 Dec-17 Jan-18 Feb-18 Mar-18 TOTAL
Intra-regional 956.71 1184.42 673.35 721.62 606.4619 4142.56
Inter-regional 223.00 223.10 64.31 123.09 222.647 856.14
TOTAL 1179.70 1407.52 737.65 844.71 829.11 0.00 0.00 0.00 0.00 0.00 0.00 0.00 4998.70
Energy Approved (MUs)
WRLDC AS NODAL
1. CATEGORISED ON THE BASIS OF 'TRANSACTION TYPE'
No. of approvals
Energy approved (MUs)
2. CATEGORISED ON THE BASIS OF INTRA/INTER REGIONAL TRANSACTIONS
No. of approvals
42 | P a g e
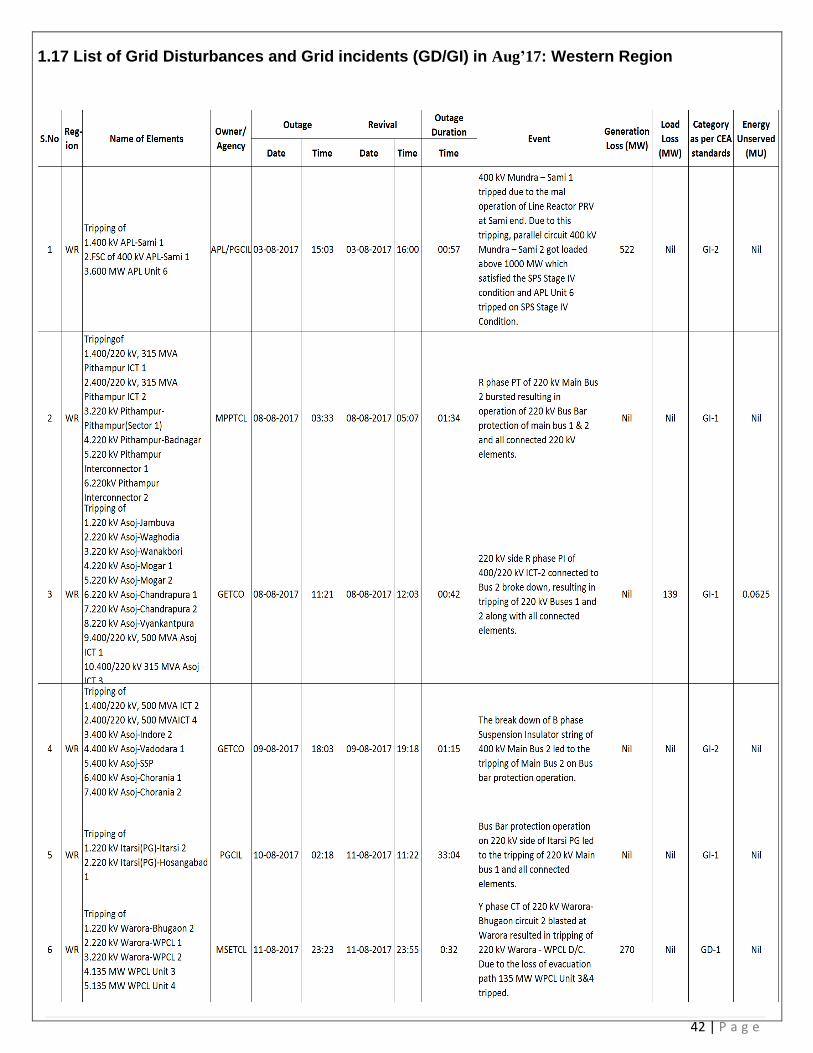
1.17 List of Grid Disturbances and Grid incidents (GD/GI) in Aug’17: Western Region

43 | P a g e

44 | P a g e

45 | P a g e
ANNEXURES
2.1 Load Duration Curve
2.2 Frequency Duration Curve
46 | P a g e
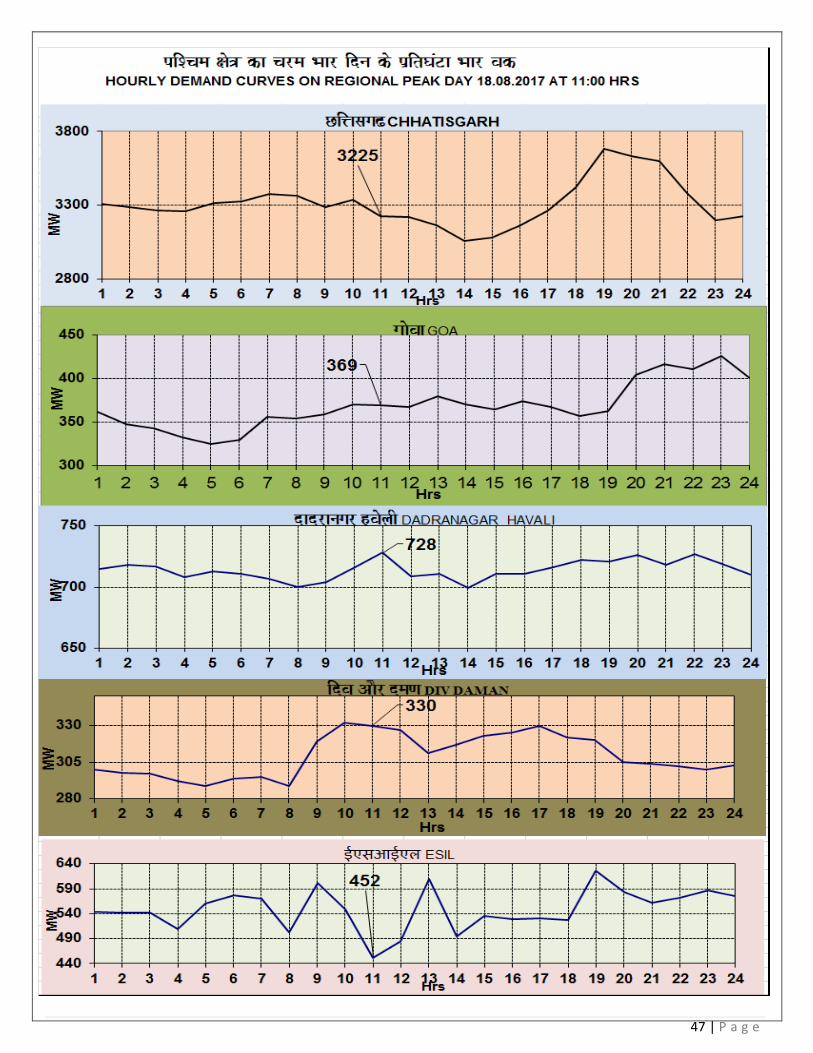
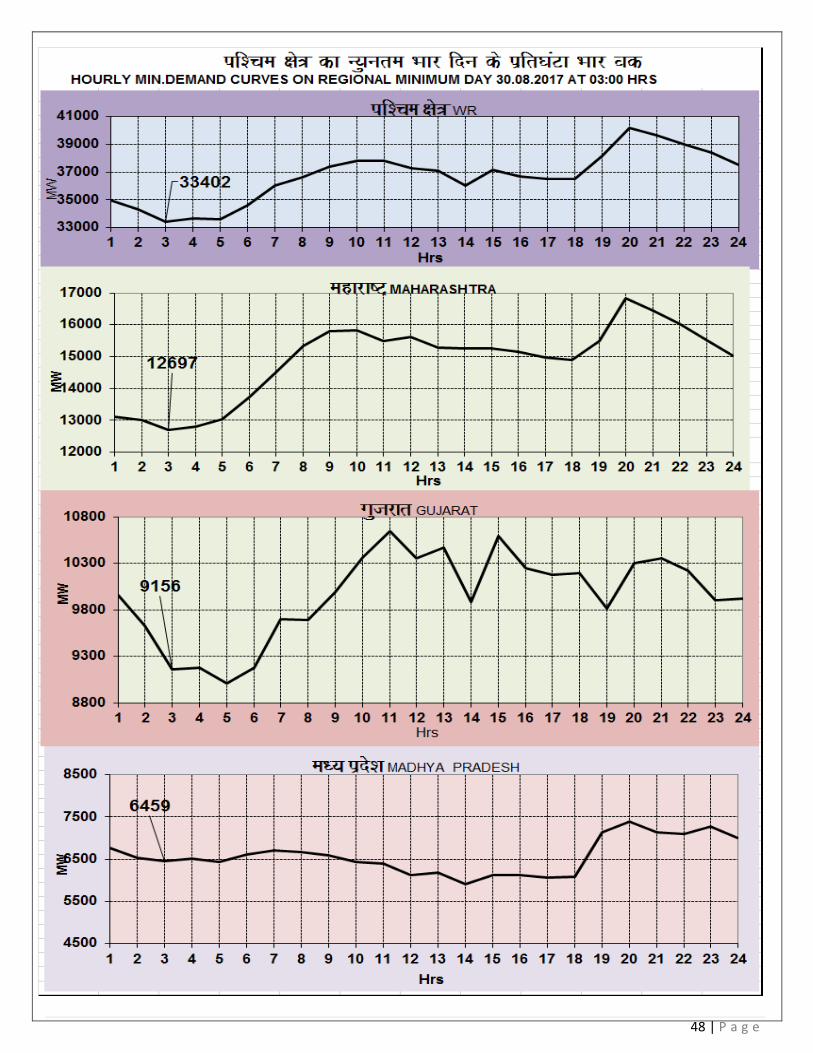
2.3 Load Curve on Peak and Lean Demand Day
47 | P a g e
48 | P a g e

49 | P a g e
50 | P a g e
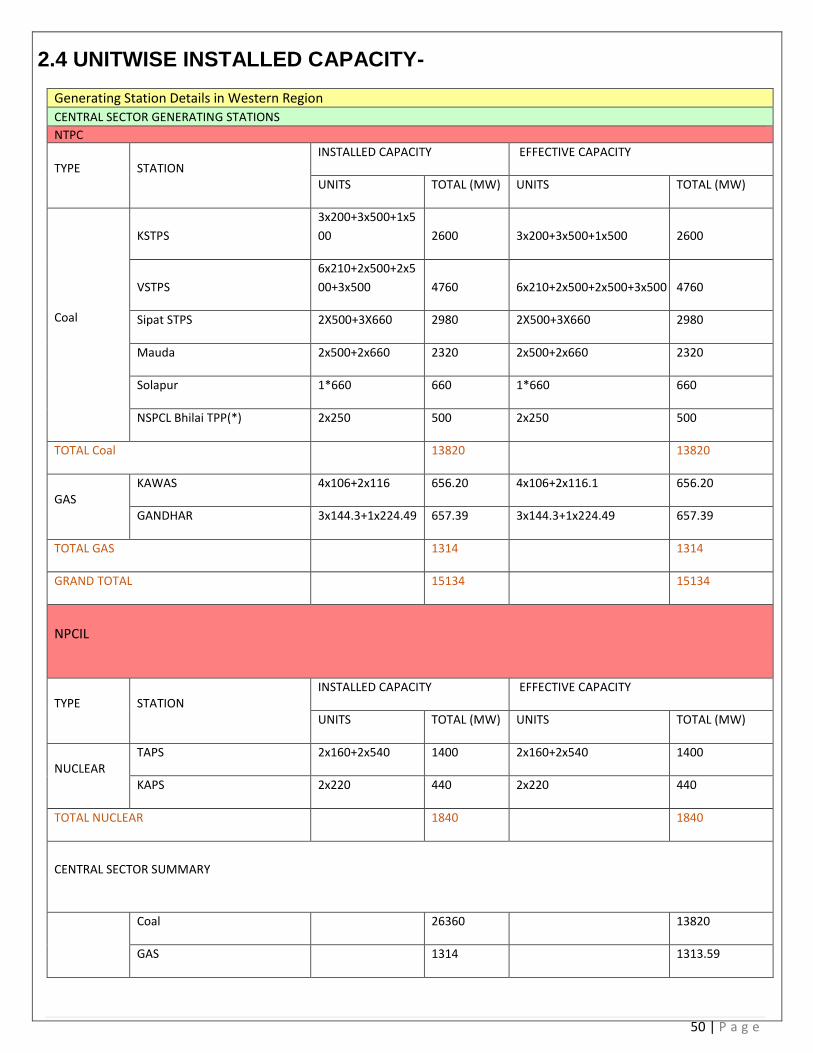
2.4 UNITWISE INSTALLED CAPACITY-
Generating Station Details in Western Region
CENTRAL SECTOR GENERATING STATIONS
NTPC
TYPE STATION INSTALLED CAPACITY EFFECTIVE CAPACITY
UNITS TOTAL (MW) UNITS TOTAL (MW)
Coal
KSTPS
3x200+3x500+1x5
00 2600 3x200+3x500+1x500 2600
VSTPS
6x210+2x500+2x5
00+3x500 4760 6x210+2x500+2x500+3x500 4760
Sipat STPS 2X500+3X660 2980 2X500+3X660 2980
Mauda 2x500+2x660 2320 2x500+2x660 2320
Solapur 1*660 660 1*660 660
NSPCL Bhilai TPP(*) 2x250 500 2x250 500
TOTAL Coal 13820 13820
GAS KAWAS 4x10⁶+2x116 656.20 4x10⁶+2x116.1 656.20
GANDHAR 3x144.3+1x224.49 657.39 3x144.3+1x224.49 657.39
TOTAL GAS 1314 1314
GRAND TOTAL 15134 15134
NPCIL
TYPE STATION INSTALLED CAPACITY EFFECTIVE CAPACITY
UNITS TOTAL (MW) UNITS TOTAL (MW)
NUCLEAR TAPS 2x160+2x540 1400 2x160+2x540 1400
KAPS 2x220 440 2x220 440
TOTAL NUCLEAR 1840 1840
CENTRAL SECTOR SUMMARY
Coal 26360 13820
GAS 1314 1313.59

51 | P a g e
TOTAL
CENTRAL
SECTOR NUCLEAR
1840
1840
GRAND TOTAL (CENTRAL SECTOR) 16974 16974
STATE SECTOR GENERATING STATIONS
GUJARAT
TYPE STATION
INSTALLED
CAPACITY EFFECTIVE CAPACITY
UNITS TOTAL (MW) UNITS TOTAL (MW)
HYDRO
UKAI 4x75 300 4x75 300
UKAI (LBCH) 2x2.5 5 2x2.5 5
KADANA 4x60 240 4x60 240
MADHUBAN DAM 2*1.5+2.6 5.6 2*1.5+2.6 5.6
KARJAN DAM 3 3 3 3
PANAM CANAL 2x1 2 2x1 2
SARDAR SAROVAR 16% of 1450 1450 16% of 1450 232
TOTAL HYDRO 2005.6 779
Coal
A.E.Co.(Torrent Power) 1x60+2x121+120 422 1x60+2x110+120 422
DHUVARAN 2x140+1*376 656 2x140+1*376 656
UKAI
2x120+2x200+1x2
10+ 1x500 1350
2x120+2x200+1x210+
1x500 1350
GANDHI NAGAR 2x0+3x210 630 2x0+3x210 630
WANAKBORI 7x210 1470 7x210 1470
SIKKA 2x120+2x250 740 2x120+2x250 740
KUTCH LIGNITE 2x70+2x75 290 2x70+2x75 290
SURAT LIGNITE 4x125 500 4x125 500
AKRIMOTA 2x125 250 2x125 250
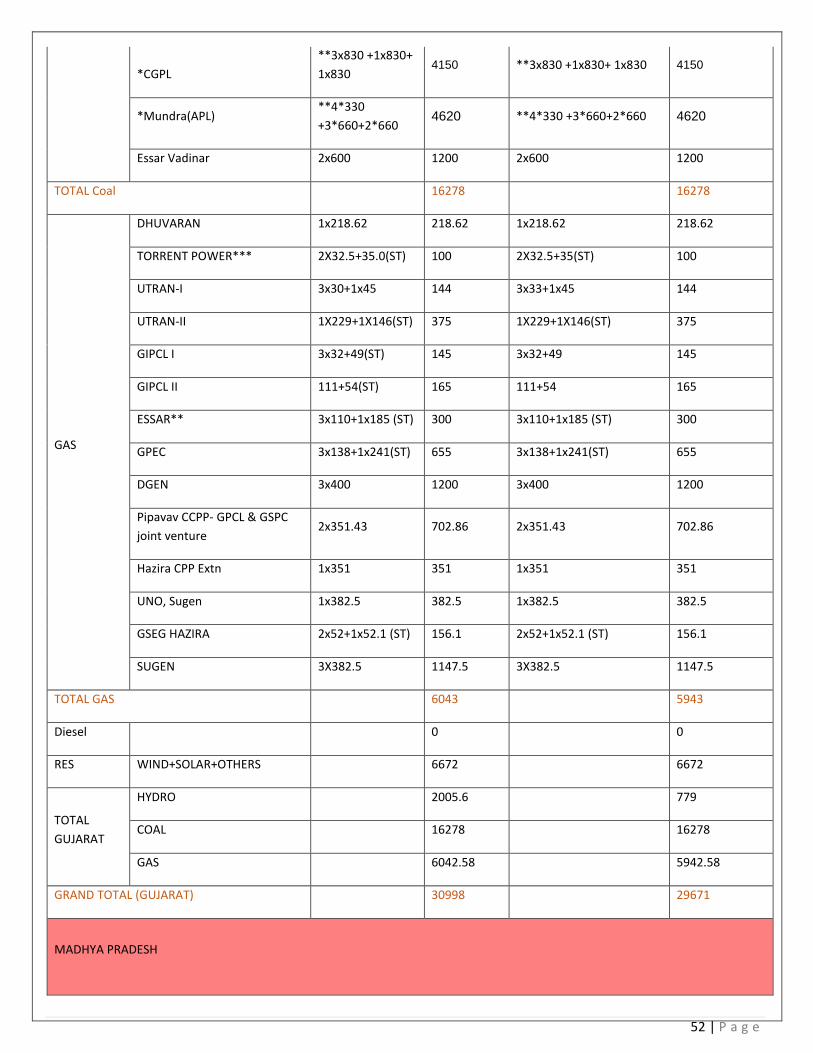
52 | P a g e
*CGPL
**3x830 +1x830+
1x830 4150 **3x830 +1x830+ 1x830 4150
*Mundra(APL) **4*330
+3*660+2*660 4620 **4*330 +3*660+2*660 4620
Essar Vadinar 2x600 1200 2x600 1200
TOTAL Coal 16278 16278
GAS
DHUVARAN 1x218.62 218.62 1x218.62 218.62
TORRENT POWER*** 2X32.5+35.0(ST) 100 2X32.5+35(ST) 100
UTRAN-I 3x30+1x45 144 3x33+1x45 144
UTRAN-II 1X229+1X146(ST) 375 1X229+1X146(ST) 375
GIPCL I 3x32+49(ST) 145 3x32+49 145
GIPCL II 111+54(ST) 165 111+54 165
ESSAR** 3x110+1x185 (ST) 300 3x110+1x185 (ST) 300
GPEC 3x138+1x241(ST) 655 3x138+1x241(ST) 655
DGEN 3x400 1200 3x400 1200
Pipavav CCPP- GPCL & GSPC
joint venture 2x351.43 702.86 2x351.43 702.86
Hazira CPP Extn 1x351 351 1x351 351
UNO, Sugen 1x382.5 382.5 1x382.5 382.5
GSEG HAZIRA 2x52+1x52.1 (ST) 156.1 2x52+1x52.1 (ST) 156.1
SUGEN 3X382.5 1147.5 3X382.5 1147.5
TOTAL GAS 6043 5943
Diesel 0 0
RES WIND+SOLAR+OTHERS 6672 6672
TOTAL
GUJARAT
HYDRO 2005.6 779
COAL 16278 16278
GAS 6042.58 5942.58
GRAND TOTAL (GUJARAT) 30998 29671
MADHYA PRADESH
53 | P a g e
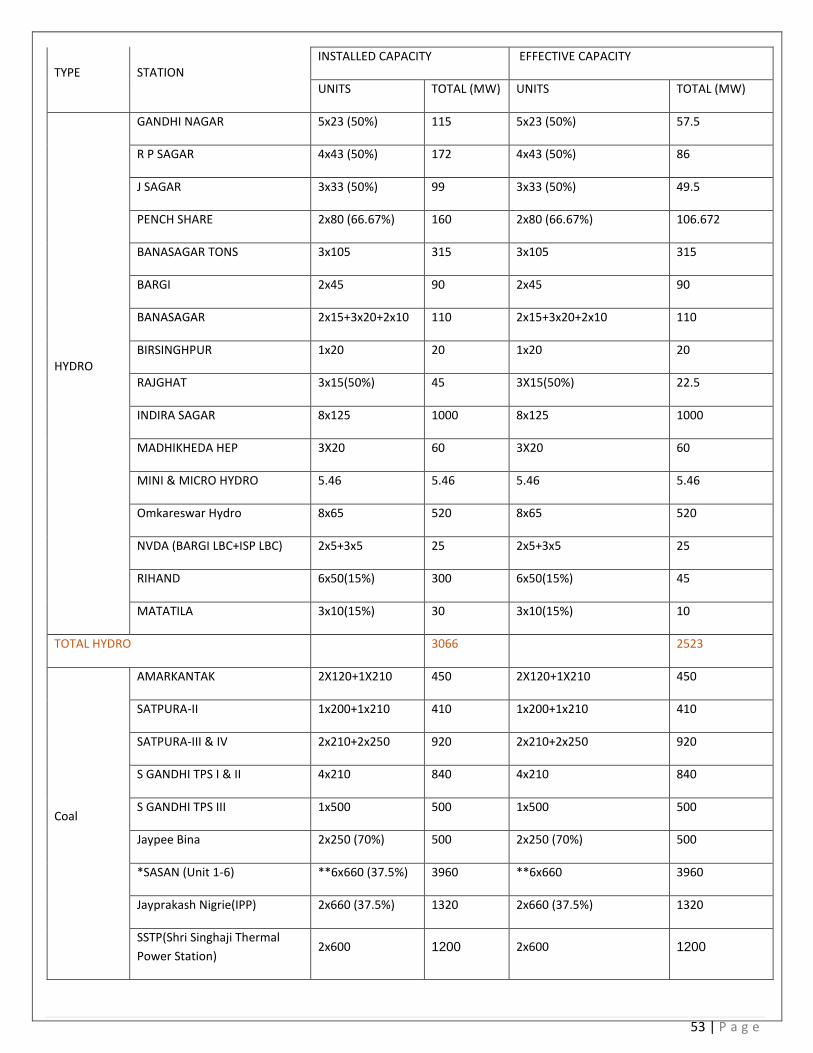
TYPE STATION INSTALLED CAPACITY EFFECTIVE CAPACITY
UNITS TOTAL (MW) UNITS TOTAL (MW)
HYDRO
GANDHI NAGAR 5x23 (50%) 115 5x23 (50%) 57.5
R P SAGAR 4x43 (50%) 172 4x43 (50%) 86
J SAGAR 3x33 (50%) 99 3x33 (50%) 49.5
PENCH SHARE 2x80 (66.67%) 160 2x80 (66.67%) 106.672
BANASAGAR TONS 3x10⁵ 315 3x10⁵ 315
BARGI 2x45 90 2x45 90
BANASAGAR 2x15+3x20+2x10 110 2x15+3x20+2x10 110
BIRSINGHPUR 1x20 20 1x20 20
RAJGHAT 3x15(50%) 45 3X15(50%) 22.5
INDIRA SAGAR 8x125 1000 8x125 1000
MADHIKHEDA HEP 3X20 60 3X20 60
MINI & MICRO HYDRO 5.46 5.46 5.46 5.46
Omkareswar Hydro 8x65 520 8x65 520
NVDA (BARGI LBC+ISP LBC) 2x5+3x5 25 2x5+3x5 25
RIHAND 6x50(15%) 300 6x50(15%) 45
MATATILA 3x10(15%) 30 3x10(15%) 10
TOTAL HYDRO 3066 2523
Coal
AMARKANTAK 2X120+1X210 450 2X120+1X210 450
SATPURA-II 1x200+1x210 410 1x200+1x210 410
SATPURA-III & IV 2x210+2x250 920 2x210+2x250 920
S GANDHI TPS I & II 4x210 840 4x210 840
S GANDHI TPS III 1x500 500 1x500 500
Jaypee Bina 2x250 (70%) 500 2x250 (70%) 500
*SASAN (Unit 1-6) **6x660 (37.5%) 3960 **6x660 3960
Jayprakash Nigrie(IPP) 2x660 (37.5%) 1320 2x660 (37.5%) 1320
SSTP(Shri Singhaji Thermal
Power Station) 2x600 1200 2x600 1200

54 | P a g e
BLA POWER 1x45(35%) 45 1x45(35%) 45
Jhabua Power ( Avanta) 1x600 600 1x600 600
M B Power 2x600 (35%) 1200 2x600 (35%) 1200
TOTAL THERMAL 11945 11945
Diesel 0 0
RES WIND+SOLAR+OTHERS 3538 3538
TOTAL
MADHYA
PRADESH
HYDRO 3066 2523
THERMAL 11945 11945
GRAND TOTAL (MADHYA PRADESH) 18549 18006
CHHATISGARH
TYPE STATION INSTALLED CAPACITY EFFECTIVE CAPACITY
UNITS TOTAL (MW) UNITS TOTAL (MW)
HYDRO
HASDEO BANGO 3x40 120 3x40 120
Gangrel 4x2.5 10 4x2.5 10
Korba West Mini Micro Hydel 2X.85 1.7 2X.85 1.7
Sikasar 2x3.5 7 2x3.5 7
TOTAL HYDRO 138.7 138.7
Coal
KORBA (E) 4x50+2x120 440 4X50+2X120 440
KORBA (W) 4x210+1x500 1340 4x210+1x500 1340
KORBA (E) ext-I 2x250 500 2x250 500
Korba West Power Corp. Ltd.
(IPP) 1x600 600 1x600 600
JINDAL Stage I, DCPP(IPP) 4x250 1000 4x250 1000
JINDAL(JSPL TPP)unit3 2x135 270 2x135 270
LANCO-Amarkantak 2x300 600 2x300 600
SVPL TPP 1x63 63 1x63 63
Spectrum Coal Private Ltd. 2x50 100 2x50 100
ESSAR Mahan 1x600 600 1x600 600
GMR-Chhatisgarh Energy Ltd 2x685 1370 2x685 1370
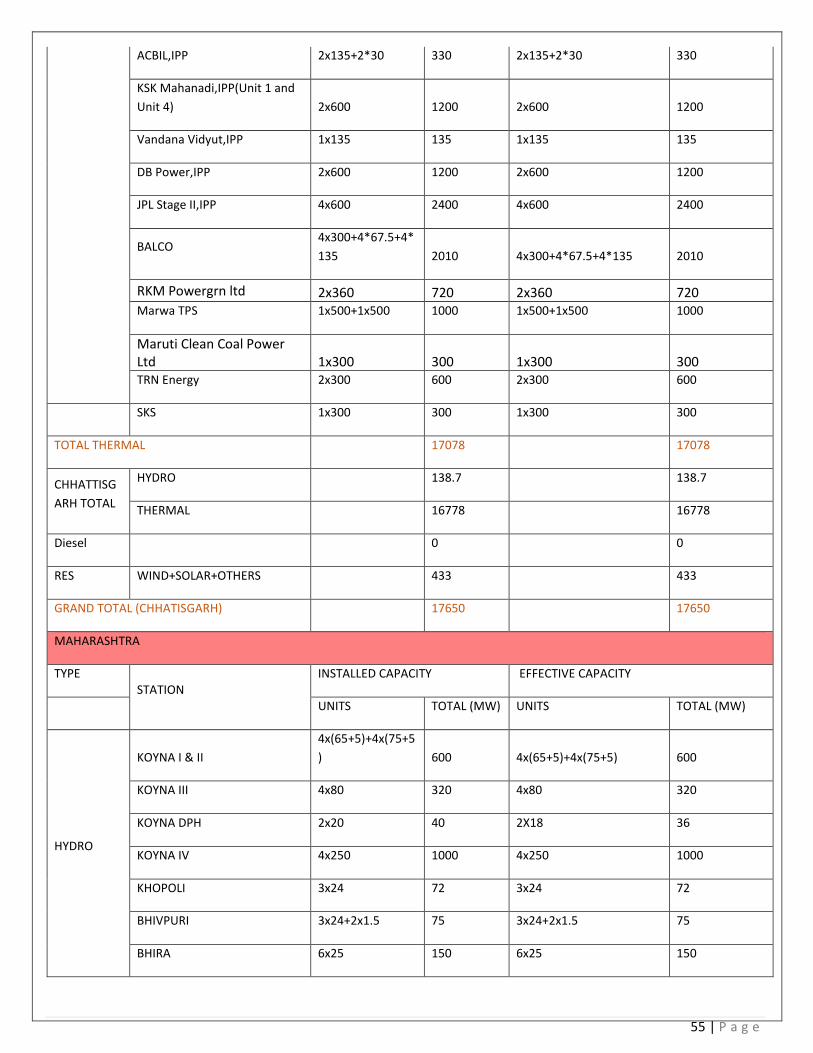
55 | P a g e
ACBIL,IPP 2x135+2*30 330 2x135+2*30 330
KSK Mahanadi,IPP(Unit 1 and
Unit 4) 2x600 1200 2x600 1200
Vandana Vidyut,IPP 1x135 135 1x135 135
DB Power,IPP 2x600 1200 2x600 1200
JPL Stage II,IPP 4x600 2400 4x600 2400
BALCO 4x300+4*67.5+4*
135 2010 4x300+4*67.5+4*135 2010
RKM Powergrn ltd 2x360 720 2x360 720 Marwa TPS 1x500+1x500 1000 1x500+1x500 1000
Maruti Clean Coal Power Ltd 1x300 300 1x300 300 TRN Energy 2x300 600 2x300 600
SKS 1x300 300 1x300 300
TOTAL THERMAL 17078 17078
CHHATTISG
ARH TOTAL
HYDRO 138.7 138.7
THERMAL 16778 16778
Diesel 0 0
RES WIND+SOLAR+OTHERS 433 433
GRAND TOTAL (CHHATISGARH) 17650 17650
MAHARASHTRA
TYPE STATION
INSTALLED CAPACITY EFFECTIVE CAPACITY
UNITS TOTAL (MW) UNITS TOTAL (MW)
HYDRO
KOYNA I & II
4x(65+5)+4x(75+5
) 600 4x(65+5)+4x(75+5) 600
KOYNA III 4x80 320 4x80 320
KOYNA DPH 2x20 40 2X18 36
KOYNA IV 4x250 1000 4x250 1000
KHOPOLI 3x24 72 3x24 72
BHIVPURI 3x24+2x1.5 75 3x24+2x1.5 75
BHIRA 6x25 150 6x25 150

56 | P a g e
BHIRA PSS 1x150 150 1x150 150
VAITHARNA 1x60 60 1x60 60
TILLARI 1x66 66 1x66 66
BHIRA T/R 2x40 80 2x40 80
GOM HYDRO 38 38
DADSON 1x44 44 1x44 44
GHATGHAR 2x125 250 2x125 250
TOTAL HYDRO 2945 2941
CHANDRAPUR 2x0+2x210+3x500 1920 2x0+2x210+3x500 1920
Coal
CHANDRAPUR Extension 1x500+1x500 1000 1x500+1x500 1000
TROMBAY 2x500+1X250 1250 2x500+1X250 1250
KORADI 1x200+2x210 620 1x200+2x210 620
KORADI 3x660 1980 3x660 1980
NASIK 3x210 630 3x210 630
KHAPERKHEDA 4x210+1x500 1340 4x210 +1x500 1340
PARLI
2x0+1x0+2x210+2
x250+1x250 1170
2x0+1x0+2x210+2x250+1x
250 1170
BHUSAWAL 2x210+ 2x500 1420 2x210+ 2x500 1420
REL DAHANU 2x250 500 2x250 500
PARAS 2x250 500 2x250 500
JSW Ratnagiri(Jaigad) 4x300 1200 4x300 1200
Mihan TPP(Abhijit) 4x61.5 246 4x62.5 246
Wardha Warora Power Co Ltd. 4x135 540 4x135 540
Vidharbha Industry, Butibori 2x300 600 2x300 600
APML,Tiroda-Ph-I(400 kV) 3x660 1980 3x660 1980
APML,Tiroda-Ph-II( 765 kV) 2x660 1320 2x660 1320
IEPL (Ideal Energy Power Ltd,
Belapur) 1x270 270 1x270 270
IBL (India Bulls Limited,
Amravati)
Ratan India
5x270 1350 5x270 1350
57 | P a g e
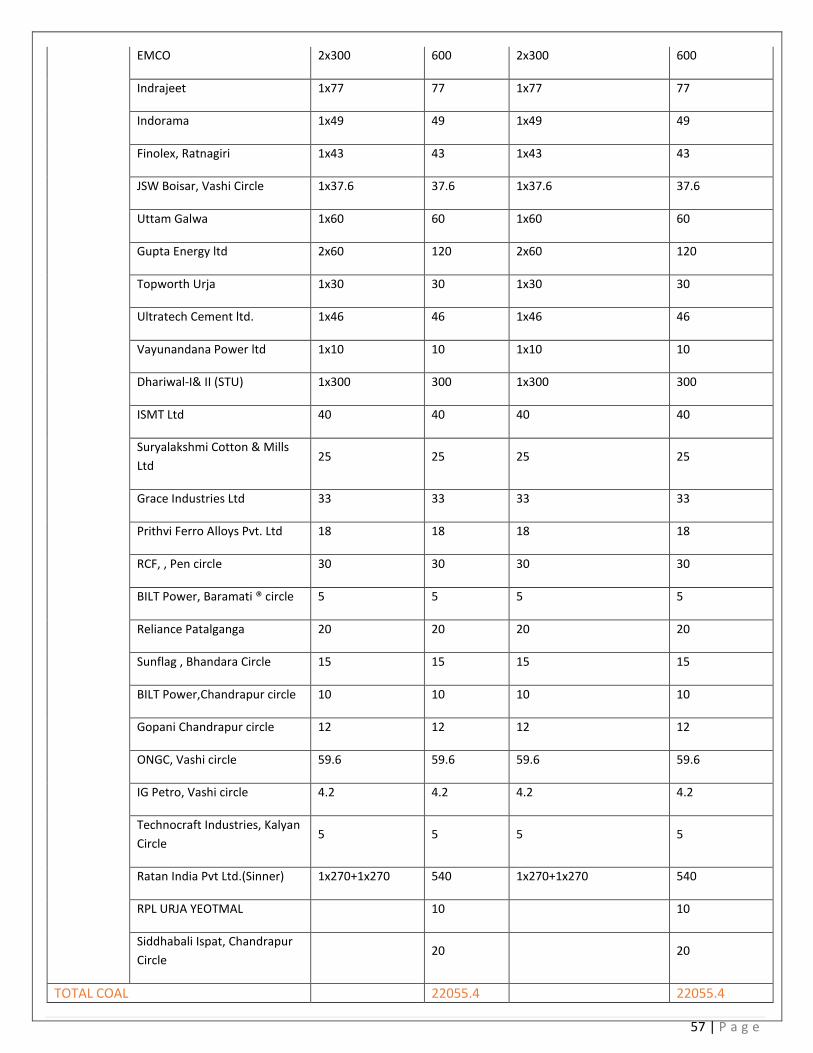
EMCO 2x300 600 2x300 600
Indrajeet 1x77 77 1x77 77
Indorama 1x49 49 1x49 49
Finolex, Ratnagiri 1x43 43 1x43 43
JSW Boisar, Vashi Circle 1x37.6 37.6 1x37.6 37.6
Uttam Galwa 1x60 60 1x60 60
Gupta Energy ltd 2x60 120 2x60 120
Topworth Urja 1x30 30 1x30 30
Ultratech Cement ltd. 1x46 46 1x46 46
Vayunandana Power ltd 1x10 10 1x10 10
Dhariwal-I& II (STU) 1x300 300 1x300 300
ISMT Ltd 40 40 40 40
Suryalakshmi Cotton & Mills
Ltd 25 25 25 25
Grace Industries Ltd 33 33 33 33
Prithvi Ferro Alloys Pvt. Ltd 18 18 18 18
RCF, , Pen circle 30 30 30 30
BILT Power, Baramati ® circle 5 5 5 5
Reliance Patalganga 20 20 20 20
Sunflag , Bhandara Circle 15 15 15 15
BILT Power,Chandrapur circle 10 10 10 10
Gopani Chandrapur circle 12 12 12 12
ONGC, Vashi circle 59.6 59.6 59.6 59.6
IG Petro, Vashi circle 4.2 4.2 4.2 4.2
Technocraft Industries, Kalyan
Circle 5 5 5 5
Ratan India Pvt Ltd.(Sinner) 1x270+1x270 540 1x270+1x270 540
RPL URJA YEOTMAL 10 10
Siddhabali Ispat, Chandrapur
Circle 20 20
TOTAL COAL 22055.4 22055.4

58 | P a g e
GAS
TROMBAY-7A & 7B 120+60 180 120+60 180
URAN (G) 4x10⁸ 432 4x10⁸ 432
URAN-DPH 2x120 240 2x120 240
RATNAGIRI PHASE - I 2x205+1x230 640 2x205+1x230 640
RATNAGIRI PHASE -II 2x213 + 237.54 663.54 2x213 + 237.54 663.54
RATNAGIRI PHASE- III 2x213 + 237.55 663.54 2x213 + 237.55 663.54
Pioneer Gas Pvt Ltd 1x126 + 1x262 388 1x126 + 1x262 388
TOTAL GAS 3207 3207
Diesel Diesel 0 0
RES WIND+SOLAR+OTHERS 7648 7648
MAHARASH
TRA
HYDRO 2945 2941
COAL 22055.4 22055.4
GAS 3207.08 3207.08
WIND+RES 7648 7648
GRAND
TOTAL
(MAHARAS
HTRA) 35855 35851
GOA
TYPE STATION INSTALLED CAPACITY EFFECTIVE CAPACITY
UNITS TOTAL (MW) UNITS TOTAL (MW)
Diesel 0 0
RES 0.1 0.1
GAS RELIANCE, SALGAONKAR 1x39.82+1x8.2 48.02 1x39.82+1x8.2 48.02 GRAND TOTAL (GOA) 48 48
**Total 6 units of 660 MW each are installed at SASAN but only 37.5% of 3960 MW is allocated to MP in Western Region.
** CGPL have 47.5 % (1971 MW) share of total installed capacity 4150 MW.
** APL have 2000 MW share of total installed capacity 2640 MW, Essar Vadinar 1000 MW out of 1200 MW capacity& Essar have
300 MW share out of 515 MW installed capacity.
***Torrent Power (AECO) Gas station units (100 MW capacity) are retired as per CEA letter No. CEA/PLG/PDM/545/2013/803
Dated 05.08.2015, w.e.f. 01.04.2014.
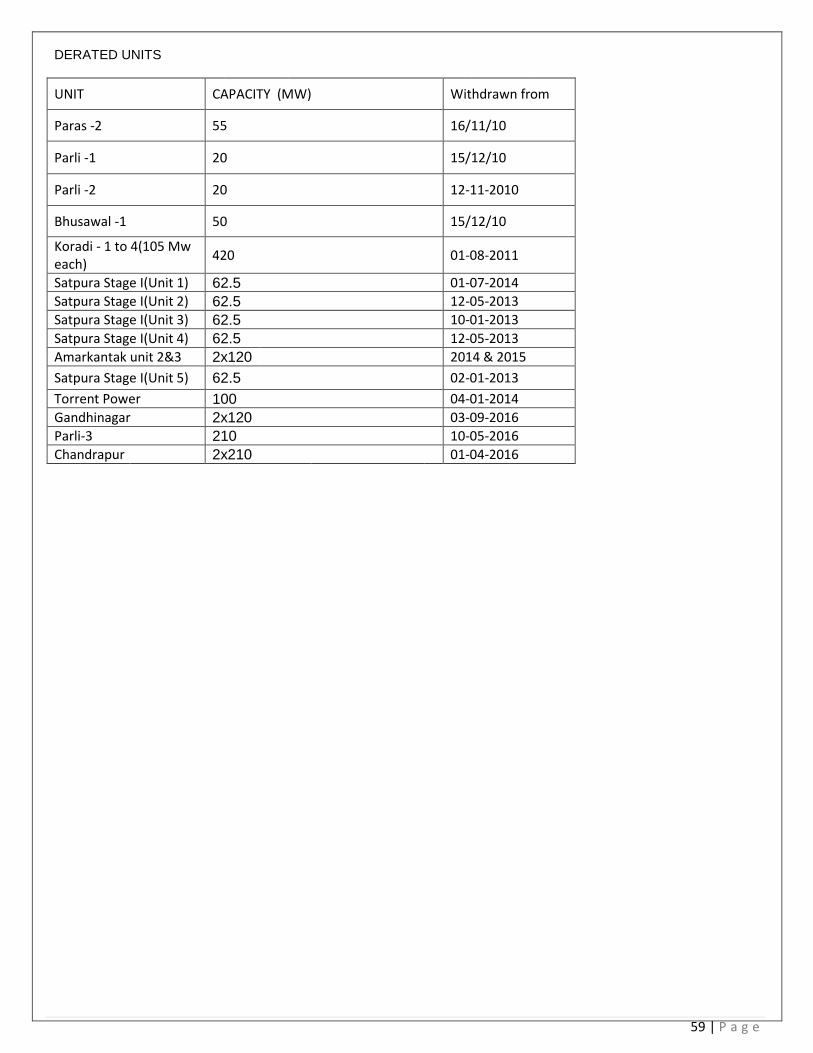
PARAS-2, PARLI-1&2,BHUSAWAL-1 ,& KORADI 1 TO 4, SATPURA STAGE I(UNIT 1-5) DERATED
BY 877.5 MW TOTAL
59 | P a g e
DERATED UNITS
UNIT CAPACITY (MW) Withdrawn from
Paras -2 55 16/11/10
Parli -1 20 15/12/10
Parli -2 20 12-11-2010
Bhusawal -1 50 15/12/10
Koradi - 1 to 4(105 Mw each)
420 01-08-2011
Satpura Stage I(Unit 1) 62.5 01-07-2014 Satpura Stage I(Unit 2) 62.5 12-05-2013 Satpura Stage I(Unit 3) 62.5 10-01-2013 Satpura Stage I(Unit 4) 62.5 12-05-2013 Amarkantak unit 2&3 2x120 2014 & 2015
Satpura Stage I(Unit 5) 62.5 02-01-2013 Torrent Power 100 04-01-2014 Gandhinagar 2x120 03-09-2016 Parli-3 210 10-05-2016 Chandrapur 2x210 01-04-2016

60 | P a g e
2.5 Angular separation violation report for Aug.’17-
2.6 System Reliability Indices (ATC/TTC and VDI) Monthly Report 2017-18: Details of percentage of time ATC (Available Transfer Capability) violation, percentage of time (N-1) criteria violation and Voltage Deviation Index (VDI) are available at link given below-
https://posoco.in/reports/system-reliability-indices/Monthly-vdittcatc/monthly-vdittcatc-2017-18/


![Ch.3 Demand Forecasting. - IEMS연구센터 홈페이지. Demand Forecasting.pdf · - 2 - Demand Forecasting. [Other Resource] Definition. ․ An estimate of future demand. ․ A](https://img.pdfslide.tips/doc/110x75/5a8a4f557f8b9a085a8bd6d2/ch3-demand-forecasting-iems-demand-2-demand-forecasting.jpg)