Embed Size (px)
Citation preview
1
Six Sigma
Achieving Our Objectives指導教授 : 盧淵源
第二組 組長 : 蔡孟行組員 : 詹美琴 陳文德
吳宗啟 周永宏簡總益

2
The Focus of Six SigmaThe Focus of Six Sigma Identifying critical aspects of the business with
problems or opportunities for improvement.
Targeting those critical areas and designating improvement efforts as Six Sigma Black Belt projects.
Selecting top people to work on the projects--full time.
Ensuring these people have the time, tools, and resources they need to succeed.
3
What Types of Problems Should We Target?What Types of Problems Should We Target?
High Defect Rates Low Yields Excessive Cycle Time Excessive Machine Down Time High Maintenance Costs Bottlenecks
4
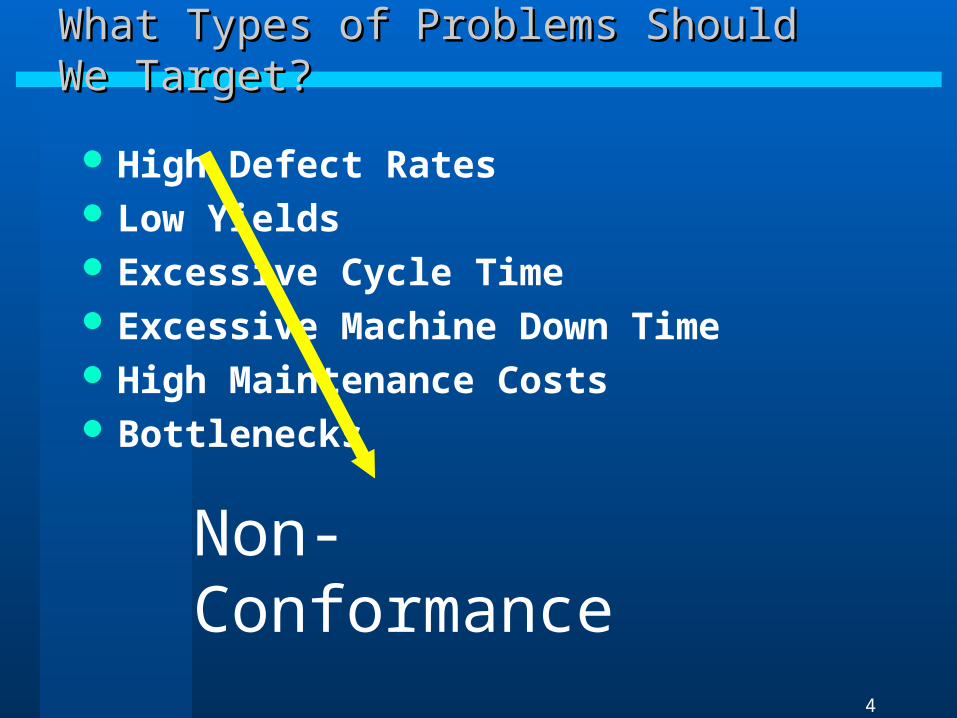
What Types of Problems Should We Target?What Types of Problems Should We Target?
High Defect Rates Low Yields Excessive Cycle Time Excessive Machine Down Time High Maintenance Costs Bottlenecks
Non-Conformance
5
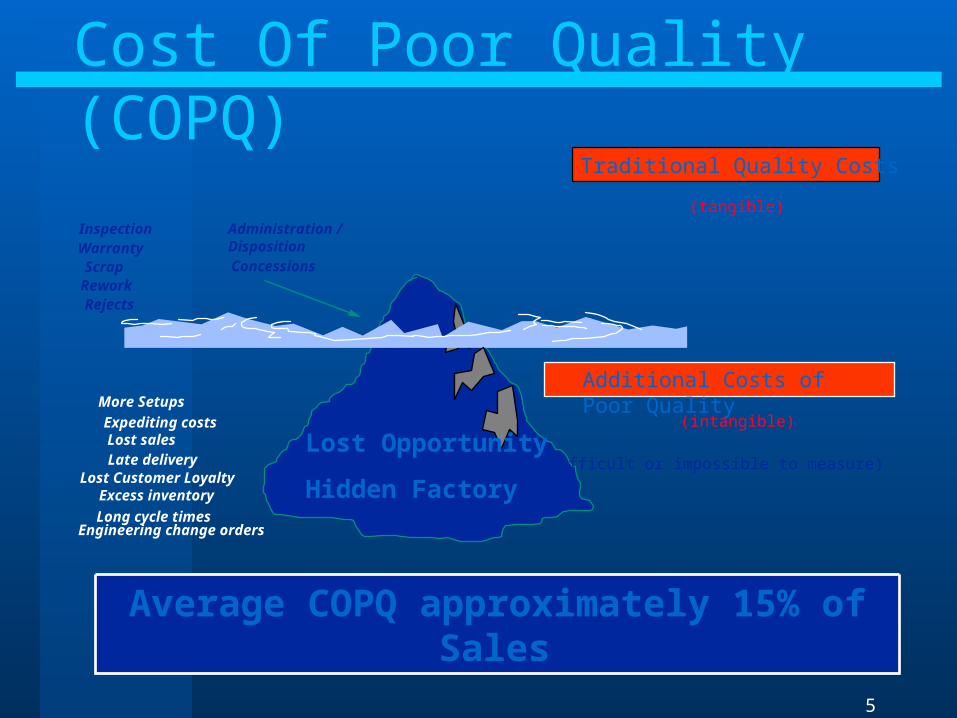
Cost Of Poor Quality (COPQ)
Traditional Quality Costs
(tangible)
Engineering change orders
Lost Opportunity
Hidden Factory
Lost salesLate delivery
Long cycle times
Expediting costs
Excess inventory
Additional Costs of Poor Quality
(intangible)
(Difficult or impossible to measure)Lost Customer Loyalty
More Setups
ScrapRework
InspectionWarranty
Rejects
Administration / DispositionConcessions
Average COPQ approximately 15% of Sales
6
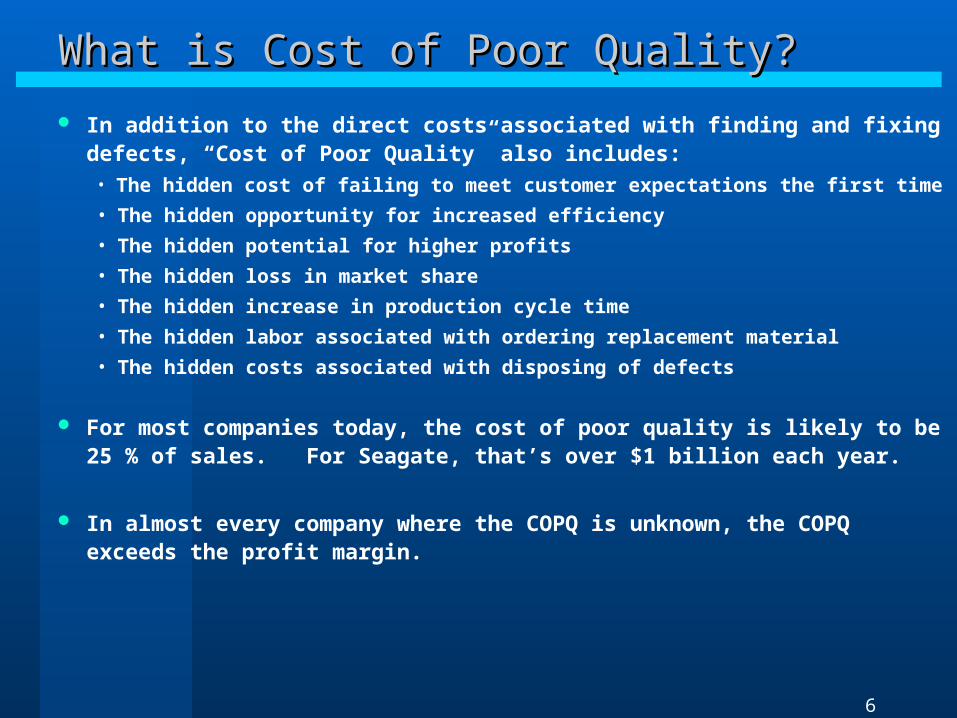
What is Cost of Poor Quality?What is Cost of Poor Quality?
In addition to the direct costs associated with finding and fixing defects, “Cost of Poor Quality” also includes:
• The hidden cost of failing to meet customer expectations the first time
• The hidden opportunity for increased efficiency
• The hidden potential for higher profits
• The hidden loss in market share
• The hidden increase in production cycle time
• The hidden labor associated with ordering replacement material
• The hidden costs associated with disposing of defects
For most companies today, the cost of poor quality is likely to be 25 % of sales. For Seagate, that’s over $1 billion each year.
In almost every company where the COPQ is unknown, the COPQ exceeds the profit margin.
7
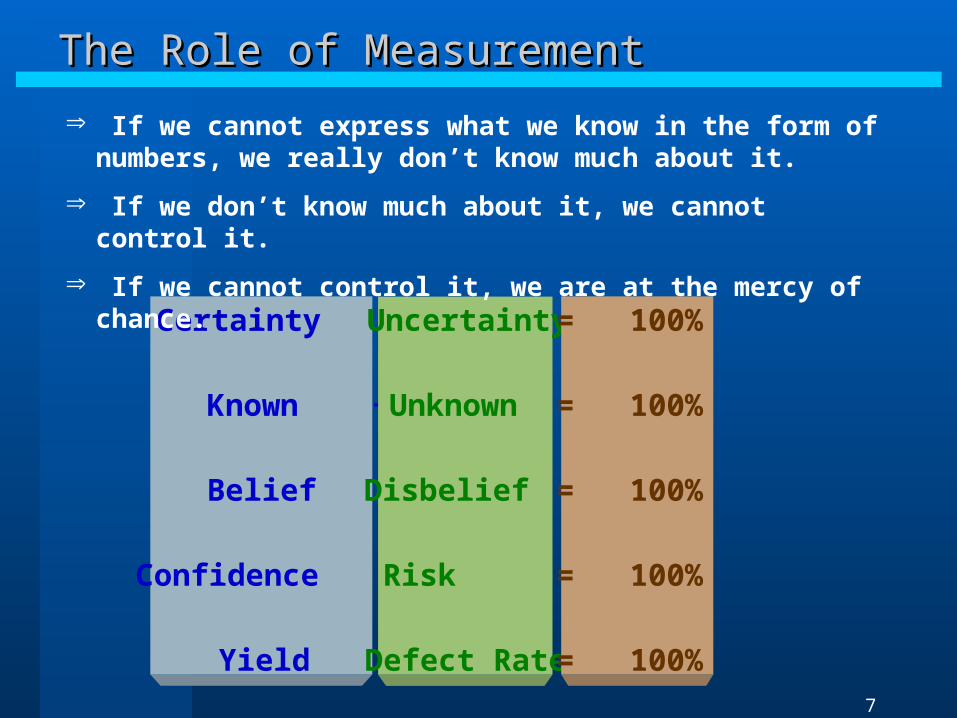
The Role of MeasurementThe Role of Measurement
Certainty +
Known +
Belief +
Confidence +
Yield +
Uncertainty
Unknown
Disbelief
Risk
Defect Rate
= 100%
= 100%
= 100%
= 100%
= 100%
If we cannot express what we know in the form of numbers, we really don’t know much about it.
If we don’t know much about it, we cannot control it.
If we cannot control it, we are at the mercy of chance.
8
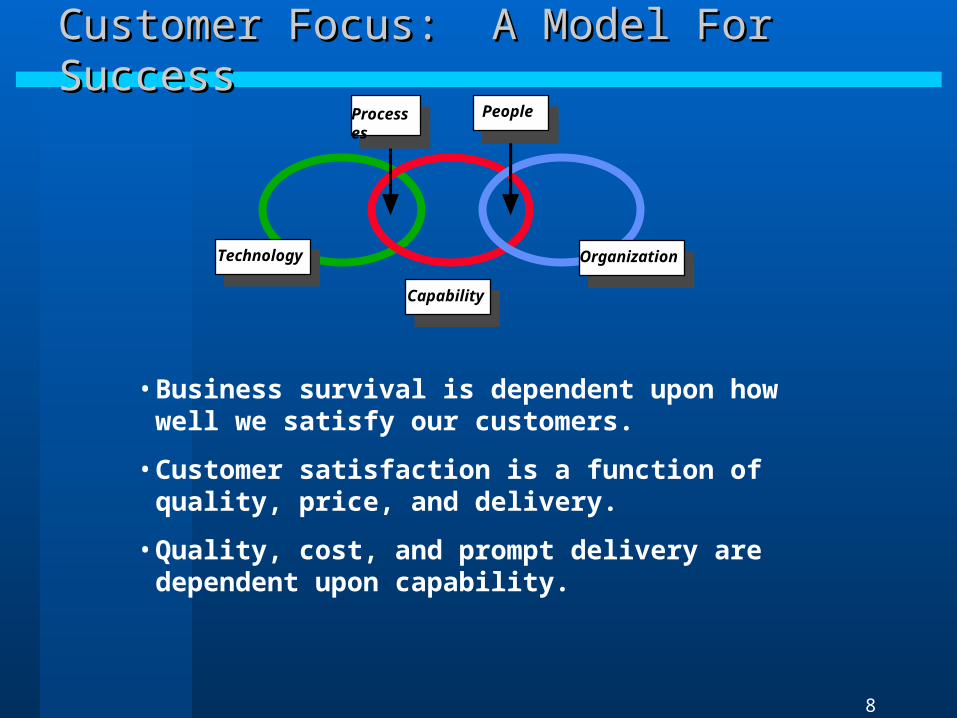
Customer Focus: A Model For SuccessCustomer Focus: A Model For Success
TechnologyTechnology
CapabilityCapability
OrganizationOrganization
PeoplePeople
ProcessesProcesses
• Business survival is dependent upon how well we satisfy our customers.
• Customer satisfaction is a function of quality, price, and delivery.
• Quality, cost, and prompt delivery are dependent upon capability.
9
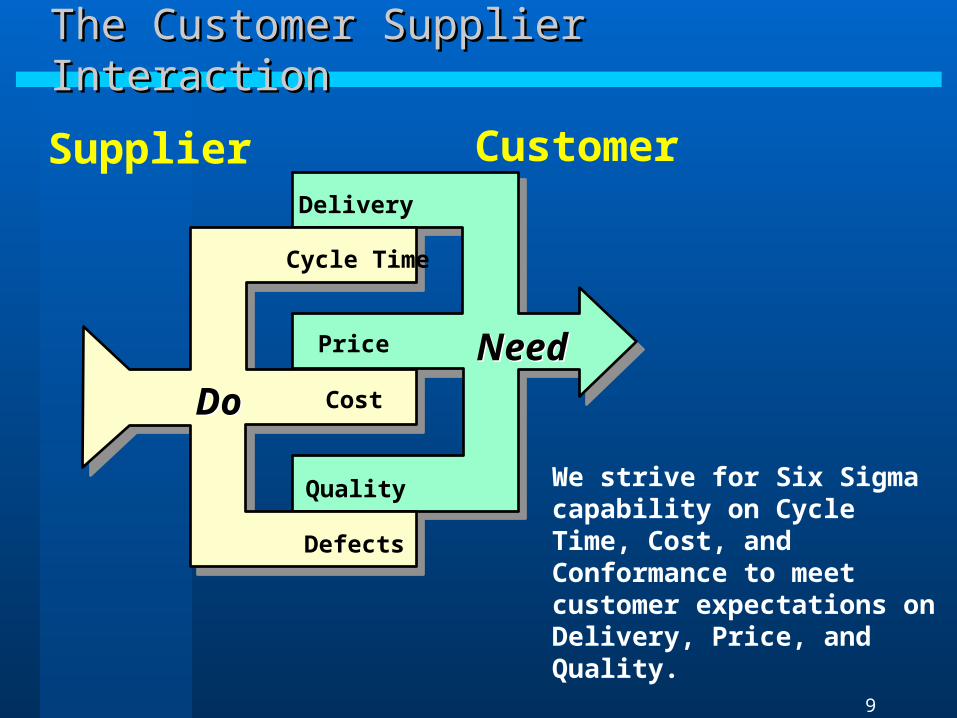
The Customer Supplier InteractionThe Customer Supplier Interaction
Delivery
Price
Quality
CustomerSupplier
NeedNeed
Cycle Time
Cost
Defects
DoDo
We strive for Six Sigma capability on Cycle Time, Cost, and Conformance to meet customer expectations on Delivery, Price, and Quality.
10
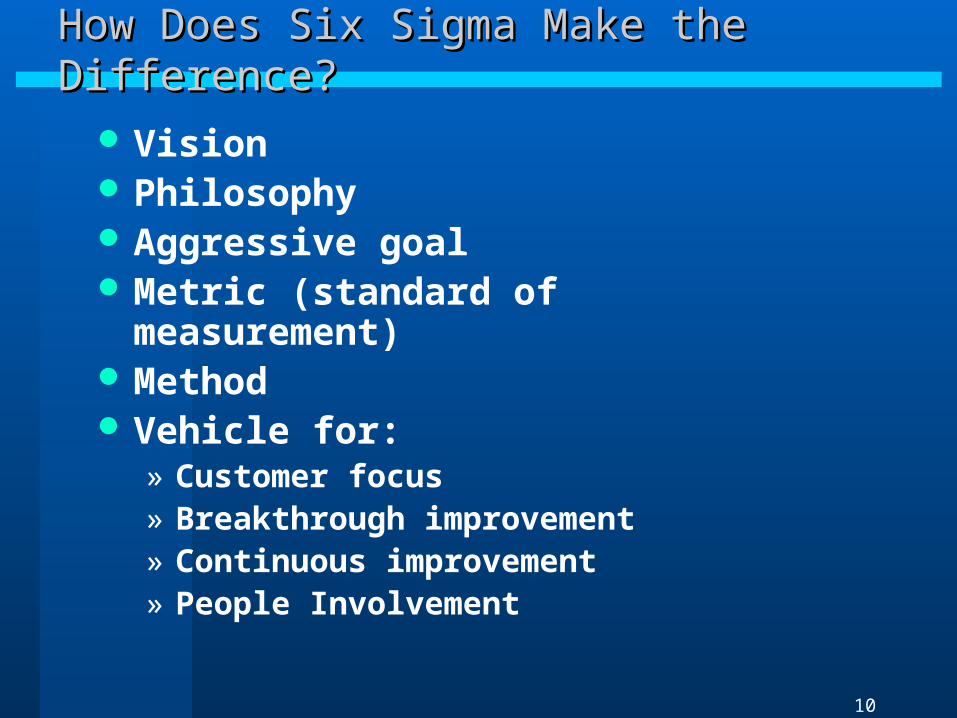
How Does Six Sigma Make the Difference?How Does Six Sigma Make the Difference?
Vision Philosophy Aggressive goal Metric (standard of measurement) Method Vehicle for:
» Customer focus» Breakthrough improvement» Continuous improvement» People Involvement

11
Six Sigma VisionSix Sigma Vision
The Vision of Six Sigma is to delight customers by delivering world-class quality products through the achievement of Six Sigma levels of performance in everything we do.
12
Six Sigma PhilosophySix Sigma Philosophy
The philosophy of Six Sigma is to apply a structured, systematic approach to achieve breakthrough improvement across all areas of our business.
13
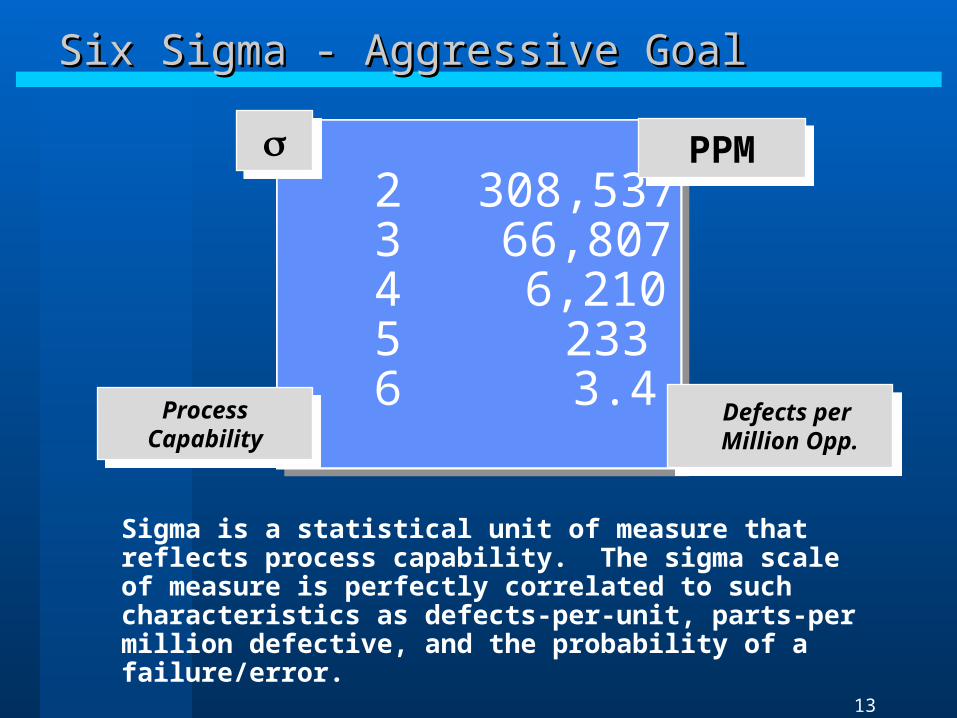
Sigma is a statistical unit of measure that reflects process capability. The sigma scale of measure is perfectly correlated to such characteristics as defects-per-unit, parts-per million defective, and the probability of a failure/error.
2 308,5373 66,8074 6,2105 2336 3.4
PPMPPM
ProcessCapability
ProcessCapability
Defects per Million Opp.
Six Sigma - Aggressive GoalSix Sigma - Aggressive Goal
14
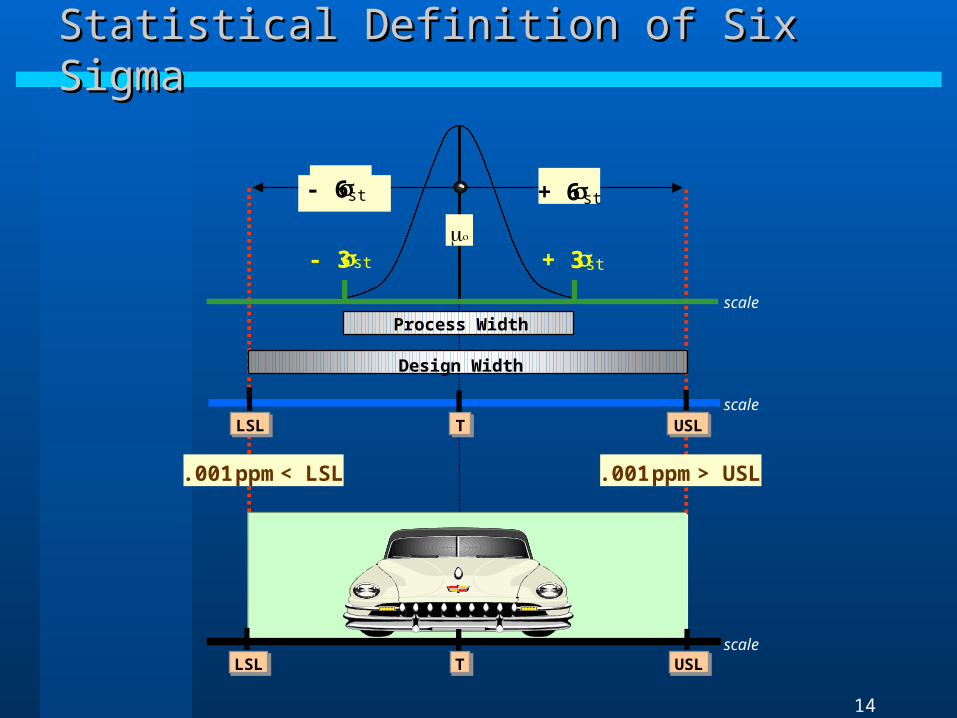
Statistical Definition of Six SigmaStatistical Definition of Six Sigma
LSLLSL USLUSL
Process Width
Design Width
- 3st + 3st
TT
.001 ppm > USL.001 ppm < LSL
scale
LSLLSL USLUSLscale
TT
+ 6st
scale
- 6st
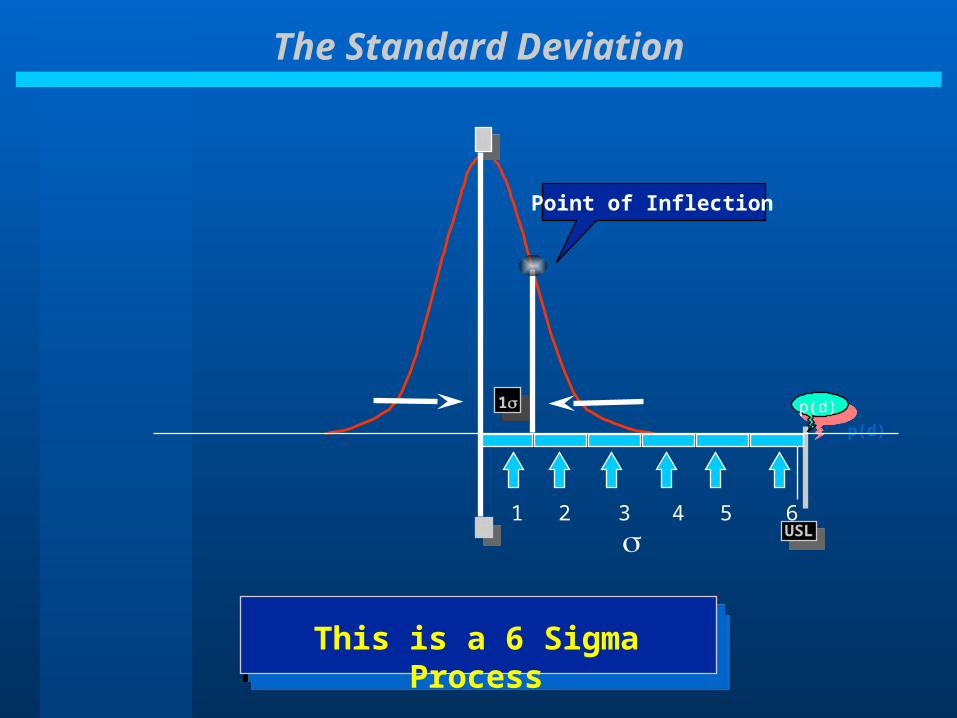
Point of Inflection
11
TTUSLUSL
p(d)
p(d)
1 2 3 4 5 6
33
This is a 6 Sigma Process
The Standard Deviation

16
3 Sigma
6 Sigma
5 Sigma
4 Sigma
93.32 %
99.379 %
99.9767 %
99.99966 %
Historical
Current
Intermediate
Long-Run
Sigma Long-Term Yield Standard
Six Sigma - Performance TargetSix Sigma - Performance Target
17
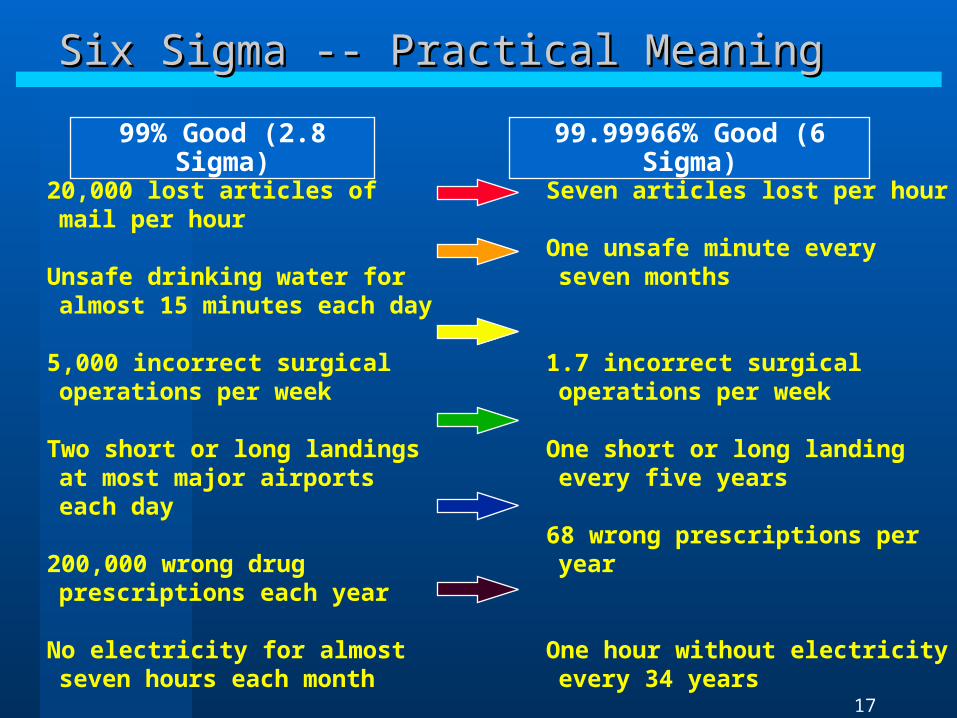
99.99966% Good (6 Sigma)
20,000 lost articles of mail per hour
Unsafe drinking water for almost 15 minutes each day
5,000 incorrect surgical operations per week
Two short or long landings at most major airports each day
200,000 wrong drug prescriptions each year
No electricity for almost seven hours each month
Seven articles lost per hour
One unsafe minute every seven months
1.7 incorrect surgical operations per week
One short or long landing every five years
68 wrong prescriptions per year
One hour without electricity every 34 years
99% Good (2.8 Sigma)
Six Sigma -- Practical MeaningSix Sigma -- Practical Meaning
18
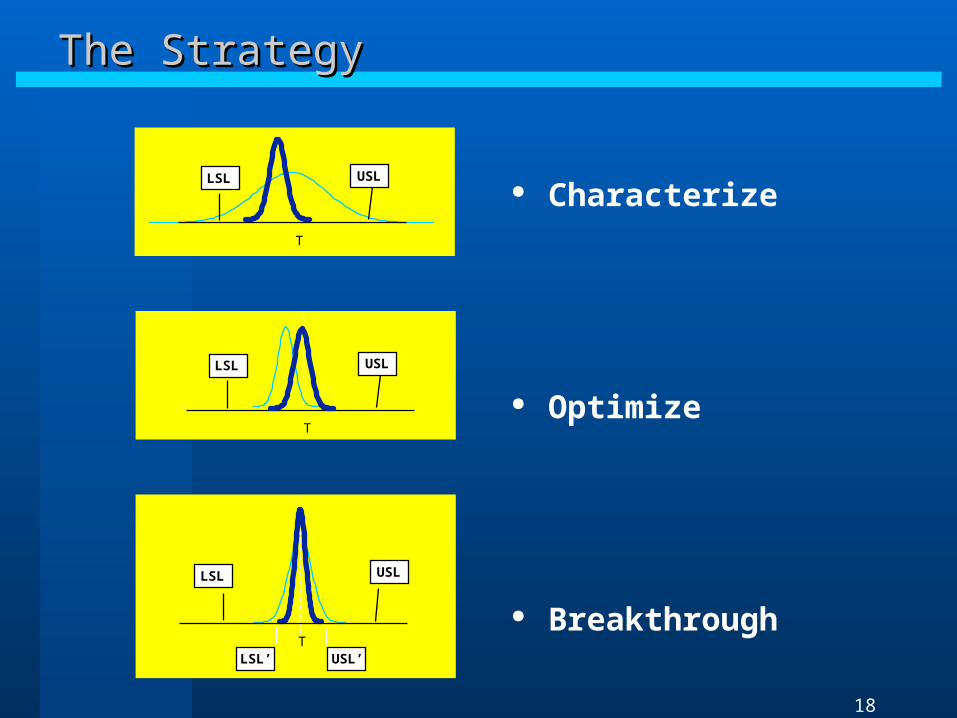
Characterize
Optimize
Breakthrough
USL
T
LSL
USL
T
LSL
T
USLLSL
USL’LSL’
The StrategyThe Strategy
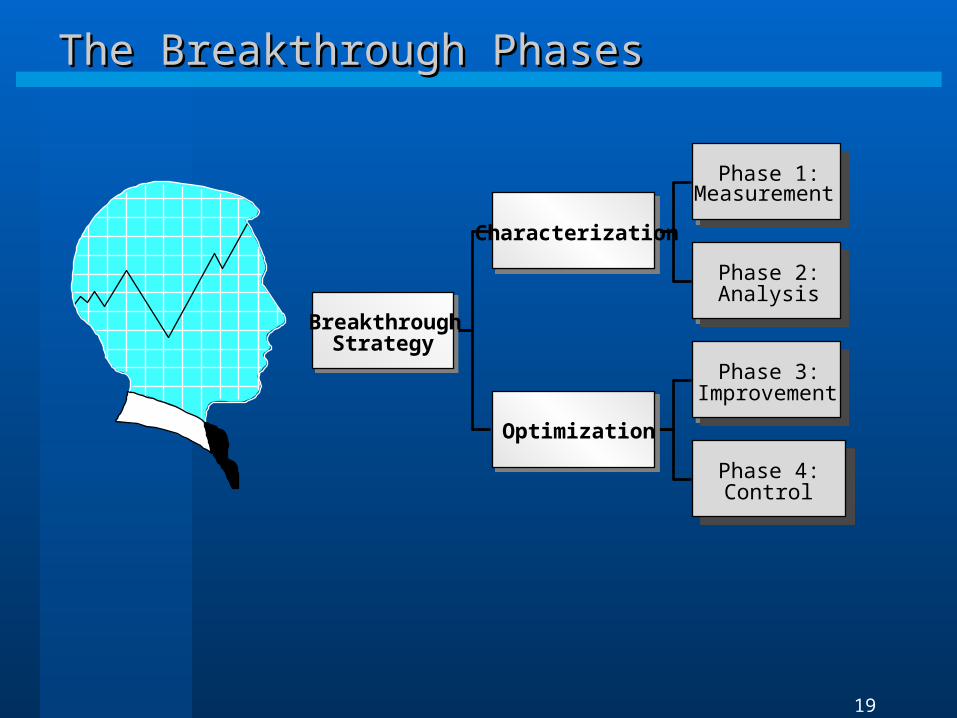
19
BreakthroughStrategy
Characterization
Phase 1:Measurement
Phase 2:Analysis
Optimization
Phase 3:Improvement
Phase 4:Control
The Breakthrough PhasesThe Breakthrough Phases
20
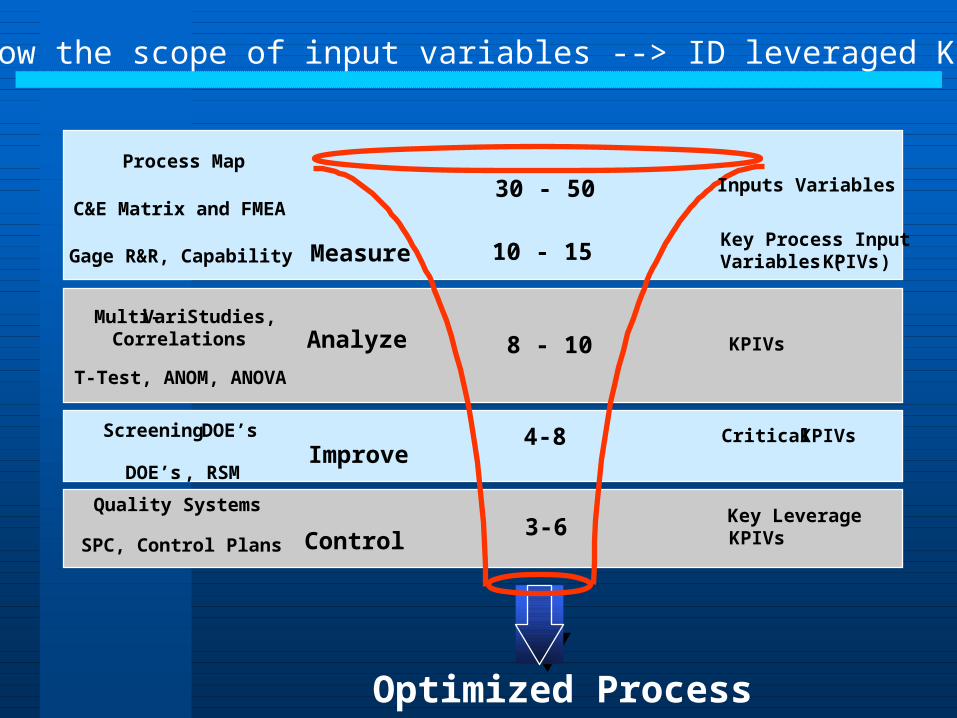
Six Sigma--MethodologySix Sigma--Methodology
Optimized Process
30 - 50
10 - 15
4-8
Key Process InputVariables (KPIVs )
8 - 10 KPIVs
Critical KPIVs
3-6 Key Leverage KPIVs
Inputs VariablesProcess Map
Multi-Vari Studies,Correlations
Screening DOE’s
DOE’s , RSM
C&E Matrix and FMEA
Gage R&R, Capability
T-Test, ANOM, ANOVA
Quality Systems
SPC, Control Plans
Measure
Analyze
Improve
Control
Narrow the scope of input variables --> ID leveraged KPIV’s
21
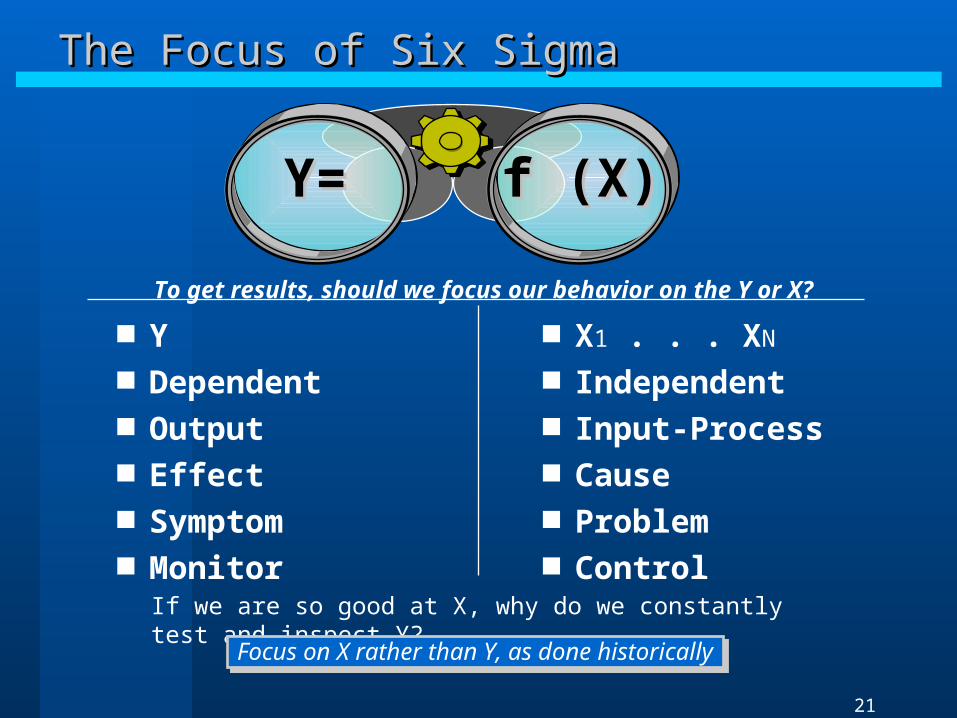
If we are so good at X, why do we constantly test and inspect Y?
Y Dependent Output Effect Symptom Monitor
X1 . . . XN
Independent Input-Process Cause Problem Control
To get results, should we focus our behavior on the Y or X?
f (X)f (X)Y=Y=
Focus on X rather than Y, as done historicallyFocus on X rather than Y, as done historically
The Focus of Six SigmaThe Focus of Six Sigma
22
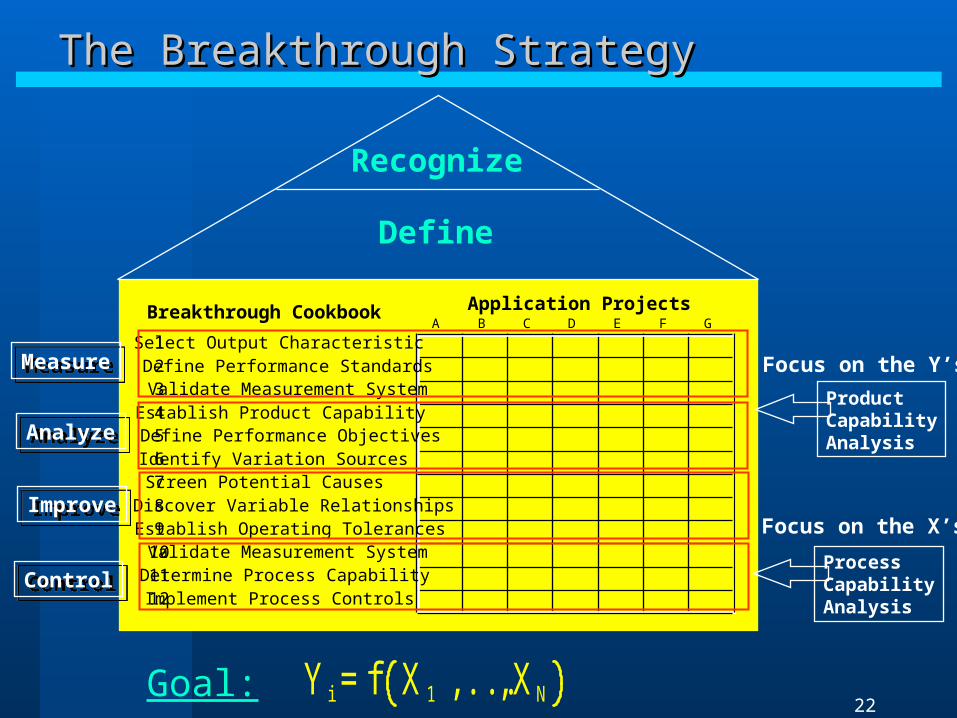
The Breakthrough StrategyThe Breakthrough Strategy
A B C D E F G
1 Select Output Characteristic2 Define Performance Standards3 Validate Measurement System4 Establish Product Capability5 Define Performance Objectives6 Identify Variation Sources7 Screen Potential Causes8 Discover Variable Relationships9 Establish Operating Tolerances
10 Validate Measurement System11 Determine Process Capability12 Implement Process Controls
Application ProjectsBreakthrough Cookbook
Recognize
Define
Y i = f X 1 , ... , XNGoal:
MeasureMeasure
AnalyzeAnalyze
ImproveImprove
ControlControl
ProductCapabilityAnalysis
ProcessCapabilityAnalysis
Focus on the Y’s
Focus on the X’s
23
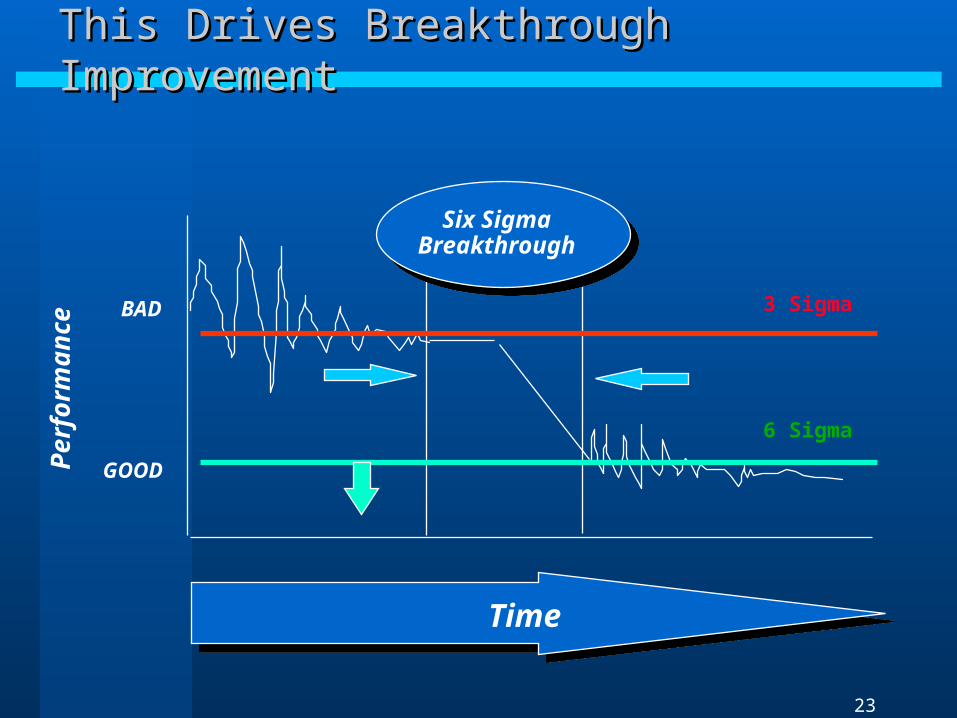
Time
Pe
rfo
rma
nc
e
GOOD
BAD 3 Sigma
6 Sigma
This Drives Breakthrough ImprovementThis Drives Breakthrough Improvement
Six SigmaBreakthrough
24
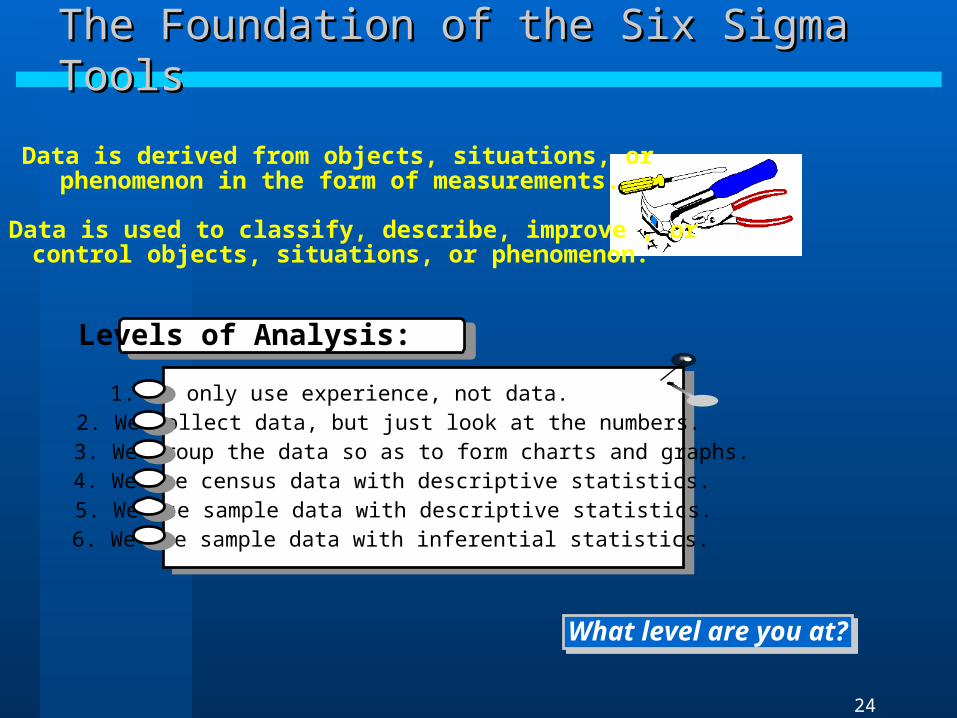
Data is derived from objects, situations, orphenomenon in the form of measurements.
Data is used to classify, describe, improve , orcontrol objects, situations, or phenomenon.
1. We only use experience, not data.2. We collect data, but just look at the numbers.3. We group the data so as to form charts and graphs.4. We use census data with descriptive statistics.5. We use sample data with descriptive statistics.6. We use sample data with inferential statistics.
Levels of Analysis:
What level are you at?What level are you at?
The Foundation of the Six Sigma ToolsThe Foundation of the Six Sigma Tools

25
Impact of Variation on CostImpact of Variation on Cost
UpperSpecification
Limit
LowerSpecification
Limit
LossNo Loss
Target
The Traditional View
UpperSpecification
Limit
LowerSpecification
Limit
LossLoss
Target
The Enlightened View
Goal Post
Mentality

26
CTX’s(Cost, Quality, Delivery, Satisfaction)Defects Per UnitComplexityDefects Per Million OpportunitiesRolled Throughput YieldRolled Throughput Yield NormalizedSigma ScoreProcess BaselineProcess EntitlementProcess BenchmarkingKPIV’sKPOV’sShift & Drift
Six Sigma MetricsExisting Metrics
YieldScrapRework?????
Leadership Must Ask the Right Questions
What Gets Measured Gets Managed
Six Sigma Metrics
27
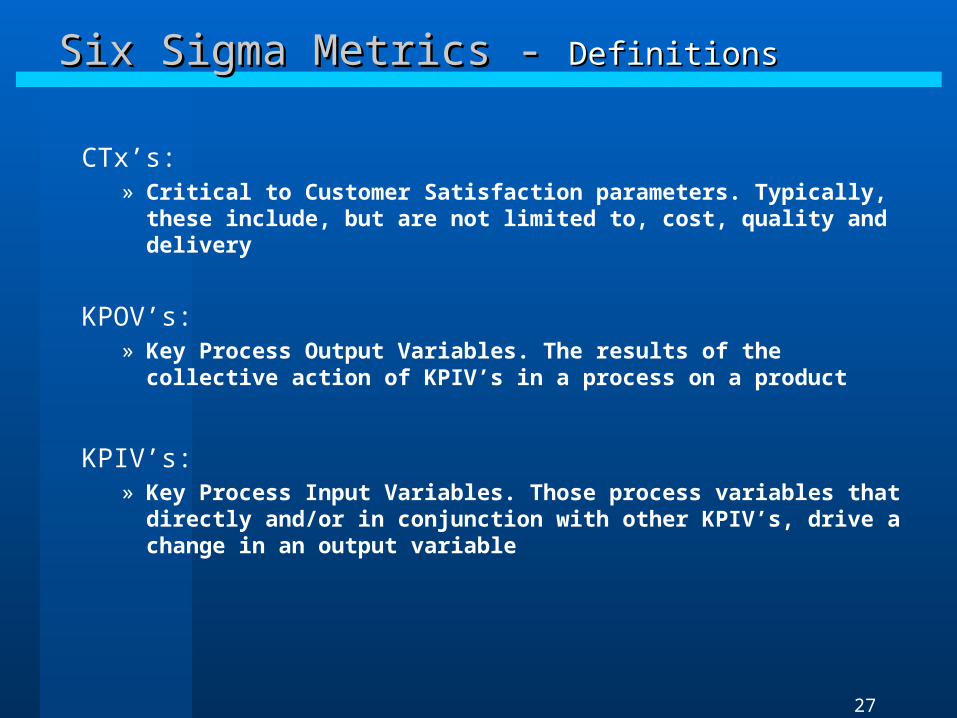
Six Sigma Metrics - Six Sigma Metrics - DefinitionsDefinitions
CTx’s:» Critical to Customer Satisfaction parameters. Typically, these
include, but are not limited to, cost, quality and delivery
KPOV’s:» Key Process Output Variables. The results of the collective
action of KPIV’s in a process on a product
KPIV’s:» Key Process Input Variables. Those process variables that
directly and/or in conjunction with other KPIV’s, drive a change in an output variable
28
CTX’sCTX’s
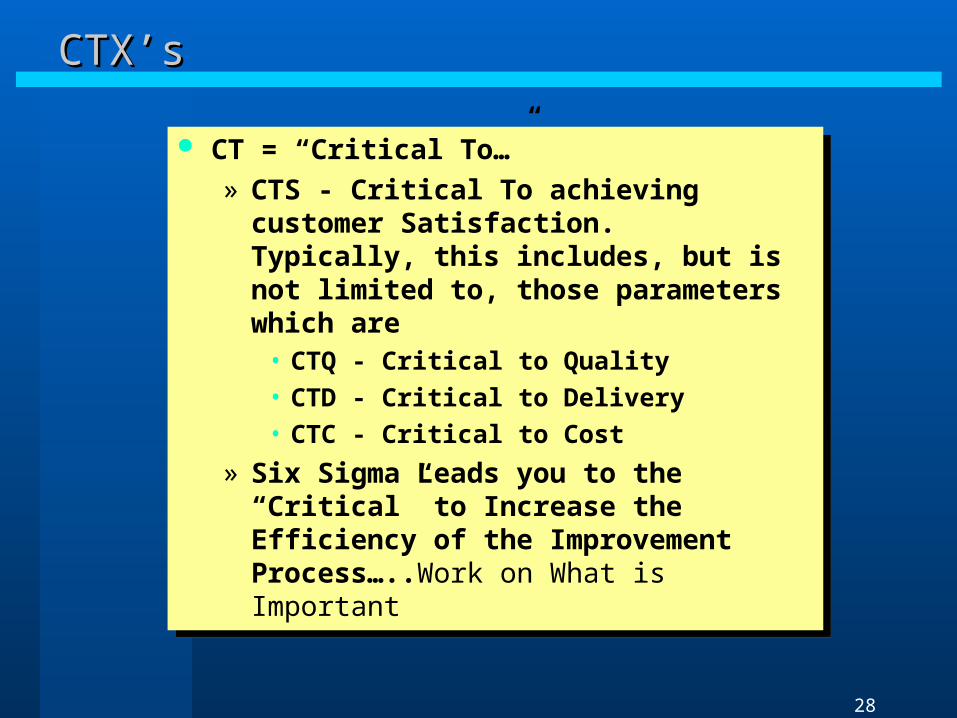
CT = “Critical To…”
» CTS - Critical To achieving customer Satisfaction. Typically, this includes, but is not limited to, those parameters which are
• CTQ - Critical to Quality• CTD - Critical to Delivery• CTC - Critical to Cost
» Six Sigma Leads you to the “Critical” to Increase the Efficiency of the Improvement Process…..Work on What is Important
29
Key Process VariablesKey Process Variables
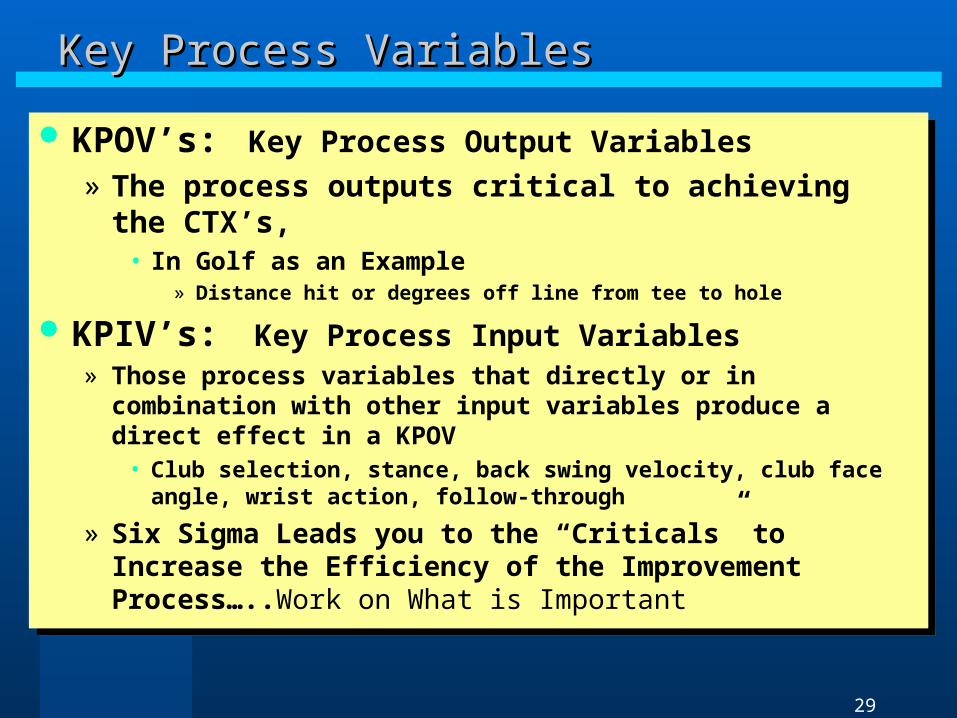
KPOV’s: Key Process Output Variables
» The process outputs critical to achieving the CTX’s, • In Golf as an Example
» Distance hit or degrees off line from tee to hole
KPIV’s: Key Process Input Variables» Those process variables that directly or in combination with
other input variables produce a direct effect in a KPOV• Club selection, stance, back swing velocity, club face angle, wrist
action, follow-through
» Six Sigma Leads you to the “Criticals” to Increase the Efficiency of the Improvement Process…..Work on What is Important

30
Six Sigma Metrics - Six Sigma Metrics - DefinitionsDefinitions
Process Baseline:» The average, long term defect level of a process when all input
variables in the process are running in an unconstrained fashion
Process Entitlement:» The best case, short term defect level of a process when all
input variables in the process are centered and in control
Process Benchmark:» The defect level of the process deemed by comparison to be
the best process possible
31
Process BaselineProcess Baseline
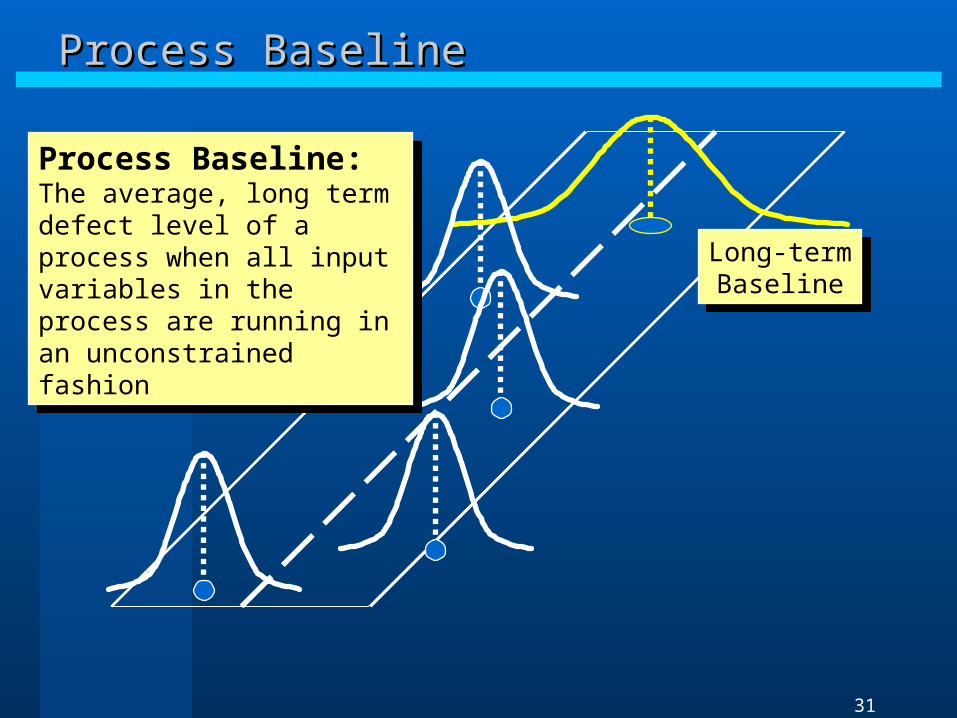
Process Baseline: The average, long term defect level of a process when all input variables in the process are running in an unconstrained fashion
Process Baseline: The average, long term defect level of a process when all input variables in the process are running in an unconstrained fashion
Long-term Baseline
Long-term Baseline
32
Process EntitlementProcess Entitlement
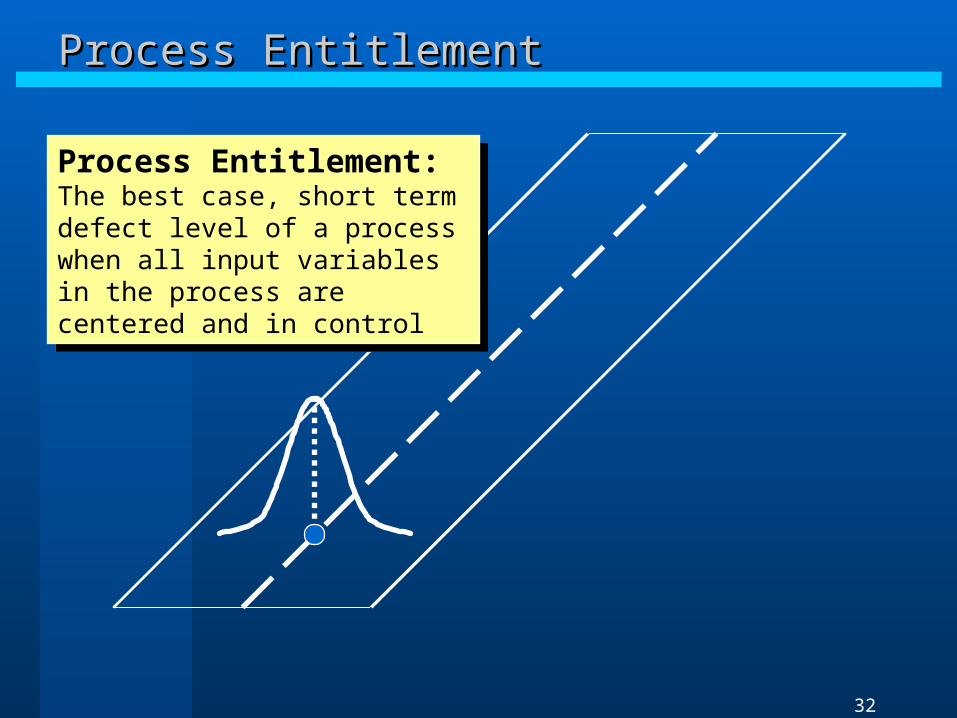
Process Entitlement: The best case, short term defect level of a process when all input variables in the process are centered and in control
Process Entitlement: The best case, short term defect level of a process when all input variables in the process are centered and in control

33
Process BenchmarkProcess Benchmark
Process Benchmark: The defect level of the process deemed by comparison to be the best process possible
Process Benchmark: The defect level of the process deemed by comparison to be the best process possible
Factory AFactory A
Factory BFactory B
Factory CFactory C
34
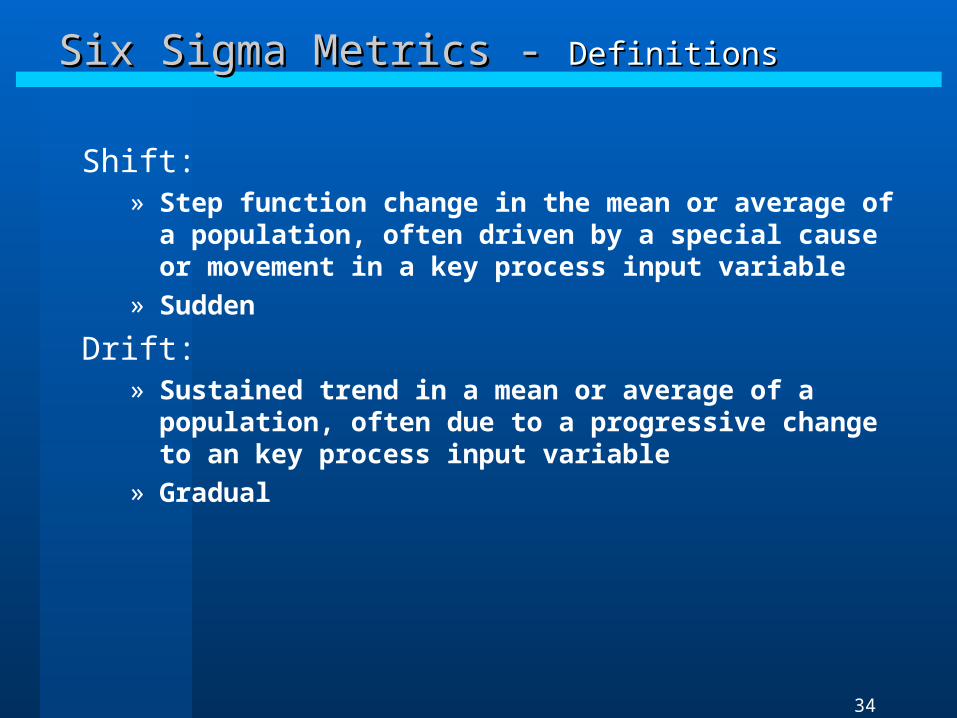
Six Sigma Metrics - Six Sigma Metrics - DefinitionsDefinitions
Shift:» Step function change in the mean or average of a
population, often driven by a special cause or movement in a key process input variable
» Sudden
Drift:» Sustained trend in a mean or average of a population,
often due to a progressive change to an key process input variable
» Gradual

35
Shift & DriftShift & Drift
Shift: Step function change in the mean or average of a population, often driven by a special cause or movement in a key process input variable
Shift: Step function change in the mean or average of a population, often driven by a special cause or movement in a key process input variable

36
Shift & DriftShift & Drift
Drift: Sustained trend in a mean or average of a population, often due to a progressive change to an key process input variable
Drift: Sustained trend in a mean or average of a population, often due to a progressive change to an key process input variable

37
Six Sigma Metrics - Six Sigma Metrics - DefinitionsDefinitions
Defects per Unit:» The total number of defects observed on a unit of output
Opportunities:» The number of possibilities for defect creation in a process or
sequence of processes.
DPMO:» Defects per million opportunities
38
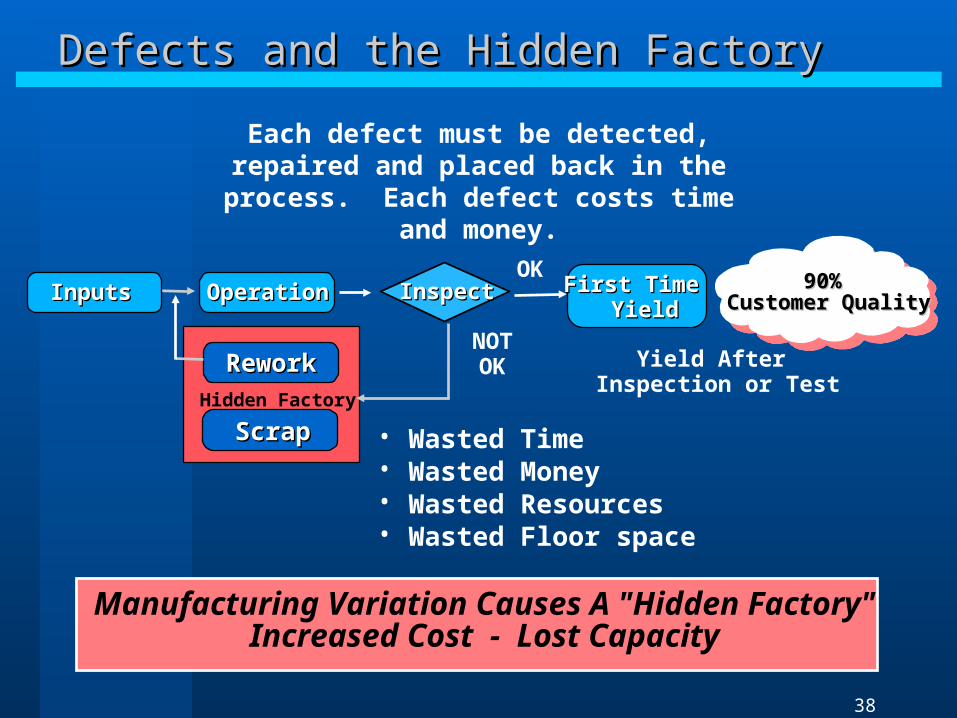
Manufacturing Variation Causes A "Hidden Factory"Increased Cost - Lost Capacity
Yield After Inspection or Test
Each defect must be detected, repaired and placed back in the process. Each defect
costs time and money.
ScrapScrap
ReworkReworkHidden Factory
NOTOK
OperationOperationInputsInputs InspectInspect First Time First Time YieldYield
OK
• Wasted Time• Wasted Money• Wasted Resources• Wasted Floor space
90% 90% Customer QualityCustomer Quality
Defects and the Hidden FactoryDefects and the Hidden Factory
39
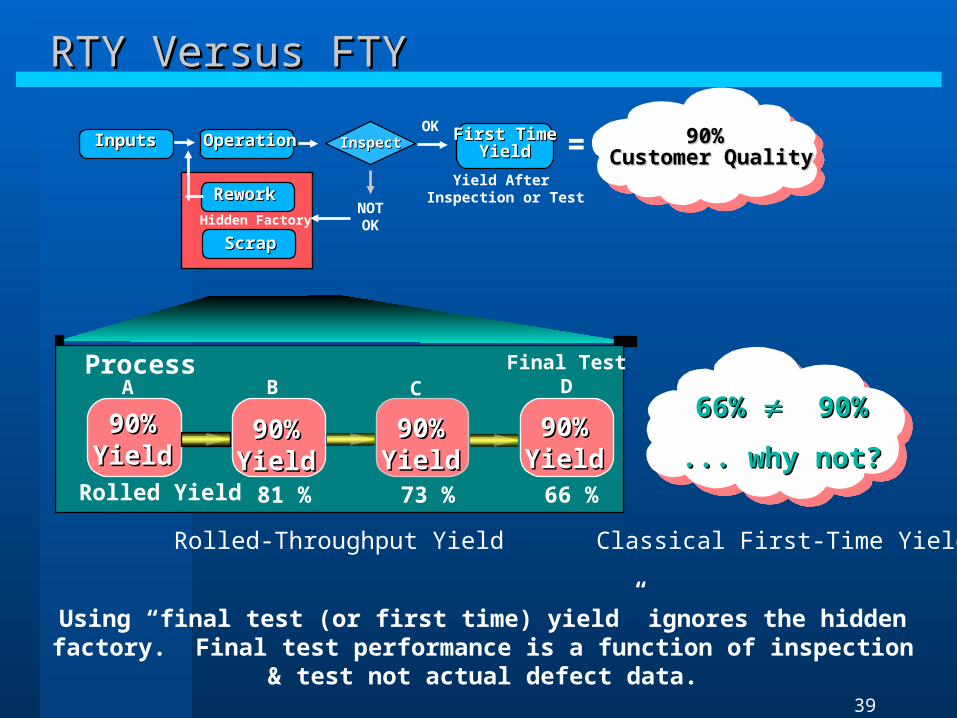
RTY Versus FTYRTY Versus FTY
66% 66% 90% 90%
... ... why not?why not?
ScrapScrap
90% 90% Customer QualityCustomer Quality
ReworkRework
Hidden FactoryNOTOK
Yield After Inspection or Test
OperationOperationInputsInputs InspectInspect First TimeFirst TimeYieldYield =
OK
ProcessA B C
90%90%YieldYield
90%90%YieldYield
90%90%YieldYield
Rolled Yield 81 % 73 %
90%90%YieldYield
Final TestD
66 %
Using “final test (or first time) yield” ignores the hidden factory. Final test performance is a function of inspection & test not actual defect data.
Rolled-Throughput Yield Classical First-Time Yield
40
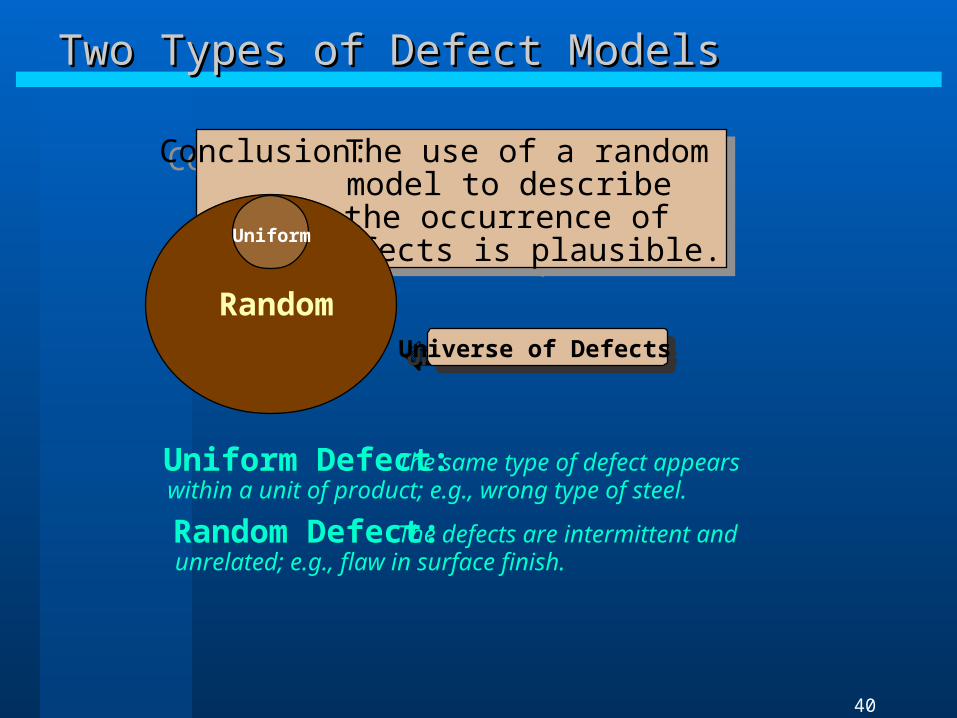
Two Types of Defect ModelsTwo Types of Defect Models
Uniform Defect: The same type of defect appearswithin a unit of product; e.g., wrong type of steel.
Random Defect: The defects are intermittent andunrelated; e.g., flaw in surface finish.
Conclusion: The use of a randommodel to describethe occurrence ofdefects is plausible.
Conclusion: The use of a randommodel to describethe occurrence ofdefects is plausible.
Random
Uniform
Universe of DefectsUniverse of Defects
41
Defects per UnitDefects per Unit
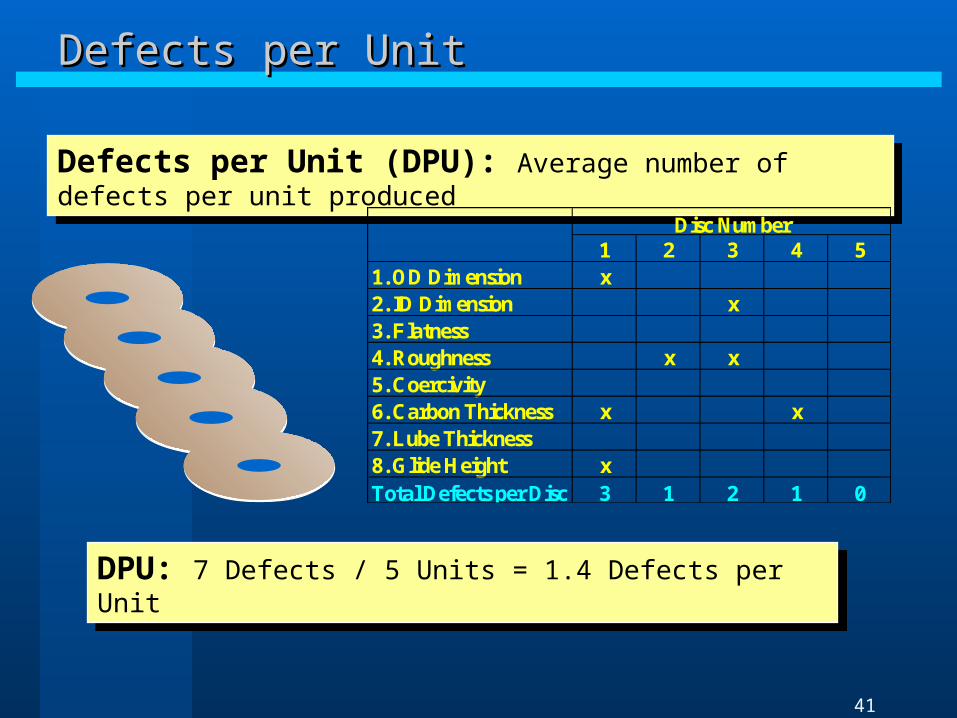
Defects per Unit (DPU): Average number of defects per unit producedDefects per Unit (DPU): Average number of defects per unit produced
DPU: 7 Defects / 5 Units = 1.4 Defects per UnitDPU: 7 Defects / 5 Units = 1.4 Defects per Unit
1 2 3 4 51. OD Dimension x2. ID Dimension x3. Flatness4. Roughness x x5. Coercivity6. Carbon Thickness x x7. Lube Thickness8. Glide Height xTotal Defects per Disc 3 1 2 1 0
Disc Number
42
OpportunitiesOpportunities
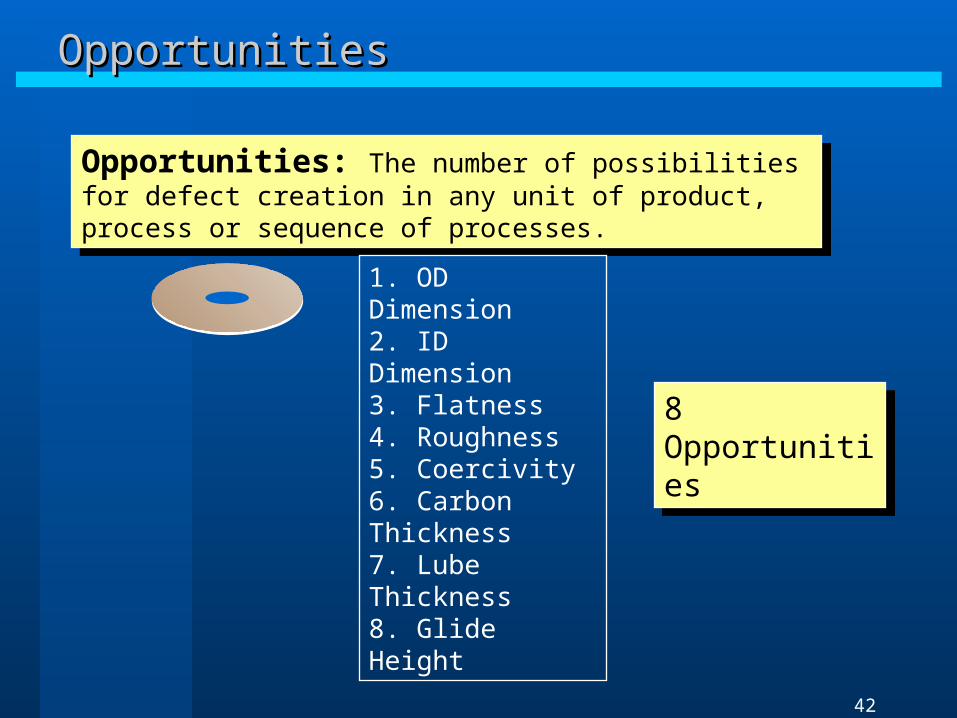
Opportunities: The number of possibilities for defect creation in any unit of product, process or sequence of processes.
Opportunities: The number of possibilities for defect creation in any unit of product, process or sequence of processes.
1. OD Dimension2. ID Dimension3. Flatness4. Roughness5. Coercivity6. Carbon Thickness7. Lube Thickness8. Glide Height
8 Opportunities8 Opportunities
43
1. OD Dimension2. ID Dimension3. Flatness4. Roughness5. Coercivity6. Carbon Thickness7. Lube Thickness8. Glide Height
OpportunitiesOpportunities
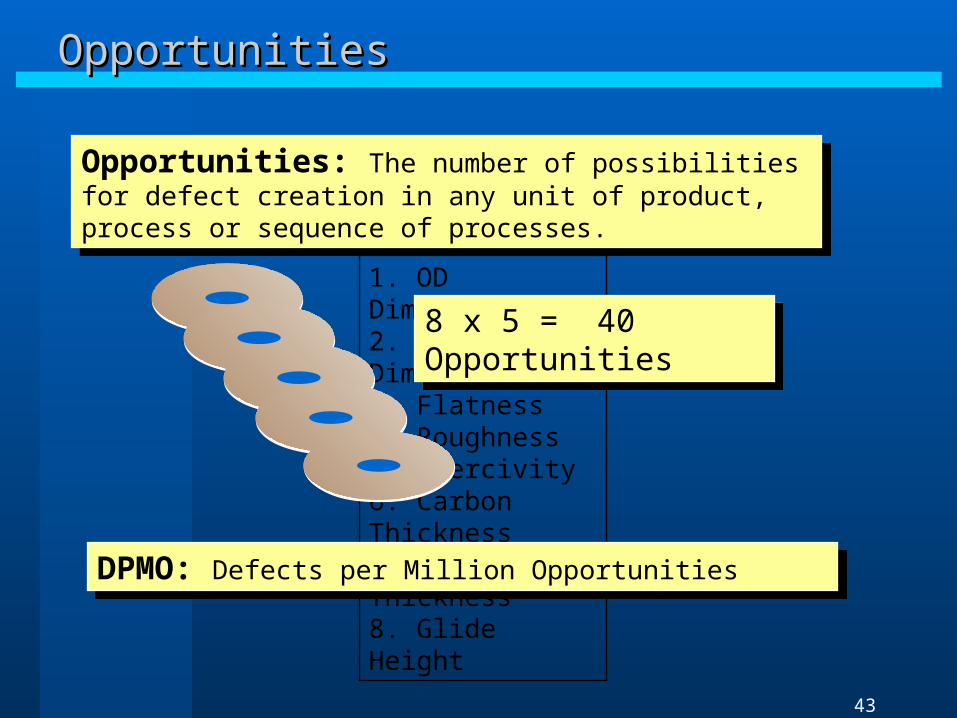
Opportunities: The number of possibilities for defect creation in any unit of product, process or sequence of processes.
Opportunities: The number of possibilities for defect creation in any unit of product, process or sequence of processes.
8 x 5 = 40 Opportunities8 x 5 = 40 Opportunities
DPMO: Defects per Million Opportunities DPMO: Defects per Million Opportunities
44
Six Sigma Metrics - Six Sigma Metrics - DefinitionsDefinitions
Classical Yield:» The number of good units divided by the number of units
tested or inspected
Rolled Throughput Yield (RTY):» The probability of a unit going through all process steps with
zero defects. This is used to identify and quantify the “Hidden Factory”
Hidden Factory:» The amount of work above and beyond the requirements
necessary to produce a unit of output
45
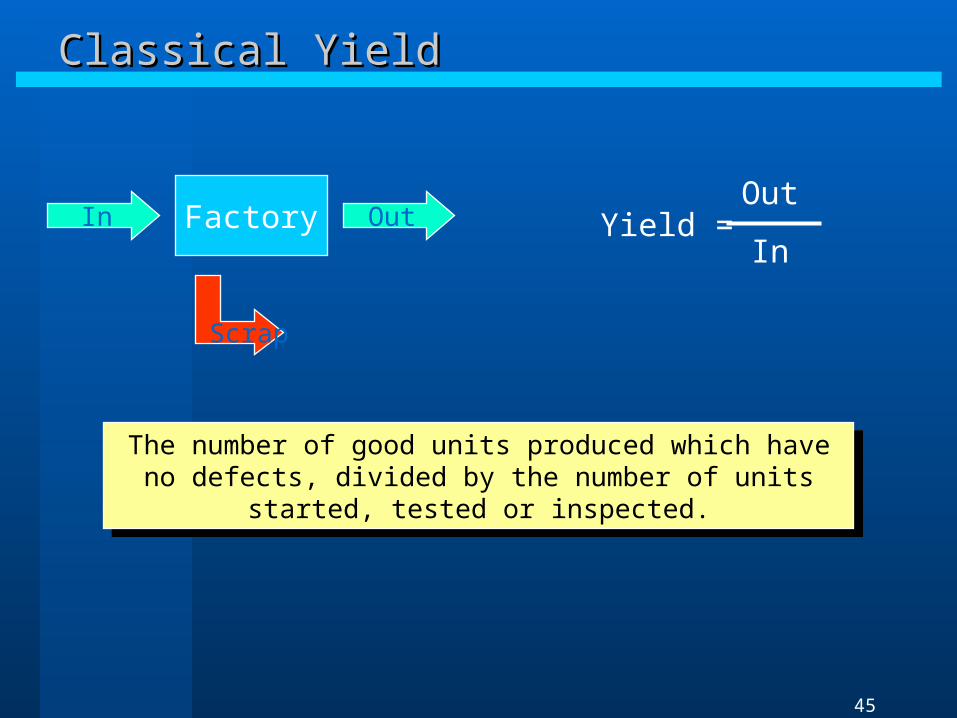
Classical YieldClassical Yield
FactoryIn Out
Scrap
Yield =Out
In
The number of good units produced which have no defects, divided by the number of units started, tested or inspected.
The number of good units produced which have no defects, divided by the number of units started, tested or inspected.
46
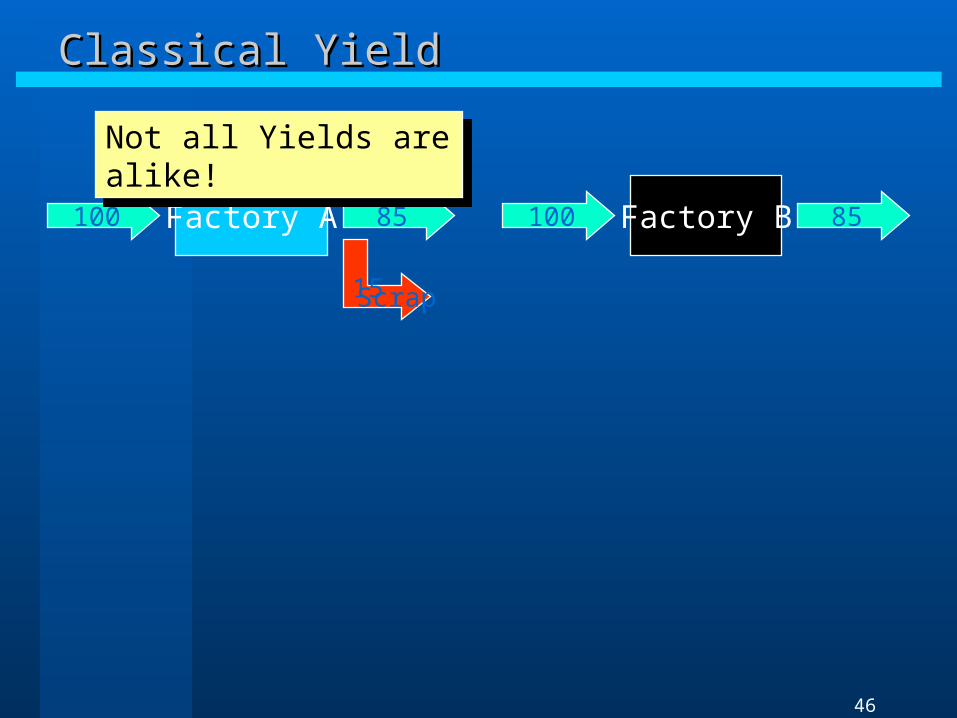
Classical YieldClassical Yield
Factory A100 85
15Scrap
Factory B100 85
Not all Yields are alike!Not all Yields are alike!
47
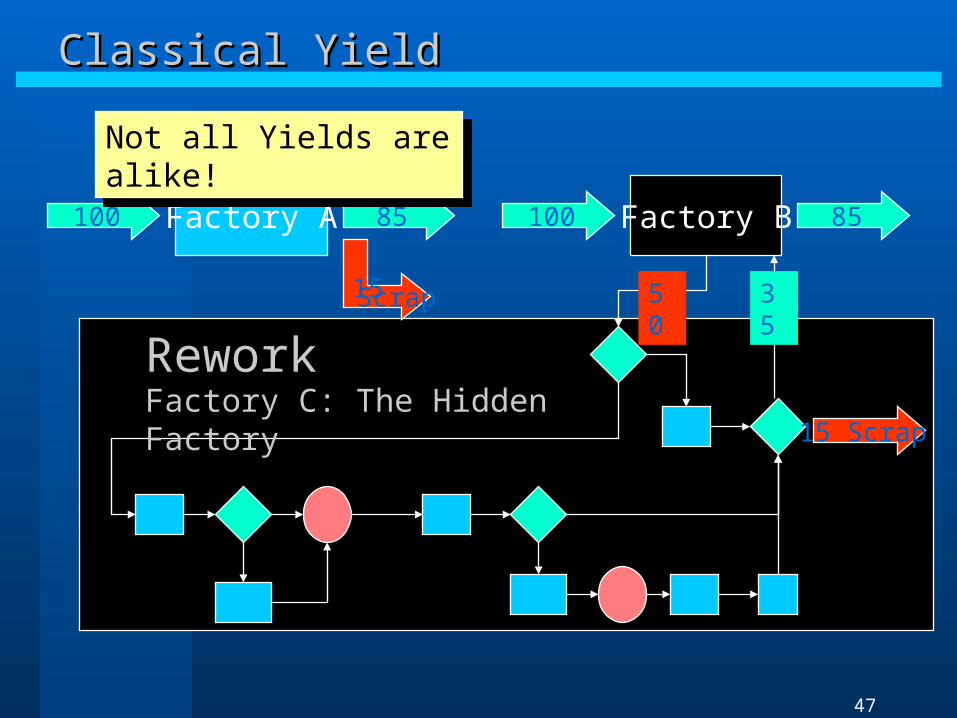
Classical YieldClassical Yield
Factory A100 85
15Scrap
Factory B100 85
15 Scrap
ReworkFactory C: The Hidden Factory
Not all Yields are alike!Not all Yields are alike!
50 35
48
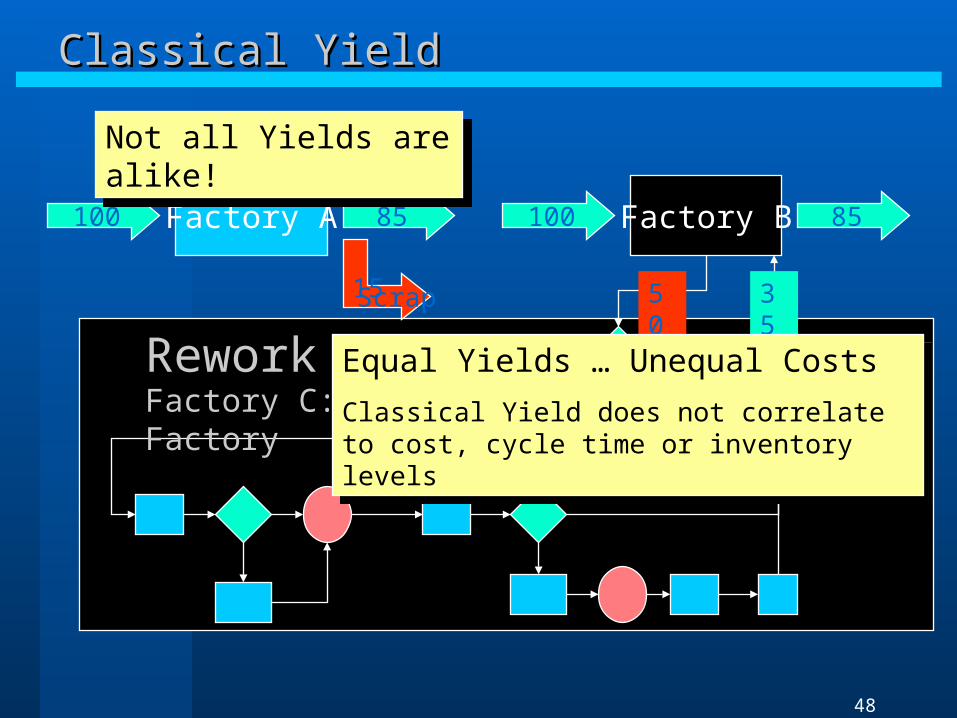
Classical YieldClassical Yield
Factory A100 85
15Scrap
Factory B100 85
15 Scrap
ReworkFactory C: The Hidden Factory
Not all Yields are alike!Not all Yields are alike!
50 35
Equal Yields … Unequal Costs
Classical Yield does not correlate to cost, cycle time or inventory levels
Equal Yields … Unequal Costs
Classical Yield does not correlate to cost, cycle time or inventory levels

49
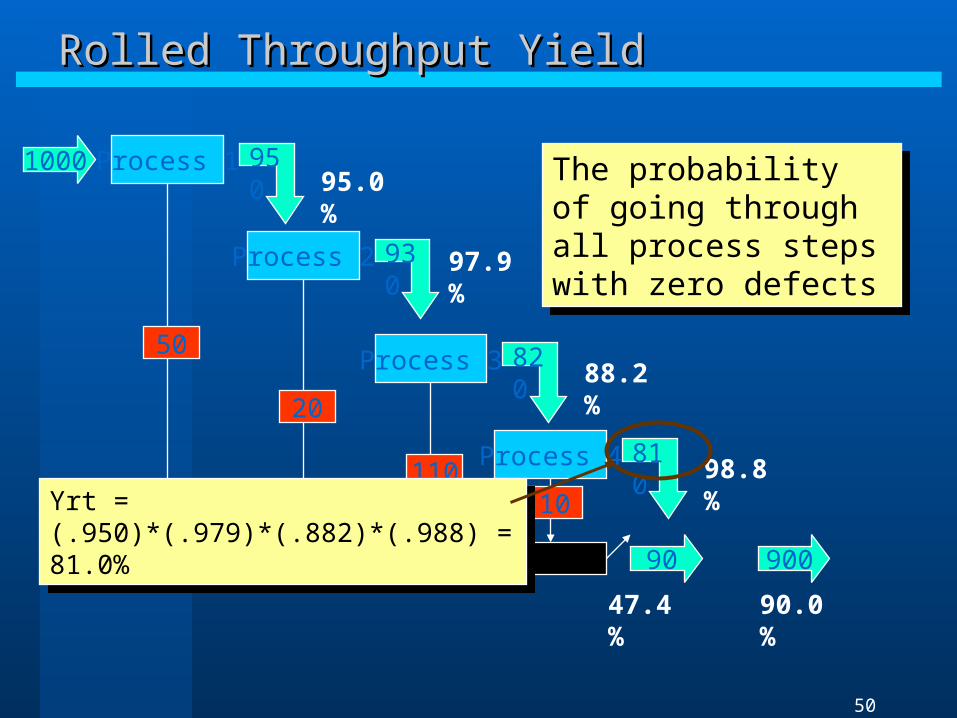
Rolled Throughput YieldRolled Throughput Yield
Process 11000 950
Process 2 930
Process 3 820
Process 4 810
Rework 90
50
20
11010
900
95.0%
47.4%
97.9%
88.2%
98.8%
90.0%
The probability of going through all process steps with zero defects
The probability of going through all process steps with zero defects
50
Rolled Throughput YieldRolled Throughput Yield
Process 11000 950
Process 2 930
Process 3 820
Process 4 810
Rework 90
50
20
11010
900
95.0%
47.4%
97.9%
88.2%
98.8%
The probability of going through all process steps with zero defects
The probability of going through all process steps with zero defects
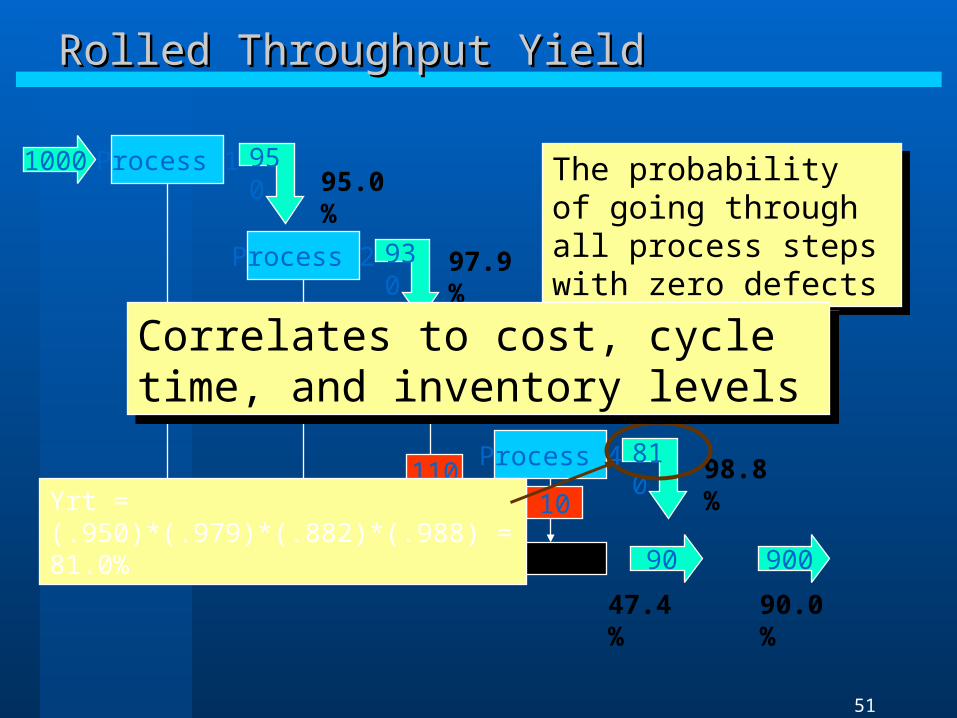
Yrt = (.950)*(.979)*(.882)*(.988) = 81.0%Yrt = (.950)*(.979)*(.882)*(.988) = 81.0%
90.0%
51
Rolled Throughput YieldRolled Throughput Yield
Process 11000 950
Process 2 930
Process 3 820
Process 4 810
Rework 90
50
20
11010
900
95.0%
47.4%
97.9%
88.2%
98.8%
The probability of going through all process steps with zero defects
The probability of going through all process steps with zero defects
Yrt = (.950)*(.979)*(.882)*(.988) = 81.0%
90.0%
Correlates to cost, cycle time, and inventory levels
Correlates to cost, cycle time, and inventory levels
52
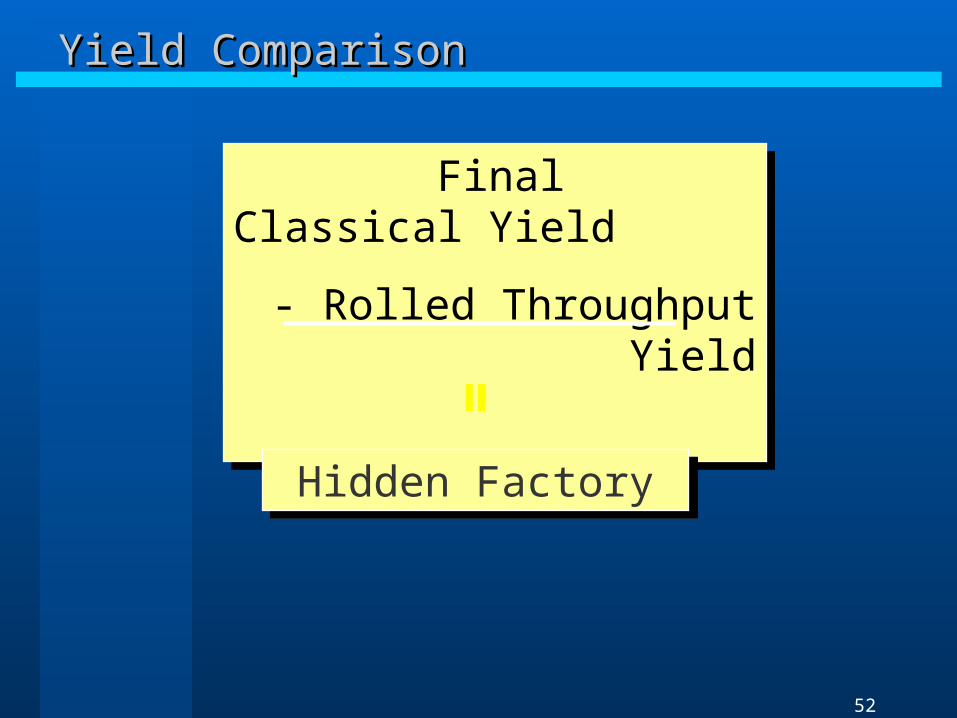
Yield ComparisonYield Comparison
Final Classical Yield
- Rolled Throughput Yield
Final Classical Yield
- Rolled Throughput Yield
Hidden FactoryHidden Factory=

53
An Average MeasureAn Average Measure
How do we measure the relative performance of a process?How do we measure the relative performance of a process?
Factory A
Yrt = 80.1%
Factory B
Yrt = 77.3%
Which factory is Better?
Which factory is Better?

54
An Average MeasureAn Average Measure
It’s a TRICK QUESTIONIt’s a TRICK QUESTION
Factory A
Yrt = 80.1%
Factory B
Yrt = 77.3%
95%
94%
96%
98%
92%
90%
89%
Factory B runs higher average
yields at each step
Factory B runs higher average
yields at each step

55
Six Sigma Metrics - Six Sigma Metrics - DefinitionsDefinitions
Normalized Throughput Yield:» The yield for a total process averaged over all process steps
Complexity:» A measure of how complicated a process or product is…the
more opportunities for defects a process or product has, the more complex it is.
56
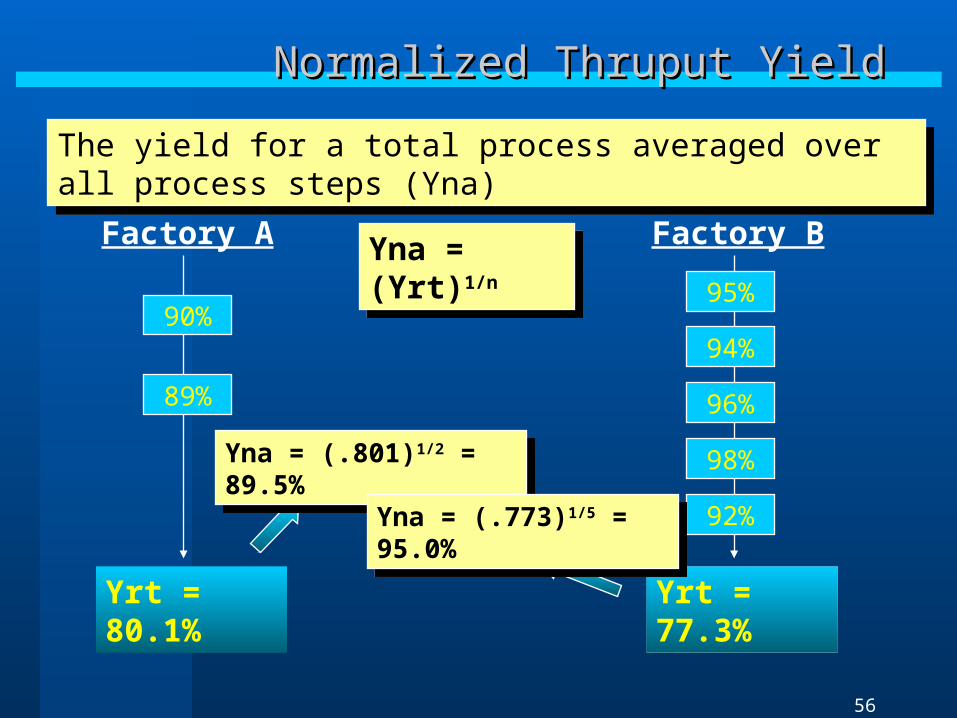
Normalized Thruput YieldNormalized Thruput Yield
Factory A
Yrt = 80.1%
Factory B
Yrt = 77.3%
95%
94%
96%
98%
92%
90%
89%
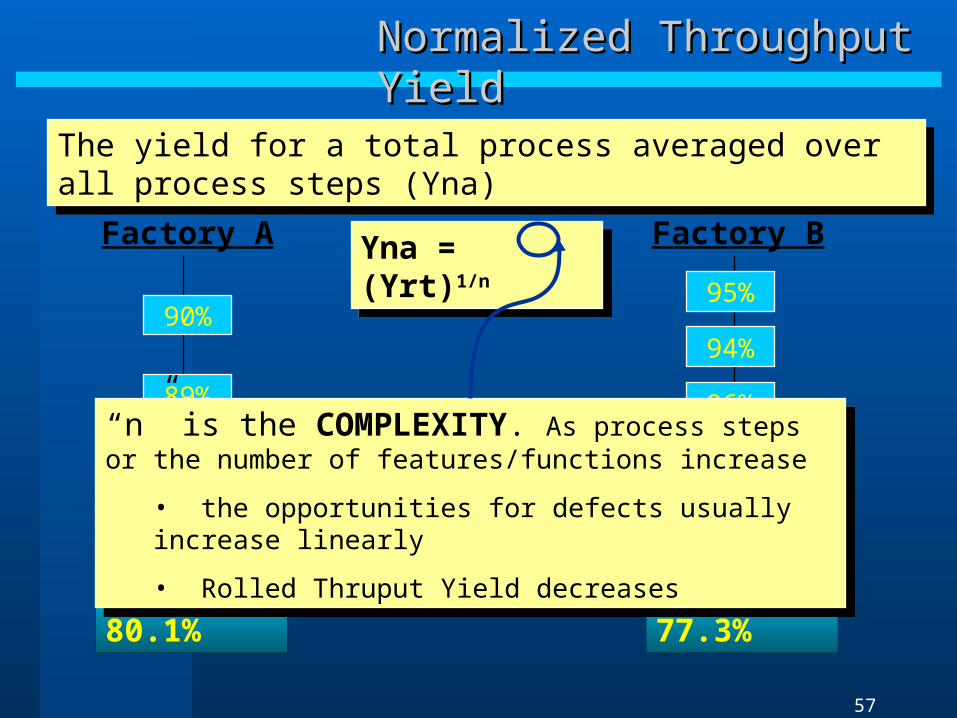
The yield for a total process averaged over all process steps (Yna)The yield for a total process averaged over all process steps (Yna)
Yna = (Yrt)1/nYna = (Yrt)1/n
Yna = (.801)1/2 = 89.5%Yna = (.801)1/2 = 89.5%
Yna = (.773)1/5 = 95.0%Yna = (.773)1/5 = 95.0%
57
Normalized Throughput YieldNormalized Throughput Yield
Factory A
Yrt = 80.1%
Factory B
Yrt = 77.3%
95%
94%
96%
98%
92%
90%
89%
The yield for a total process averaged over all process steps (Yna)The yield for a total process averaged over all process steps (Yna)
Yna = (Yrt)1/nYna = (Yrt)1/n
Yna = (.801)1/2 = 89.5%Yna = (.801)1/2 = 89.5%
Yna = (.773)1/5 = 95.0%Yna = (.773)1/5 = 95.0%
“n” is the COMPLEXITY. As process steps or the number of features/functions increase
• the opportunities for defects usually increase linearly
• Rolled Thruput Yield decreases
“n” is the COMPLEXITY. As process steps or the number of features/functions increase
• the opportunities for defects usually increase linearly
• Rolled Thruput Yield decreases
58
Six Sigma Metrics - Six Sigma Metrics - DefinitionsDefinitions
Sigma Value (Z- Score):» The sigma value is derived from the probability of a defect
in a process and is used to compare performance across
products or processes » z-Score is most accurately determined by using the
equation of z = e(-DPU)
59
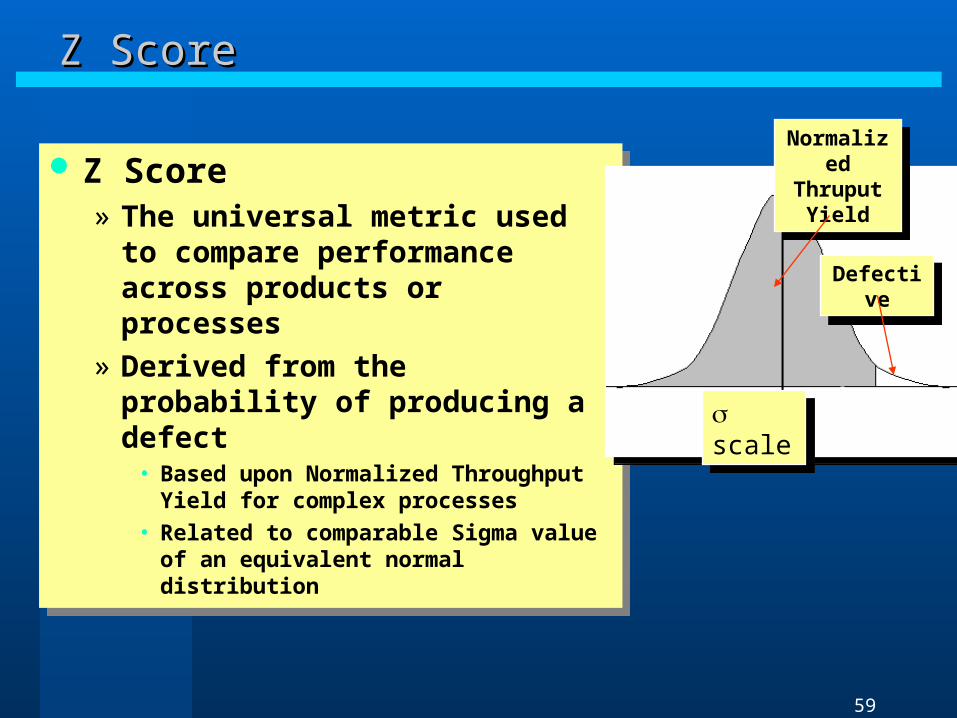
Z Score» The universal metric used to
compare performance across products or processes
» Derived from the probability of producing a defect
• Based upon Normalized Throughput Yield for complex processes
• Related to comparable Sigma value of an equivalent normal distribution
Z Score» The universal metric used to
compare performance across products or processes
» Derived from the probability of producing a defect
• Based upon Normalized Throughput Yield for complex processes
• Related to comparable Sigma value of an equivalent normal distribution
Z ScoreZ Score
scale scale 3
Normalized Thruput
Yield
Normalized Thruput
Yield
DefectiveDefective
Z

60
Conversion to Std Normal» i.e ~N(0,1)
Conversion to Std Normal» i.e ~N(0,1)
Z ScoreZ Score
3Z
~N(20,10)
~N(0,1)

61
- - - - - - - - - - - - - - - - - - - - - - - - - - - - - - - - - - - - - - -
Sweet FruitSweet Fruit Design for Manufacturability
Bulk of FruitBulk of FruitProcess Characterization and Optimization
Low Hanging FruitLow Hanging FruitSeven Basic Tools
Ground FruitGround FruitLogic and Intuition
- - - - - - - - - - - - - - - - - - - - - - - - - - - - - - - - - - - - - - -
We don't know what we don't know
We can't act on what we don't know
We won't know until we search
We won't search for what we don't question
We don't question what we don't measure
Hence, We just don't know
3 Wall, Beat Up Suppliers3 Wall, Beat Up Suppliers
4 Wall, Improve Processes4 Wall, Improve Processes
5 Wall, Improve Designs5 Wall, Improve Designs
© 1994 Dr. Mikel J. Harry - V4.0
Harvesting the Fruit of Six SigmaHarvesting the Fruit of Six Sigma

62
Potential Project Deliverables: Measure PhasePotential Project Deliverables: Measure Phase Project definition
» Problem description
» Project Metrics Project Exploration
» Process Flow Diagram
» C&E Matrix, Process FMEA, Fishbone Diagrams
» Data Collection System Measurement System Analysis
» Attribute/Variable Gage Studies Capability Assessment (on each Y)
» Cp, Cpk, Pp, Ppk, level, DPU, RTY Graphical & Statistical Tools Project Summary
» Conclusions
» Issues and Barriers
» Next Steps Completed local Project Review

63
企業經營循環企業經營循環企業之生存在於不斷地追求成長。成長主要決定於顧客滿意度。顧客滿意取決於交期、品質及價格。交期、品質及價格是由製程能力所掌握 。製程能力為變異數所影響 。製程變異數因不良率、成本與時程增加而變差。為了消除變異數,我們需要運用正確的知識。想要運用正確的知識,我們必須先學會它。唯有不斷地學習與運用新知識,企業才能永續經營。
成長即是硬道理

64