Embed Size (px)
Citation preview
1
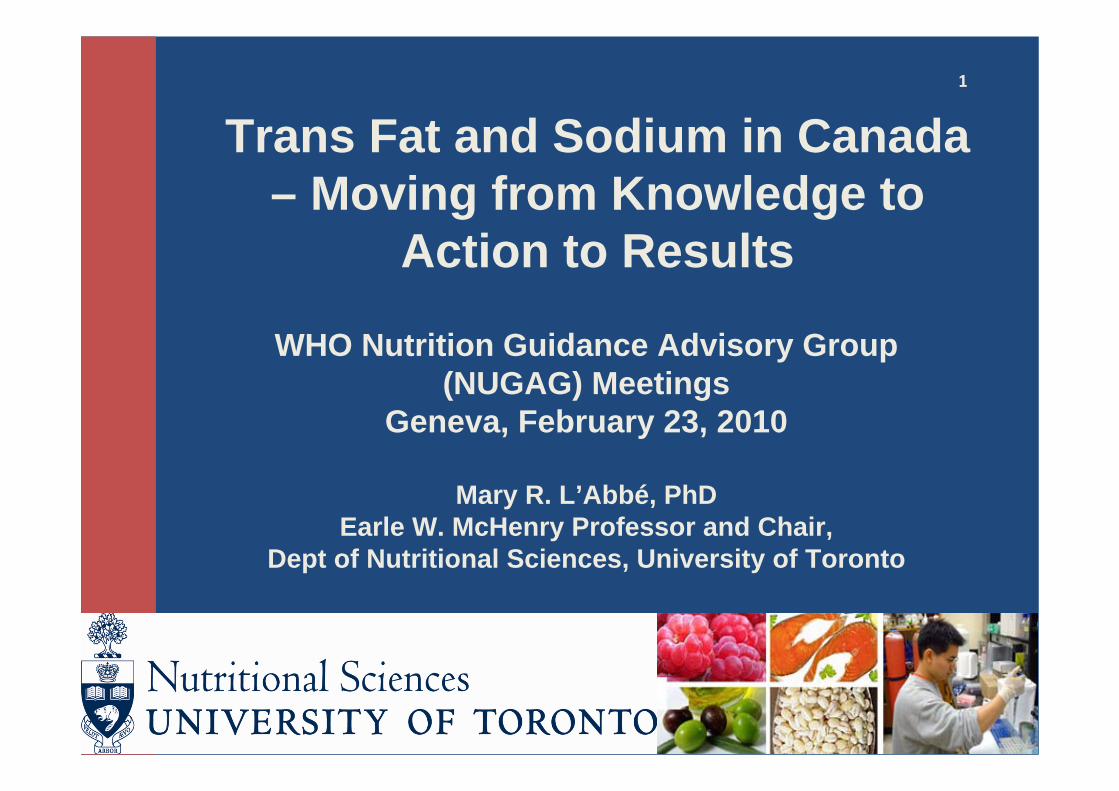
Trans Fat and Sodium in Canada – Moving from Knowledge to
Action to Results
WHO Nutrition Guidance Advisory Group (NUGAG) Meetings
Geneva, February 23, 2010
Mary R. L’Abbé, PhDEarle W. McHenry Professor and Chair,
Dept of Nutritional Sciences, University of Toronto
2
Outline: Two case studies –Trans Fat and Salt Reduction
In order to develop and implement national strategies:Understand the issues; sound scientific basis for actionMoving from Knowledge to Action PhaseLevers for Action and ImplementationInstrument(s) of choiceImportance of the media/consumer awarenessDeveloping and supporting the research agendaFollow‐up, monitoring, reporting, sustaining progress
3
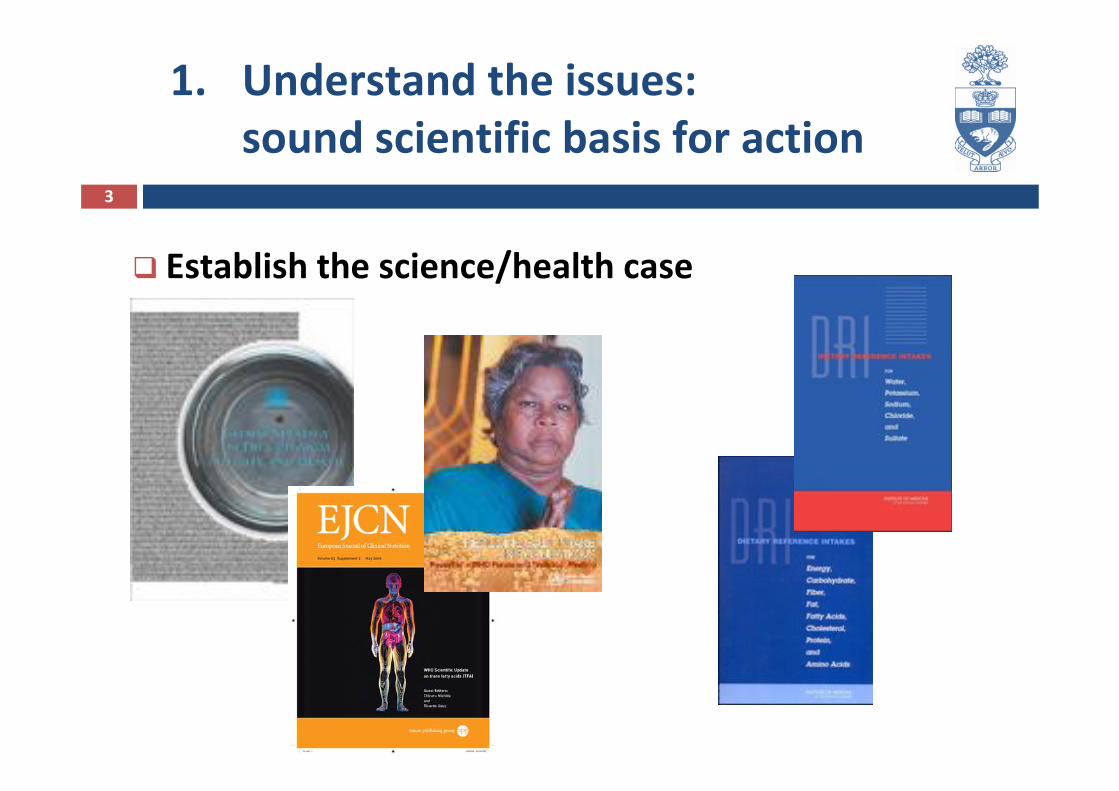
1. Understand the issues:sound scientific basis for action
Establish the science/health case
4
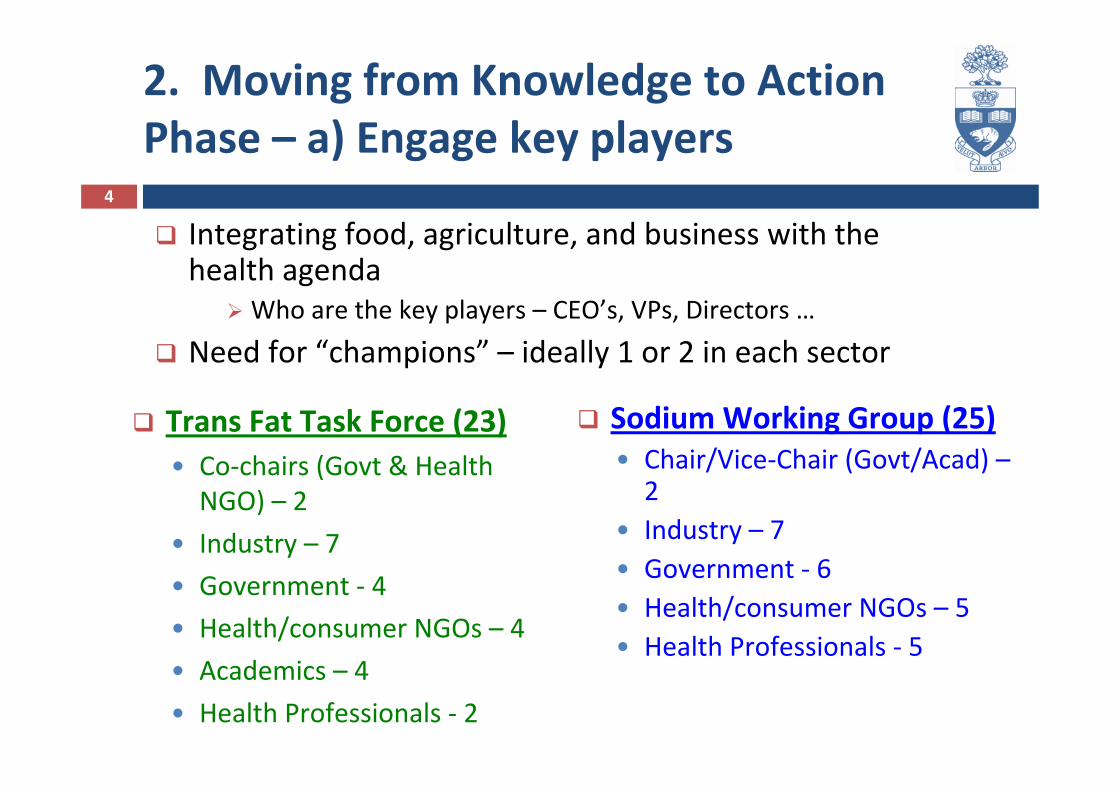
2. Moving from Knowledge to Action Phase – a) Engage key players
Integrating food, agriculture, and business with the health agenda
Who are the key players – CEO’s, VPs, Directors …
Need for “champions” – ideally 1 or 2 in each sector
Sodium Working Group (25)• Chair/Vice‐Chair (Govt/Acad) –2
• Industry – 7• Government ‐ 6• Health/consumer NGOs – 5• Health Professionals ‐ 5
Trans Fat Task Force (23)• Co‐chairs (Govt & Health NGO) – 2
• Industry – 7
• Government ‐ 4
• Health/consumer NGOs – 4
• Academics – 4
• Health Professionals ‐ 2
5
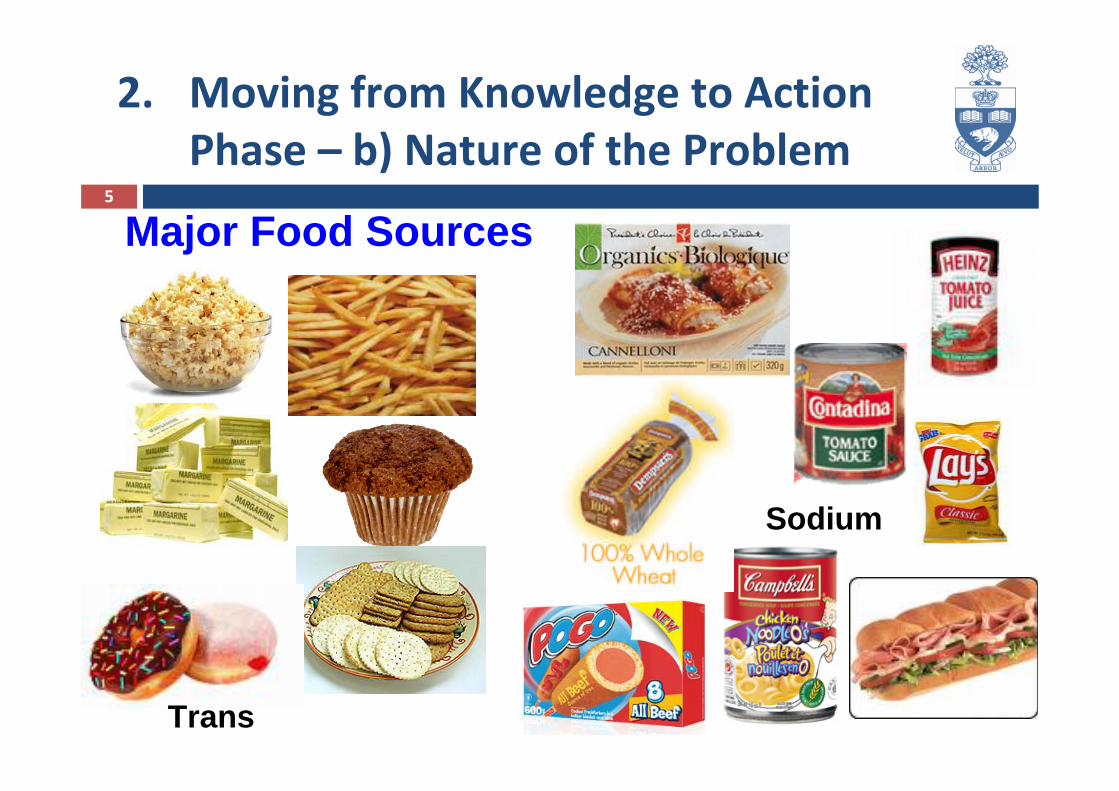
2. Moving from Knowledge to Action Phase – b) Nature of the Problem
Major Food Sources
Trans
Sodium
6
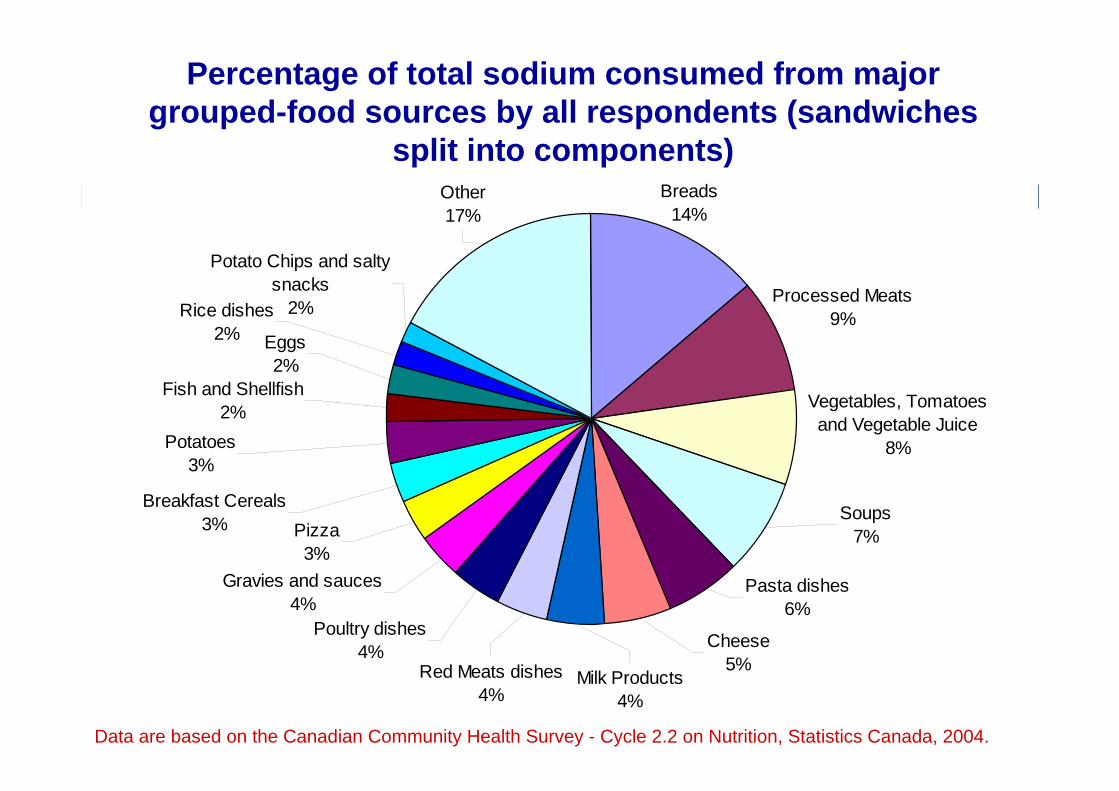
Data are based on the Canadian Community Health Survey - Cycle 2.2 on Nutrition, Statistics Canada, 2004.
Percentage of total sodium consumed from major grouped-food sources by all respondents (sandwiches
split into components)
Pasta dishes6%
Soups7%
Vegetables, Tomatoes and Vegetable Juice
8%
Processed Meats9%
Breads14%
Poultry dishes4%
Fish and Shellfish2%
Rice dishes2%
Potato Chips and salty snacks
2%
Other17%
Eggs2%
Potatoes3%
Gravies and sauces4%
Breakfast Cereals3% Pizza
3%
Red Meats dishes4%
Milk Products4%
Cheese5%
7
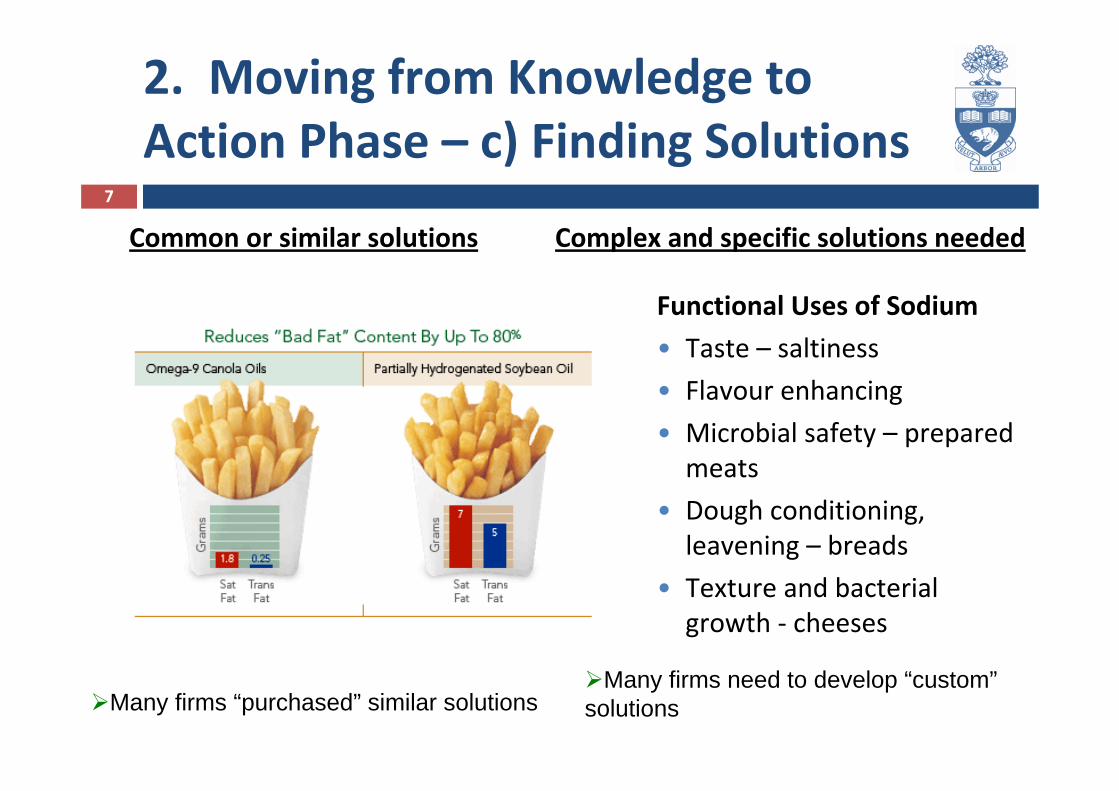
2. Moving from Knowledge to Action Phase – c) Finding Solutions
Common or similar solutions
Functional Uses of Sodium
• Taste – saltiness
• Flavour enhancing
• Microbial safety – prepared meats
• Dough conditioning, leavening – breads
• Texture and bacterial growth ‐ cheeses
Many firms “purchased” similar solutionsMany firms need to develop “custom”
solutions
Complex and specific solutions needed
8
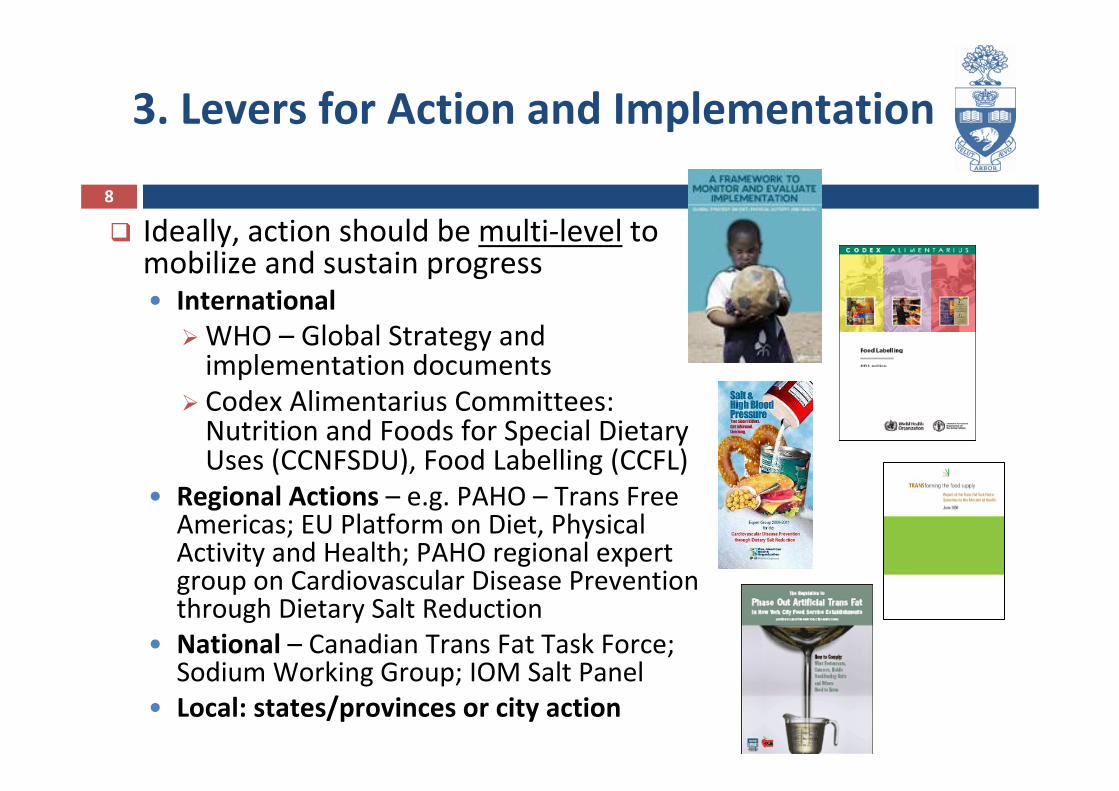
3. Levers for Action and Implementation
Ideally, action should be multi‐level to mobilize and sustain progress• International
WHO – Global Strategy and implementation documentsCodex Alimentarius Committees: Nutrition and Foods for Special Dietary Uses (CCNFSDU), Food Labelling (CCFL)
• Regional Actions – e.g. PAHO – Trans Free Americas; EU Platform on Diet, Physical Activity and Health; PAHO regional expert group on Cardiovascular Disease Prevention through Dietary Salt Reduction
• National – Canadian Trans Fat Task Force; Sodium Working Group; IOM Salt Panel
• Local: states/provinces or city action
9
4. Instrument(s) of choice ‐ Overview
Often employing a variety of governmental instruments at multi‐level is the most successful approach
WHA resolutions, Codex standards …Regional Frameworks, policy statements, guidelines ..National policies, guidelines, regulations …Local regulations, guidelines
Combined with Industry/NGO led Logos/symbolsBrand “identities”Association or company “pledges”
Effective Monitoring and publishing results
10
Instrument of Choice ‐ Governmental
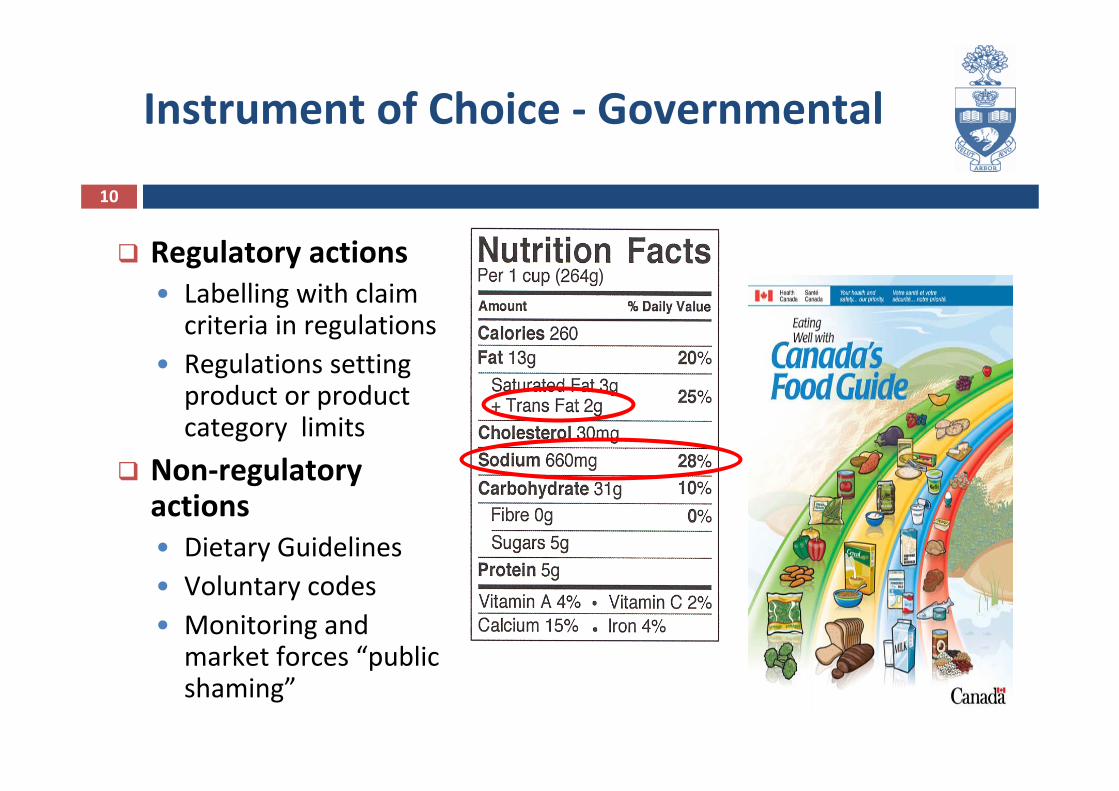
Regulatory actions• Labelling with claim criteria in regulations
• Regulations setting product or product category limits
Non‐regulatory actions• Dietary Guidelines• Voluntary codes• Monitoring and market forces “public shaming”
11
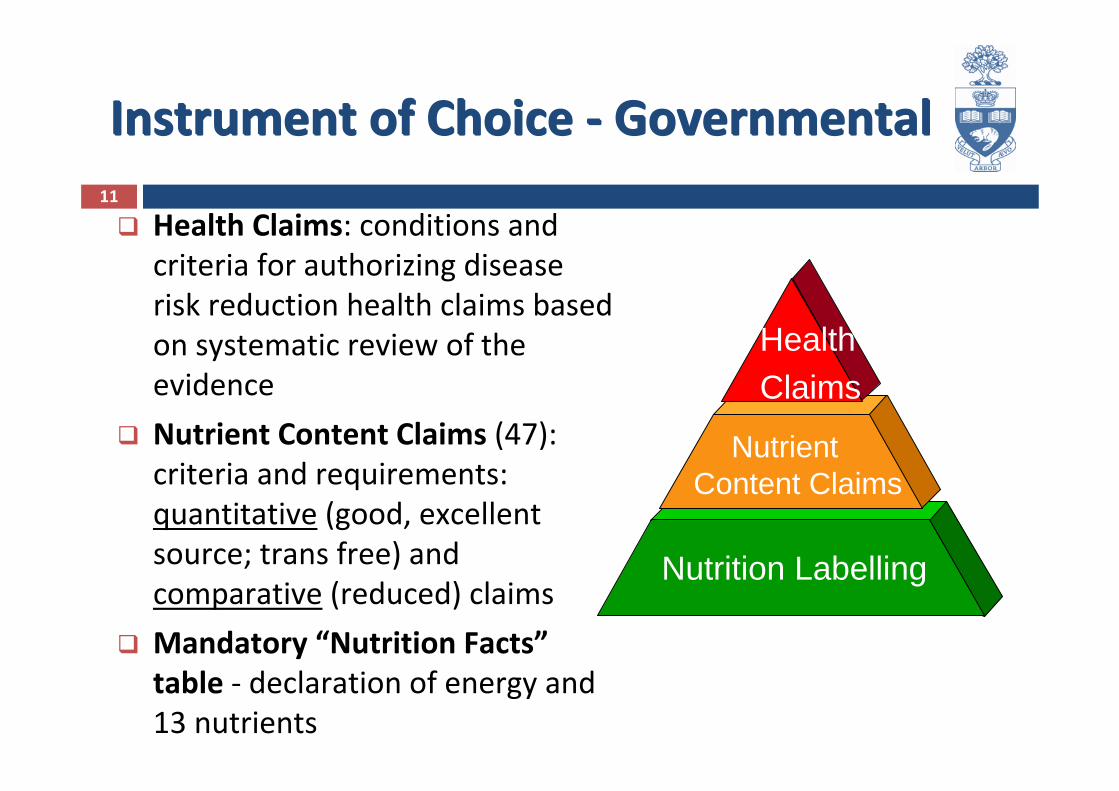
Health Claims: conditions and criteria for authorizing disease risk reduction health claims based on systematic review of the evidence
Nutrient Content Claims (47): criteria and requirements: quantitative (good, excellent source; trans free) and comparative (reduced) claims
Mandatory “Nutrition Facts”table ‐ declaration of energy and 13 nutrients
Instrument of Choice ‐ GovernmentalInstrument of Choice ‐ Governmental
Nutrition Labelling
Nutrient Content Claims
HealthClaims
12
Industry/NGO led instruments –Symbols / Logos
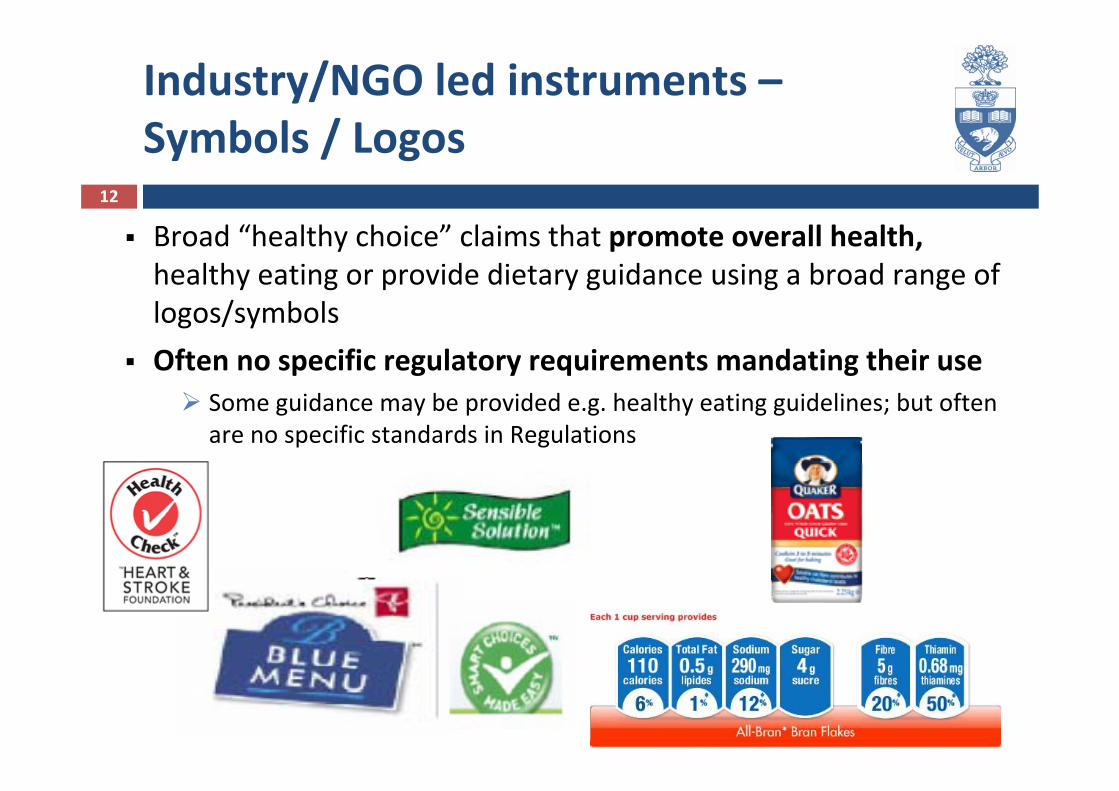
Broad “healthy choice” claims that promote overall health,healthy eating or provide dietary guidance using a broad range of logos/symbols
Often no specific regulatory requirements mandating their useSome guidance may be provided e.g. healthy eating guidelines; but often are no specific standards in Regulations
13
5. Importance of the media/consumer awareness – all have contributed to reductions
Government or health led social marketing/consumer awareness campaigns
A – Awareness ‐ of food component / health linkB – Action ‐ what consumers can do themselvesC – Information ‐ what to look out for e.g. high trans or high sodium (i) types/classes of foods or (ii) brand comparisons within categories
Media led campaigns / in‐depth TV or news articles / series of articles, Political agendasHealth / consumer / NGO – led (partnered) campaigns, public service announcementsIndustry led “health campaigns” (not brand or product specific)Marketing campaigns – company or product specific
14
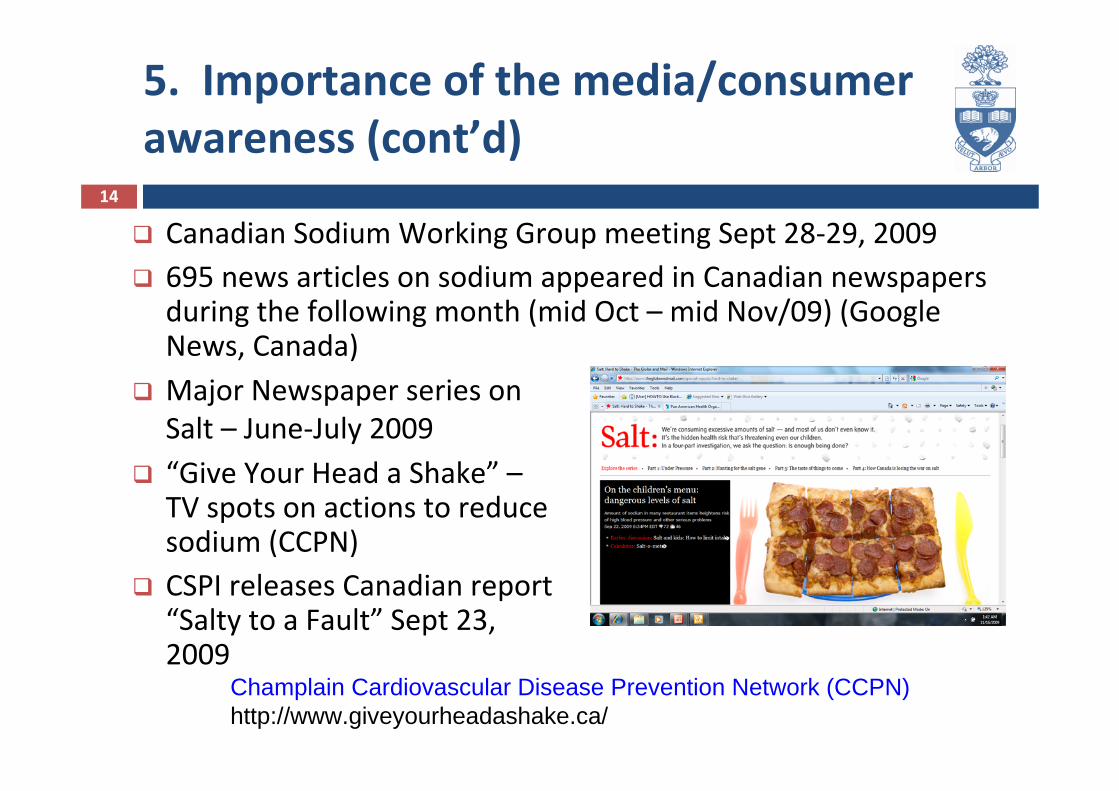
5. Importance of the media/consumer awareness (cont’d)
Champlain Cardiovascular Disease Prevention Network (CCPN)http://www.giveyourheadashake.ca/
Canadian Sodium Working Group meeting Sept 28‐29, 2009695 news articles on sodium appeared in Canadian newspapers during the following month (mid Oct – mid Nov/09) (Google News, Canada)Major Newspaper series on Salt – June‐July 2009“Give Your Head a Shake” –TV spots on actions to reduce sodium (CCPN)CSPI releases Canadian report “Salty to a Fault” Sept 23, 2009
15
Action Campaign – What consumers can do themselves
Champlain Cardiovascular Disease Prevention Network (CCPN) http://www.giveyourheadashake.ca/
16
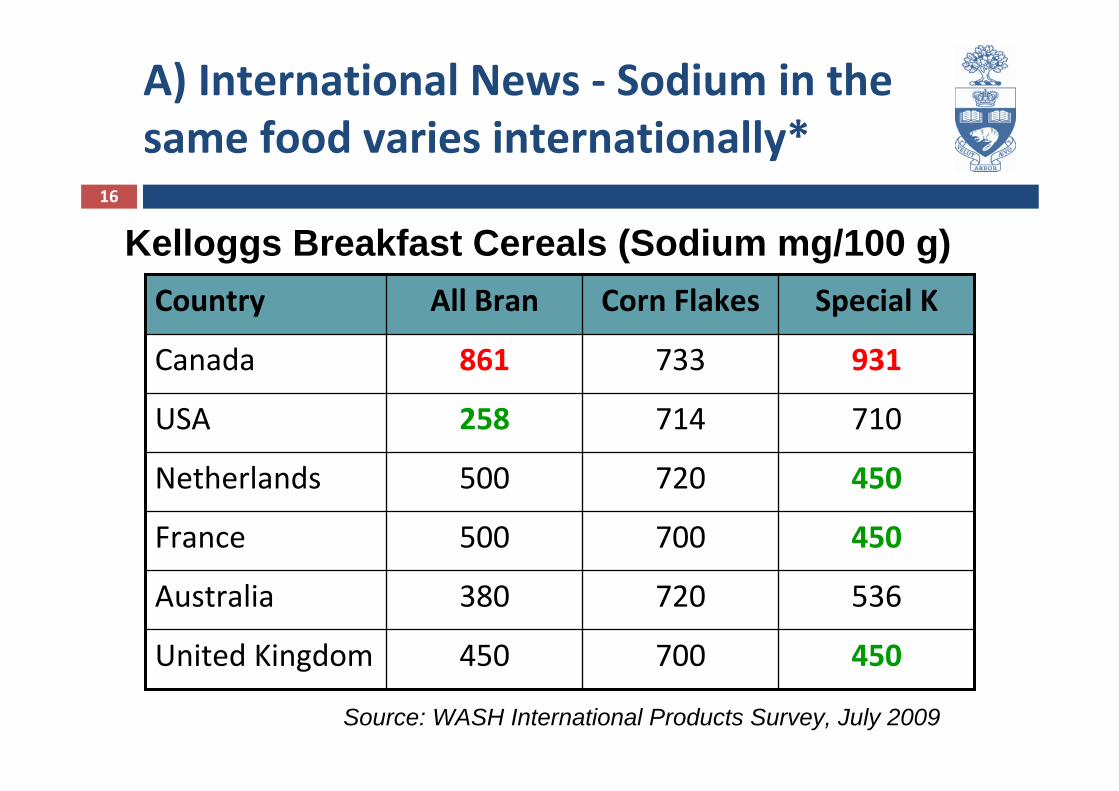
A) International News ‐ Sodium in the same food varies internationally*
450700450United Kingdom
720
700
720
714
733
Corn Flakes
380
500
500
258
861
All Bran
536Australia
450France
450Netherlands
710USA
931Canada
Special KCountry
Kelloggs Breakfast Cereals (Sodium mg/100 g)
Source: WASH International Products Survey, July 2009
17
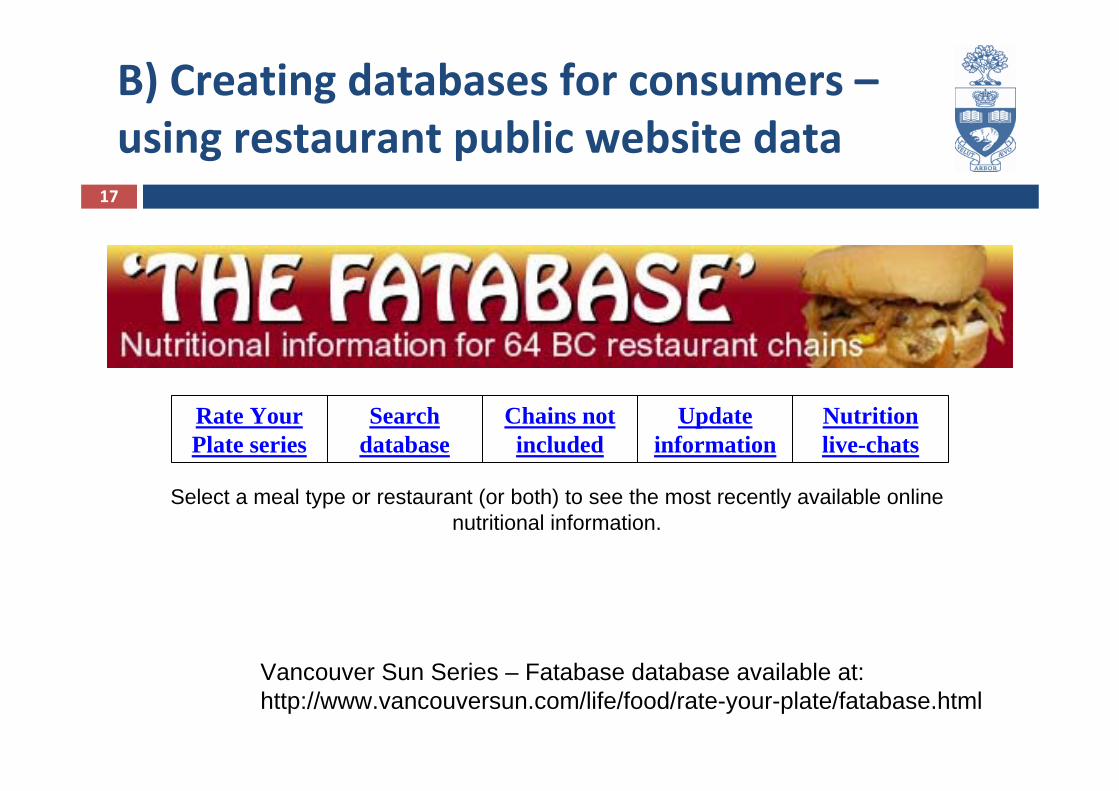
B) Creating databases for consumers –using restaurant public website data
Nutrition live-chats
Update information
Chains not included
Search database
Rate Your Plate series
Select a meal type or restaurant (or both) to see the most recently available online nutritional information.
Vancouver Sun Series – Fatabase database available at:http://www.vancouversun.com/life/food/rate-your-plate/fatabase.html
18
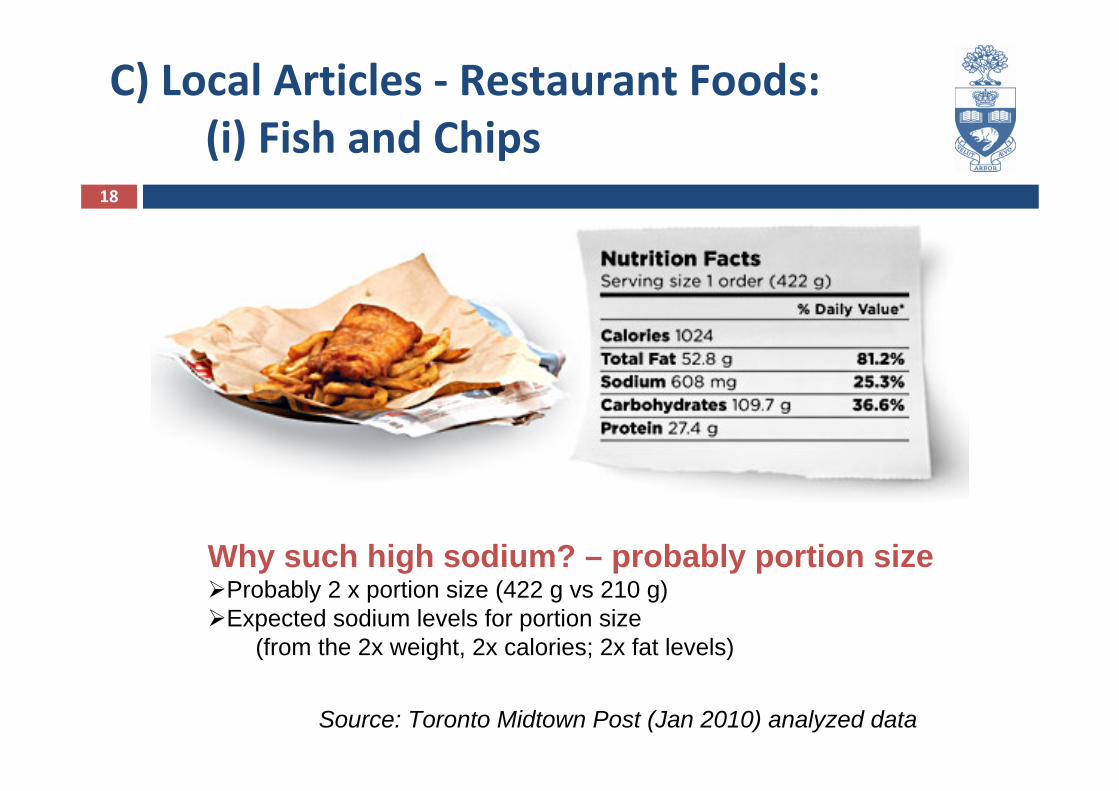
C) Local Articles ‐ Restaurant Foods:(i) Fish and Chips
Why such high sodium? – probably portion sizeProbably 2 x portion size (422 g vs 210 g) Expected sodium levels for portion size
(from the 2x weight, 2x calories; 2x fat levels)
Source: Toronto Midtown Post (Jan 2010) analyzed data
19
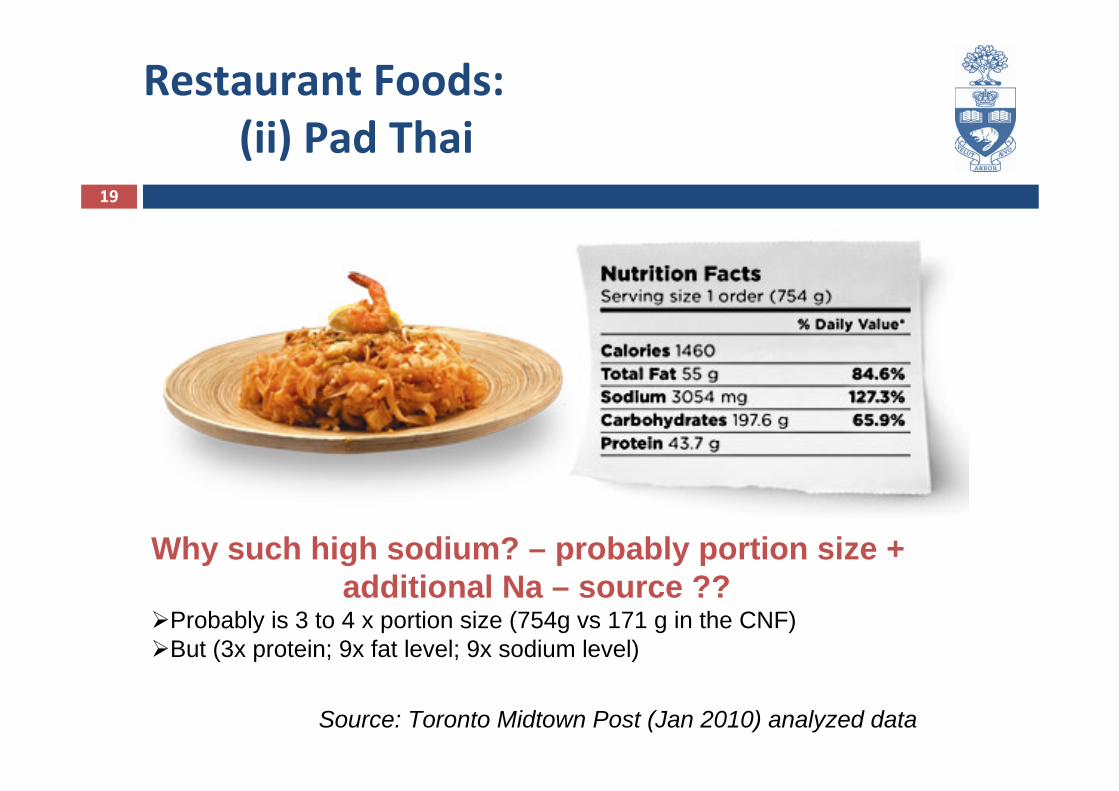
Restaurant Foods:(ii) Pad Thai
Why such high sodium? – probably portion size + additional Na – source ??
Probably is 3 to 4 x portion size (754g vs 171 g in the CNF) But (3x protein; 9x fat level; 9x sodium level)
Source: Toronto Midtown Post (Jan 2010) analyzed data
20
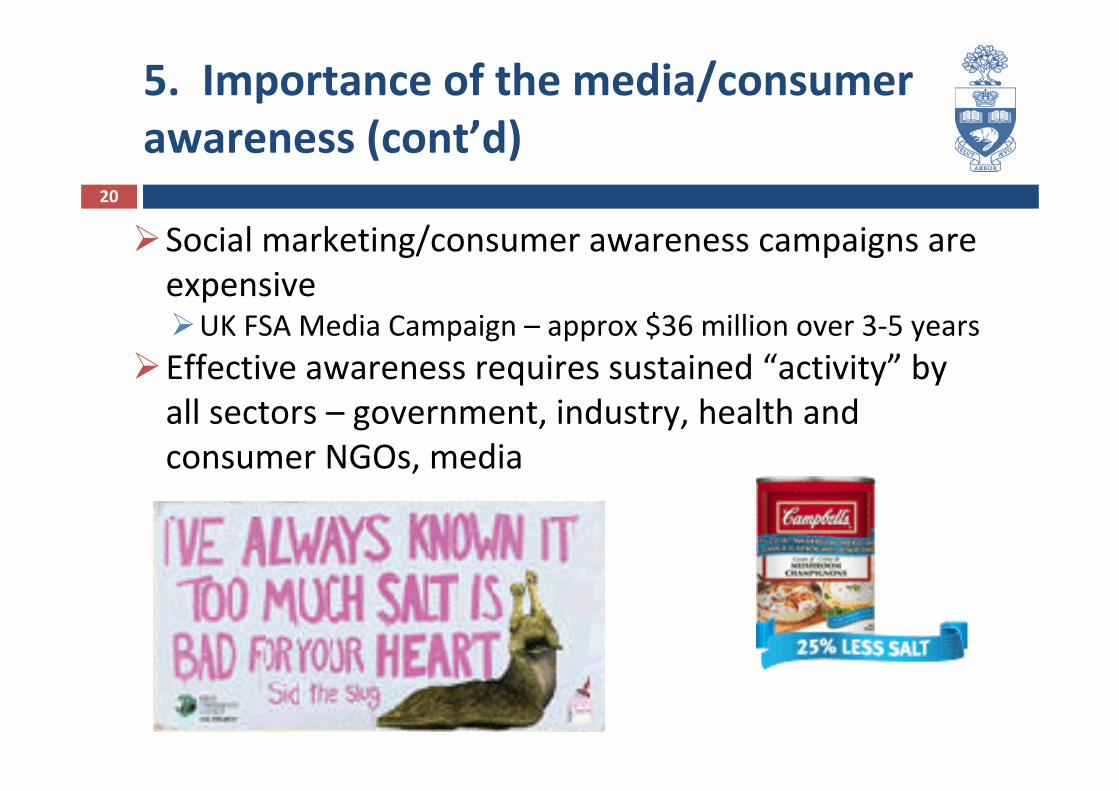
5. Importance of the media/consumer awareness (cont’d)
Social marketing/consumer awareness campaigns are expensive
UK FSA Media Campaign – approx $36 million over 3‐5 yearsEffective awareness requires sustained “activity” by all sectors – government, industry, health and consumer NGOs, media
21
6. Developing and supporting the research agenda
Solutions – finding the right balance• Publicly funded research for the public good vs proprietary, IP protected
research• Value added “solutions” with price premium over less healthy
alternatives• National niches, economic opportunities – e.g. high oleic canola oils for
frying applicationsConsumer awareness /consumer behaviour research – how to affect change?• Trans fat awareness ‐ 45% of Canadians claimed that they have heard or
that they understand the term "trans fat“ (1999) vs. 79% (2005), > 90% (2008)
• Understand and make food selections based on trans content: 41% (2001) to 69% (2008)
• 89% of Canadians think that others were consuming too much sodium; but only 41% thought that they themselves were ingesting too much (2009).
22
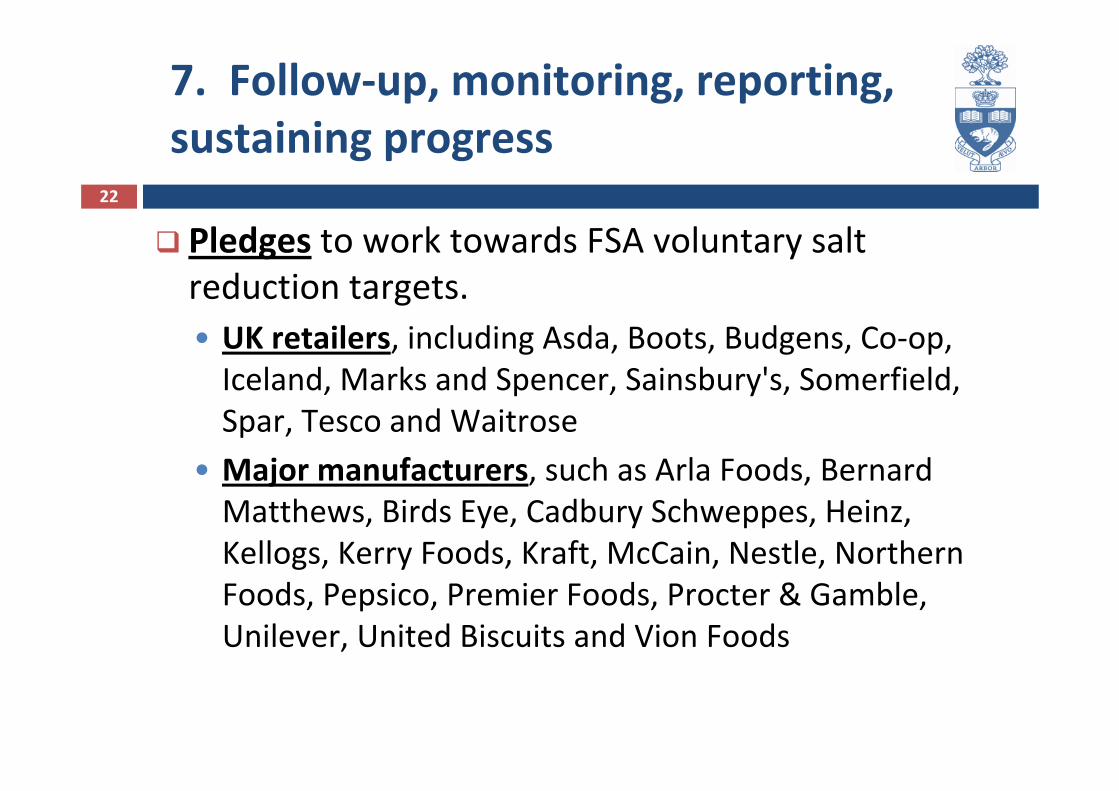
7. Follow‐up, monitoring, reporting, sustaining progress
Pledges to work towards FSA voluntary salt reduction targets.• UK retailers, including Asda, Boots, Budgens, Co‐op, Iceland, Marks and Spencer, Sainsbury's, Somerfield, Spar, Tesco and Waitrose
• Major manufacturers, such as Arla Foods, Bernard Matthews, Birds Eye, Cadbury Schweppes, Heinz, Kellogs, Kerry Foods, Kraft, McCain, Nestle, Northern Foods, Pepsico, Premier Foods, Procter & Gamble, Unilever, United Biscuits and Vion Foods
23
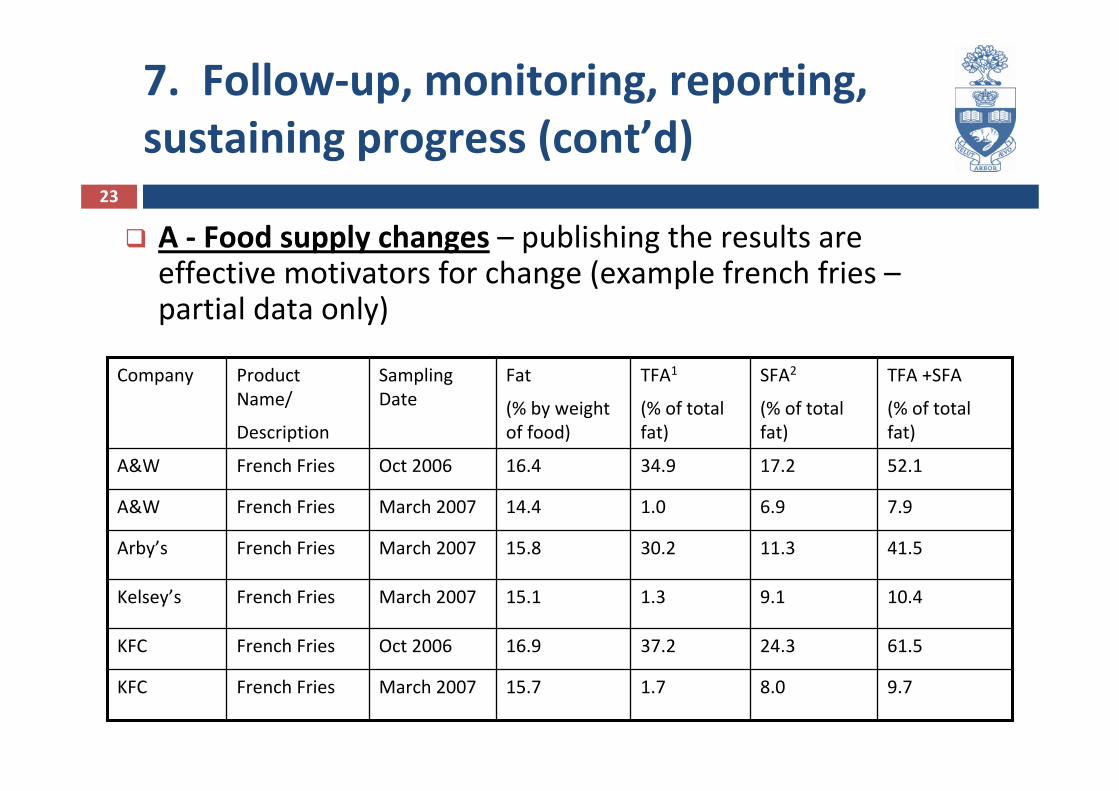
7. Follow‐up, monitoring, reporting, sustaining progress (cont’d)
A ‐ Food supply changes – publishing the results are effective motivators for change (example french fries –partial data only)
41.511.330.215.8March 2007French FriesArby’s
10.49.11.315.1March 2007French FriesKelsey’s
61.524.337.216.9Oct 2006French FriesKFC
9.78.01.715.7March 2007French FriesKFC
7.96.91.014.4March 2007French FriesA&W
52.117.234.916.4Oct 2006French FriesA&W
TFA +SFA
(% of total fat)
SFA2
(% of total fat)
TFA1
(% of total fat)
Fat
(% by weight of food)
Sampling Date
Product Name/
Description
Company
24
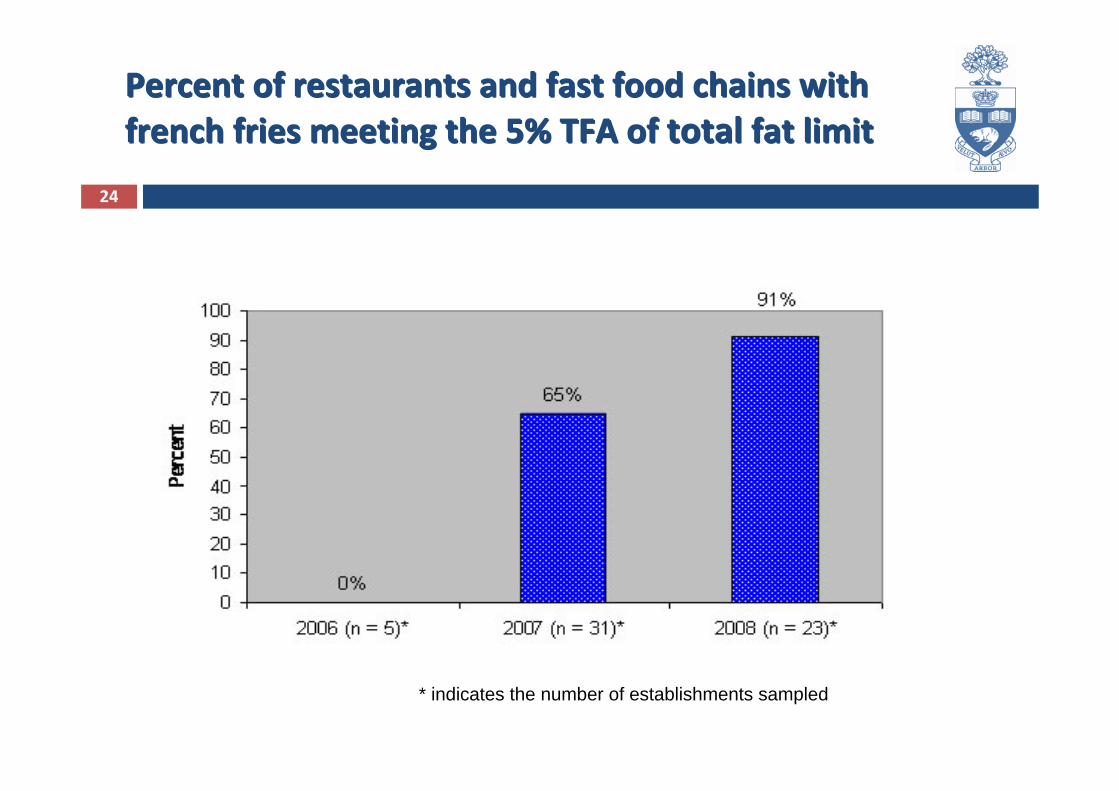
Percent of restaurants and fast food chains with french fries meeting the 5% TFA of total fat limitPercent of restaurants and fast food chains with french fries meeting the 5% TFA of total fat limit
* indicates the number of establishments sampled
25
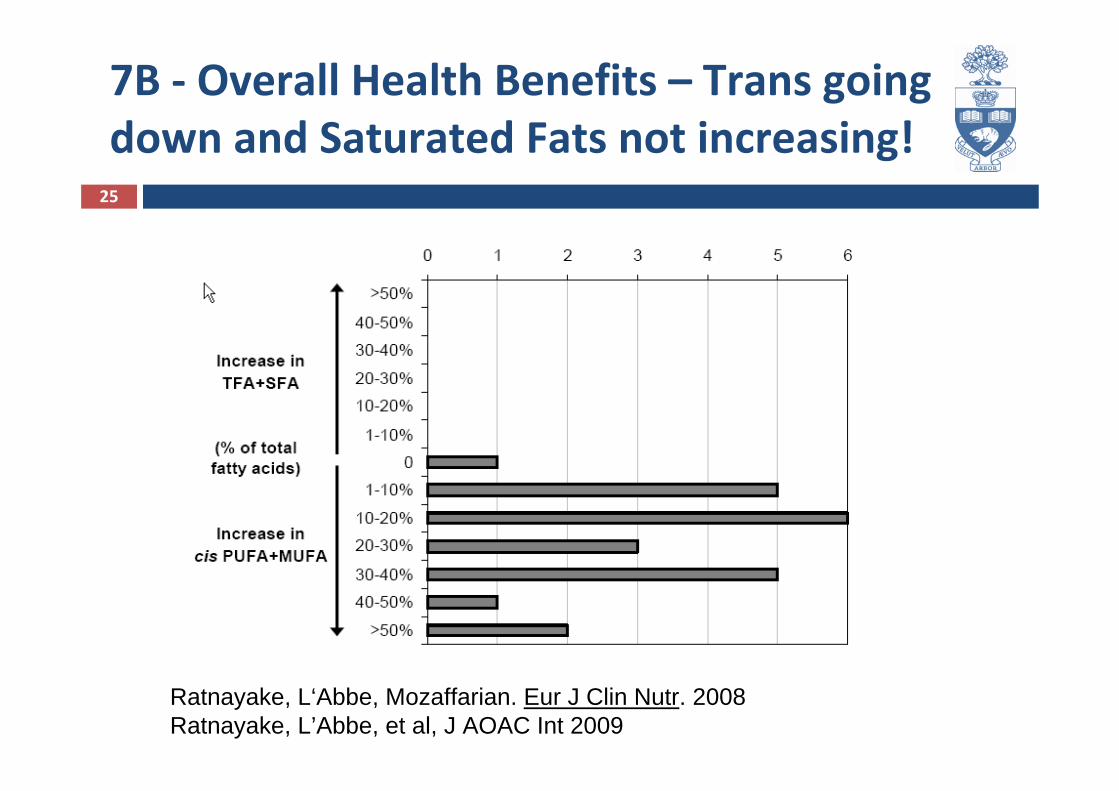
7B ‐ Overall Health Benefits – Trans going down and Saturated Fats not increasing!
Ratnayake, L‘Abbe, Mozaffarian. Eur J Clin Nutr. 2008 Ratnayake, L’Abbe, et al, J AOAC Int 2009
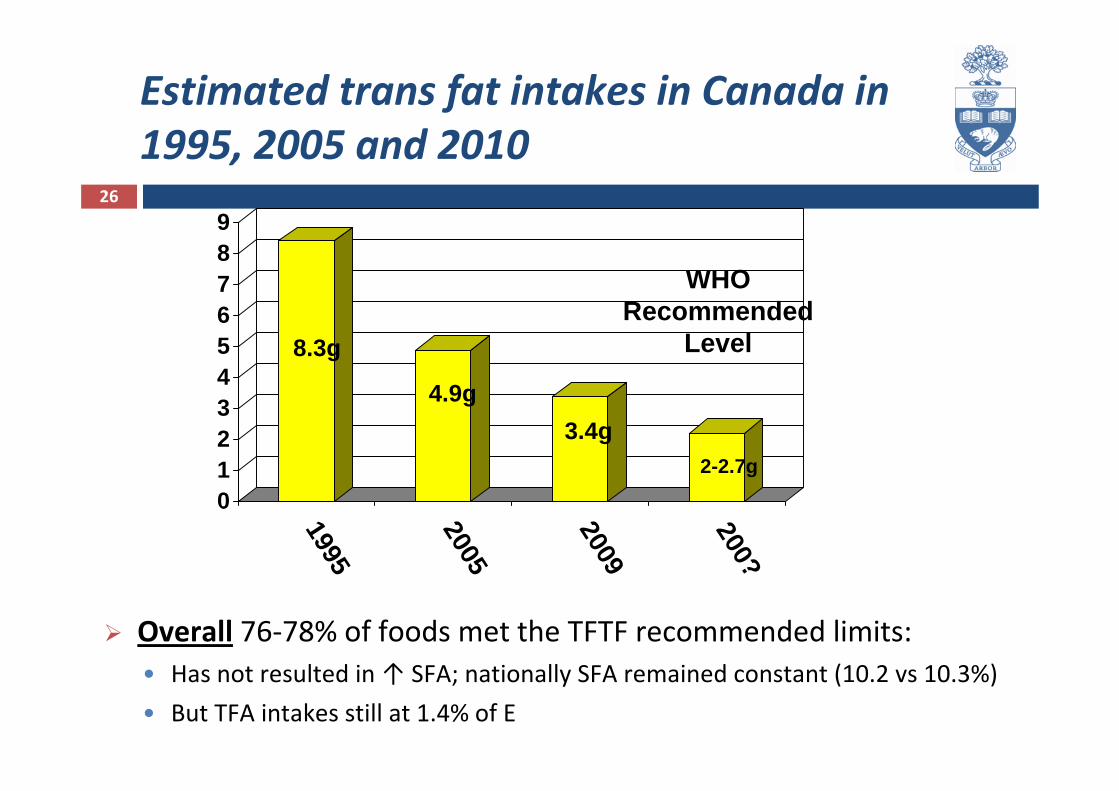
26
Estimated trans fat intakes in Canada in 1995, 2005 and 2010
0123456789
1995
2005
2009
200?
WHO Recommended
Level8.3g
4.9g
2-2.7g3.4g
Overall 76‐78% of foods met the TFTF recommended limits:• Has not resulted in ↑ SFA; nationally SFA remained constant (10.2 vs 10.3%)
• But TFA intakes still at 1.4% of E
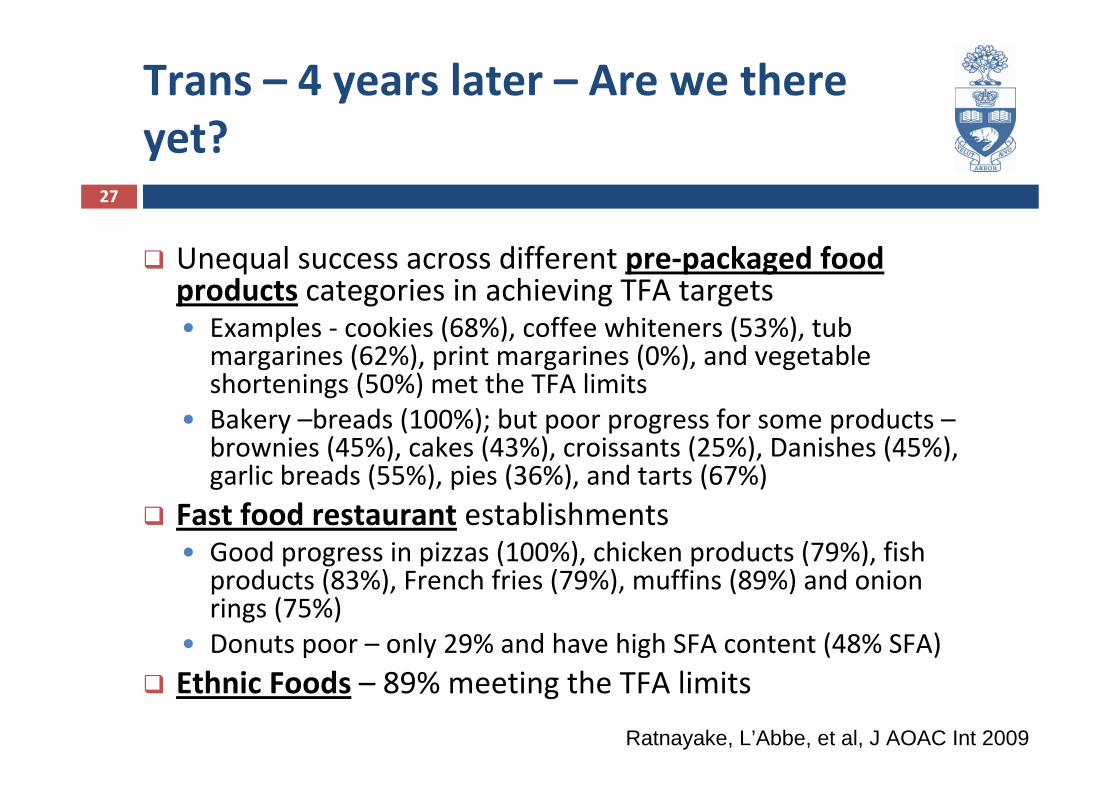
27
Trans – 4 years later – Are we there yet?
Unequal success across different pre‐packaged food products categories in achieving TFA targets• Examples ‐ cookies (68%), coffee whiteners (53%), tub margarines (62%), print margarines (0%), and vegetable shortenings (50%) met the TFA limits
• Bakery –breads (100%); but poor progress for some products –brownies (45%), cakes (43%), croissants (25%), Danishes (45%), garlic breads (55%), pies (36%), and tarts (67%)
Fast food restaurant establishments• Good progress in pizzas (100%), chicken products (79%), fish products (83%), French fries (79%), muffins (89%) and onion rings (75%)
• Donuts poor – only 29% and have high SFA content (48% SFA)Ethnic Foods – 89% meeting the TFA limits
Ratnayake, L’Abbe, et al, J AOAC Int 2009
28
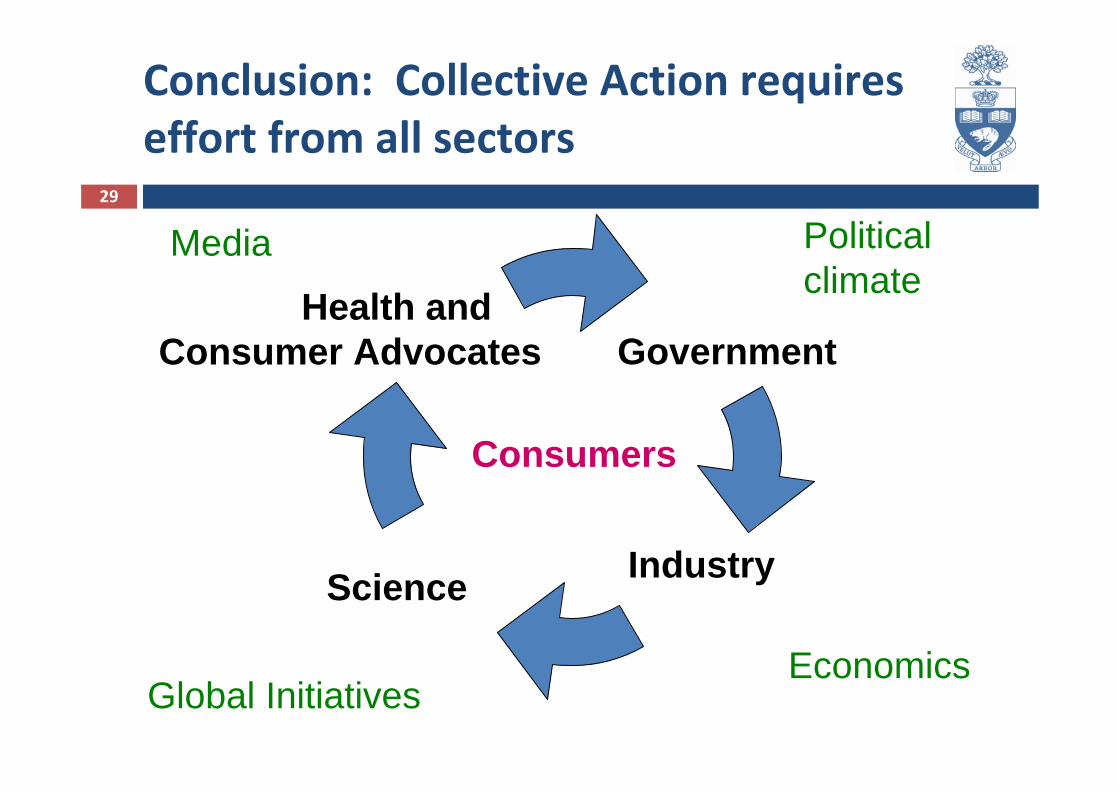
29
Conclusion: Collective Action requires effort from all sectors
Science Industry
GovernmentHealth and
Consumer Advocates
Media Political climate
Consumers
Global InitiativesEconomics
30
Thank You !
[email protected]:http://www.hc‐sc.gc.ca/fn‐an/nutrition/gras‐trans‐fats/index‐eng.phphttp://www.hc‐sc.gc.ca/fn‐an/nutrition/sodium/index‐eng.php