Embed Size (px)
Citation preview
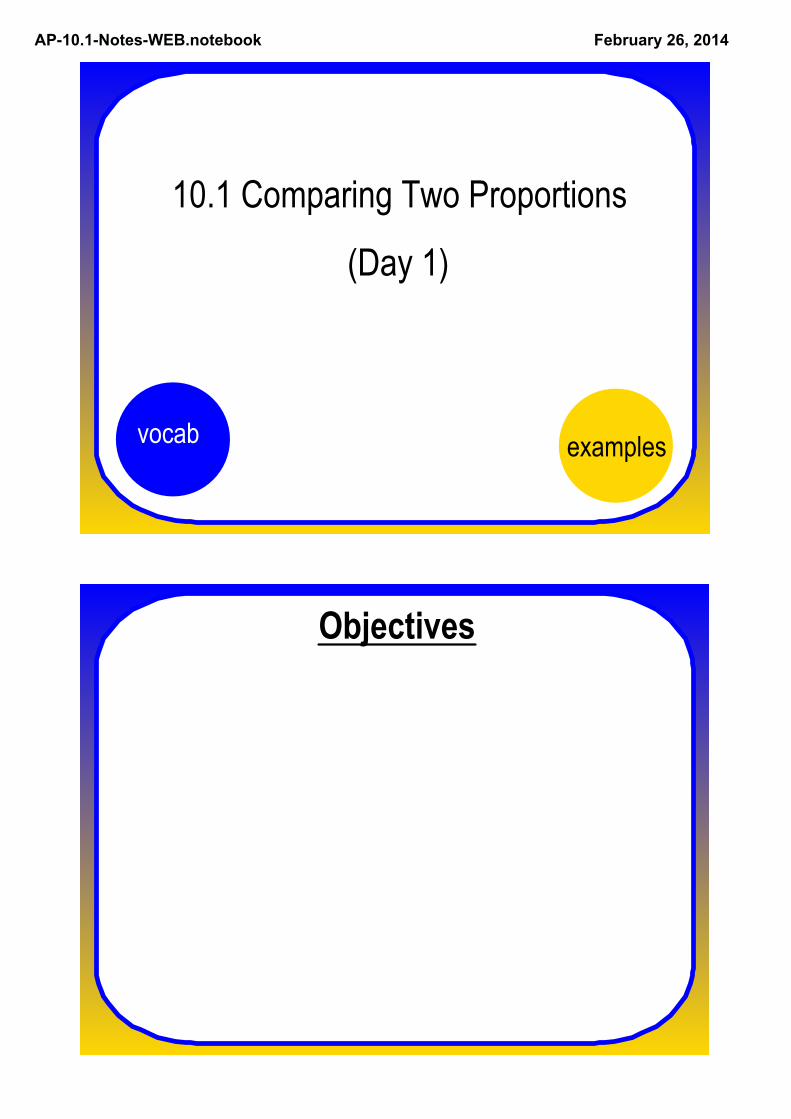
AP10.1NotesWEB.notebook February 26, 2014
10.1 Comparing Two Proportions
(Day 1)
vocab examples
Objectives
AP10.1NotesWEB.notebook February 26, 2014
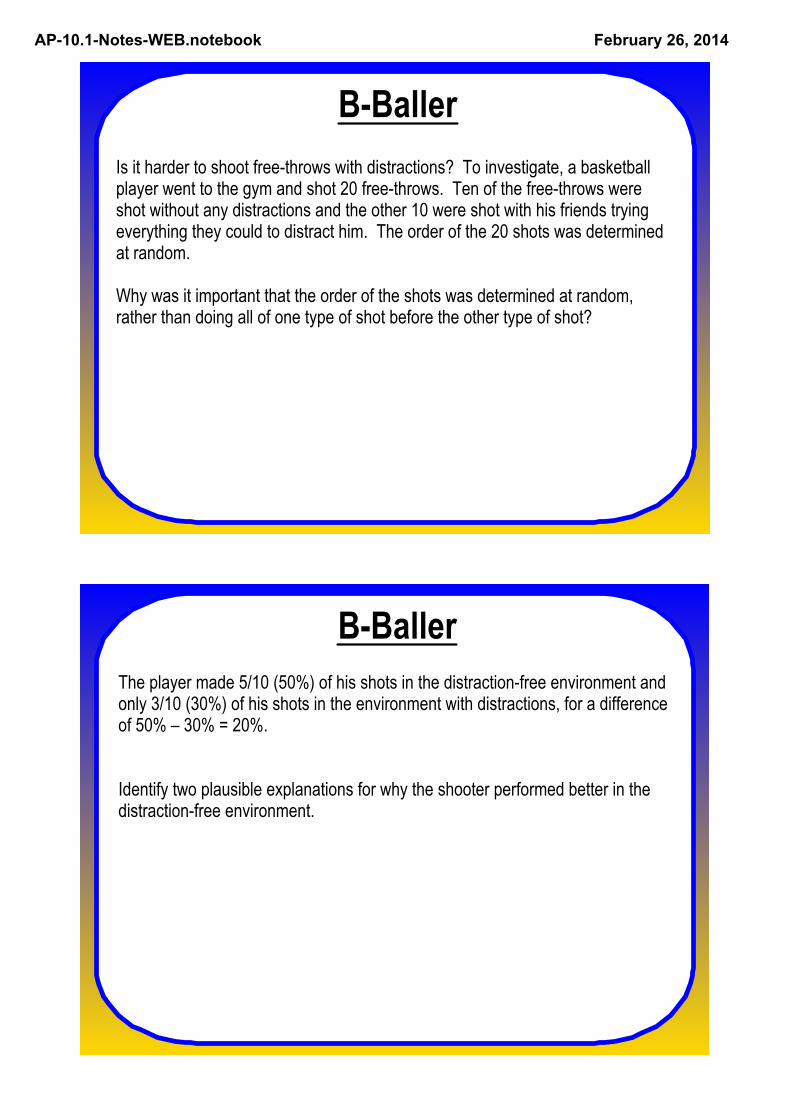
BBallerIs it harder to shoot freethrows with distractions? To investigate, a basketball player went to the gym and shot 20 freethrows. Ten of the freethrows were shot without any distractions and the other 10 were shot with his friends trying everything they could to distract him. The order of the 20 shots was determined at random.
Why was it important that the order of the shots was determined at random, rather than doing all of one type of shot before the other type of shot?
BBallerThe player made 5/10 (50%) of his shots in the distractionfree environment and only 3/10 (30%) of his shots in the environment with distractions, for a difference of 50% – 30% = 20%.
Identify two plausible explanations for why the shooter performed better in the distractionfree environment.
AP10.1NotesWEB.notebook February 26, 2014
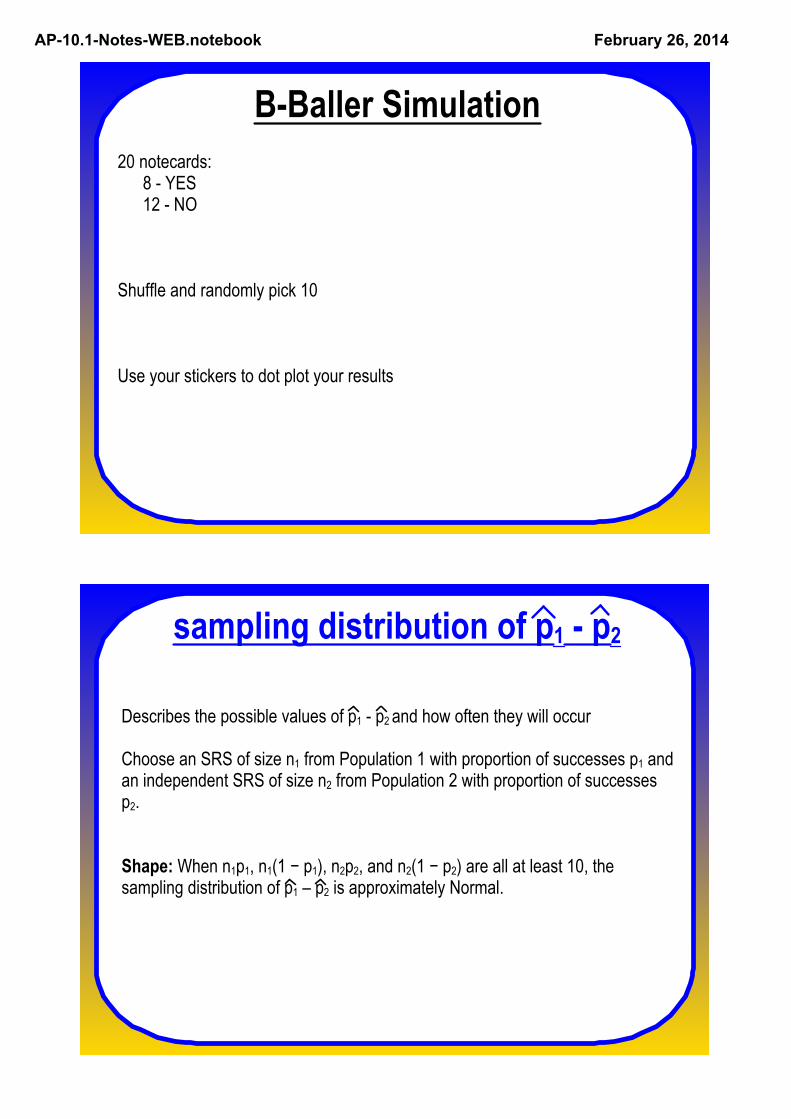
BBaller Simulation20 notecards:
8 YES12 NO
Shuffle and randomly pick 10
Use your stickers to dot plot your results
sampling distribution of p1 p2
Describes the possible values of p1 p2 and how often they will occur
Choose an SRS of size n1 from Population 1 with proportion of successes p1 and an independent SRS of size n2 from Population 2 with proportion of successes p2.
Shape: When n1p1, n1(1 − p1), n2p2, and n2(1 − p2) are all at least 10, the sampling distribution of p1 – p2 is approximately Normal.

AP10.1NotesWEB.notebook February 26, 2014
sampling distribution of p1 p2
Center: The mean of the sampling distribution is p1 − p2. That is, the difference in sample proportions is an unbiased estimator of the difference in population proportions.
Spread: The standard deviation of the sampling distribution of p1 – p2 is
as long as the 10% condition is met.
The snack that smiles back :)Your teacher brings two bags of colored goldfish crackers to class. She tells you that Bag 1 has 25% red crackers and Bag 2 has 35% red crackers. Each bag contains more than 500 crackers. Using a paper cup, your teacher takes an SRS of 50 crackers from Bag 1 and a separate SRS of 40 crackers from Bag 2. Let p1 − p2 be the difference in the sample proportions of red crackers.
(a) What is the shape of the sampling distribution of p1 − p2? Why?
(b) Find the mean and standard deviation of the sampling distribution. Show your work.
(c) Find the probability that p1 − p2 is less than or equal to −0.02. Show your work.
(d) Based on your answer to c, would you be surprised if the difference in the proportion of red crackers in the two samples was p1 − p2 = −0.02?
AP10.1NotesWEB.notebook February 26, 2014
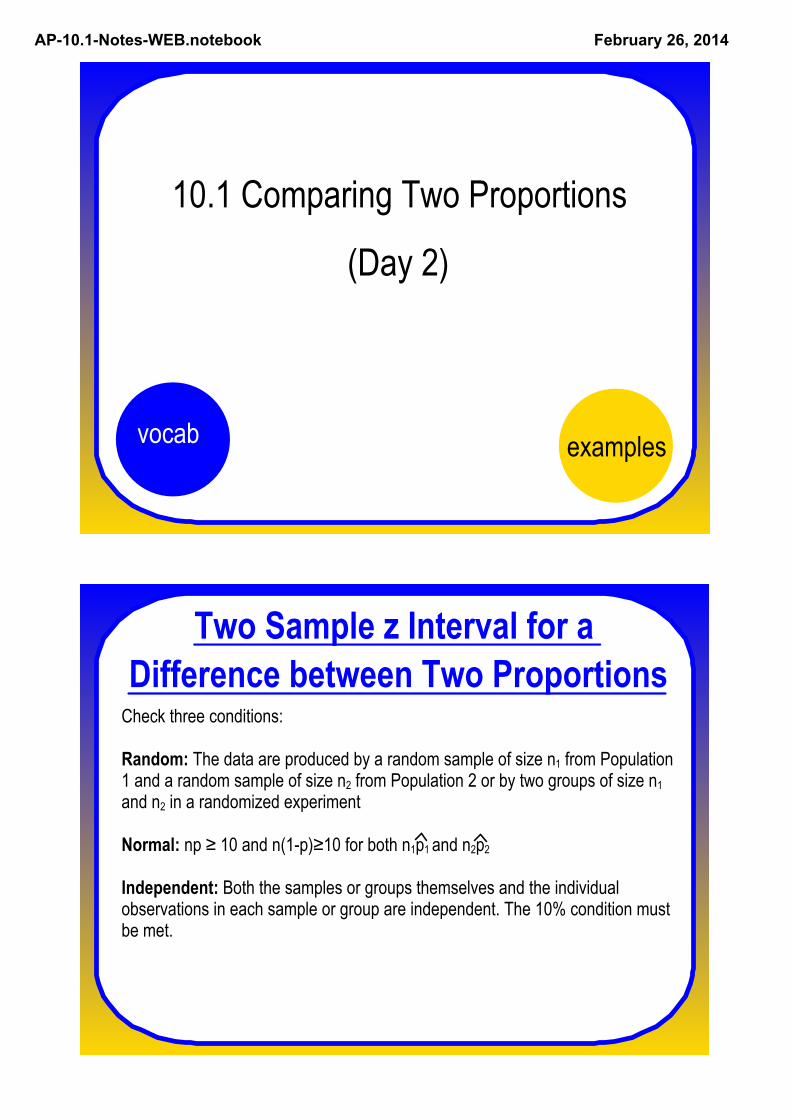
10.1 Comparing Two Proportions
(Day 2)
vocab examples
Two Sample z Interval for a Difference between Two ProportionsCheck three conditions:
Random: The data are produced by a random sample of size n1 from Population 1 and a random sample of size n2 from Population 2 or by two groups of size n1 and n2 in a randomized experiment
Normal: np ≥ 10 and n(1p)≥10 for both n1p1 and n2p2
Independent: Both the samples or groups themselves and the individual observations in each sample or group are independent. The 10% condition must be met.
AP10.1NotesWEB.notebook February 26, 2014
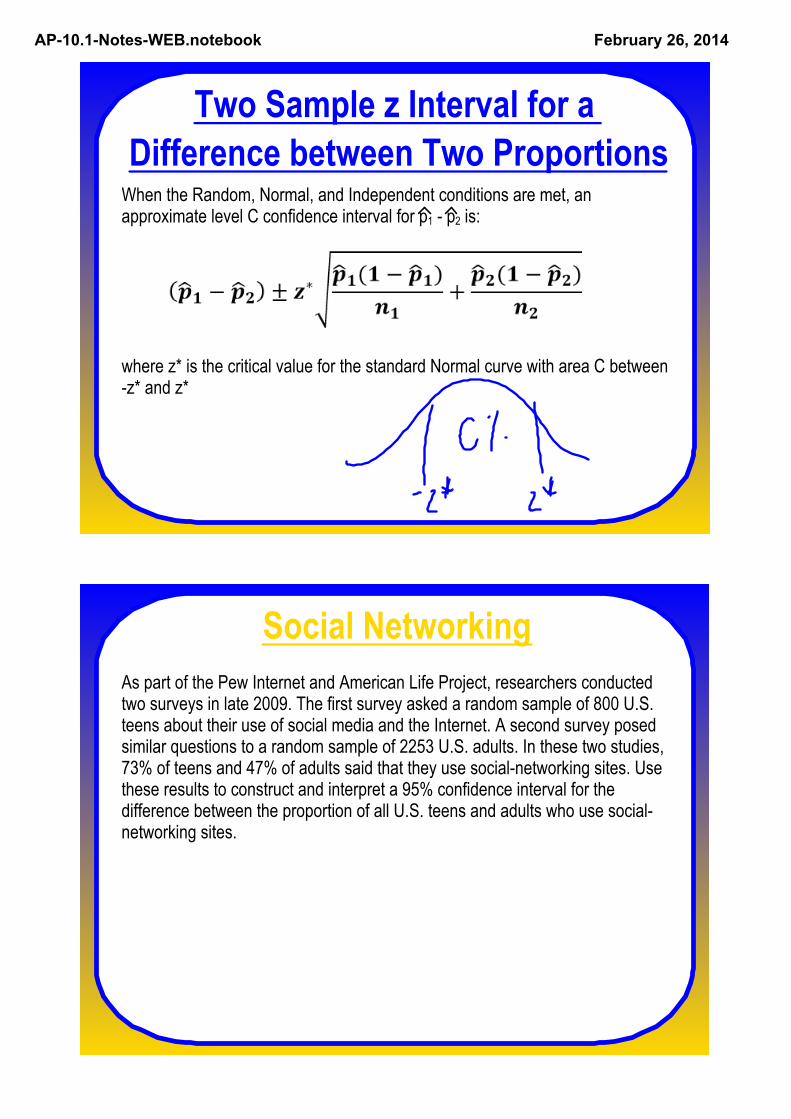
Two Sample z Interval for a Difference between Two ProportionsWhen the Random, Normal, and Independent conditions are met, an approximate level C confidence interval for p1 p2 is:
where z* is the critical value for the standard Normal curve with area C between z* and z*
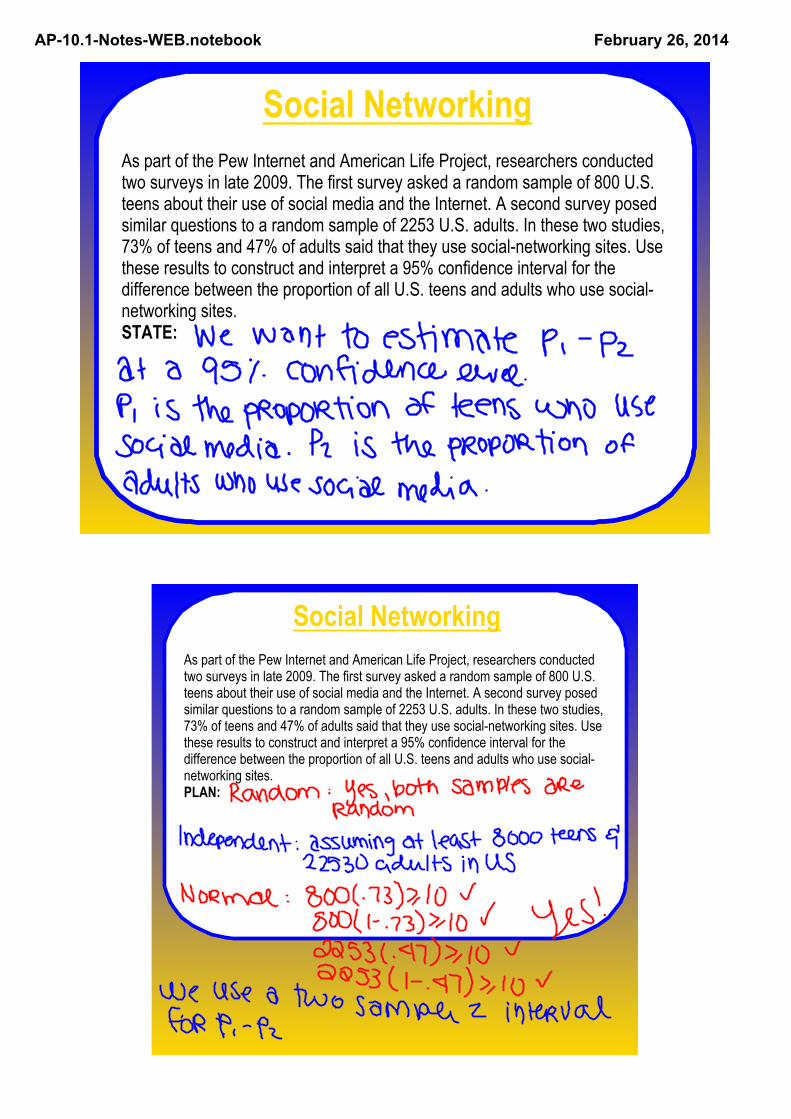
Social NetworkingAs part of the Pew Internet and American Life Project, researchers conducted two surveys in late 2009. The first survey asked a random sample of 800 U.S. teens about their use of social media and the Internet. A second survey posed similar questions to a random sample of 2253 U.S. adults. In these two studies, 73% of teens and 47% of adults said that they use socialnetworking sites. Use these results to construct and interpret a 95% confidence interval for the difference between the proportion of all U.S. teens and adults who use socialnetworking sites.
AP10.1NotesWEB.notebook February 26, 2014
Social NetworkingAs part of the Pew Internet and American Life Project, researchers conducted two surveys in late 2009. The first survey asked a random sample of 800 U.S. teens about their use of social media and the Internet. A second survey posed similar questions to a random sample of 2253 U.S. adults. In these two studies, 73% of teens and 47% of adults said that they use socialnetworking sites. Use these results to construct and interpret a 95% confidence interval for the difference between the proportion of all U.S. teens and adults who use socialnetworking sites.STATE:
Social NetworkingAs part of the Pew Internet and American Life Project, researchers conducted two surveys in late 2009. The first survey asked a random sample of 800 U.S. teens about their use of social media and the Internet. A second survey posed similar questions to a random sample of 2253 U.S. adults. In these two studies, 73% of teens and 47% of adults said that they use socialnetworking sites. Use these results to construct and interpret a 95% confidence interval for the difference between the proportion of all U.S. teens and adults who use socialnetworking sites.PLAN:
AP10.1NotesWEB.notebook February 26, 2014
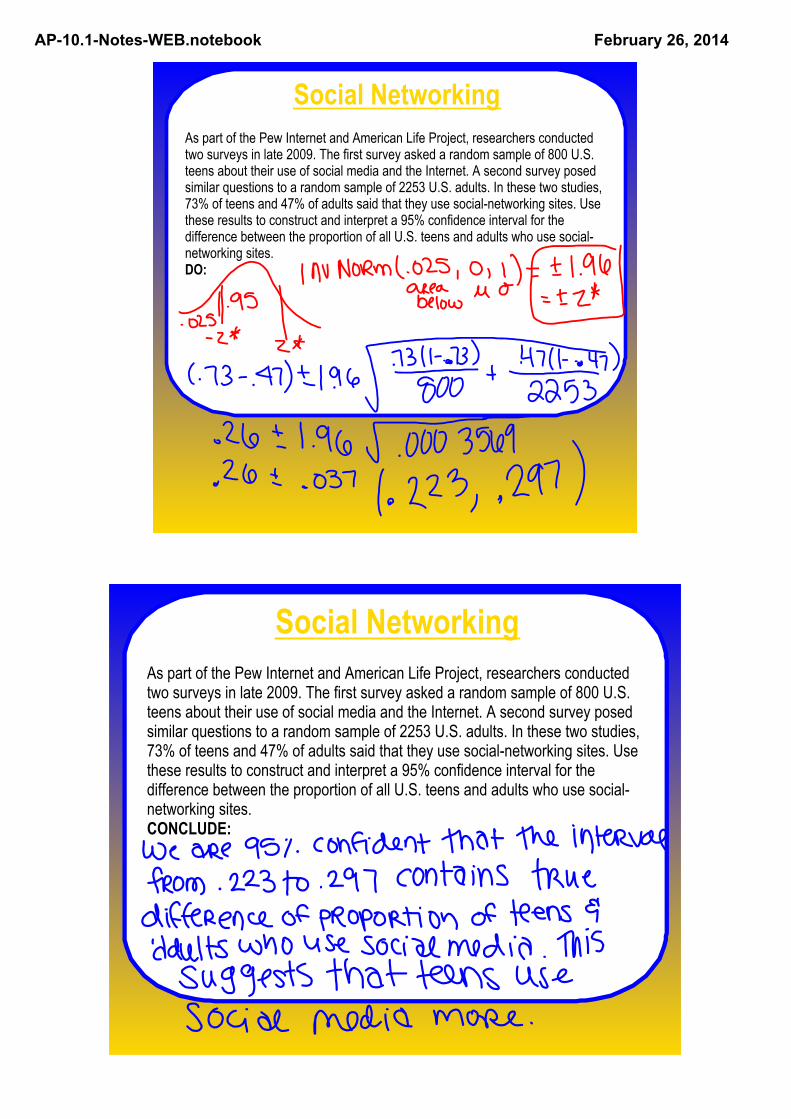
Social NetworkingAs part of the Pew Internet and American Life Project, researchers conducted two surveys in late 2009. The first survey asked a random sample of 800 U.S. teens about their use of social media and the Internet. A second survey posed similar questions to a random sample of 2253 U.S. adults. In these two studies, 73% of teens and 47% of adults said that they use socialnetworking sites. Use these results to construct and interpret a 95% confidence interval for the difference between the proportion of all U.S. teens and adults who use socialnetworking sites.DO:
Social NetworkingAs part of the Pew Internet and American Life Project, researchers conducted two surveys in late 2009. The first survey asked a random sample of 800 U.S. teens about their use of social media and the Internet. A second survey posed similar questions to a random sample of 2253 U.S. adults. In these two studies, 73% of teens and 47% of adults said that they use socialnetworking sites. Use these results to construct and interpret a 95% confidence interval for the difference between the proportion of all U.S. teens and adults who use socialnetworking sites.CONCLUDE:
AP10.1NotesWEB.notebook February 26, 2014
On the calculator...
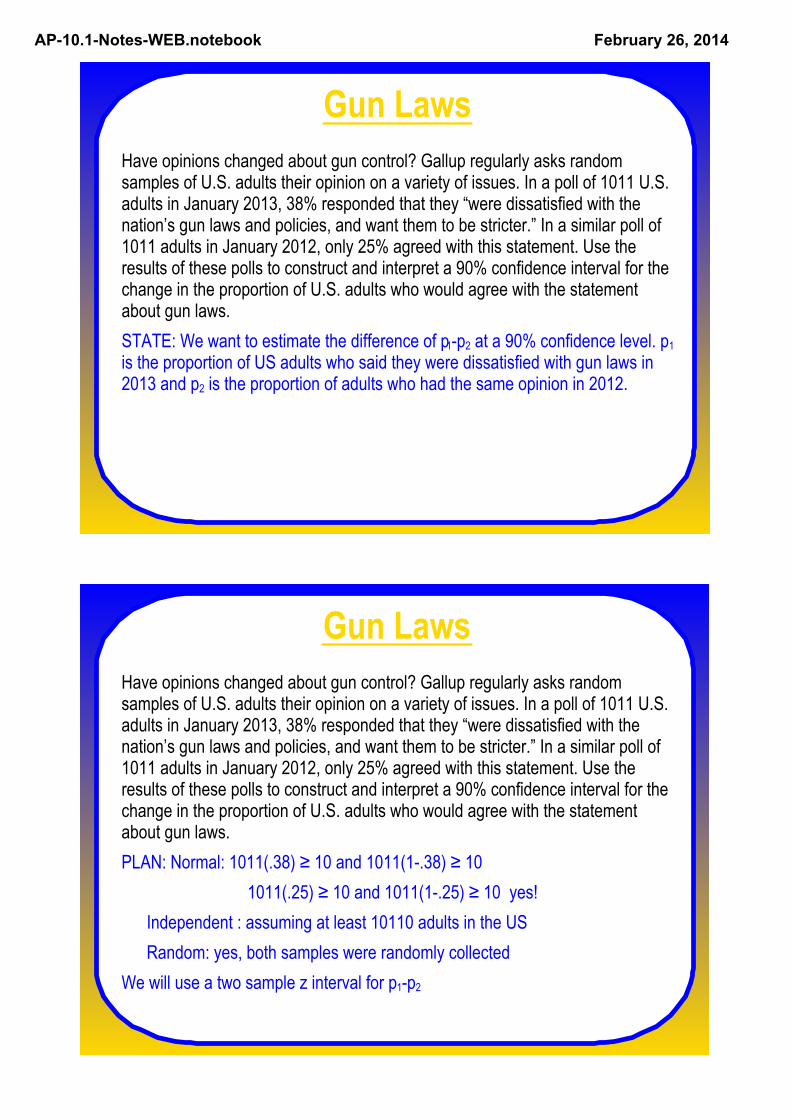
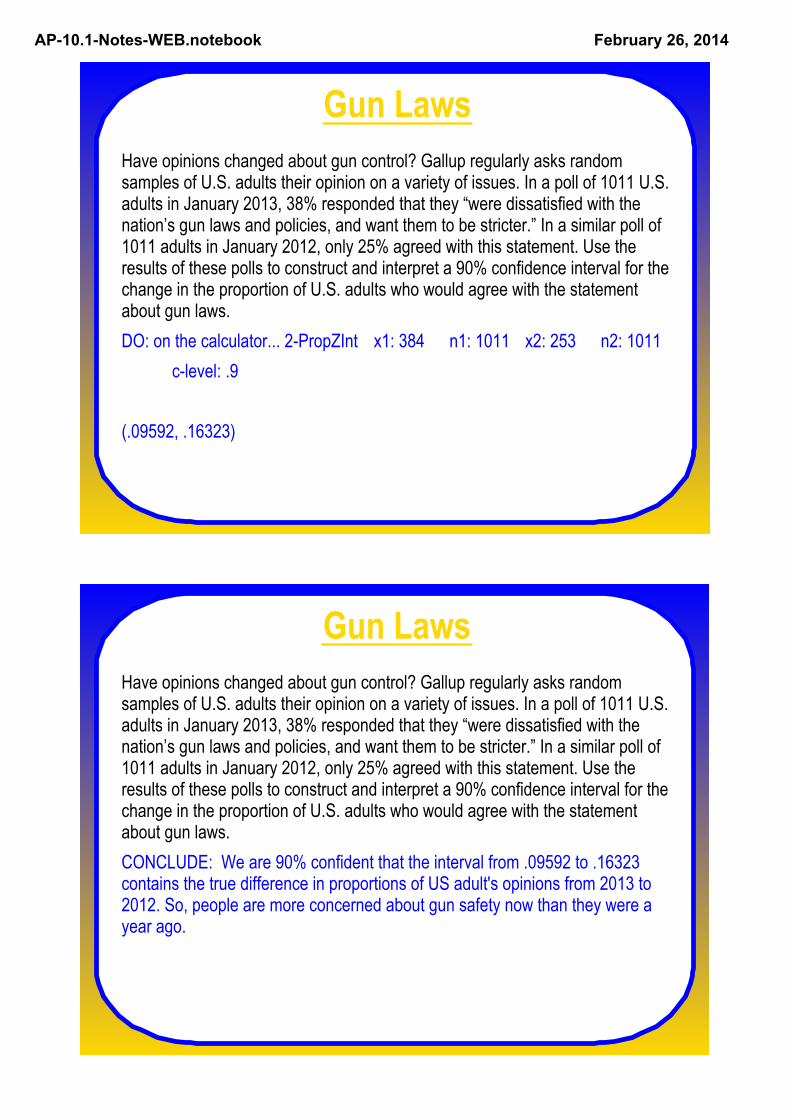
Gun LawsHave opinions changed about gun control? Gallup regularly asks random samples of U.S. adults their opinion on a variety of issues. In a poll of 1011 U.S. adults in January 2013, 38% responded that they “were dissatisfied with the nation’s gun laws and policies, and want them to be stricter.” In a similar poll of 1011 adults in January 2012, only 25% agreed with this statement. Use the results of these polls to construct and interpret a 90% confidence interval for the change in the proportion of U.S. adults who would agree with the statement about gun laws.
AP10.1NotesWEB.notebook February 26, 2014
Gun LawsHave opinions changed about gun control? Gallup regularly asks random samples of U.S. adults their opinion on a variety of issues. In a poll of 1011 U.S. adults in January 2013, 38% responded that they “were dissatisfied with the nation’s gun laws and policies, and want them to be stricter.” In a similar poll of 1011 adults in January 2012, only 25% agreed with this statement. Use the results of these polls to construct and interpret a 90% confidence interval for the change in the proportion of U.S. adults who would agree with the statement about gun laws. STATE: We want to estimate the difference of p1p2 at a 90% confidence level. p1 is the proportion of US adults who said they were dissatisfied with gun laws in 2013 and p2 is the proportion of adults who had the same opinion in 2012.
Gun LawsHave opinions changed about gun control? Gallup regularly asks random samples of U.S. adults their opinion on a variety of issues. In a poll of 1011 U.S. adults in January 2013, 38% responded that they “were dissatisfied with the nation’s gun laws and policies, and want them to be stricter.” In a similar poll of 1011 adults in January 2012, only 25% agreed with this statement. Use the results of these polls to construct and interpret a 90% confidence interval for the change in the proportion of U.S. adults who would agree with the statement about gun laws. PLAN: Normal: 1011(.38) ≥ 10 and 1011(1.38) ≥ 10
1011(.25) ≥ 10 and 1011(1.25) ≥ 10 yes!Independent : assuming at least 10110 adults in the USRandom: yes, both samples were randomly collected
We will use a two sample z interval for p1p2
AP10.1NotesWEB.notebook February 26, 2014
Gun LawsHave opinions changed about gun control? Gallup regularly asks random samples of U.S. adults their opinion on a variety of issues. In a poll of 1011 U.S. adults in January 2013, 38% responded that they “were dissatisfied with the nation’s gun laws and policies, and want them to be stricter.” In a similar poll of 1011 adults in January 2012, only 25% agreed with this statement. Use the results of these polls to construct and interpret a 90% confidence interval for the change in the proportion of U.S. adults who would agree with the statement about gun laws. DO: on the calculator... 2PropZInt x1: 384 n1: 1011 x2: 253 n2: 1011
clevel: .9
(.09592, .16323)
Gun LawsHave opinions changed about gun control? Gallup regularly asks random samples of U.S. adults their opinion on a variety of issues. In a poll of 1011 U.S. adults in January 2013, 38% responded that they “were dissatisfied with the nation’s gun laws and policies, and want them to be stricter.” In a similar poll of 1011 adults in January 2012, only 25% agreed with this statement. Use the results of these polls to construct and interpret a 90% confidence interval for the change in the proportion of U.S. adults who would agree with the statement about gun laws. CONCLUDE: We are 90% confident that the interval from .09592 to .16323 contains the true difference in proportions of US adult's opinions from 2013 to 2012. So, people are more concerned about gun safety now than they were a year ago.
AP10.1NotesWEB.notebook February 26, 2014
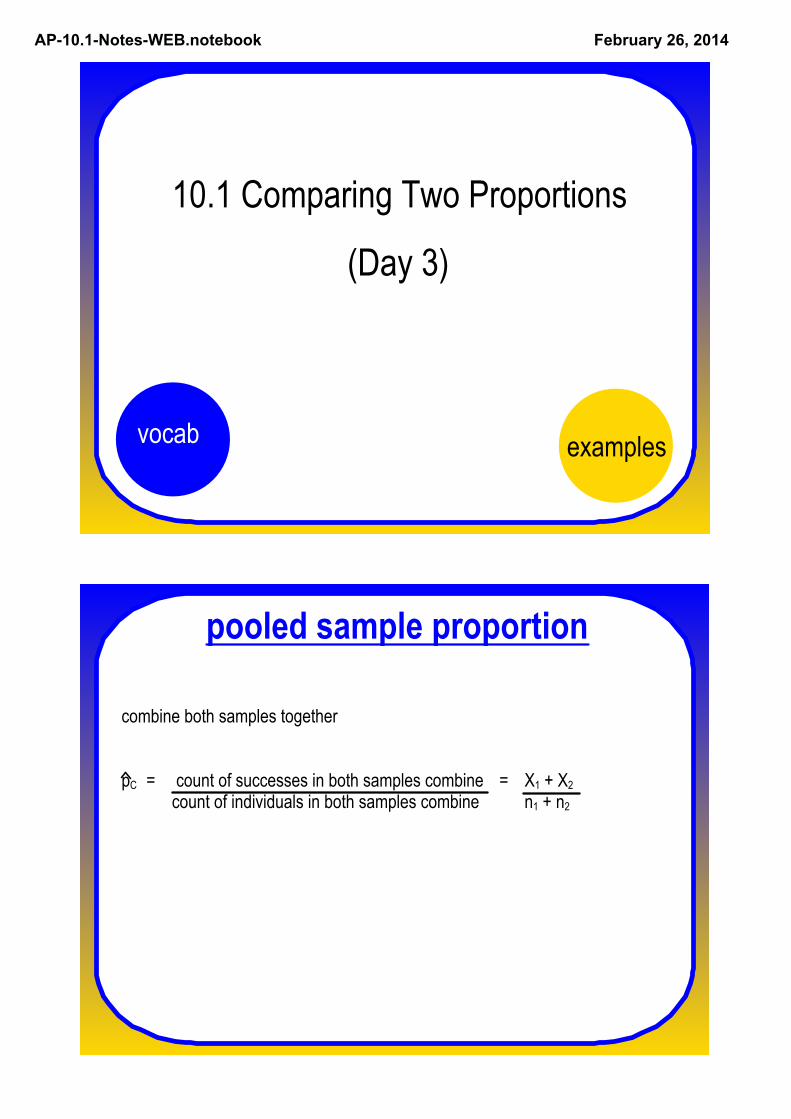
10.1 Comparing Two Proportions
(Day 3)
vocab examples
pooled sample proportion
combine both samples together
pC = count of successes in both samples combine = X1 + X2 count of individuals in both samples combine n1 + n2
AP10.1NotesWEB.notebook February 26, 2014
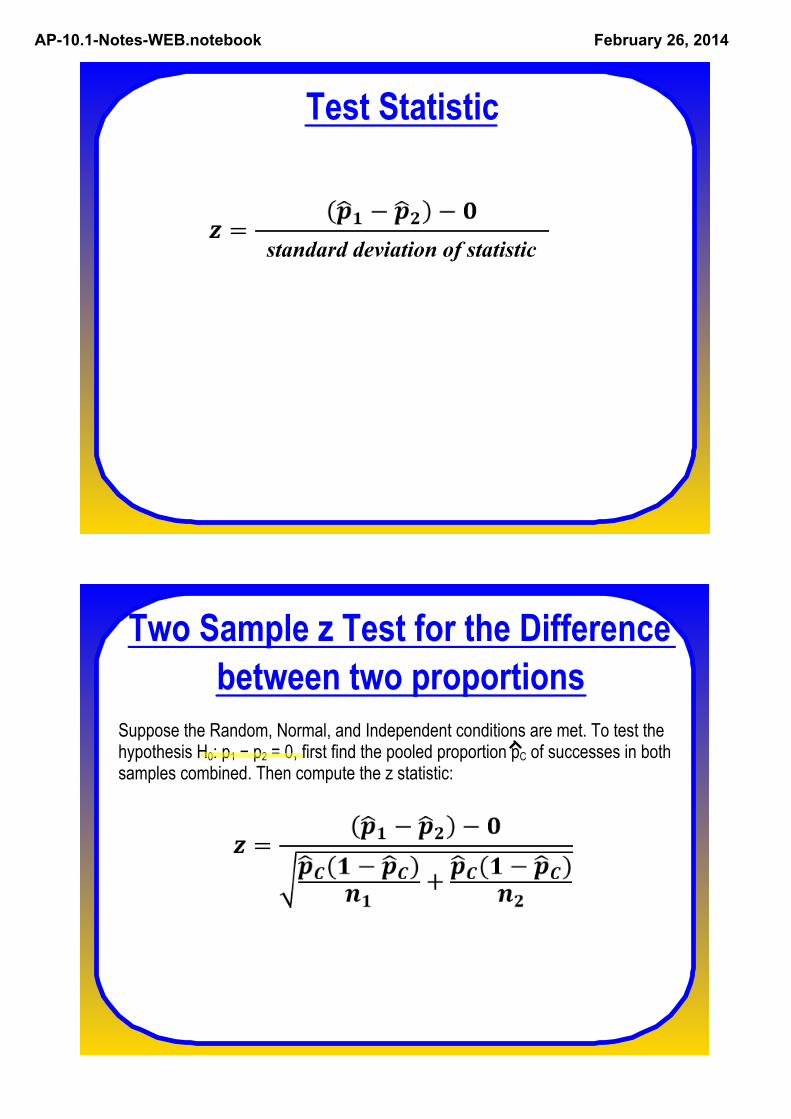
Test Statistic
standard deviation of statistic
Two Sample z Test for the Difference between two proportions
Suppose the Random, Normal, and Independent conditions are met. To test the hypothesis H0: p1 − p2 = 0, first find the pooled proportion pC of successes in both samples combined. Then compute the z statistic:
AP10.1NotesWEB.notebook February 26, 2014
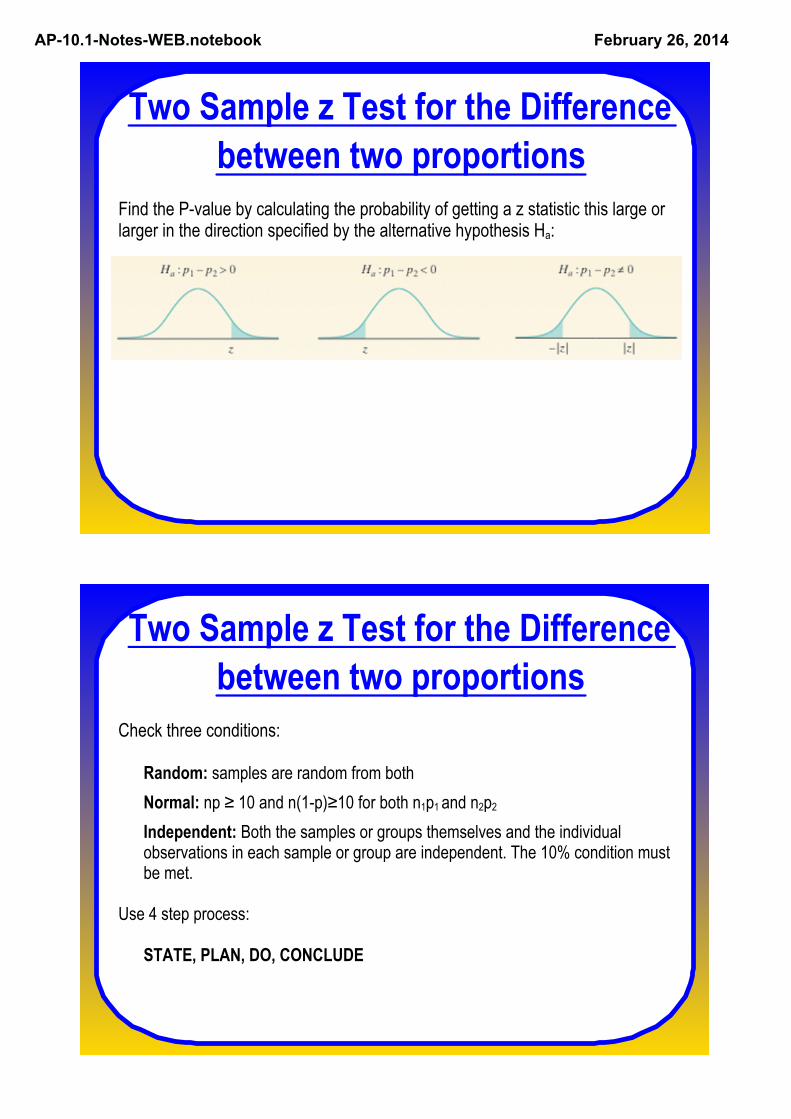
Two Sample z Test for the Difference between two proportions
Find the Pvalue by calculating the probability of getting a z statistic this large or larger in the direction specified by the alternative hypothesis Ha:
Two Sample z Test for the Difference between two proportions
Check three conditions:
Random: samples are random from bothNormal: np ≥ 10 and n(1p)≥10 for both n1p1 and n2p2Independent: Both the samples or groups themselves and the individual observations in each sample or group are independent. The 10% condition must be met.
Use 4 step process:
STATE, PLAN, DO, CONCLUDE
AP10.1NotesWEB.notebook February 26, 2014
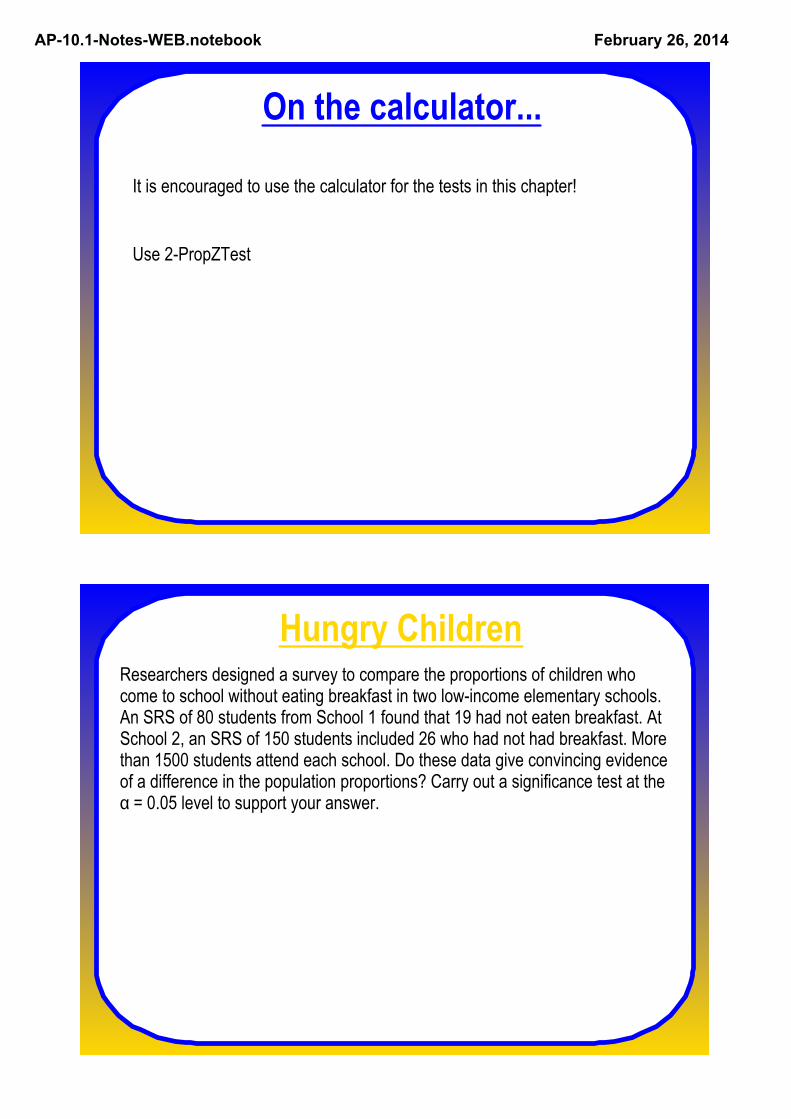
On the calculator...
It is encouraged to use the calculator for the tests in this chapter!
Use 2PropZTest
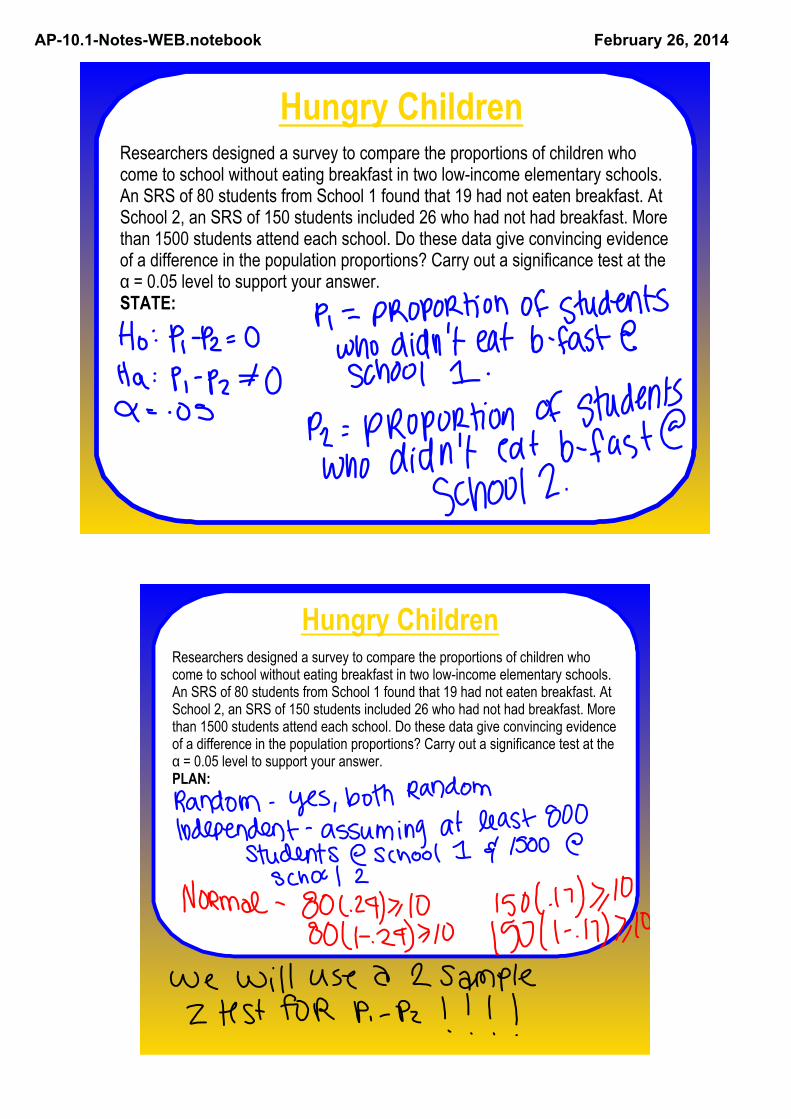
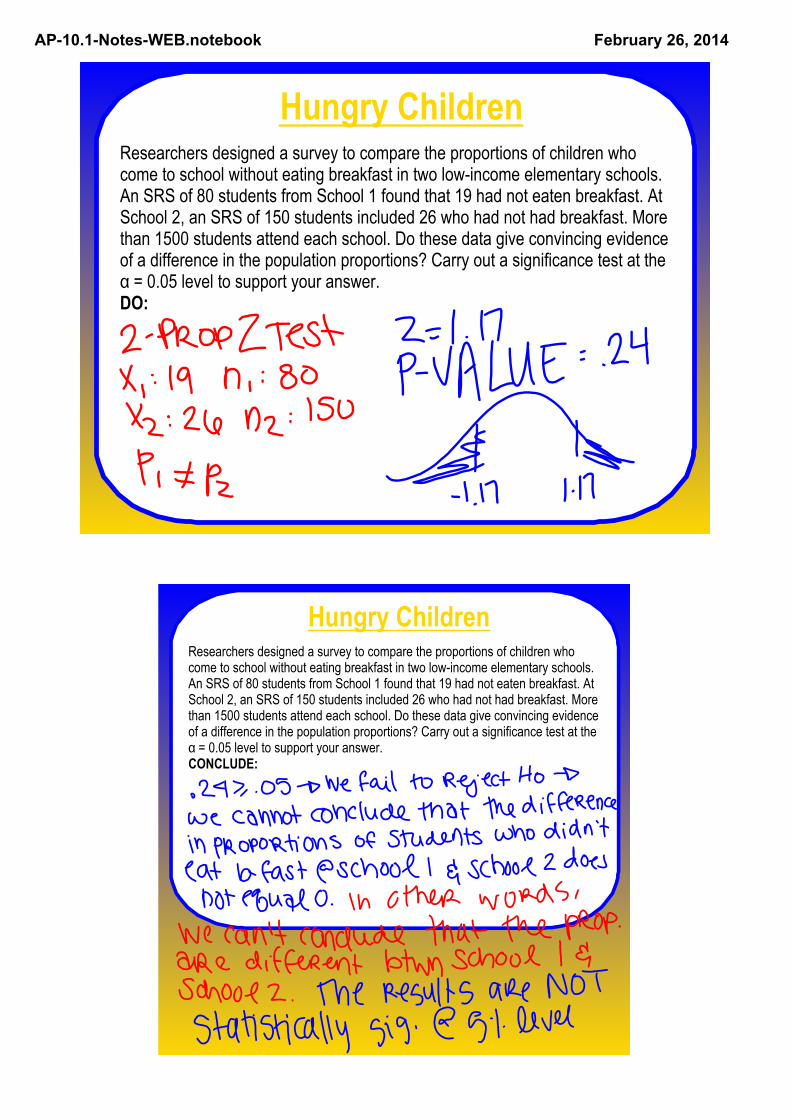
Hungry ChildrenResearchers designed a survey to compare the proportions of children who come to school without eating breakfast in two lowincome elementary schools. An SRS of 80 students from School 1 found that 19 had not eaten breakfast. At School 2, an SRS of 150 students included 26 who had not had breakfast. More than 1500 students attend each school. Do these data give convincing evidence of a difference in the population proportions? Carry out a significance test at the α = 0.05 level to support your answer.
AP10.1NotesWEB.notebook February 26, 2014
Hungry ChildrenResearchers designed a survey to compare the proportions of children who come to school without eating breakfast in two lowincome elementary schools. An SRS of 80 students from School 1 found that 19 had not eaten breakfast. At School 2, an SRS of 150 students included 26 who had not had breakfast. More than 1500 students attend each school. Do these data give convincing evidence of a difference in the population proportions? Carry out a significance test at the α = 0.05 level to support your answer.STATE:
Hungry ChildrenResearchers designed a survey to compare the proportions of children who come to school without eating breakfast in two lowincome elementary schools. An SRS of 80 students from School 1 found that 19 had not eaten breakfast. At School 2, an SRS of 150 students included 26 who had not had breakfast. More than 1500 students attend each school. Do these data give convincing evidence of a difference in the population proportions? Carry out a significance test at the α = 0.05 level to support your answer.PLAN:
AP10.1NotesWEB.notebook February 26, 2014
Hungry ChildrenResearchers designed a survey to compare the proportions of children who come to school without eating breakfast in two lowincome elementary schools. An SRS of 80 students from School 1 found that 19 had not eaten breakfast. At School 2, an SRS of 150 students included 26 who had not had breakfast. More than 1500 students attend each school. Do these data give convincing evidence of a difference in the population proportions? Carry out a significance test at the α = 0.05 level to support your answer.DO:
Hungry ChildrenResearchers designed a survey to compare the proportions of children who come to school without eating breakfast in two lowincome elementary schools. An SRS of 80 students from School 1 found that 19 had not eaten breakfast. At School 2, an SRS of 150 students included 26 who had not had breakfast. More than 1500 students attend each school. Do these data give convincing evidence of a difference in the population proportions? Carry out a significance test at the α = 0.05 level to support your answer.CONCLUDE:
AP10.1NotesWEB.notebook February 26, 2014
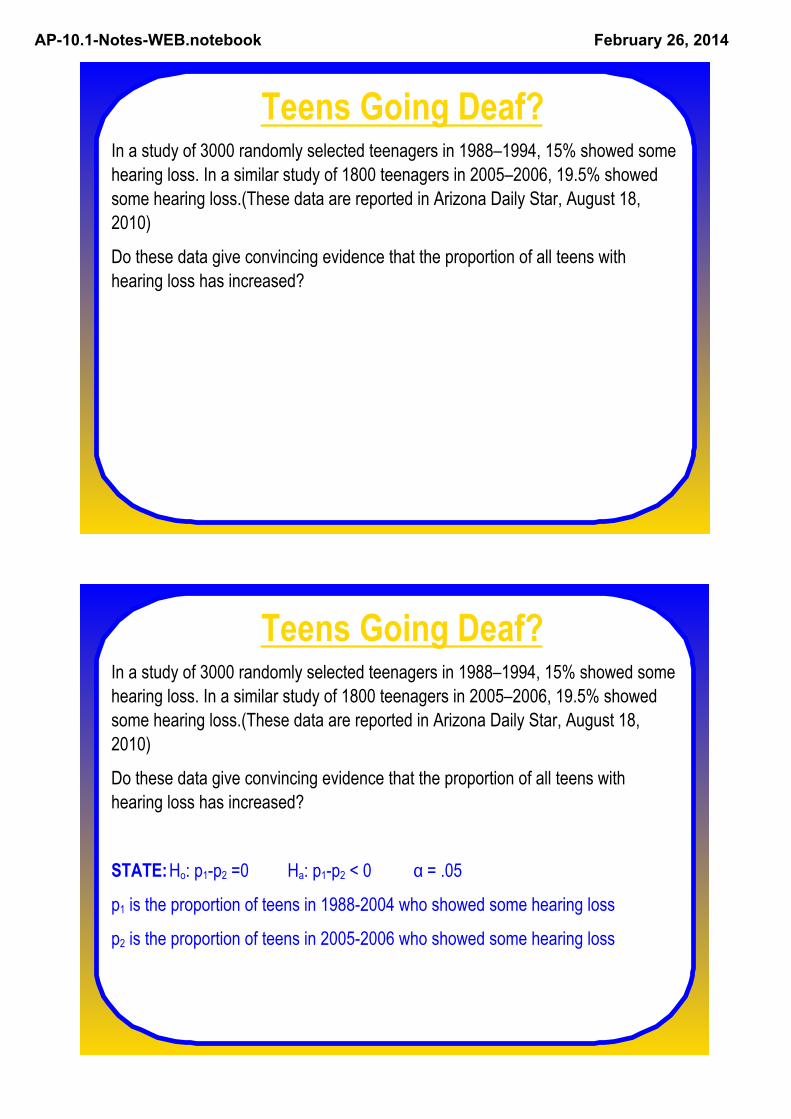
Teens Going Deaf?In a study of 3000 randomly selected teenagers in 1988–1994, 15% showed some hearing loss. In a similar study of 1800 teenagers in 2005–2006, 19.5% showed some hearing loss.(These data are reported in Arizona Daily Star, August 18, 2010)
Do these data give convincing evidence that the proportion of all teens with hearing loss has increased?
STATE: Ho: p1p2 =0 Ha: p1p2 < 0 α = .05
p1 is the proportion of teens in 19882004 who showed some hearing loss
p2 is the proportion of teens in 20052006 who showed some hearing loss
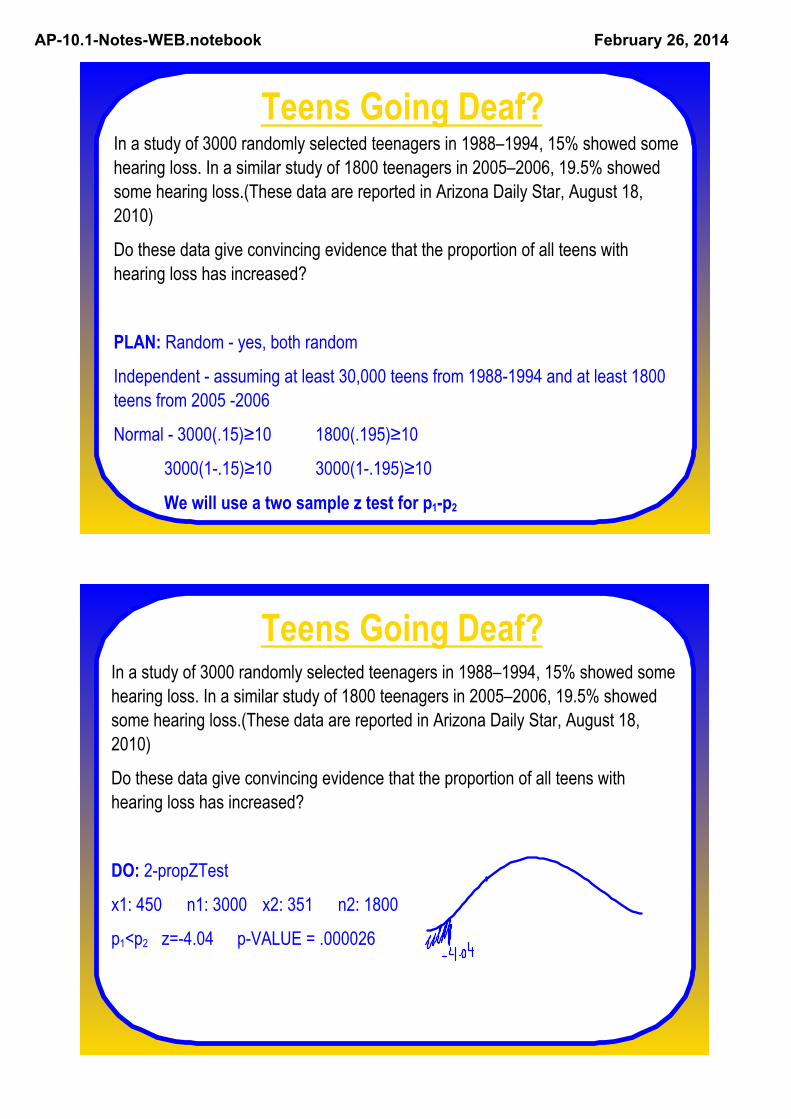
AP10.1NotesWEB.notebook February 26, 2014
Teens Going Deaf?In a study of 3000 randomly selected teenagers in 1988–1994, 15% showed some hearing loss. In a similar study of 1800 teenagers in 2005–2006, 19.5% showed some hearing loss.(These data are reported in Arizona Daily Star, August 18, 2010)
Do these data give convincing evidence that the proportion of all teens with hearing loss has increased?
PLAN: Random yes, both random
Independent assuming at least 30,000 teens from 19881994 and at least 1800 teens from 2005 2006
Normal 3000(.15)≥10 1800(.195)≥10
3000(1.15)≥10 3000(1.195)≥10
We will use a two sample z test for p1p2
Teens Going Deaf?In a study of 3000 randomly selected teenagers in 1988–1994, 15% showed some hearing loss. In a similar study of 1800 teenagers in 2005–2006, 19.5% showed some hearing loss.(These data are reported in Arizona Daily Star, August 18, 2010)
Do these data give convincing evidence that the proportion of all teens with hearing loss has increased?
DO: 2propZTest
x1: 450 n1: 3000 x2: 351 n2: 1800
p1<p2 z=4.04 pVALUE = .000026
AP10.1NotesWEB.notebook February 26, 2014
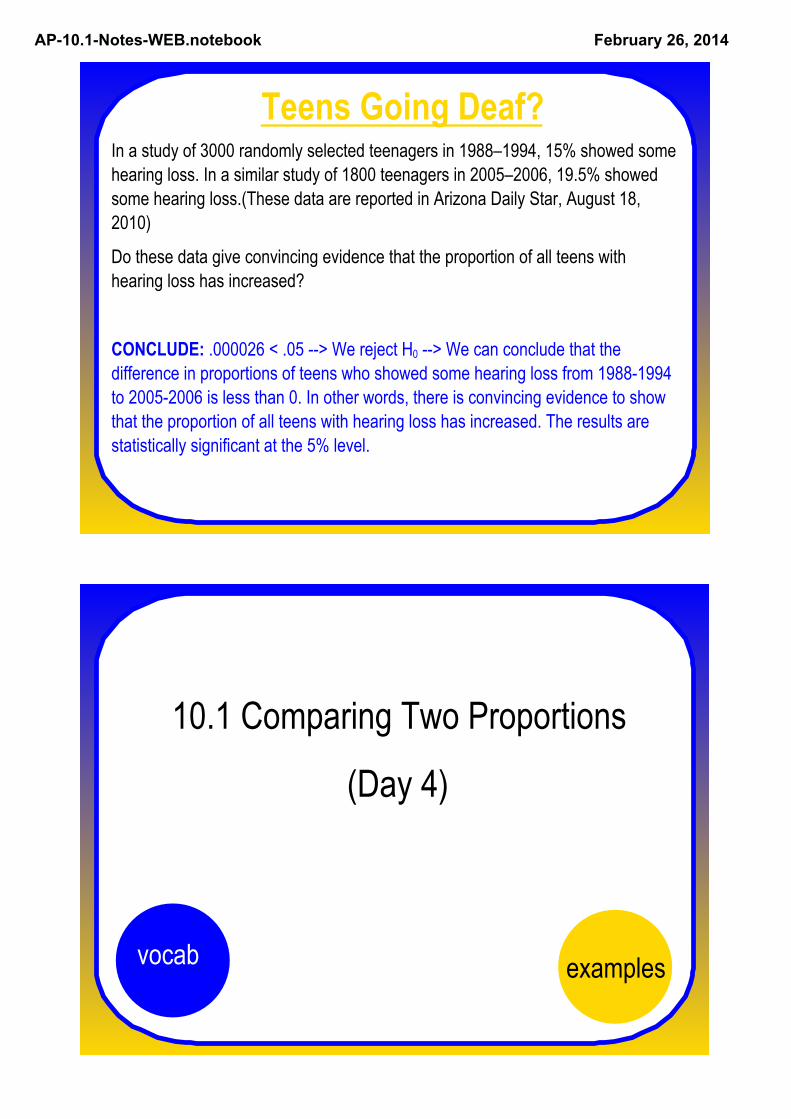
Teens Going Deaf?In a study of 3000 randomly selected teenagers in 1988–1994, 15% showed some hearing loss. In a similar study of 1800 teenagers in 2005–2006, 19.5% showed some hearing loss.(These data are reported in Arizona Daily Star, August 18, 2010)
Do these data give convincing evidence that the proportion of all teens with hearing loss has increased?
CONCLUDE: .000026 < .05 > We reject H0 > We can conclude that the difference in proportions of teens who showed some hearing loss from 19881994 to 20052006 is less than 0. In other words, there is convincing evidence to show that the proportion of all teens with hearing loss has increased. The results are statistically significant at the 5% level.
10.1 Comparing Two Proportions
(Day 4)
vocab examples
AP10.1NotesWEB.notebook February 26, 2014
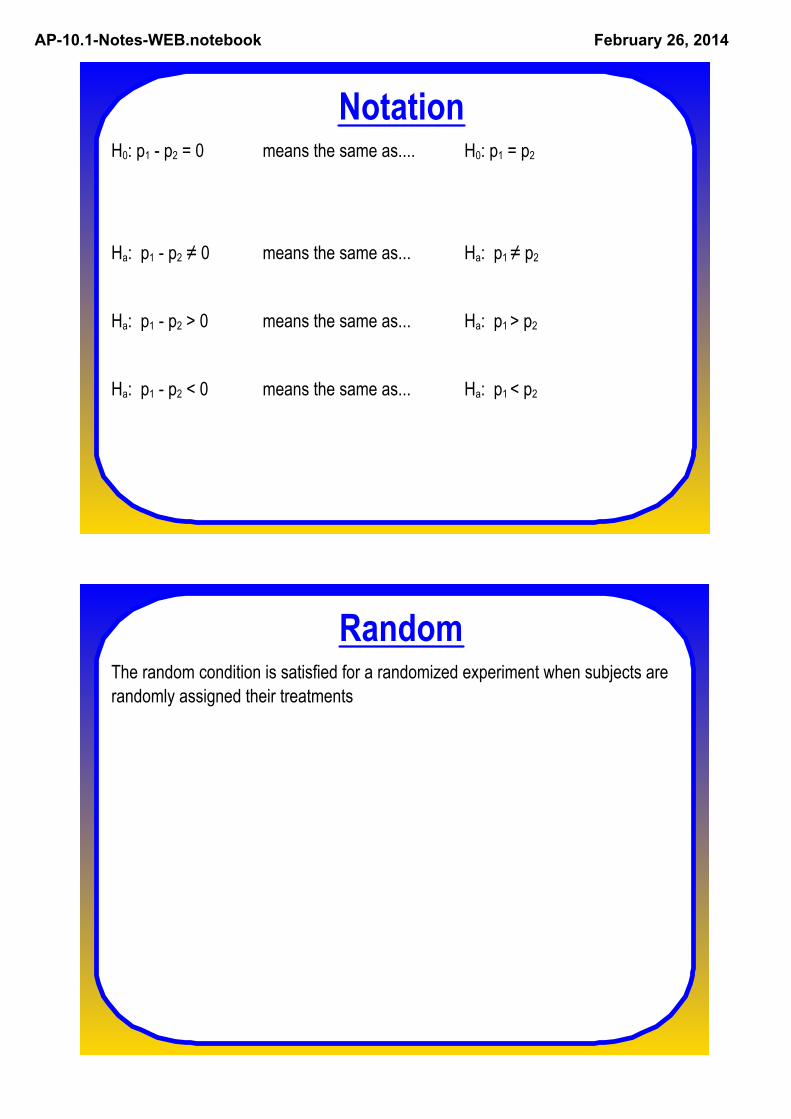
NotationH0: p1 p2 = 0 means the same as.... H0: p1 = p2
Ha: p1 p2 ≠ 0 means the same as... Ha: p1 ≠ p2
Ha: p1 p2 > 0 means the same as... Ha: p1 > p2
Ha: p1 p2 < 0 means the same as... Ha: p1 < p2
RandomThe random condition is satisfied for a randomized experiment when subjects are randomly assigned their treatments
AP10.1NotesWEB.notebook February 26, 2014
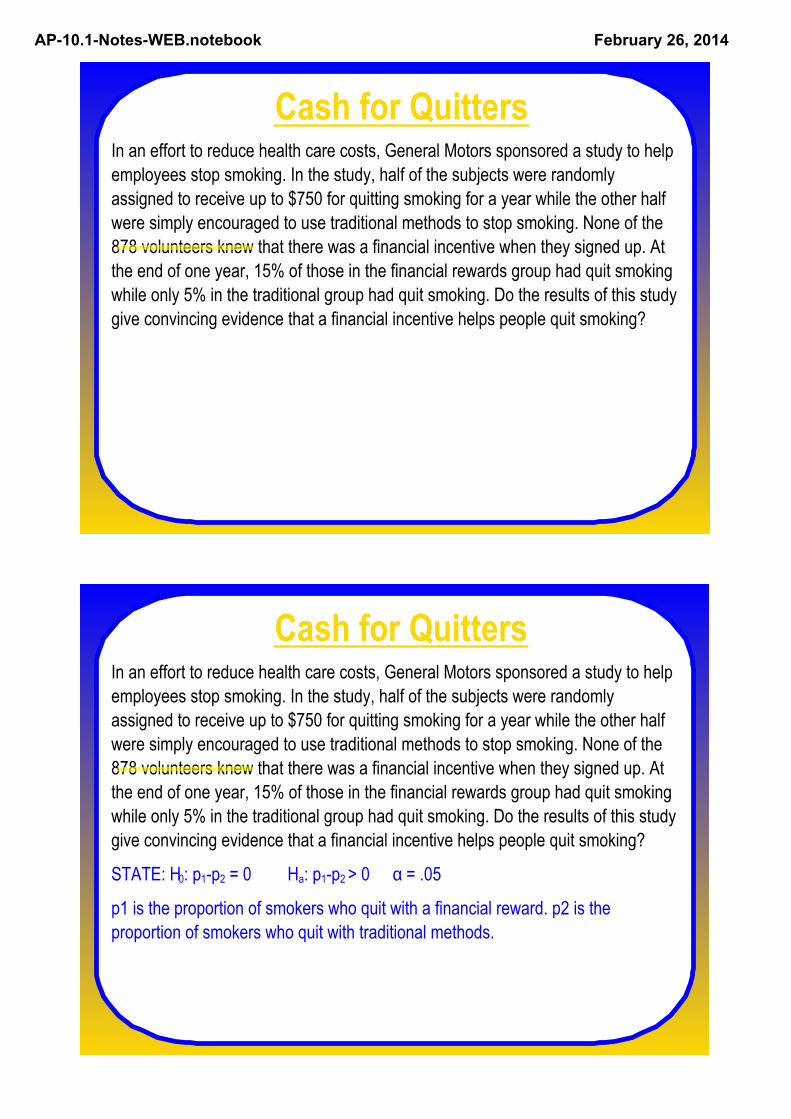
Cash for QuittersIn an effort to reduce health care costs, General Motors sponsored a study to help employees stop smoking. In the study, half of the subjects were randomly assigned to receive up to $750 for quitting smoking for a year while the other half were simply encouraged to use traditional methods to stop smoking. None of the 878 volunteers knew that there was a financial incentive when they signed up. At the end of one year, 15% of those in the financial rewards group had quit smoking while only 5% in the traditional group had quit smoking. Do the results of this study give convincing evidence that a financial incentive helps people quit smoking?
Cash for QuittersIn an effort to reduce health care costs, General Motors sponsored a study to help employees stop smoking. In the study, half of the subjects were randomly assigned to receive up to $750 for quitting smoking for a year while the other half were simply encouraged to use traditional methods to stop smoking. None of the 878 volunteers knew that there was a financial incentive when they signed up. At the end of one year, 15% of those in the financial rewards group had quit smoking while only 5% in the traditional group had quit smoking. Do the results of this study give convincing evidence that a financial incentive helps people quit smoking?
STATE: H0: p1p2 = 0 Ha: p1p2 > 0 α = .05
p1 is the proportion of smokers who quit with a financial reward. p2 is the proportion of smokers who quit with traditional methods.
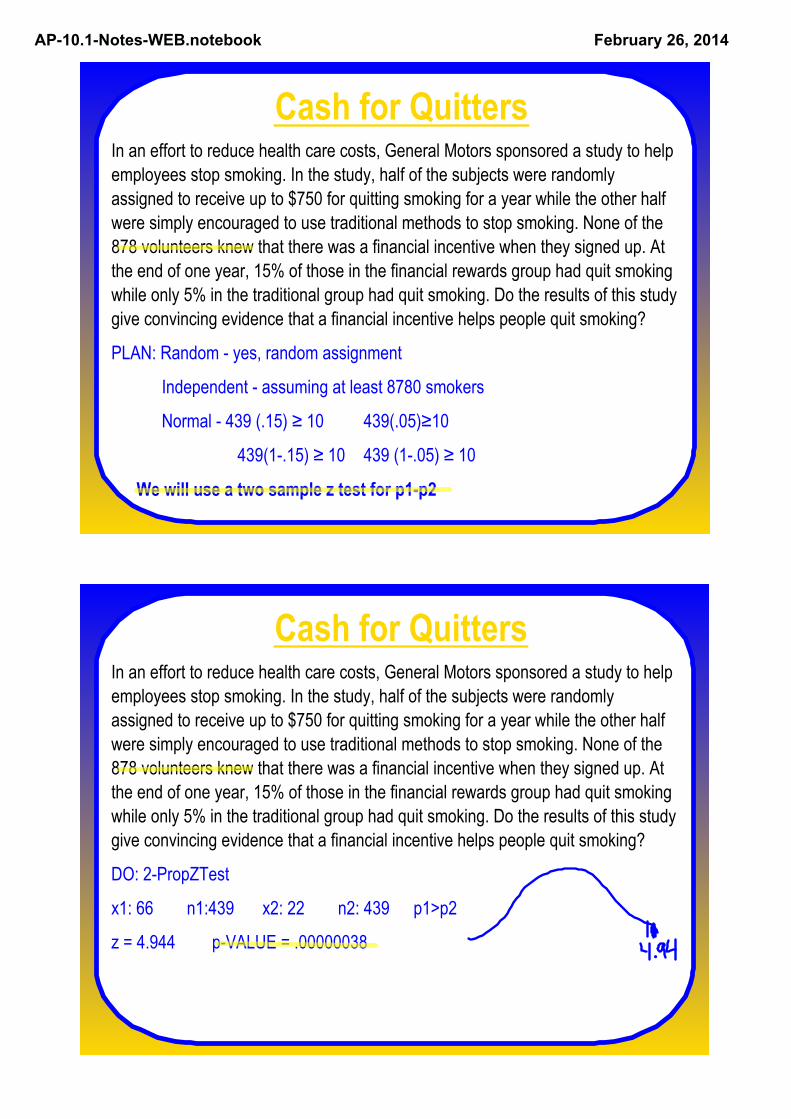
AP10.1NotesWEB.notebook February 26, 2014
Cash for QuittersIn an effort to reduce health care costs, General Motors sponsored a study to help employees stop smoking. In the study, half of the subjects were randomly assigned to receive up to $750 for quitting smoking for a year while the other half were simply encouraged to use traditional methods to stop smoking. None of the 878 volunteers knew that there was a financial incentive when they signed up. At the end of one year, 15% of those in the financial rewards group had quit smoking while only 5% in the traditional group had quit smoking. Do the results of this study give convincing evidence that a financial incentive helps people quit smoking?
PLAN: Random yes, random assignment
Independent assuming at least 8780 smokers
Normal 439 (.15) ≥ 10 439(.05)≥10
439(1.15) ≥ 10 439 (1.05) ≥ 10
We will use a two sample z test for p1p2
Cash for QuittersIn an effort to reduce health care costs, General Motors sponsored a study to help employees stop smoking. In the study, half of the subjects were randomly assigned to receive up to $750 for quitting smoking for a year while the other half were simply encouraged to use traditional methods to stop smoking. None of the 878 volunteers knew that there was a financial incentive when they signed up. At the end of one year, 15% of those in the financial rewards group had quit smoking while only 5% in the traditional group had quit smoking. Do the results of this study give convincing evidence that a financial incentive helps people quit smoking?
DO: 2PropZTest
x1: 66 n1:439 x2: 22 n2: 439 p1>p2
z = 4.944 pVALUE = .00000038

AP10.1NotesWEB.notebook February 26, 2014
Cash for QuittersIn an effort to reduce health care costs, General Motors sponsored a study to help employees stop smoking. In the study, half of the subjects were randomly assigned to receive up to $750 for quitting smoking for a year while the other half were simply encouraged to use traditional methods to stop smoking. None of the 878 volunteers knew that there was a financial incentive when they signed up. At the end of one year, 15% of those in the financial rewards group had quit smoking while only 5% in the traditional group had quit smoking. Do the results of this study give convincing evidence that a financial incentive helps people quit smoking?
Conclude: .00000038 < .05 > We reject the null hypothesis > We can conclude that the difference in proportions of those who quit smoking using money as an incentive and those who quit smoking traditionally is greater than 0. Therefore, there is convincing evidence that a financial incentive helps people quit. The results are statistically significant at the 5% level.